Effects of Taxing Sugar-Sweetened Beverage and Subsidizing Milk: Beverage Consumption, Nutrition, and Obesity among US Children Biing-Hwan Lin*, Travis A Smith, and Jonq-Ying Lee Lin is an Economist with the Economic Research Service, USDA, Smith is a PhD student at the University of Minnesota, and Lee is a Courtesy Professor at the University of Florida *Contact author, [email protected]2010 Selected Poster Paper prepared for presentation at the 1 st Joint EAAE/AAEA Seminar “The Economics of Food, Food Choice and Health” Freising, Germany, September 15 – 17, 2010 The views expressed in this study are those of the authors, and do not necessarily reflect those of the U.S. Department of Agriculture.
Transcript
Effects of Taxing Sugar-Sweetened Beverage and Subsidizing Milk: Beverage Consumption, Nutrition, and Obesity among US Children
Biing-Hwan Lin*, Travis A Smith, and Jonq-Ying Lee
Lin is an Economist with the Economic Research Service, USDA, Smith is a PhD student at the University of Minnesota, and Lee is a Courtesy Professor at the University of Florida
Parameters to be estimated are αi, φ1i, φ2i, υ1i, υ2i,, γij, and βi. Conditional expenditure (εi)
and uncompensated price (εij) elasticity estimates at sample means can be calculated as:
(2) εi = 1 + βi/wi and
(3) εij = (γij - βi (wj - βjln (m/ P*))/wi – δij;
where δij is the Kronnecker delta that is unity if i = j and zero otherwise.
The iterative seemingly-unrelated-regression technique was used to estimate the AIDS model
with homogeneity and symmetry conditions imposed. The data for the AIDS model (1) add up
by construction. The estimates were corrected for the first-order autocorrelation (Berndt and
Savin, 1975). For brevity, the parameter estimates are not reported (but available upon request)
and the demand elasticities are reported in tables 3 and 4.
4.2. Results of Beverage Demands
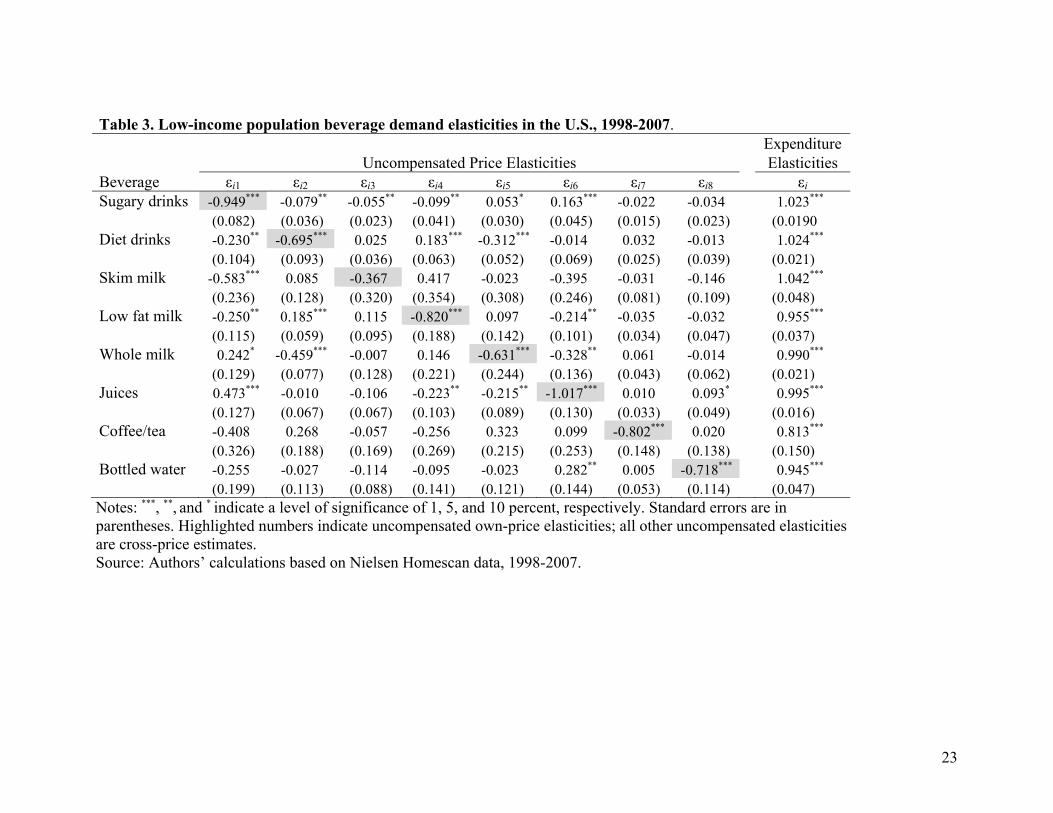
All own-price elasticities for both low- and high-income populations are found to be negative
and statistically significant at the 1% probability level, except for skim milk for the low-income
population. For low-income households, diet (low-calorie) drinks, skim milk, whole milk, and
bottled water are found to be own-price inelastic, with own price elasticities ranging from -0.65
for whole milk to -0.72 for bottled water. Demands for SSBs, low-fat milk, juices, and
coffee/tea are found to be about own-price unitary elastic, with own-price elasticities ranging
from -0.84 for low-fat milk to -1.01 for juices. Of the 56 cross-price elasticities for low income,
19 of them are statistically different from zero at least at the 5% probability level, and 6 (13) of
them are positive (negative) indicating substitution (complement) relationships. The expenditure
elasticities suggest that as the total beverage budget changes, a proportionally larger expenditure
change would be expected for SSBs and diet drinks. A slightly less than proportional change
would be expected for skim and low-fat milk and juices.
9
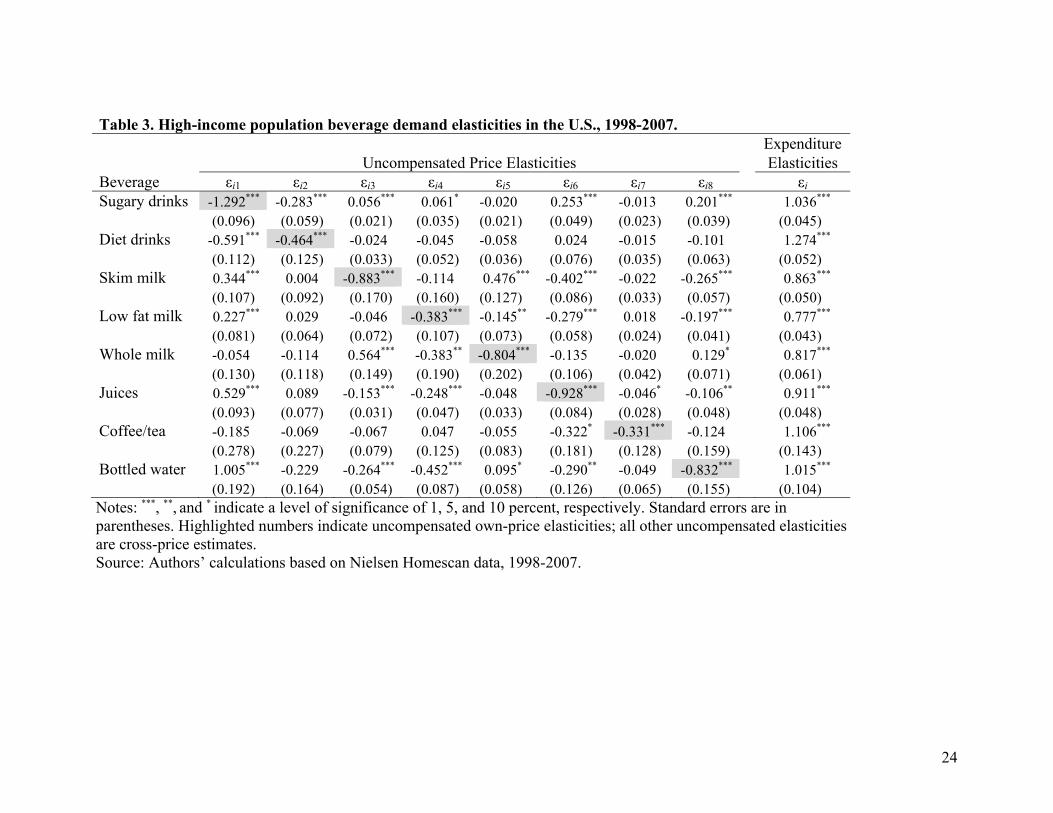
It is interesting to see that high-income households are found to be more responsive to price than
low-income households for some beverages. For example, the demand for SSBs among high-
income households is found to be own-price elastic with a mean value of -1.30, indicating that
these households are about 30 percent more responsive to the changes in SSB prices than low-
income households (-0.98). However, the demand for diet drinks is found to be less price
responsive for high-income than for low-income households (-0.47 vs. -0.69). Likewise, the
demands for low-fat milk, juices, and coffee/tea are also found to be less price responsive among
high-income households, ranging from -0.34 for coffee/tea, -0.39 for low-fat milk, and to -0.93
for juices. The demands for skim milk, whole milk, and bottled water are found to be more
responsive to price changes for high-income households than those for low-income households.
Results also show that the demands for SSBs, diet drinks, bottled water, and coffee/tea are more
responsive to changes in beverage expenditure than milk and juices for high-income households.
Similar to low-income demands, a mixture of complements and substitutes are found among the
eight beverages for high-income households. Of the 56 cross-price elasticities, 23 were
statistically different from zero at the 5% probability level. Results also show that diet drinks are
more responsive to changes in beverage expenditures, while milk and juices are less responsive.
5. Assumptions for Evaluating Price Interventions
There are several key assumptions we have to make in order to use the estimated demand
elasticities to evaluate taxing SSBs and subsidizing milk. First, there are potential differences
between the demand for beverages at home and away from home. Previous research on beverage
demand utilized different types of data and some investigated particulars facets of demand. For
example, Kinnucan et al. (2001) and Zheng and Kaiser (2008) analyzed the USDA
disappearance data (at-home and away-from-home combined) and estimated the effects of
advertising on national beverage demand; Brown and Lee (2007) and Uri (1986) estimated
beverage sub-demand systems using scanner data (for at-home consumption); Yen et al. (2004),
Pofahl et al. (2005), and Pittman (2004) used household purchase data in their studies of
beverage demand for at-home consumption. In this study, we chose to use grocery purchases for
at-home consumption to estimate beverage demand because of the research question about
10
whether the impacts of SSB tax and milk subsidy differ by income level. The USDA food
disappearance data are not suitable for addressing such a research focus.
Estimating away-from-home demand for beverages is a challenge due to data limitations.
Consumers often pay a single price for a meal, such as a combo meal at a fast food restaurant,
which often includes a beverage. Additionally, some restaurants offer free refills for soft drinks.
Thus, quantity is ill-measured for the price. At school cafeterias, milk is a required component
in the meals offered through the National School Lunch Program. Milk is not priced individually
and low-income children receive free lunches or pay a discount price, making it difficult to
estimate milk demand at school. In this study, we assumed the same demand elasticities for at-
home and away-from-home consumption. This assumption was made implicitly in the past
studies estimating changes in beverage consumption from taxation (Andreyeva et al., 2009;
Brownell et al., 2009; Chaloupka et al., 2009; Schroeter at al., 2008).
A tax can be levied as an ad valorem excise tax based on price (e.g., sales tax) or as a specific
excise tax based on quantity or volume. Sales tax is usually paid by consumers making retail
purchases, whereas a specific excise tax is usually paid by those who are further up in the
distribution chain (i.e., manufacturers or distributors). A sales tax is generally not displayed on
the shelf in grocery stores or on a menu in restaurants, and thus consumers may not be aware of
the tax burden (McLaughlin, 2009). Further, beverage prices vary by brand, container size, and
other factors creating an incentive for consumers to substitute lower priced beverages for the
higher price ones, resulting in limited response to a sales tax (Brownell et al., 2009). Individuals
receiving food stamp benefits from the Federal Government are exempt from paying sales tax on
beverages and hence not affected by such a policy.
When a specific excise tax is levied, it will be shared by producers and consumers depending on
the demand and supply conditions. In the case that the taxed food has many (few) substitutes,
manufacturers (consumers) will bear a larger share of the tax. In the case of away-from-home
beverage demand, the relatively low cost of the sugary input (syrup) may create a situation in
which restaurants bear a part or even the full price of the tax. In this study, we assumed that an
excise tax is levied such that consumers face a 20-percent price increase on all SSBs. A 20-
11
percent tax rate is chosen in part because it is close to the 18-percent tax recently proposed by the
State of New York (New York Post, 2009). We also assumed a 10-percent tax and the reduction
in beverage consumption and calorie intake is about half of the reduction from a 20-percent tax.
However, the reduction in overweight and obesity rates is non-linear of the tax rate and we will
report, for brevity, the reduction in obesity for the 20-percent tax rate.
We assume the milk subsidy is offered exclusively to milk consumed as a beverage, but not milk
used in food processing before reaching retail market, such as cheese. As mentioned earlier,
milk is offered at a discount price or free at school cafeteria. USDA reimburses schools for the
cost associated with milk subsidy. The same subsidy mechanism can theoretically be adopted
for grocery purchases. The subsidy is assumed to be reflected in the shelf price.
A final assumption addresses the inevitable waste between the amount purchased and consumed.
Our demand estimates were based on purchase data and impacts were measured using intake
data. Without an accurate estimate of waste, we assumed a constant proportion waste measure;
so that a percentage change in purchase translates into the same percentage change in
consumption.
6. Effects of Price Interventions
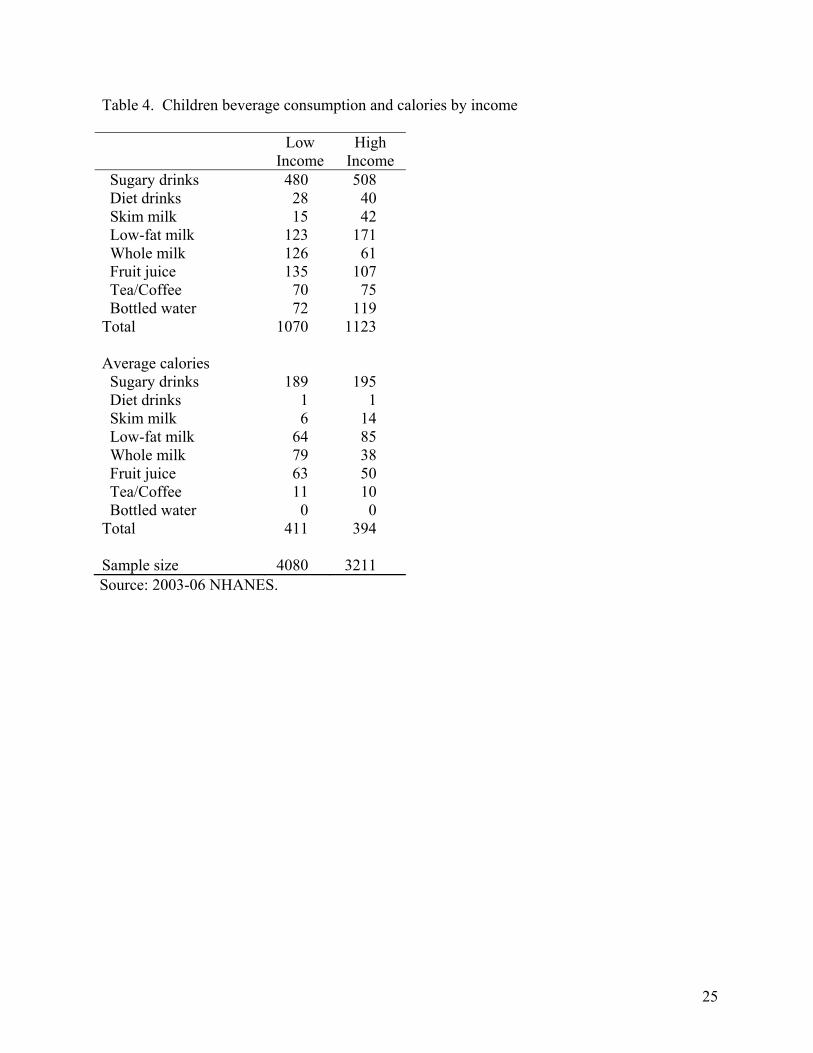
6.1. Average consumption and calories
Using children’s first-day intake data in 2003-6 NHANES, we calculated the average per-capita
daily consumption of the eight beverage categories and their associated calories contents (table
4). Beverage choices vary by income. High-income children consumed SSBs, bottled water,
and coffee/tea than low-income children. High-income children also consumed more bottled
water and coffee/tea than low-income individuals, while low-income children, on average,
consumed more juices and whole milk. As a result, low-income children consumed more
calories from beverages than their high-income counterparts (411 vs. 394 calories a day).
The estimated demand elasticities are applied to the individual beverage intake data in NHANES
to simulate the potential effects of two hypothetical price interventions. In the first simulation,
12
we consider the case in which a tax is levied on SSB such that consumers realize a 20-percent
price increase. In the second simulation, we apply a 20-percent price subsidy to all three milk
beverages (skim, low-fat, and whole milk) on top of the SSB tax. Changes in beverage
consumption are converted to calorie and calcium intakes. Then the resulting changes in body
weight are derived using the commonly used relationship of 3,500 calories equal to one pound of
body weight (Whitney et al., 2002). Children body weight status is classified before and after
the price interventions using the Child Growth Charts (CDC, 2009b).
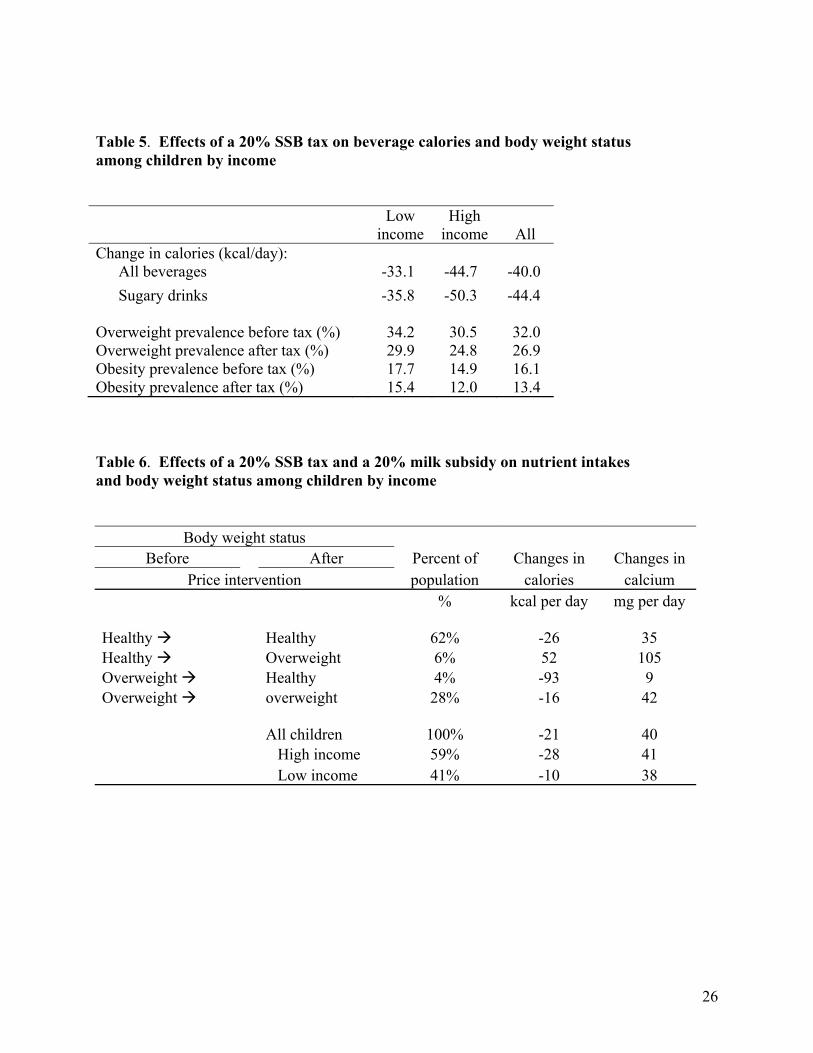
6.2. Effects of taxing SSB
The effects of a 20-percent price increase in SSBs on calorie intake and prevalence of
overweight and obesity are summarized in table 5. On average, a reduction of 40 calories a day
from the eight beverages is predicted for all children, with a reduction of 44 calories from SSB
and a net increase of 4 calories from the remaining seven beverages. With a larger intake from
SSB and a higher own-price elasticity of demand for SSB, high-income children are predicted to
reduce more calories from a SSB tax, compared to low-income children (50 calories vs. 36 from
SSB alone; 45 calories vs. 33 from the eight beverages). Our results suggest a mixed substitutes
and complements among the eight beverages such that changes in calorie intake from the non-
SSBs cancel each other out, but still result in a measurable net change in total calories from the
non-SSB beverages. It is also important to point out that excluding all relevant beverages would
result in an incomplete beverage demand system and hence bias the demand elasticity estimates.
Under the assumption that 3,500 calories a year equates to one pound of body weight, we
compared the overweight and obesity prevalence before and after taxing SSB. The prevalence of
childhood overweight (at the 85th percentile or higher) was predicted to decline from 32 percent
to 26.9 percent and the obesity prevalence (95th percentile or higher) would decline from 16.1
percent to 13.4 percent from a 20-percent tax. The reductions in the prevalence of overweight
and obesity are predicted to be larger for high-income children than for low-income children.
6.3. Effects of simultaneous SSB taxation and milk subsidy
In the second price intervention scenario, we consider a hypothetical 20-percent price subsidy on
milk purchase on top of the 20-percent price increase in SSBs. This price intervention strategy
13
is predicted to decrease calorie intake and increase calcium intake (table 6). Among all children,
an average decrease of 21 calories and an increase of 40 milligrams of calcium in a day from all
eight beverages are predicted. The effects are predicted to be larger for high-income children
than for low-income children.
Surprisingly, despite the prediction of a decrease in calories on average for all children, the
prevalence of overweight and obesity is predicted to rise (from 32 percent to 33.6 percent for
overweight and from 16.1 percent to 18.1 percent for obesity among all children, not reported in
table 6 but the overweight prevalence can be calculated from the figures represented in the table).
This seemingly contradiction points out the fact that averages can be misleading.
To demonstrate, children are classified into two categories--not overweight (called healthy
weight for simplicity) and overweight (including obese)--before and after the price interventions
(table 6). Our results suggest that 90 percent of children do not change their body weight status
as a result of the price interventions--62 percent of children are healthy weight and 28 percent of
children are overweight before and after the price interventions. Among these children, an
average reduction of 26 calories and 16 calories a day is predicted for healthy weight and
overweight, respectively.
The price interventions would result in an average reduction of 93 calories a day and hence help
four percent of children improve from overweight to healthy weight. These four percent of
children are predicted to gain the least amount in calcium intake, suggesting they shy away from
milk in making beverage choices. On the other hand, six percent of children are predicted to
increase their calorie intake by an average of 52 calories a day and gain enough weight to change
from healthy weight to overweight. These children represent the only class who are predicted to
increase their average calorie intake. They also gain the largest amount in calcium intake,
suggesting they increase milk consumption more than other children and hence increase their
calorie intake. As a result, on one hand the price interventions result in a decrease in average
calorie intake among all children. On the other hand, six percent of children change from
healthy weight to overweight and four percent of children change from overweight to healthy
weight, resulting in a net increase in the overweight and obesity prevalence.
14
7. Discussion
Rising prevalence of obesity correlates with several dietary patterns, such as increasing
popularity in eating out and consumption of nutrition-poor but energy dense foods and
beverages. The use of economic incentives or disincentives to encourage healthy food choices,
and hence reduce the incident of obesity, has received heightened support and attracted research
efforts.
It has been documented in the literature that food demands are generally own-price inelastic.
Under inelastic demand, price manipulations alone will not induce large consumer responses.
Researchers have examined the effects of taxing salty snacks and fat in dairy products, as well as
the effects of subsidizing the consumption of fruits, vegetables, and milk (Kuchler et al., 2004;
Chouinard et al., 2007; Lin et al., in press). These three empirical studies support the economic
theory that “[the] first fundamental theorem of taxation: a tax has little effect on inelastic goods”
(McCloskey, 1982, p. 309). The U.S. demand for food has been found to be price inelastic in
general, but the price elasticity varies by food groups. A recent literature review found the own-
price elasticity of demand for sugar-sweetened beverage (SSB) to center around -0.8 to -1.0
(Andreyeva et al., 2009). However, a void exists in the beverage demand literature for the
elasticities needed to address the budget allocation among competing beverages distinguished by
calorie contents. These elasticities are vital because recent taxation proposals have targeted
sugar-sweetened beverages as a means to reduce obesity.
Three studies have found limited effectiveness of SSB taxes, as currently levied, on body weight
reduction (Powell et al., 2009; Fletcher et al., 2009; Schroeter et al., 2008). However, some have
pointed to the evidence of large favorable responses to the experiments that cut the price of
healthy snacks and raise the price of unhealthy snacks at the school cafeterias (Jeffrey et al.,
1994; French et al., 2001). It should be noted that the variety of foods at school cafeterias is
generally restricted. Further, school-age children have limited resources and may have unique
utility function, making the cafeteria setting quite distinct from retail food markets in which a tax
or a subsidy will be implemented.
15
In this study, we estimated a demand system for eight beverage categories for the needed
elasticities to investigate the impacts of taxing SSBs on caloric intakes. Because of the
displacement of milk by SSBs and low intake of calcium could be a costly dietary deficiency, we
also examined a simultaneous SSB tax and milk subsidy. We utilized recent household purchase
data from a national sample to estimate price responsiveness for low- and high-income
households. We found the own-price elasticity of SSBs for low-income households (-0.98) to
fall in the range reported by Andreyeva et al. (2009). However, the own-price elasticity for high-
income households (-1.30) was found to be more responsive to price changes. The demands for
skim, low-fat, and whole milk are found to be own-price inelastic for both high- and low-income
households. These elasticity estimates and a hypothetical 20-percent tax and subsidy were used
to estimate changes in beverage consumption and associated calorie and calcium intakes for low-
and high-income children in the U.S. using the food intake data collected by the National Health
and Nutrition Examination Survey (NHANES). The changes in calorie intakes resulting from a
tax on SSBs and a subsidy on milk were used to estimate the reduction in the prevalence of
overweight and obesity among children by income.
In Healthy People 2010, the Federal Government set the goal to reduce child overweight and
obesity rates from 11 percent to 5 percent (USDHHS, 2009). The obesity rate has risen sharply
since setting these goals. In the present study, we found a 20-percent SSB tax (or a 0.4 cent per
ounce based on the 1998-2007 national average prices of SSB) would reduce the obesity rate
from 16 percent to 13.2 percent for children. When a 20-percent price subsidy on milk
consumption is added to the SSB tax, our results suggest that the childhood obesity rate would
actually increase by 2 percent to 18 percent. Therefore, our results suggest that taxing sugar-
sweetened beverages could have a measurable contribution to the goal of reducing obesity
incident in the U.S. but a milk subsidy would encounter a tradeoff between forgone reductions in
calorie intake and increase in calcium intake.
Because many individuals, children and adults, are just a few pounds over or shy from the
overweight and obese thresholds. A small change in calorie intake and hence body weight will
potentially change these individuals’ body weight classification. Therefore, a discrete yes-or-no
16
weight classification may not accurately reflect the effect of intervention programs on obesity
prevalence. Future research is needed to examine the implication of using alternative prevalence
measures, such as the one adjusted by the distance from the overweight and obesity thresholds
(Jolliffe, 2004). Another future research need involves the biological relationship of 3,500
calories for one pound of body weight. This relationship plays a crucial role in evaluating the
effectiveness of the intervention programs for obesity prevention and reduction. As suggested
by the recent medical literature, the 3,500 calories for one pound of body weight could be an
understatement of the amount of calorie reduction for weight loss (Swinburn et al., 2009).
Medical research aiming at improving the robustness of the predictive model for the calorie and
weight relationship is needed to help evaluating the effectiveness of obesity intervention
programs.
17
References Andreyeva T, MW Long, and KD Brownell. 2009. The impact of food prices on consumption: A
systematic review of research on price elasticity of demand for food. American Journal of Public Health (in press).
Berndt ER and NE Savin. 1975. Estimation and hypothesis testing in singular equation systems
with autoregressive disturbances. Econometrica 43(5-6):937-956. Brown MG and JY Lee 2007. Impacts of promotional tactics in a conditional demand system for
beverages. Journal of Agribusiness 25(2):147-162. Brownell KD, T Farley T, WC Willett, BM Popkin, FJ Chaloupka FJ, JW Thompson, and DS
Ludwig. 2009. The public health and economic benefits of taxing sugar-sweetened beverages. New England Journal of Medicine 361(16):1599-1605
Brownell KD and TR Frieden. 2009. Ounces of prevention — the public policy case for taxes on
sugared beverages. New England Journal of Medicine 360(18):1805-1808. Centers for Disease Control and Prevention (CDC). 2009a. Trends in childhood obesity.
Available at: http://www.cdc.gov/obesity/childhood/prevalence.html (Accessed November 17, 2009)
Centers for Disease Control and Prevention. 2009b. CDC Growth Charts. Available at:
http://www.cdc.gov/GrowthCharts/ (Accessed November 17, 2009) Centers for Disease Control and Prevention, National Center for Health Statistics (CDC-NCHS).
2009. National Health and Nutrition Examination Survey, 2003–2004 and 2005–2006. Atlanta, GA. Available at: http://www.cdc.gov/nchs/nhanes.htm (accessed November 1, 2009).
Chaloupka FJ, LM Powell, and JF Chriqui. 2009. Sugar-Sweetened Beverage Taxes and Public
Health. Research Brief. Robert Wood Johnson Foundation and School of Public health, University of Minnesota. July.
Chouinard HH, DE Davis, JT Lafrance, and JM Perloff. 2007. Fat Taxes: Big money for small
change, Forum for Health Economics and Policy 10(2): Article 2. Jolliffe D. 2004. “Extent of overweight among US children and adolescents from 1971 to 2000,”
International J Obesity 28(1):4-9. Dhar T, J Chavas, and R Cotterill. 2003. An economic analysis of product differentiation under
latent separability. Selected paper prepared for the Annual Meeting of the American Association of Agricultural Economics, Montreal, Canada, July 27-30.
Flegal K., Carroll M., Ogden C., Curtin L, 2010. Prevalence and trends in obesity among US
18
adults, 1999-2008. Journal of American Medical Association 303, 235-241 Fletcher JM, D Frisvold, and N Tefft. 2009. Can soft drink taxes reduce population weight?
Contemporary Economic Policy (in press, early view available). French SA, RW Jeffery, M Story, KK Breitlow, JS Baxter, P Hannan, and MP Snyder. 2001.
Pricing and promotion effects on low-fat vending snack purchases: The CHIPS study. American Journal of Public Health 91(1):112-117.
Institute of Medicine (IOM). 2009. Committee on Childhood Obesity Prevention Actions for
Local Governments, Lynn Parker, Annina Catherine Burns, and Eduardo Sanchez, Editors. Location government actions to prevent childhood obesity. Washington DC.
Jacobson MF and KD Brownell. 2000. Small taxes on soft drinks and snack foods to promote
health. American Journal of Public Health 90(6):854–857. Jeffrey RW, SA French, C Raether, and JE Baxter. 1994. An environmental intervention to
increase fruit and salad purchases in a cafeteria. Preventive Medicine 23(6):788-792.
Kinnucan H, Y Miao, H Xiao, and H Kaiser. 2001. Effects of advertising on U.S. non-alcoholic beverage demand: Evidence from a two-stage. Advances in Applied Microeconomics: Advertising and Differentiated Products 10:1-29.
Kuckler F, A Tegene, and JM Harris. 2004. Taxing snack foods: Manipulating diet quality or
financing information programs? Review of Agricultural Economics 27(1):4-20. Lin, BH, ST Yen, D Dong, and D Smallwood. 2009. Economic incentives for dietary
improvement among food stamp recipients. Contemporary Economic Policy (in press). McLaughlin I. 2009. Public Health Law and Policy. Personal communications (November 13,
2009). McCloskey DN. 1982. The Applied Theory of Price, 2nd edition. London: Collier Macmillan
Publishers, National Oceanic Atmospheric Administration (NOAA). 2009. Contiguous United States climate
summary. Available at: http://www.ncdc.noaa.gov/oa/climate/research/cag3/na.html. (Accessed November 23, 2009).
New York Post. 2009. Paterson pushes soda tax, again. Website:
http://www.nypost.com/p/news/local/paterson_pushes_soda_tax_again_Wg3nnkUrebcb0WdRR9T2IP. Accessed on November 17, 2009.
Nielsen. 2007. Consumer Panel Solutions. Available at:
www.acnielsen.com/products/reports/homescan (Accessed November 17, 2009)
19
Ogden C., Carroll M., Curtin L., Lamb M., Flegal K., 2010 Prevalence of high body mass index in US children and adolescents, 2007-8. Journal of American Medical Association 303, 242-249.
Pittman GF. 2004. Drivers of demand, interrelationships, and nutritional impacts within the
Pofahl GM, O Capps, and A Clauson. 2005. Demand for non-alcoholic beverages: Evidence
from the ACNielsen Home Scan panel. Selected paper for presentation at the American Agricultural Economic Association annual meeting, Providence, RI, July 24-27.
Powell LM and FJ Chaloupka. 2009. Food prices and obesity: evidence and policy implications
for taxes and subsidies. Milbank Quarterly 87(1):229-257. Powell LM, J Chriqui, and FJ Chaloupka. 2009. Associations between state-level soda taxes and
adolescent body mass index. Journal of Adolescent Health 45(3):S57-S63. Rudd Center for Food Policy and Obesity. 2009. Revenue calculator for soft drink taxes.
Available at http://www.yaleruddcenter.org/sodatax.aspx. (Accessed November 17, 2009) Schroeter C, J Lusk, and W Tyner. 2008. Determining the impact of food price and income
changes on body weight. Journal of Health Economics 27(1):45-68. Sichieri R, AP Trotte, RA de Souza, and GV Veiga. 2009. School randomized trial on prevention
of excessive weight gain by discouraging students from drinking sodas. Public Health Nutrition 12(2):197-202.
Swinburn B., Sacks G., Ravussin E., 2009. Increased food energy supply is more than sufficient
to explain the US epidemic of obesity. American Journal of Clinical Nutrition 90, 1453-1456.
Tsai, AG, DF Williamson, and HA Glick. “Direct medical cost of overweight and obesity in the USA: A quantitative systematic review,” Obesity Review doi:10.i111/j.1467-789x.2009.00708.x.
TSP version 5.0. 2005. TSP International, Palo Alto, California. Uri ND. 1986. The demand for beverages and inter-beverage substitution in the United States.
Bulletin of Economic Research 38(1):77-85. U.S. Bureau of Labor Statistics, Consumer Expenditure Survey. 2006. Washington, DC. U.S. Census Bureau. Population Division. Available at:
http://www.census.gov/popest/states/tables/NST-EST2008-01.xls (Accessed November 24, 2009)
20
U.S. Department of Human and Health Services (USDHHS). 2009. Healthy People 2010. Available at: http://www.healthypeople.gov/ (Accessed November 17, 2009)
U.S. Department of Agriculture, Agricultural Research Service (USDA/ARS). Nutrient Data
Laboratory. Washington, DC: U.S. Department of Agriculture. Available at: http://www.ars.usda.gov/main/site_main.htm?modecode=12-35-45-00 (accessed November 17, 2009).
U.S. Department of Agriculture, Food and Nutrition Service (USDA/FNS). Food Assistance
Programs. Washington, DC: U.S. Department of Agriculture. Available at: http://www.fns.usda.gov/fns/ (Accessed November 17, 2009).
White House Task Force on Childhood Obesity: Report to the President. 2010. “Solving the
Problem of Childhood Obesity within a Generation.” Washington DC. May. Whitney EN, CB Cataldo, and SR Rolfes. 2002. Understanding Normal and Clinical Nutrition,
sixth ed. Wadsworth/Thomson Learning, Belmont, California. Yen ST, BH Lin, DM Smallwood, and M Andrews. 2004. Demand for nonalcoholic beverages:
The case of low-income households. Agribusiness 20(3):309-321. Zheng Y and H Kaiser. 2008. Advertising and U.S. nonalcoholic beverage demand.
Agricultural and Resource Economics Review 37(2):147-159.
21
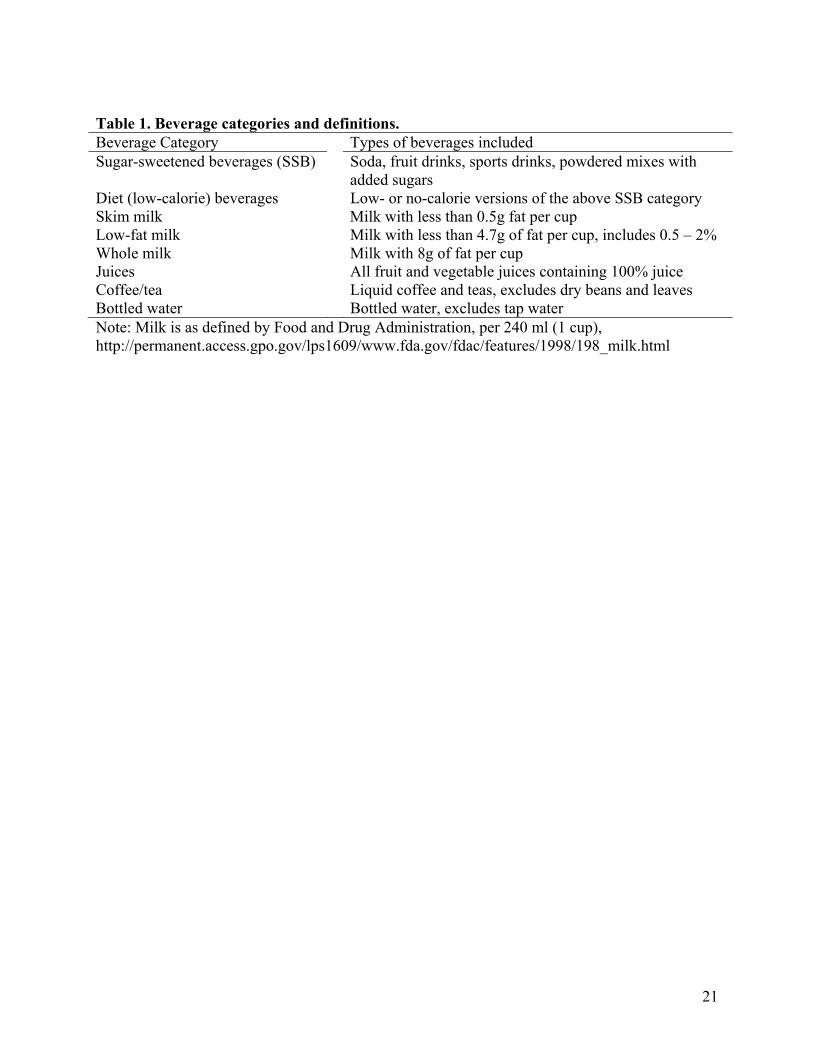
Table 1. Beverage categories and definitions.Beverage Category Types of beverages included Sugar-sweetened beverages (SSB) Soda, fruit drinks, sports drinks, powdered mixes with
added sugars Diet (low-calorie) beverages Low- or no-calorie versions of the above SSB category Skim milk Milk with less than 0.5g fat per cup Low-fat milk Milk with less than 4.7g of fat per cup, includes 0.5 – 2% Whole milk Milk with 8g of fat per cup Juices All fruit and vegetable juices containing 100% juice Coffee/tea Liquid coffee and teas, excludes dry beans and leaves Bottled water Bottled water, excludes tap water Note: Milk is as defined by Food and Drug Administration, per 240 ml (1 cup), http://permanent.access.gpo.gov/lps1609/www.fda.gov/fdac/features/1998/198_milk.html
22
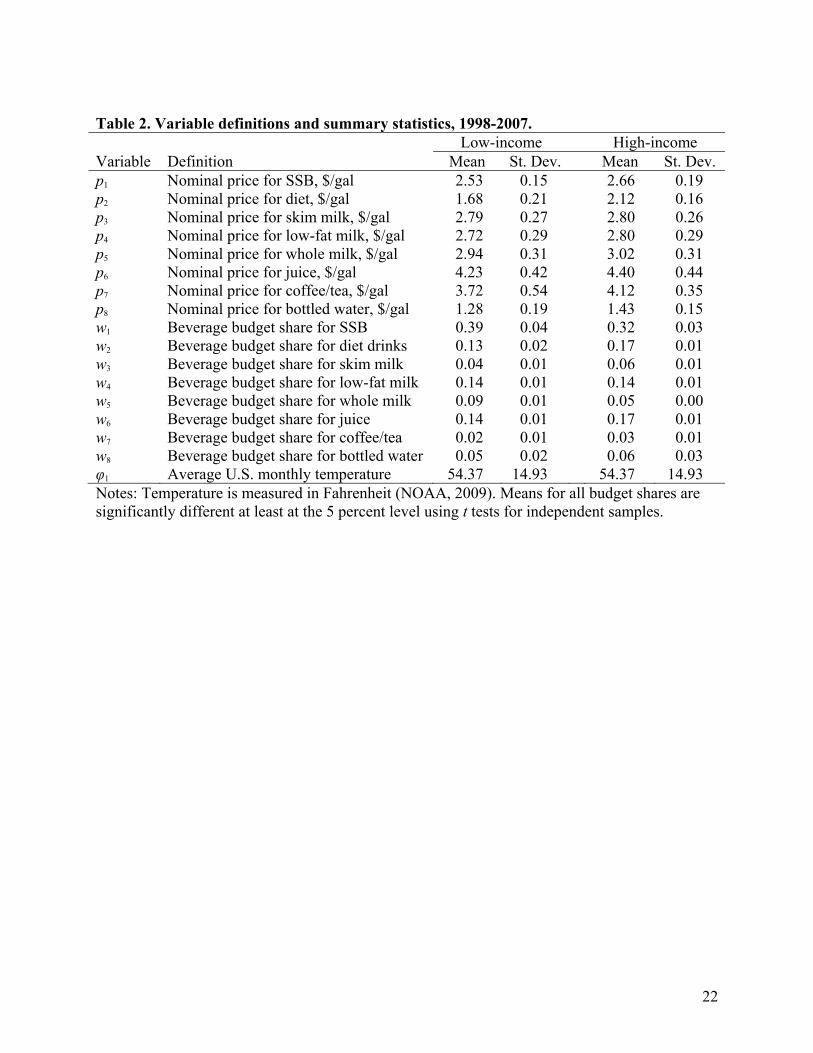
Table 2. Variable definitions and summary statistics, 1998-2007. Low-income High-income Variable Definition Mean St. Dev. Mean St. Dev. p1 Nominal price for SSB, $/gal 2.53 0.15 2.66 0.19 p2 Nominal price for diet, $/gal 1.68 0.21 2.12 0.16 p3 Nominal price for skim milk, $/gal 2.79 0.27 2.80 0.26 p4 Nominal price for low-fat milk, $/gal 2.72 0.29 2.80 0.29 p5 Nominal price for whole milk, $/gal 2.94 0.31 3.02 0.31 p6 Nominal price for juice, $/gal 4.23 0.42 4.40 0.44 p7 Nominal price for coffee/tea, $/gal 3.72 0.54 4.12 0.35 p8 Nominal price for bottled water, $/gal 1.28 0.19 1.43 0.15 w1 Beverage budget share for SSB 0.39 0.04 0.32 0.03 w2 Beverage budget share for diet drinks 0.13 0.02 0.17 0.01 w3 Beverage budget share for skim milk 0.04 0.01 0.06 0.01 w4 Beverage budget share for low-fat milk 0.14 0.01 0.14 0.01 w5 Beverage budget share for whole milk 0.09 0.01 0.05 0.00 w6 Beverage budget share for juice 0.14 0.01 0.17 0.01 w7 Beverage budget share for coffee/tea 0.02 0.01 0.03 0.01 w8 Beverage budget share for bottled water 0.05 0.02 0.06 0.03 φ1 Average U.S. monthly temperature 54.37 14.93 54.37 14.93 Notes: Temperature is measured in Fahrenheit (NOAA, 2009). Means for all budget shares are significantly different at least at the 5 percent level using t tests for independent samples.
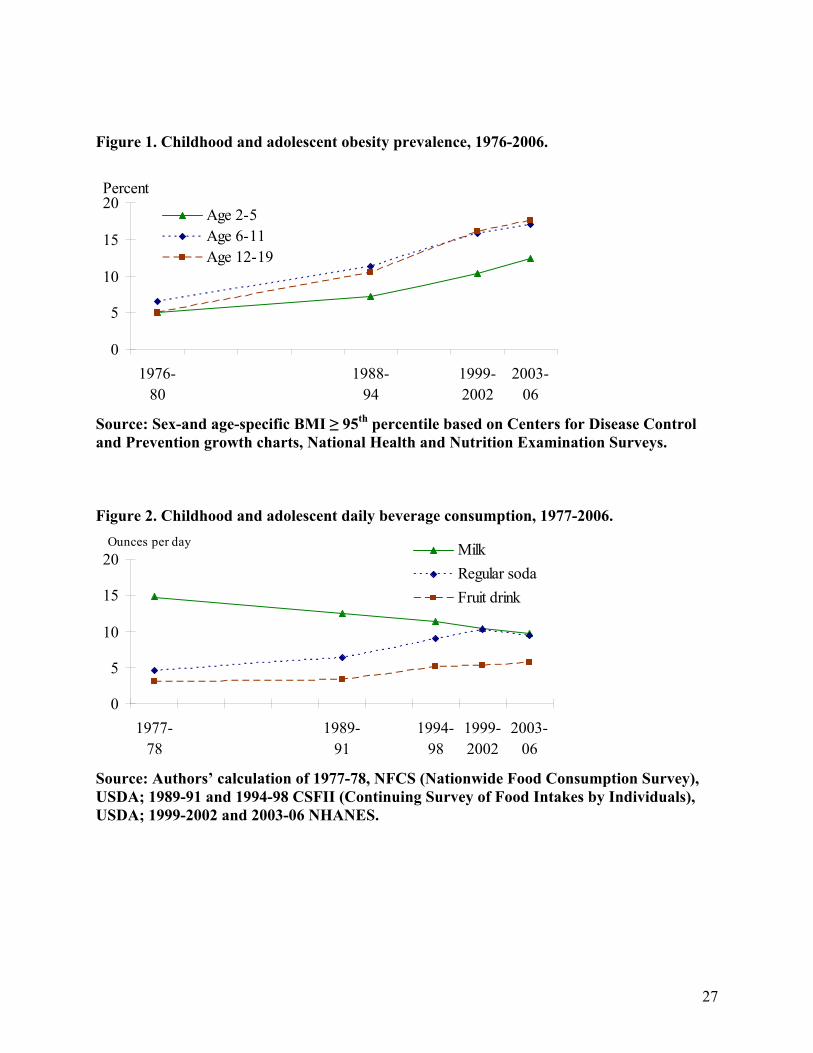
Figure 1. Childhood and adolescent obesity prevalence, 1976-2006.
0
5
10
15
20
1976-80
1988-94
1999-2002
2003-06
Percent
Age 2-5Age 6-11Age 12-19
Source: Sex-and age-specific BMI ≥ 95th percentile based on Centers for Disease Control and Prevention growth charts, National Health and Nutrition Examination Surveys. Figure 2. Childhood and adolescent daily beverage consumption, 1977-2006.
0
5
10
15
20
1977-78
1989-91
1994-98
1999-2002
2003-06
Ounces per day MilkRegular sodaFruit drink
Source: Authors’ calculation of 1977-78, NFCS (Nationwide Food Consumption Survey), USDA; 1989-91 and 1994-98 CSFII (Continuing Survey of Food Intakes by Individuals), USDA; 1999-2002 and 2003-06 NHANES.