Page 1
University of Nebraska - LincolnDigitalCommons@University of Nebraska - Lincoln
Dissertations and Student Research in Entomology Entomology, Department of
Spring 3-7-2017
EFFECTS OF TEMPERATURE AND DIET INSTABLE FLY (DIPTERA: MUSCIDAE)DEVELOPMENTMelina Florez-CuadrosUniversity of Nebraska-Lincoln
Follow this and additional works at: http://digitalcommons.unl.edu/entomologydiss
Part of the Entomology Commons, and the Other Veterinary Medicine Commons
This Article is brought to you for free and open access by the Entomology, Department of at DigitalCommons@University of Nebraska - Lincoln. It hasbeen accepted for inclusion in Dissertations and Student Research in Entomology by an authorized administrator of DigitalCommons@University ofNebraska - Lincoln.
Florez-Cuadros, Melina, "EFFECTS OF TEMPERATURE AND DIET IN STABLE FLY (DIPTERA: MUSCIDAE)DEVELOPMENT" (2017). Dissertations and Student Research in Entomology. 48.http://digitalcommons.unl.edu/entomologydiss/48
Page 2
EFFECTS OF TEMPERATURE AND DIET IN STABLE FLY
(DIPTERA: MUSCIDAE) DEVELOPMENT
by
Melina Florez-Cuadros
A DISSERTATION
Presented to the Faculty of
The Graduate College at the University of Nebraska
In Partially Fulfillment of Requirements
For the Degree of Doctor of Philosophy
Major: Entomology
Under the Supervision of Professors David B. Taylor and Gary Brewer
Lincoln, Nebraska
March, 2017
Page 3
EFFECTS OF TEMPERATURE AND DIET IN STABLE FLY
(DIPTERA: MUSCIDAE) DEVELOPMENT
Melina Florez-Cuadros, Ph.D.
University of Nebraska, 2017
Advisers: David B. Taylor and Gary Brewer
Stable flies are among the most important blood feeding ectoparasites of cattle
worldwide. The livestock industry is losing more than $2 billion dollar annually in the
United States alone. Moist decaying vegetative material with bacteria supports larval de-
velopment. Temperature and diet quality are important factors for stable fly develop-
ment, affecting development rates, adult survival, and size, but how temperature affects
adult size and interacts with nutrition is unknown. This study characterizes the relation-
ship of temperature and diet quality in the development of stable flies. Two statistical
models were used to analyze the effect of temperature alone (Lysyk, 1998) and tempera-
ture-diet interactions (Boetel, et al. 2003). Temperature drives larval development, at
higher temperatures stable flies develop faster. Interaction of the two factors affects when
larvae pupate, larvae exposed to good nutrition and low temperatures take 90% more time
than those at bad nutrition under high temperatures. Diet controls adult size, bigger flies
grew on the standard diet at low temperatures, but also temperature influences size when
flies are starving, and grew larger at higher temperatures. Results from this experiment
show that temperature and diet interact in complex manners to affect stable fly develop-
Page 4
ment. At higher temperatures, development is fast but size is reduced. At low tempera-
tures, development is slow, and although flies are exposed longer to predation, size in-
creases, which may increase reproductive success. However, the interaction changes
when food is limited, it is better to grow at small size for an opportunity to reproduce.
Understanding of stable flies biology helps to discern population dynamics. Stable flies
exhibit an evolutionary plasticity allowing successful development in a variety of condi-
tions. This plasticity may account for their global colonization and prevalence in a variety
of habitats. Trade-offs between fast growth and small size, and slow growth and larger
size on stable flies, needs further study. Studies that compare stable flies size from the
field are required to understand their phenology and how these conclusions could be ap-
ply.
Page 5
i
Acknowledgements
I would like to thank Dr. Dave Taylor, who has been the best advisor I could
asked for, thanks for all you time and effort to make me a good scientist. Thanks to Dr.
Gary Brewer, his support and guidance were key to my success. Thanks to Dr. Kathy
Hanford for her direction, and to Dr. Kristina Friesen for her wish to make the project
better.
Thanks to all who were involved in this project. Dennis Berkebile for helping me
in the lab and always smiling when I asked for something. Jamie, thanks for measuring
the hundreds of wings –I know it was a tedious task- and care for my experiment. Thanks
to Dr. Nathan Palmer for your guidance with the gene expression analysis, as well as to
the UNL Bioinformatics Core Research Facility. Thanks so much to Cyrille Nzouda,
from the Department of Statistics, for the suggestions in the statistical analysis.
Special thanks to Colfuturo and Colciencias, the two agencies from Colombia that
made possible my doctorate studies in the U.S. Please, keep going with these scholarships
in Colombia, you have no idea how important this is for our society, for the country. Edu-
cation is fundamental for the progress that we desperately need.
Thanks also to the Department of Entomology at UNL, you all, students, staff and
faculty made that great department, keep working hard. Jeri, you are precious, thanks for
helping me to navigate on that sea of paperwork. Thanks to the Department for the finan-
cial support through the last stages of my studies.
Page 6
ii
Finalmente, gracias amor por todo tu apoyo incondicional, por estar siempre a mi
lado, por tus palabras, tu tiempo y esfuerzo, por querer que siempre seamos mejores. Gra-
cias por el cuidado de Antonia y tu amor a ella. También, gracias a mi familia, a mis her-
manos, a Elvira y a mi mama que es la mejor del mundo, gracias por tus enseñanzas.
Papá espero que me estés viendo desde arriba. Y a mi hija, gracias por existir.
Page 7
iii
Dedication
To all the dreamers out there…keep working, it only takes time
Page 8
iv
Grant information
- Scholarship from the “Fundación para el futuro de Colombia” –COLFU-
TURO, 2013 -2014. U$43,000.
- Scholarship Doctorados en el exterior 2015-2016, from the “Departamento
Administrativo de Ciencia y Tecnología de Colombia” –COLCIENCIAS.
U$100,000.
Page 9
v
TABLE OF CONTENTS
CHAPTER 1 INTRODUCTION AND LITERATURE REVIEW ............... 1
1.1 Biology of stable fly................................................................................ 1
Classification................................................................................................... 1
Life cycle ........................................................................................................ 2
Developmental substrates ............................................................................... 3
Adult biology and behavior ............................................................................ 5
1.2 Economic impact of stable flies in cattle industry .................................. 6
Behavioral and physiological responses of cattle to stable flies ..................... 8
1.3 Control of stable flies .............................................................................. 9
Cultural and mechanical control ................................................................... 10
Chemical control ........................................................................................... 11
Biological control.......................................................................................... 12
1.4 Insect growth and development ............................................................ 13
1.5 Size in insects ........................................................................................ 16
1.6 Gene expression .................................................................................... 20
1.7 References ............................................................................................. 24
CHAPTER 2 EFFECTS OF TEMPERATURE AND DIET IN STABLE
FLY (DIPTERA: MUSCIDAE) DEVELOPMENT .................................................... 24
2.1 Introduction ........................................................................................... 40
2.2 Materials and methods .......................................................................... 42
Page 10
vi
Stable flies. .................................................................................................... 42
Treatments..................................................................................................... 42
Wings ............................................................................................................ 43
2.3 Statistical analysis ................................................................................. 44
Stable flies development ............................................................................... 44
Lysyk, 1998 model: ...................................................................................... 44
Boetel, et al. 2003 model .............................................................................. 45
Stable fly wings size. .................................................................................... 46
2.4 Results ................................................................................................... 47
Lysyk, 1998 model results ............................................................................ 47
Effects on wing size ...................................................................................... 49
2.5 Discussion ............................................................................................. 49
2.6 References ............................................................................................. 53
2.7 Figures and tables ................................................................................. 53
CHAPTER 3 DIFFERENTIAL GENE EXPRESSION IN RESPONSE TO
TEMPERATURE AND DIET IN STABLE FLIES .................................................... 62
3.1 Introduction ........................................................................................... 62
3.2 Materials and methods .......................................................................... 63
Stable flies. .................................................................................................... 63
Experiment. Eggs were harvest according to Berkebile et al. 2009, ............ 63
RNA isolation. .............................................................................................. 63
Page 11
vii
Differential expression analysis. ................................................................... 64
3.3 Results ................................................................................................... 64
Gene ontology (GO) analysis on the significant genes ................................. 65
Diet. ............................................................................................................... 65
Temperature. ................................................................................................. 66
3.4 Discussion ............................................................................................. 67
3.5 References ............................................................................................. 69
3.6 Figures and tables ....................................................................................... 72
Appendix 1. .......................................................................................................... 74
Results of Gene Ontology analysis ............................................................... 74
REVIGO scatter plots ................................................................................... 96
LIST OF FIGURES
Figure 2.1. Example of a mounted wing on a sticky card ................................................. 58
Figure 2.2. Growth curve with descriptive variables exemplified .................................... 59
Figure 2.3. Predicted (lines) and calculated (points) stable flies developmental times .... 59
Figure 2.4. Temperature effects on larval development calculated using Boetel model. . 60
Figure 2.5. Diet and temperature interaction on adult emergence. ................................... 60
Page 12
viii
Figure 2.6. Wing length of stable flies .............................................................................. 61
Figure 3.1. PCA plots. Three principal component plots of expressed genes ................ 72
Figure 3.2 Heatmaps of differentially expressed genes. ................................................... 73
Figure 3.3. Scatterplots to visualize GO terms grouped by semantic similarity............... 96
LIST OF TABLES
Table 2.1. Standard and dilution diets with reduced nutrient to inert ingredient ratios .... 58
Table 3.1 Expressed genes on each of the GO terms are related in percentage………..74
LIST OF EQUATIONS
Equation 1-1 ...................................................................................................................... 15
Equation 2-1 ...................................................................................................................... 44
Equation 2-2 ...................................................................................................................... 45
Equation 2-3 ...................................................................................................................... 45
Equation 2-4 ...................................................................................................................... 46
Equation 2-5 ...................................................................................................................... 46
Equation 2-6 ...................................................................................................................... 46
Equation 2-7 ...................................................................................................................... 46
Page 13
1
CHAPTER 1 INTRODUCTION AND LITERATURE REVIEW
1.1 Biology of stable fly
Classification
Stable flies belong to the order Diptera, the most ecological diverse order of in-
sects known as true flies (Yeates et al. 2007). Members have the unique characteristic of
possessing a single pair of functional wings (Skevington and Dang 2002). The hind wings
are modified into small, club-shaped structures, the halteres, which are used for stability
during flight (Kamut and Jezierski 2014).
Stable flies, Stomoxys calcitrans (Linnaeus, 1758), compose the subfamily
Stomoxyinae, part of the family Muscidae. These are robust and strongly bristled flies
with a sharp proboscis towards the end. Bristles of the thorax are distinct hair-like. The
anal vein 1 is incomplete in the well-developed wings. Legs are slender (Huckett and
Vockeroth 2013). In Stomoxyinae, the aedeagus displays an anchor-shaped terminal part,
the horned sclerite (Zumpt 1973, Huckett and Vockeroth 2013). Additionally, all exhibit
piercing and sucking type mouthparts to draw blood from the host (Zumpt 1973).
The medical and veterinary importance of the Stomoxyinaes lies in the hematoph-
agous activity of flies in this subfamily, where the genera Stomoxys and Haematobia are
most significant (Zumpt 1973). Also, the house fly Musca domestica Linnaeus, within the
same family Muscidae, is recognized as an important pest of humans, with similar biol-
ogy. Originating in the Old World, Muscids are distributed nearly worldwide and proba-
bly have been disseminated by man due to the close association (Huckett and Vockeroth
2013).
Page 14
2
Stable fly adults are about the size of a house fly, from 4 to 7 mm. The thorax dis-
plays four dark lines running along the top and a haired anepimeron. The dorsal abdomen
is cover by dark spots. The strongly sclerotized bayonet type mouthparts bear prestomal
teeth on the labella. Palpi are one-third as long as labium. Antennae hold an asymmetri-
cally plumose arista with long dorsal hairs, and oral vibrissae are robust (Zumpt 1973,
Mullen and Durden 2009, Huckett and Vockeroth 2013).
Life cycle
Dipterans are holometabolous insects. Their life cycle includes four stages: egg,
larva, pupa, and adult. Larval instars undergo several molts. The hardened skin of the last
instar, the puparium, encloses and protects the exarate pupa inside. The adult fly emerges
from the puparium breaking the anterior end with the ptilinum, a membranous eversible
pouch located between the eyes (Stehr 2009).
The life cycle of stable flies takes 15 days at 25°C (Lysyk 1998). Females lay 350
eggs on average in a lifetime, at a rate of 22 per day. Oviposition decreases with age
(Berry and Kunz 1978, Lysyk 1998). Most of the eggs hatch within 24 hours to first-in-
star and will advance to second and third active instar larvae. Puparia are red to dark
brown in color and metamorphosis takes six days (Zumpt 1973). The lifespan of adults
in the laboratory can last up to 30 days at 25°C (Lysyk 1998). Mating can occur two days
after emergence. Males can inseminate up to six females, but females mate only once
(Harris et al. 1966).
Page 15
3
Developmental substrates
Moist decaying vegetative matter with bacteria supports larval development
(Skoda et al. 1991, Lysyk et al. 1999, Romero et al. 2006, Albuquerque and Zurek 2014).
Material accumulated in fence lines, drainage ditches, haylage, corn silage, spilled feed,
and straw bedding are the most common places for stable flies development associated
with confined livestock (Meyer and Petersen 1983). In California, manure containing
straw or hay was the most common source of stable flies (Meyer and Shultz 1990). Re-
cently, the problem of stable fly infestations is growing due to the utilization of other sub-
strates by stable flies. Residues of pineapple, sugarcane, and oil palm crops have been
increasingly associated with stable flies infestations in Brazil, Costa Rica, and Colombia
respectively (Mora et al. 1997, Dominghetti et al. 2015, Solórzano et al. 2015).
Substrates with an active microbial community are required for larval develop-
ment (Lysyk et al. 1999). In the field, adult emergence was associated with high rates of
microbial respiration in hay feeding sites (Wienhold and Taylor 2012). Moreover, signifi-
cantly higher concentrations of fecal coliforms are found in hay feeding sites during the
period of large stable fly emergence (Talley et al. 2009). Actinobacter sp., Aeromonas
sp., Empedobacter breve, Flavobacterium odoratum, and Serratia marcescens have been
isolated from eggs of flies held in a laboratory colony. Single cultures of each these bac-
teria inoculated on egg yolk media supported larval development except for Aeromonas
sp. and S. marcescens. Mixed bacterial cultures yielded faster developmental time, and
larval growth can be improved using mixed cultures of F. odoratum and E. breve (Lysyk
et al. 1999).
Page 16
4
Additionally, the microbial community of stable fly guts is distinct from the microbial
community of the substrate where they are developing. Bacteria from the genera Erysipe-
lothrix, Dysgonomonas, Ignatzschineria (Gammaproteobacteria), and Campylobacter
(Epsilonprotobacteria) were significantly more abundant in stable fly guts (Scully et al.
2017)
An experiment with house flies using sterilized substrate and the addition of vita-
mins, lipids, and carbohydrates, suggests that sterol and vitamins are vital for larval de-
velopment, and could be inferred that bacteria are producing those components. The com-
parison of natural developmental substrates with sterilized substrates adding vitamins and
lipids were similar, larvae were able to grow (Brookes and Fraenkel 1958). Thus, the
presence of bacteria or their metabolic products are essential as nutrients in house fly
rearing medium (Schmidtmann and Martin 1992), and possibly for stable flies develop-
ment as well.
Stable flies develop in a variety of substrates with a range of physicochemical
conditions that can change over time. In the field, a substrate temperature of 23°C was
more suitable for development than 27°C, based upon the productivity of stable flies at
hay feeding sites. pH values found in the substrate range from 6.5 to 7.0 without affecting
stable fly development. A pH of 7 coincides with the lowest fly emergence in hay rings.
The more acidic areas were related to higher adult emergence (Talley et al. 2009). Con-
trastingly, Wienhold and Taylor 2012 found a positive correlation of pH, ranging from
6.5 to 8.5, and fly emergence. pH was above neutral in areas of hay accumulation and
greater fly emergence. Electrical conductivity, moisture, ammonium concentration, and
total C concentration were also positively correlated with fly emergence. Furthermore,
Page 17
5
aging of cattle manure reduced osmolality and pH. pH of fresh manure started at 5, then
dropped to 4 within a week, and later increases to values higher than that of fresh manure.
The osmolality of fresh manure ranged between 300 to 450 mOsm/Kg, rose to 600, and
slowly declined to values similar of the fresh manure. Microbial activity likely causes
these changes (Broce and Haas 1999).
Larvae of stable fly are adapted to their habitat for successful development. They
possess a series of sensilla located in the antenna, terminal organ, and ventral organ in the
head region that function as chemical and mechanoreceptors (Axtell and Chu 1972).
These receptors are responsible for capturing information from the environment and
transmiting it to the brain that will respond accordingly. A well-developed facial mask is
present in the third instar larva, which may work with the anterior spinose band in predi-
gestion (Friesen et al. 2015). On the final segment, the anal pad functions as an osmoreg-
ulatory organ (Stoffolano 1970) which may help larvae to survive in environments prone
to osmolality changes.
Adult biology and behavior
Stable flies blood feed once per day (Chia et al. 1982). The proboscis penetrates
the host skin creating a pool of blood; a meal can take 4 minutes (Gerry et al. 2005). Nec-
tar is also part of their diet (Taylor and Berkebile 2008). Host dependence is low, visiting
host for feeding only, preferring the lower parts of legs on cattle (Todd 1964). Females
are anautogenous, maturation of the first batch of eggs requires one blood meal per day
during five days. The amount of ingested blood increases steadily until oviposition. The
Page 18
6
second batch is matured at the ninth day, following the same ingestion pattern. Mated fe-
males oviposit once eggs are mature, but in the absence of mating, eggs are retained
(Venkatesh and Morrison 1980, Chia et al. 1982). In search of a blood meal in the field,
flies can fly at least 3 km, but once hosts are located, they tend to remain close. Flight
mill studies demonstrated the capability of stable flies to fly up to 29 km in 24 h, alt-
hough the average was 7 km for male and 9 km for females (Bailey et al. 1973).
1.2 Economic impact of stable flies in cattle industry
Cattle production is a major agricultural industry in the United States. In 2004, the
beef industry produced $44 billion in farm gate receipts (National Cattlemen’s Beef
Association 2014), about five times that amount per year in related economic output, and
provides more than one million jobs (Environmental Protection Agency 2011). Accord-
ing to the Nebraska Beef Council, the cattle industry is the largest in the state with more
than $12.1 billion from related activities each year. Nebraska is among the five states that
produce more than 50% of the total values of the U.S. sales of cattle and calves. Further,
it is ranked first in red meat production and commercial cattle slaughter (National
Cattlemen’s Beef Association 2014).
Several pests affect the livestock industry. Among them, stable flies disturb con-
fined as well as pastured cattle (Hall et al. 1982). The Economic impact of stable fly in-
festations to the confined cattle industry of the U.S. was estimated between $680 million
(Kunz et al. 1991) and $930 million, annually (Drummond et al. 1981, Byford et al.
Page 19
7
1992). Including pastured cattle, losses raise up to $2.21 billion annually (Taylor et al.
2012).
Economic losses generated by stable flies in the cattle industry are grounded on
weight gain and milk reductions, in addition to the costs of control. An average of 2.79
flies per leg can reduce weight gain by 19% or 0.20 kg/d in grazing cattle during the sum-
mer months from June through September. In 2016, calculated costs of stable flies based
on $2.68/kg of steer would be valued at $45.56 per animal during the 84 d trial period
(Campbell et al. 2001). Other studies found similar weight gain reductions (Cutkomp and
Harvey 1957, Cheng 1958, Campbell et al. 1987, Wieman et al. 1992). In addition, dairy
farms can be affected by stable flies due to the 0.7% reduction in milk production per
cow, per fly during the summer (Bruce and Decker 1958).
The economic costs associated with pests are directly correlated with their
abundance (Gerry et al. 2005). Methods for assessing stable fly abundance usually assess
number of adults. Traps made of reflective material, such as fiberglass, coated with an
adhesive are a good way to sample populations and find trends over time (Foil and
Hogsette 1994). Average counts of adult flies on the entire body of chosen animals are
also an indicator of abundance (Taylor, et al. 2012). Although, stable flies are observed
on the flanks, and upper legs of cattle, most feed or rest on the legs, below the chest floor
of cattle (Berry et al. 1983). Moreover, 45% of the stable flies biting a cow are located on
its front legs (Lysyk 1995). Thus, the average number of flies on both front legs below
chest floor, when viewed from a single angle, is another index of stable fly infestation
Page 20
8
levels. An average front leg count multiplied by 2.81 can estimate the numbers of flies on
the entire body of the animal (Berry et al. 1983).
Behavioral and physiological responses of cattle to stable flies
Stable flies disturb grazing in several ways. Animals increase the amount of herb-
age taken per bite, decreasing feeding time, for promptly seeking refugee from flies. Ani-
mals may move uphill looking for winds that discourage flies or stand in water. Bite rate
decreases from 38 bites per minute in the absence of flies to 19 bites per minute, with 60
flies or more on the front legs (Dougherty et al. 1993, 1994, 1995). The fact that stable
flies interfere with food intake of animals can explain their adverse consequence in
weight gain and milk production.
Defensive behaviors are positively correlated to the presence of stable flies in the
field, where skin twitches are most common. These behaviors are divided into less fre-
quent but more energy-intensive movements (head throw and front leg stamp), and more
frequent but less energy-intensive movements (skin twitch and tail flick). However, the
behaviors are not completely effective in repelling flies from the host, and constant bites
may lead to habituation. Older animals harbor more flies and react less than younger
(Mullens et al. 2006). Nevertheless, animals spend energy when performing defensive be-
haviors (Todd 1964, Miller et al. 1973, Dougherty et al. 1993). The energy loss involved
in fighting flies accounts for 28.5% of the reduction in weight gain due to stable fly at-
tack. The remaining percentage is due to indirect effects of herd bunching and heat stress
(Wieman et al. 1992).
Page 21
9
Quantification of the detrimental effect of stable flies on the health and wellbeing
of animals has been made through measurement of physiological parameters. Some stud-
ies (Schwinghammer et al. 1986, 1987) have shown that infestations can increase heart
rate, respiration rate, temperature and cortisol releases, indicating higher metabolic activ-
ity, nutrient metabolism and stress. Moreover, stable fly exposure can increase urine pro-
duction and urinary nitrogen output, resulting in reduced nitrogen availability for protein
synthesis (Schwinghammer et al. 1986, 1987). However, another found no differences in
heart and respiration rates, temperature, or nitrogen utilization among steers exposed to
stable flies (Estienne et al. 1991). Genetic differences, previous exposure and therefore
habituation to the bite, and differences in experimental design may explain these discrep-
ancies (Estienne et al. 1991).
Indirect consequences of stable flies on livestock are under study. Bunching is a
group behavior adopted by the herd (Todd 1964), which may increase heat stress affect-
ing weight gain (Wieman et al. 1992). The stress of biting flies attacking cattle appears to
be greatest when combined with stressful summer conditions and reduced forage
(Cutkomp and Harvey 1957).
1.3 Control of stable flies
The Economic threshold is a vital piece of a pest management program (Gerry et
al. 2005). In stable flies, it has been established at five flies per front leg on feedlot heif-
ers (Campbell and Berry 1986). Another tool to assess fly presences is animal behavior.
Page 22
10
Defensive behaviors, including tail-flicking, head throwing towards the back, foot stamp-
ing, skin twitching, and bunching are good indicators of stable flies abundance. Tail flick-
ing is easily detected from a distance far out in a herd. Counting this behavior in 15 ani-
mals for two minutes each can be used to calculate the economic threshold (Gerry et al.
2005). Ten or more tail flicking per minute is equivalent the economic threshold of five
flies per leg (Mullens et al. 2006), when therapeutic practices are necessary to avoid a
significant impact. Integrated pest management programs involving cultural, mechanical,
and biological control, reduce fly populations along with the utilization of chemical in-
secticides (Machtinger et al. 2015)
Cultural and mechanical control
Life cycle and host dependence of pests lead control strategies of arthropod
infestations (Foil and Hogsette 1994). The best option for controlling stable flies is sani-
tation directed towards the larval stages when they are concentrated in their developmen-
tal sites and are relatively immobile (Wienhold and Taylor 2012) and the most cost-effec-
tive method (Gerry et al. 2005). Feed apron and mound areas are the most productive de-
velopmental sites in feedlots (Skoda et al. 1991). Waste management along these two
zones could significantly reduce stable fly populations. In pastures, larva development is
associated with large round hay bales stored in the field (Hall et al. 1982). Bale stacking
can decrease stable fly populations by reducing the area available for development. Addi-
tionally, the temperature inside pile can increase limiting fly development (Hogsette et al.
1987). Savings on insecticides cover a significant portion of the additional manure
removal costs (Lazarus et al. 1989).
Page 23
11
Along with the control of immature stages to reduce populations, the direct con-
trol of adults is required when infestations are high. Some procedures include managing
livestock to avoid areas with high fly densities, intercepting their encounter, providing
shelter, and applying insecticides (Foil and Hogsette 1994). In addition to estimating pop-
ulation trends, sticky traps can decrease adult populations (Foil and Hogsette 1994, Gerry
et al. 2005, Blanco-Metzler and Arguedas-Marin 2015, Solórzano et al. 2015). The first
trap created with this purpose was made of Alsynite coated with an adhesive (Williams
1973). Modern traps are made of coroplast and polyethylene terephthalate (PET), being
the latest the most successful of all in collecting flies (Taylor and Berkebile 2006,
Beresford and Sutcliffe 2008). More recently, traps developed for tsetse flies (Glossina
spp.) made of blue fabric (Vavoua and NZI), have been used to control diverse Stomoxys
species in Africa (Gilles et al. 2007).
Chemical control
Common chemicals used to control adult filth flies are pyrethroid based (Pitzer et
al. 2010), applied as sprays or pour-ons and have fast-acting, short-lived action. For sta-
ble fly control on pastured cattle, insecticides can be sprayed over the legs and belly.
However, flies spend little time feeding on the host. Furthermore, the constant contact of
the belly and legs with grass, weeds, and water can wash off the product. Application on
resting locations such us barns, tree lines, building walls, and shaded structures may be a
more successful measure against infestations (Foil and Hogsette 1994, Gerry et al. 2005).
Larvicides are chemicals used to inhibit the development of immature stable flies.
Insect growth regulators (IGRs) are a common category of larvicides used against this
Page 24
12
pest. They caused a disruption in cuticle formation during the larval-pupal
metamorphosis. Thus, they are active against the larval stages only (Wright 1974).
Diflubenzuron, can reduce the emergence of stable flies from soiled straw bedding spread
on the field when administered as bolus (Miller 1994). Novaluron inhibits chitin synthe-
sis in immatures. This insect growth regulator reduces stable flies developed in the
manure of cattle fed daily for ten consecutive days (Lohmeyer et al. 2014). A single treat-
ment of cyromazine to the developmental substrate can reduce the number of emerging
flies by over 95% (Taylor, et al. 2012). The difficulty with this measure is the ability of
stable flies to reproduce in a wide variety of substrates around farms, where all develop-
mental sites need to be identified and eliminated (Miller et al. 1991).
Stable fly infestations are increasing due to stable fly’s development in crop resi-
dues such as rotting vegetable matter, pineapple, and sugar cane wastes (Cook 1997,
Solórzano 2014, Dominghetti et al. 2015). In Costa Rica, they have augmented their pop-
ulation, associated with the extension of the pineapple production. IGRs may help in con-
trol when the developmental substrate is localized, such as in this case. IGR, Difluben-
zuron, Novaluron, and Triflumuron, are applied to the pineapple crop residue, two days
after chopping and incorporation into the soil. Utilization of IGRs is combined with traps
for better management of the pest (Solórzano 2014).
Biological control
Biological control with commercially available parasitoid wasps is another
method for controlling immature stable flies. A variety of parasitoid wasps, including
Spalangia cameroni, Spalangia endius, Spalangia nigroaenea, and Muscidifurax spp.
Page 25
13
naturally attacked stable flies (Greene et al. 1989, Machtinger et al. 2016). Inundative re-
leases of artificially reared parasitoids are released over the field where they locate stable
fly puparium and deposit their eggs. To date, there is little consensus on the effectiveness
of parasitoids to reduce fly populations. Some studies shown positive results controlling
stable flies with releases of parasitoids (Weinzierl and Jones 1998, Skovgård and
Nachman 2004, Geden and Hogsette 2006) and failures in others (Meyer et al. 1990,
McKay and Galloway 1999). Chances for success are greater when combined with sani-
tation and chemical measures. Although, use of chemical insecticides in the developmen-
tal sites is not compatible with biological control, because of the harm that could cause to
the natural enemies (Gerry et al. 2005), a combination of IGR with parasitoids may have
an additive effect for controlling flies. Exposure of flies to sub-lethal doses of the IGR,
can extend the duration of the pupal stage, increasing the chances for success of the para-
sitoids (Srinivasan and Amalraj 2003).
1.4 Insect growth and development
There are three major types of insect development: Simple metamorphosis, in-
complete metamorphosis, and complete metamorphosis. Simple metamorphosis or
ametabolous development is the most primitive developmental mode in insects. Immature
forms are similar to adults, only distinguishable by their small size and inability to repro-
duce. Both stages are wingless. Hemimetabolous insects undergo incomplete metamor-
phosis. Their development involves maturation of genitalia and functional wings (Yang
2001). Holometabolous development occurs in most of the insects. Here, young stages
Page 26
14
appear different from adults, and often occupy different habitats or utilize unlike food re-
sources (Gullan and P. S. Craston 2010).
Complete metamorphosis begins with eggs that hatch into larvae. Each larval
stage is referred to as an instar. Instars grow between molts in which they shed their exo-
skeleton, and grow a new, larger one (Edgar 2006). When molting, insects increase their
size by swallowing air or water. Thus, the growth of the integument and epidermis aug-
ment the surface area but not biomass. Accumulation of biomass occurs during the inter-
molt period when insects are actively feeding (Nijhout and Callier 2015). Following a
number of molts according to the species, holometabolous insects enter a pupal stage and
undergo metamorphosis in which they reach reproductive maturity. Adult organs such as
wings and eyes developed de novo from imaginal discs, groups of undifferentiated pro-
genitor cells present in the last larval instar (Edgar 2006). During metamorphosis in the
pupal stage, insects are changing but not growing. Adult insect size is the product of their
growth during the larval stages. Adult insects do not grow (Nijhout 2003). Thus, adult
size can be used as an indicator of the larval environent.
Metamorphosis is controlled by three hormones. Neurosecretory cells in the brain
produce a prothoracicotropic hormone (PTTH), released from the corpora cardiaca in
most insects or corpora allata in Lepidoptera. Environmental stimuli such as photoperiod
or temperature trigger its discharge. PTTH stimulates the prothoracic gland to produce
inactive ecdysone, which is activated in the fat body to 20-hydroxyecdysone (20E). This
steroid induces intermittent larval to larval molts in the presence of juvenile hormone
(JH), also secreted by the corpora cardiaca. Pulses of ecdysone lead to an instar molting.
Page 27
15
Circulation of ecdysone in the absence of juvenile hormone results in pupation, once crit-
ical weight is attained. Insect growth between instars is exponential, most of the growth
occurs in the last larval instar (Edgar 2006).
Early in the last larval instar, a juvenile hormone peak inhibits the secretion of
PTTH and 20E. Soon after, the insect reaches the critical weight, in which feeding and
growth do not affect pupation, then corpora allata stops producing JH. Furthermore, juve-
nile hormone esterase increases dramatically to clear the hormone from the hemolymph.
The secretion of PTTH follows clearance of juvenile hormone during the first photoperi-
odic gate. PTTH stimulates ecdysteroids secretion. Larvae stop feeding and growing as a
consequence, purge their gut of all content, and begin a wandering stage, in search of a
suitable pupation site (Davidowitz and Nijhout 2004, Nijhout and Callier 2015). Adult
size at this point is completely determined (D’Amico et al. 2001).
Thus, for holometabolous insects such as stable flies, adult size is the result of the
larval growth rate, critical weight, and the length of time that the larva takes from critical
weight attainment until they stop feeding. Interactions between these three variables ap-
pear to be determinants of adult size (Nijhout et al. 2006, Parker and Johnston 2006,
Chown and Gaston 2010).
Explanation of the insect growth phenomena can be completed using sigmoidal
growth curves; either in biomass or population. A logistic equation, the Verhulst-Pearl lo-
gistic growth model, in the form of the equation
Equation 1-1
Page 28
16
𝑦 =𝑘
[1 + 𝑒(𝑎−𝑏𝑥)]
fits growth data at a point of inflection on the part of the growth cycle when ap-
proximately 35 to 40% of the total growth has been achieving (Winsor 1932), then satu-
ration level is reached, and growth stops (Tsoularis and Wallace 2002). In the equation, y
represents the population size at a given time; k represents the upper limit of the sig-
moidal curve, the carrying capacity of the population; e is the natural logarithm base; a is
the minimum asymptote of the curve; b is the steepness of the curve, and x is time. This
logistic equation has been used as the basis for several extended models, and it is applica-
ble for modeling natural population or growth in organisms (Tsoularis and Wallace
2002).
1.5 Size in insects
The ecological importance of an organisms size is demonstrated by its effects on
fecundity, longevity, migration ability, competitiveness, metabolic rate, predatory and an-
tipredator capacity, and ability to withstand starvation and desiccation (Atkinson 1994).
In milkweed bugs, body size influences the ability to fly and migrate in mainland
and island populations. Mainland bugs are bigger than island bugs. Dingle et al. 1980
conclude that bigger bugs found in mainland temperate zones have migrations due to sea-
sonal variations. Thus, they need a large body to support flight. Tropical bugs do not en-
counter difficulties finding food, displaying less migratory behavior. Islands also tend to
reduce flight, consequently reducing body size.
Page 29
17
In Lycaenid butterflies Jalmenus evagoras, body size is an important feature of
male and female reproduction and longevity. Larger males show a better reproduction
performance than small ones do; this is because male body size correlates with both lon-
gevity and mating success, two components of lifetime mating success. Female fecundity
is associated with body size, suggesting as well, that body size is a major component of
lifetime reproductive success in this species (Elgar and Pierce 1988). In addition, female
size is a principal constraint on potential insect fecundity, since the number of eggs is a
linear function of the space available within the mother’s body (Honěk 1993).
In odonates, Sokolovska et al. 2000 analyze several studies of the effects of male
and female size on reproductive life. Results indicate that territorial and non-territorial
species are affected in different ways. Body size is positively correlated with territorial
defense, longevity, mating rate, and lifetime reproductive success in territorial males,
whereas, in non-territorial males, size correlates with longevity and lifetime reproductive
success. Size influences female fitness, affecting clutch size, and longevity.
Body size and relative proportions of organs are characteristic features that distin-
guish one species from the next (Mirth and Shingleton 2012). Among species, the range
of body sizes spans six order of magnitude, from bacteria to blue whales. Within species,
size can vary dramatically, suggesting a strong association of the organism with the envi-
ronment (Angilletta and Dunham 2003). Thus, adult size is an inherited attribute of a spe-
cies that varies within a range, according to the environment (Parker and Johnston 2006,
Nijhout and Callier 2015). Factors such as temperature, quality, and quantity of food are
Page 30
18
among the most significant determinants (Davidowitz et al. 2003). Other factors such as
predation, population density, and day length may affect adult size as well.
Two rules explain size variation, one at the phenotypical level and the other at the
genetic level. Bergmann’s rule states that selection at low temperatures will favor large
individuals with a small ratio of surface area to body mass that will reduce heat loss (in
Atkinson and Sibly 1997). The rule elucidates why animals in colder climates and higher
latitudes are larger than animals from the tropics. On the other hand, the temperature-size
rule is a plastic response of insects to seasonal variations, where low rearing temperatures
lead to an increase in adult body size (Diamond and Kingsolver 2010).
Three interaction patterns between body size and temperature are recognized:
bigger is better, hotter is smaller, and hotter is better (Kingsolver and Huey 2008). Large
body size is associated with a better performance - understood as superior reproduction or
enhanced fitness (Forrest 1987, Kingsolver and Huey 2008)- smaller body size is
obtained when reared at higher temperatures, and greater maximal performance is related
to higher temperatures (Kingsolver and Huey 2008).
Although the rules appear contradictory, each rule works at a different level.
Bigger is better describes phenotypic variation within a population, larger individuals
tend to have better fitness than do smaller individuals (Kingsolver and Huey 2008).
Larger body size improves fitness through an increase in fecundity, survival, and mating
success. However, large body size requires longer developmental time, which affects sur-
vival and fecundity, and thus fitness. In conclusion, whether bigger is better depends on
Page 31
19
whether the positive links between size and fitness outweigh the negative ones between
developmental time and body size (Kingsolver and Huey 2008).
Hotter is smaller, or the temperature-size rule proposes that ectotherms that
develop at higher temperatures will be relatively small as adults (Angilletta and Dunham
2003). The temperature-size rule is an example of the phenotypical plasticity attribute of
size in insects: low rearing temperatures typically decrease development rates but
increase body size (Diamond and Kingsolver 2010). If the thermal sensitivity of develop-
ment rate is greater than the thermal sensitivity of growth rate, increased temperature dur-
ing development results in small adult size. Bergmann’s rule explains that individuals
from cooler climates are larger than those from hotter places, an example of the hotter is
smaller rule at the evolutionary level (Kingsolver and Huey 2008).
Hotter is better is described by a specific measure of fitness, the intrinsic rate of
increase –the rate at which populations increase in size. Thus, the hotter rule leads to an
increase of development rate, consequently, reduces developmental and generation times,
which raises the intrinsic rate of increase. Species reared at low temperature have low
growth, low development rate, and long development. Longer development times in-
creases generation time thereby decreasing the rate of population growth (Kingsolver and
Huey 2008).
Quality and quantity of diet affect growth rate, which affects larval size. With a
poor diet, larval instars are smaller in size, which eventually leads to a lower critical
Page 32
20
weight (Parker and Johnston 2006, Chown and Gaston 2010). The Bailout response pro-
posed by Nijhout and Callier (2015) explain how Drosophila responds to food availabil-
ity variation. Starvation triggers metamorphosis but under low nutrition conditions, meta-
morphosis is delayed. This response is an adaptation in species whose larvae are unable
to move to a new food source when the first one runs out. Even low amounts of nutrient
inhibit the bailout response and allow larvae to grow slowly, until they reach their spe-
cies-characteristic size (Nijhout and Callier 2015), enabling growing animals to survive
in environments prone to variations in food availability and quality (Parker and Johnston
2006).
1.6 Gene expression
The genome is a store of biological information saved in codes. Coordinated ac-
tivities of enzymes decipher the codes, resulting in the expression of the genes through
proteins. The initial product of genome expression is the transcriptome, a collection of
RNA molecules derived from those protein-coding genes. These RNA molecules direct
synthesis of final product of genome expression, the proteome, which specifies the nature
of the cell (Brown TA. 2002).
The transcriptome is a complete set of transcripts of a cell, in a specific physio-
logical condition or developmental stage. Understanding the transcriptome is essential for
interpreting the functional elements of the genome, revealing the molecular constituents
of cells and tissues, and comprehending of development and disease. Main objectives of
transcriptome studies are to catalogue all species of transcripts including mRNA, func-
tional RNAs, and small RNAs; to determine the transcriptional structure of genes; and to
Page 33
21
quantify the changing expression levels of transcripts under different conditions (Wang et
al. 2009).
Technologies to deduce and quantify the transcriptome are well established. The
Sanger method, invented by Friedrich Sanger in 1970, uses an enzymatic reaction similar
to DNA replication (Mutz et al. 2013). This method is considered ‘first generation’ tech-
nology (Metzker 2010). Next generation sequencing are newer methods - such as high-
throughput mRNA sequencing (RNA-Seq) - that include various strategies relying on a
combination of template preparation, sequencing and imaging, genome alignment, and
assembly methods (Metzker 2010).
RNA-Seq uses deep sequence technologies. A population of RNA (total or frac-
tioned) is converted to a library of cDNA with adapters attached to one or both ends.
Each sequence is then sequenced in a high-throughput manner to obtain short reads (from
one end called single-end sequence or both ends called pair-end sequencing), from 30 to
400 base pairs (Wang et al. 2009). The first step of RNA-Seq is to sequence short reads
for a further statistical analysis (Martin and Wang 2011).
The transcriptome is an arrangement of RNAs produced in response to the sur-
roundings. If environmental conditions change, the transcriptome will change. Tempera-
ture affects physical performance and reproduction of an insect, thus studying the tran-
scriptome of insects under different thermal parameters may clarify the response of or-
ganisms to their environment. MacMillan et al. (2016) examined the impact of thermal
Page 34
22
adaptation on the transcriptome of Drosophila melanogaster using RNA-Seq. Their re-
sults suggest a reorganization of the muscle fibers, as the genes encoding myosin heavy
chain and both myosin light chain 1 and 2 were upregulated 3.5-fold. Genes encoding tro-
ponin C and T were also upregulated, which facilitate Ca+ mediated muscle contraction.
This muscle reorganization can influence the ability of insects to fly and reproduce in
cold environments. Heat shock proteins were also upregulated in cold-acclimated flies.
These proteins are commonly expressed in response to environmental stress, functioning
as chaperons binding other proteins (Rinehart et al. 2007). Other upregulated genes dur-
ing cold-acclimation are those involved with chitin metabolism, cuticle binding, immun-
ity, and lipid transportation (MacMillan et al. 2016).
Diet is another important aspect of insect life. It influences fitness, size, and de-
velopment. Analysis of gene expression can elucidate gene regulation in insects in re-
sponse to diet. In the tree-killing beetle, Anoplophora glabripennis (Cerambycidae:
Lamiinae), comparative RNA-Seq analysis of larvae fed on two diets (maple and artifi-
cial) revealed upregulation of genes involved in digestion, detoxification of phytochemi-
cals, stress response, nutrient recycling and scavenging, and interactions with microbes in
maple fed larvae. These differences indicate the plasticity of genes involved in digestion
and detoxification. Upregulation of genes to overcome stress can be associated with the
response of the insect to the plant defensive system. Collectively, these results show that
the tree-killing beetle larvae exhibit considerable plasticity related not only to their diges-
tive physiology, but also to basal intracellular processes, such as sugar metabolism, pro-
tein biosynthesis, ATP production, and aerobic respiration.
Page 35
23
Stable flies also adapt and respond to the environment, changing size, or delaying
pupation. Molecular mechanisms of these responses are not yet understood. A better un-
derstanding of the stable fly transcriptome responses to the environment can discover
metabolic pathways, practical for targeting with novel control approaches.
Page 36
24
1.7 References
Albuquerque, T. A., and L. Zurek. 2014. Temporal changes in the bacterial community
of animal feces and their correlation with stable fly oviposition, larval development, and
adult fitness. Front. Microbiol. 5: 1–9.
Angilletta, M. J., and A. E. Dunham. 2003. The temperature-size rule in ectotherms:
Simple evolutionary explanations may not be general. Am. Nat. 162: 332–342.
Atkinson, D. 1994. Temperature and organism size-A biological law for ectotherms?, pp.
1–58. In Adv. Ecol. Res. Academic Press Limited, Cambridge.
Atkinson, D., and R. M. Sibly. 1997. Why are organisms usually bigger in colder
environments? Making sense of a life history puzzle. Trends Ecol. Evol. 12: 235–239.
Axtell, R. C., and W. Chu. 1972. Fine structure of the dorsal organ of the house fly
larva, Musca domestica. Z. Zellforsch. 495: 489–495.
Bailey, D. L., T. L. Whitfield, and B. J. Smittle. 1973. Flight and dispersal of the stable
fly. J. Econ. Entomol. 66: 410–411.
Beresford, D., and J. Sutcliffe. 2008. Stable fly (Stomoxys calcitrans: Diptera,
Muscidae) trap response to changes in effective trap height caused by growing
vegetation. J. Vector Ecol. 33: 40–45.
Berry, I., and S. Kunz. 1978. Oviposition of stable flies in response to temperature and
humidity. Environ. Entomol. 7: 213–216.
Page 37
25
Berry, I. L., D. A. Stage, and J. B. Campbell. 1983. Populations and economic impacts
of stable flies on cattle. Trans. Am. Soc. Ag. Eng. 26: 873–877.
Blanco-Metzler, H., and A. Arguedas-Marin. 2015. Efecto del color de trampa y tipo
de adherente en la captura de Stomoxys calcitrans (L.) (Diptera: Muscidae) en el cultivo
de pina (Ananas comosus) (L.) Merr. Entomol. Mex. 2: 319–324.
Broce, A., and M. S. Haas. 1999. Relation of cattle manure age to colonization by stable
fly and house fly. J. Kansas Entomol. Soc. 1: 60–72.
Brookes, V. J., and G. Fraenkel. 1958. The nutrition of the larva of the housefly, Musca
domestica. Physiol. Zool. 31: 208–223.
Brown TA. 2002. Genomes, 2nd ed. Wiley-Liss, Oxford.
Bruce, W. N., and G. C. Decker. 1958. The relationship of stable fly abundance to milk
production in dairy cattle. J. Econ. Entomol. 51: 269–274.
Byford, R. L., M. E. Craig, and B. L. Crosby. 1992. A review of ectoparasites and their
effect on cattle production. J. Anim. Sci. 70: 597–602.
Campbell, J. B., and I. L. Berry. 1986. Economic threshold for stable flies on confined
cattle, pp. 18–22. In Proceedings of a symposium presented at the National Conference of
the Entomological Society. Current status of stable fly (Diptera: Muscidae) research.
Page 38
26
Campbell, J. B., I. L. Berry, D. J. Boxler, R. L. Davis, D. C. Clanton, and G. H.
Deutscher. 1987. Effects of stable flies (Diptera: Muscidae) on weight gain and feed
efficiency of feedlot cattle. J. Econ. Entomol. 80: 117–9.
Campbell, J. B., S. R. Skoda, D. R. Berkebile, D. J. Boxler, G. D. Thomas, D. C.
Adams, and R. Davis. 2001. Effects of stable flies (Diptera: Muscidae) on weight gains
of grazing yearling cattle. J. Econ. Entomol. 94: 780–783.
Cheng, T.-H. 1958. The effect of biting fly control on weight gain in beef cattle. J. Econ.
Entomol. 51: 1–4.
Chia, L. S., J. A. Baxter, and P. E. Morrison. 1982. Quantitative relationship between
ingested blood and follicular growth in the stable fly, Stomoxys calcitrants. Can. J. Zool.
60: 1917–1921.
Chown, S. L., and K. J. Gaston. 2010. Body size variation in insects: A
macroecological perspective. Biol. Rev. 85: 139–169.
Cook, D. 1997. Stable flies on the Swan Coastal Plain. J. Dep. Agric. 38: 1–6.
Cutkomp, L. K., and A. L. Harvey. 1957. The Weight responses of beef cattle in
relation to control of horn and stable flies. J. Econ. Entomol. 51: 72–75.
D’Amico, L. J., G. Davidowitz, and H. F. Nijhout. 2001. The developmental and
physiological basis of body size evolution in an insect. Proc. Biol. Sci. 268: 1589–1593.
Page 39
27
Davidowitz, G., L. J. D’Amico, and H. F. Nijhout. 2003. Critical weight in the
development of insect body size. Evol. Dev. 5: 188–197.
Davidowitz, G., and H. F. Nijhout. 2004. The physiological basis of reaction norms: the
interaction among growth rate, the duration of growth and body size. Integr. Comp. Biol.
44: 443–449.
Diamond, S. E., and J. G. Kingsolver. 2010. Environmental dependence of thermal
reaction norms: Host plant quality can reverse the temperature-size rule. Am. Nat. 175:
1–10.
Dingle, H., N. R. . Blakley, and E. R. Miller. 1980. Variation in body size and flight
performance in milkweed bugs (Oncopeltus). Evolution (N. Y). 34: 371–385.
Dominghetti, T. F. de S., A. T. M. de Barros, C. O. Soares, P. H. D. Cançado, T. F.
de S. Dominghetti, A. T. M. de Barros, C. O. Soares, and P. H. D. Cançado. 2015.
Stomoxys calcitrans (Diptera: Muscidae) outbreaks: current situation and future outlook
with emphasis on Brazil. Rev. Bras. Parasitol. Veterinária. 24: 387–395.
Dougherty, C. ., F. W. Knapp, P. B. Burrus, D. C. Willis, and P. L. Cornelius. 1995.
Behavior of grazing cattle exposed to small populations of stable flies (Stomoxys
calcitrans L.). Appl. Anim. Behav. Sci. 42: 231–248.
Dougherty, C. T., F. W. Knapp, P. B. Burrus, D. C. Willis, and P. L. Cornelius.
1994. Moderation of grazing behavior of beef cattle by stable flies (Stomoxys calcitrans
L). Appl. Anim. Behav. Sci. 40: 113–127.
Page 40
28
Dougherty, C. T., F. W. Knapp, P. B. Burrus, D. C. Willis, P. L. Cornelius, and N.
W. Bradley. 1993. Stable flies (Stomoxys calcitrans L.) and the behaviour of grazing
beef cattle. Appl. Anim. Behav. Sci. 38: 191–212.
Drummond, R. O., G. Lambert, J. H. E. Smalley, and C. E. Terrill. 1981. Estimated
losses of livestock to pests, pp. . In D. Pimentel (ed.), pp. 111–127. In CRC Handb. Pest
Manag. Agric. Boca Raton, FL.
Edgar, B. a. 2006. How flies get their size: genetics meets physiology. Nat. Rev. Genet.
7: 907–916.
Elgar, M. A., and N. E. Pierce. 1988. Mating success and fecundity in an ant-tended
lycaenid butterfly, pp. 59–75. In Reprod. Success Stud. Individ. Var. Contrasting Breed.
Syst. The University of Chicago Press, Chicago.
Environmental Protection Agency. 2011. Beef Checkoff. U.S. cash Receipt. from
farming. (http://www.epa.gov/agriculture/ag101/beefbackgroun). Date accessed March
2014.
Estienne, M. J., F. W. Knapp, J. a Boling, and J. G. Burg. 1991. Physiological and
nutritional responses of beef steers exposed to stable flies (Diptera: Muscidae). J. Econ.
Entomol. 84: 1262–5.
Foil, L. D., and J. Hogsette. 1994. Biology and control of tabanids, stable flies and horn
flies. Rev. Sci. Tech. Int. Epiz. 13: 1125–1158.
Page 41
29
Forrest, T. G. 1987. Insect size tactics and developmental strategies. Oecologia. 73:
178–184.
Friesen, K., H. Chen, J. Zhu, and D. B. Taylor. 2015. External morphology of stable
fly (Diptera: Muscidae) larvae. J. Med. Entomol. 52: 626–637.
Geden, C. J., and J. A. Hogsette. 2006. Suppression of house flies (Diptera: Muscidae)
in Florida poultry houses by sustained releases of Muscidifurax raptorellus and
Spalangia cameroni (Hymenoptera: Pteromalidae). Environ. Entomol. 35: 75–82.
Gerry, A. C., N. G. Peterson, and B. A. Mullens. 2005. Predicting and controlling
stable flies on California dairies. ANR Publ. 8258: 1–11.
Gilles, J., J. F. David, G. Duvallet, S. De La Rocque, and E. Tillard. 2007. Efficiency
of traps for Stomoxys calcitrans and Stomoxys niger niger on Reunion Island. Med. Vet.
Entomol. 21: 65–69.
Greene, G. L., J. A. Hogsette, and R. S. Patterson. 1989. Parasites that attack stable fly
and house fly (Diptera: Muscidae) puparia during the winter on dairies in northwestern
Florida. J. Econ. Entomol. 82: 412–415.
Gullan, P. J., and P. S. Craston. 2010. The Insects: An outline of entomology, 4th ed.
John Wiley & Sons.
Page 42
30
Hall, R. D., G. D. Thomas, and M. C. E. 1982. Stable fly, Stomoxys calcitrans (L.),
breeding in large round hay bales: initial associations (Diptera: Muscidae). J. Kansas
Entomol. Soc. 55: 617–620.
Harris, R. L., E. D. Frazar, P. D. Grossman, and O. H. Graham. 1966. Mating habits
of the stable fly. J. Econ. Entomol. 59: 634–636.
Hogsette, J. A., J. P. Ruff, and C. J. Jones. 1987. Stable fly biology and control in
northwest Florida. J. Agric. Entomol. 4: 1–11.
Honěk, A. 1993. Intraspecific variation in body size and fecundity in insects : A general
relationship. Oikos. 66: 483–492.
Huckett, H. C., and J. R. Vockeroth. 2013. Muscidae, pp. 1115–1132. In Manual of
Nearctic Diptera. Canada Communication Group, Ottawa, Ontario.
Kamut, M., and T. Jezierski. 2014. Ecological, behavioural and economic effects of
insects on grazing farm animals – a review. Anim. Sci. Pap. Reports. 32: 107–119.
Kingsolver, J. G., and R. B. Huey. 2008. Size, temperature, and fitness: three rules.
Evol. Ecol. Res. 10: 251–268.
Kunz, S. E., K. D. Murrell, G. Lambert, L. F. James, and C. E. Terrill. 1991.
Estimated losses of livestock to pests, 2nd ed, CRC Handb. Pest Manag. Agric. In D.
Pimentel (Ed.), Boca Raton, FL.
Page 43
31
Lazarus, W. F., D. A. Rutz, R. W. Miller, and D. A. Brown. 1989. Costs of existing
and recomended manure management practices for house fly and stable fly control on
dairy farms. J. Econ. Entomol. 82: 1145–1151.
Lohmeyer, K. H., J. M. Pound, K. M. Yeater, and M. A. May. 2014. Efficacy of
novaluron as a feed-through for control of immature horn flies, house flies, and stable
flies (Diptera: Muscidae) developing in cow manure. J. Med. Entomol. 51: 873–7.
Lysyk, T. J. 1995. Temperature and population density effects on feeding activity of
Stomoxys calcitrans (Diptera: Muscidae) on cattle. J. Med. Entomol. 32: 508–14.
Lysyk, T. J. 1998. Relationships between temperature and life-history parameters of
Stomoxys calcitrans (Diptera: Muscidae). J. Med. Entomol. 35: 107–19.
Lysyk, T. J., L. Kalischuk-Tymensen, L. B. Selinger, R. C. Lancaster, L. Wever, and
K. J. Cheng. 1999. Rearing stable fly larvae (Diptera: Muscidae) on an egg yolk
medium. J. Med. Entomol. 36: 382–8.
Machtinger, E. T., C. J. Geden, P. E. Kaufman, and A. M. House. 2015. Use of pupal
parasitoids as biological control agents of filth flies on equine facilities. J. Integr. Pest
Manag. 6: 16.
Machtinger, E. T., N. C. Leppla, and J. A. Hogsette. 2016. House and stable fly
seasonal abundance, larval development substrates, and natural parasitism on small
equine farms in Florida. Neotrop. Entomol. 45: 433–440.
Page 44
32
MacMillan, H. A., J. M. Knee, A. B. Dennis, H. Udaka, K. E. Marshall, T. J. S.
Merritt, and B. J. Sinclair. 2016. Cold acclimation wholly reorganizes the Drosophila
melanogaster transcriptome and metabolome. Sci. Rep. 6: 28999.
Martin, J. a, and Z. Wang. 2011. Next-generation transcriptome assembly. Nat. Rev.
Genet. 12: 671–682.
McKay, T., and T. Galloway. 1999. Survey and release of parasitoids (Hymenoptera)
attacking house and stable flies (Diptera: Muscidae) in dairy operations. Can. Entomol.
133: 743–756.
Metzker, M. L. 2010. Sequencing technologies - the next generation. Nat. Rev. Genet.
11: 31–46.
Meyer, J. A., B. A. Mullens, T. L. Cyr, and C. Stokes. 1990. Commercial and naturally
occurring fly parasitoids (Hymenoptera: Pteromalidae) as biological control agents of
stable flies and house flies (Diptera: Muscidae) on California dairies. J. Econ. Entomol.
83: 799–806.
Meyer, J. A., and J. J. Petersen. 1983. Characterization and seasonal distribution of
breeding sites of stable and house flies (Diptera: Muscidae) associated with confined
livestock in eastern Nebraska. J. Econ. Entomol. 76: 103–108.
Meyer, J. A., and T. A. Shultz. 1990. Stable fly and house fly breeding sites on dairies.
Calif. Agric. 44: 28–29.
Page 45
33
Miller, R. W. 1994. Inhibition of house flies and stable flies (Diptera: Muscidae) in field-
spread dairy bedding from cattle treated with Diflubenzuron boluses. J. Econ. Entomol.
87: 402–404.
Miller, R. W., L. G. Pickens, N. O. Morgan, R. W. Thimijan, and R. L. Wilson.
1973. Effect of stable flies on feed intake and milk production of dairy cows. J. Econ.
Entomol. 66: 711–3.
Miller, R. W., R. D. Williams, H. R. E, L. G. Pickens, and K. A. Doisy. 1991.
Diflubenzuron boluses for fly control on dairy cattle. J. Agric. Entomol. 8: 117–126.
Mirth, C. K., and A. W. Shingleton. 2012. Integrating body and organ size in
Drosophila: Recent advances and outstanding problems. Front. Endocrinol. (Lausanne).
3: 1–13.
Mora, S., H. Calvache, F. Alvañil, J. Torres, A. Verdugo, and J. Luna. 1997. La
mosca de los establos Stomoxys calcitrans (L.)(Diptera: Muscidae), en palma de aceite.
Palmas. 18: 31–42.
Mullen, G., and L. Durden. 2009. Medical and veterinary entomology, 2nd ed.
Academic press, San Diego, CA.
Mullens, B. A., K.-S. Lii, Y. Mao, J. A. Meyer, N. G. Peterson, and C. E. Szijj. 2006.
Behavioural responses of dairy cattle to the stable fly, Stomoxys calcitrans, in an open
field environment. Med. Vet. Entomol. 20: 122–37.
Page 46
34
Mutz, K.-O., A. Heilkenbrinker, M. Lonne, J.-G. Walter, and F. Stahl. 2013.
Transcriptome analysis using next-generation sequencing. Curr. Opin. Biotechnol. 24:
22–30.
National Cattlemen’s Beef Association. 2014. Beef industry statistics. Beef cattle Inf.
(http://www.nebeef.org/the-beef-story/state-national-facts). Date accesed May 2014.
Nijhout, H. F. 2003. The control of body size in insects. Dev. Biol. 261: 1–9.
Nijhout, H. F., and V. Callier. 2015. Developmental mechanisms of body size and
wing-body scaling in insects. Annu. Rev. Entomol. 60: 141–156.
Nijhout, H. F., G. Davidowitz, and D. a Roff. 2006. A quantitative analysis of the
mechanism that controls body size in Manduca sexta. J. Biol. 5: 16.
Parker, J., and L. a Johnston. 2006. The proximate determinants of insect size. J. Biol.
5: 15.
Pitzer, J. B., P. E. Kaufman, and S. H. Tenbroeck. 2010. Assessing permethrin
resistance in the stable fly (Diptera: Muscidae) in Florida by using laboratory selections
and field evaluations. J. Econ. Entomol. 103: 2258–2263.
Rinehart, J. P., A. Li, G. D. Yocum, R. M. Robich, S. a. L. Hayward, and D. L.
Denlinger. 2007. Up-regulation of heat shock proteins is essential for cold survival
during insect diapause. Proc. Natl. Acad. Sci. 104: 11130–11137.
Page 47
35
Romero, A., A. Broce, and L. Zurek. 2006. Role of bacteria in the oviposition
behaviour and larval development of stable flies. Med. Vet. Entomol. 20: 115–21.
Schmidtmann, E. T., and P. A. W. Martin. 1992. Relationship between selected
bacteria and the growth of immature house flies, Musca domestica, in an axenic test
system. J. Med. Entomol. 29: 232–235.
Schwinghammer, K. a, F. W. Knapp, J. a Boling, and K. K. Schillo. 1986.
Physiological and nutritional response of beef steers to infestations of the stable fly
(Diptera: Muscidae). J. Econ. Entomol. 79: 1294–8.
Schwinghammer, K., F. W. Knapp, and J. Boling. 1987. Physiological and nutritional
response of beef steers to combined infestations of horn fly and stable fly (Diptera:
Muscidae). J. Econ. Entomol. 80: 120–5.
Scully, E., K. Friesen, B. Wienhold, and L. M. Durso. 2017. Microbial communities
associated with stable fly (Diptera: Muscidae) larvae and their developmental substrates.
Ann. Entomol. Soc. Am. 110: 61–72.
Skevington, J. H., and P. T. . Dang. 2002. Exploring the diversity of flies. Biodiversity.
3: 3–27.
Skoda, S. R., G. D. Thomas, and J. B. Campbell. 1991. Developmental sites and
relative abundance of immature stages of the stable fly (Diptera: Muscidae) in beef cattle
feedlot pens in eastern Nebraska. J. Econ. Entomol. 84: 191–197.
Page 48
36
Skovgård, H., and G. Nachman. 2004. Biological control of house flies Musca
domestica and stable flies Stomoxys calcitrans (Diptera: Muscidae) by means of
inundative releases of Spalangia cameroni (Hymenoptera: Pteromalidae). Bull. Entomol.
Res. 94: 555–567.
Sokolovska, N., L. Rowe, and F. Johansson. 2000. Fitness and body size in mature
odonates. Ecol. Entomol. 25: 239–248.
Solórzano, J.-A., J. Gilles, O. Bravo, C. Vargas, Y. Gomez-Bonilla, G. V. Bingham,
and D. B. Taylor. 2015. Biology and trapping of stable flies (Diptera: Muscidae)
developing in pineapple residues (Ananas comosus) in Costa Rica. J. Insect Sci. 15: 145.
Solórzano, J. A. 2014. Manejo integrado de la mosca del establo, Stomoxys calcitrans,
en Costa Rica. Instituto Nacional de Innovación y Transferencia en Tecnología
Agropecuaria. 1-16.
Srinivasan, R., and D. D. Amalraj. 2003. Efficacy of insect parasitoid Dirhinus
himalayanus (Hymenoptera: Chalcididae) & insect growth regulator, triflumuron against
house fly, Musca domestica (Diptera: Muscidae). Indian J. Med. Res. 118: 158–166.
Stehr, F. W. 2009. Encyclopedia of insects, 2nd ed. Academic press, San Diego, CA.
Stoffolano, J. G. 1970. The anal organ of larvae of Musca autumnalis, M. domestica, and
Orthellia caesarion (Diptera: Muscidae). Ann. Entomol. Soc. Am. 63.
Page 49
37
Talley, J., A. Broce, and L. Zurek. 2009. Characterization of stable fly (Diptera:
Muscidae) larval developmental habitat at round hay bale feeding sites. J. Med. Entomol.
46: 1310–9.
Taylor, D. B., and D. R. Berkebile. 2006. Comparative efficiency of six stable fly
(Diptera: Muscidae) traps. J. Econ. Entomol. 99: 1415–1419.
Taylor, D. B., and D. R. Berkebile. 2008. Sugar feeding in adult stable flies. Environ.
Entomol. 37: 625–9.
Taylor, D. B., K. Friesen, J. J. Zhu, and K. Sievert. 2012. Efficacy of Cyromazine to
control immature stable flies (Diptera : Muscidae) developing in winter hay feeding sites.
J. Econ. Entomol. 105: 726–731.
Taylor, D. B., R. D. Moon, and D. R. Mark. 2012. Economic impact of stable flies
(Diptera: Muscidae) on dairy and beef cattle production. J. Med. Entomol. 49: 198–209.
Todd, D. H. 1964. The biting fly Stomoxys calcitrans (L.) in dairy herds in New Zealand.
New Zeal. J. Agric. Res. 7: 60–79.
Tsoularis, A., and J. Wallace. 2002. Analysis of logistic growth models. Math. Biosci.
179: 21–55.
Venkatesh, K., and P. E. Morrison. 1980. Some aspects of oogenesis in the stable fly. J.
Insect Physiol. 26: 711–715.
Page 50
38
Wang, Z., M. Gerstein, and M. Snyder. 2009. RNA-Seq: a revolutionary tool for
transcriptomics. Nat. Rev. Genet. 10: 57–63.
Weinzierl, R., and C. J. Jones. 1998. Releases of Spalangia nigroaenea and
Muscidifurax zaraptor (Hymenoptera: Pteromalidae) increase rates of parasitism and
total mortality of stable fly and house fly (Diptera: Muscidae) pupae in Illinois cattle
feedlots. J. Econ. Entomol. 91: 1114–1121.
Wieman, G., J. B. Campbell, J. Deshazer, and I. L. Berry. 1992. Effects of stable flies
(Diptera: Muscidae) and heat stress on weight gain and feed efficiency of feeder cattle. J.
Econ. Entomol. 85: 1835–1842.
Wienhold, B. J., and D. B. Taylor. 2012. Substrate properties of stable fly (Diptera:
Muscidae) developmental sites associated with round bale hay feeding sites in eastern
Nebraska. Environ. Entomol. 41: 213–221.
Winsor, C. P. 1932. The Gompertz curve as a growth curve. Proc. Natl. Acad. Sci. 18:
1–8.
Wright, J. E. 1974. Insect growth regulators: laboratory and field evaluators of
thompson-hayward th-6040 against the house fly and the stable fly. J. Econ. Entomol. 67:
746–747.
Yang, A. S. 2001. Modularity, evolvability, and adaptive radiations: A comparison of the
hemi- and holometabolous insects. Evol. Dev. 3: 59–72.
Page 51
39
Yeates, D. K., B. M. Wiegmann, G. W. Courtney, and R. Meier. 2007. Phylogeny and
systematics of Diptera: Two decades of progress and prospects. Zootaxa. 1668: 565–590.
Zumpt, F. 1973. Stomoxyinae biting flies of the world, First. ed. Universitätsdruckerei
Mainz, Germany.
Page 52
40
CHAPTER 2 EFFECTS OF TEMPERATURE AND DIET IN
STABLE FLY (DIPTERA: MUSCIDAE) DEVELOPMENT
2.1 Introduction
Stable flies, Stomoxys calcitrans (Diptera: Muscidae), are cosmopolitan ectopara-
sites of livestock. Their blood feeding is painful and distracts animals from eating and
drinking. Moreover, animals spend energy in defensive behaviors (Todd 1964, Miller et
al. 1973, Dougherty et al. 1993, 1994, 1995). In cattle, stable flies can decrease weight
gain and milk production (Bruce and Decker 1958, Wieman et al. 1992, Campbell et al.
2001), costing the cattle industry $2.2 billion dollars annually in the U.S (Taylor et al.
2012).
While stable fly development in pastures is poorly understood, we do know that
larvae develop in a variety of substrates with active bacterial communities (Lysyk et al.
1999, Romero et al. 2006), and that moist areas with crop residues (Cook 1997),
accumulations of spilled feed or silage (Meyer and Petersen 1983) are suitable habitat. In
the central U.S, stable flies are increasingly recognized as pests of pastured cattle, associ-
ated with the use of hay bale feeders during winter (Broce et al. 2005). Wasted hay fall-
ing from animal’s mouth and the residues from the feeder itself mix with urine and ma-
nure, creating an excellent developmental substrate for stable flies the next season. In Ne-
braska, stable fly populations are known to increase rapidly at the beginning of June
(Taylor and Berkebile 2011) in locations where winter hay bale feeders have been used
(Hall et al. 1982, Broce et al. 2005). Primary sources of fall stable flies have yet to be
identified.
Page 53
41
Temperature and nutrition influence insect development (Davidowitz et al. 2003).
For stable flies, developmental times range from < 12 d at 35°C to more than 60 d at 15
°C (Lysyk 1998). Pupal survival is greatest at 30°C and adult survival at 24°C (Kunz et
al. 1977). However, no one has studied the influence of nutrition in their development
and its interaction with temperature. In Lepidoptera, nutrition affects survival, melaniza-
tion, immunity (Lee et al. 2008, Krams et al. 2015), and size (Diamond and Kingsolver
2010). In insects that develop in ephemeral substrates, such as stable flies, running out of
food may trigger a Bailout response (Nijhout and Callier 2015), where time to pupation
and adult emergence is reduced. This response may have adverse consequences for size.
Body size is one of the most important life history characters of an organism
(D’Amico et al. 2001). It influences migration ability, fecundity, predatory and antipreda-
tor capacity, competitiveness, and tolerance to stressors (Atkinson 1994). Within a spe-
cies-specific size range, size results from a complex set of physiological interactions,
where the environment influences how much the insect will grow. When variations in
food or temperature occur, size can vary greatly, showing the plasticity of the trait
(Parker and Johnston 2006, Nijhout and Callier 2015).
Body size is positively correlated to wing growth in insects (Nijhout and Callier
2015). Thus, wing length is a good indicator of the effects of food and temperature on
size and wing venation provides consistent landmarks for measurements. Furthermore,
wings are a two-dimensional structure, which reduces digitizing error (Dujardin 2008).
We chose to measure the discal cell so that specimens with damage on the wing margins
could still be used.
Page 54
42
Statistical models have been used to explain insect development. Lysyk (1998)
used a model to described temperature effect on stable fly development. Boetel et al.
(2003) applied a logistic model to described sigmoid population growth curves, and find
differences in adult emergence of northern and western corn rootworms. Both models
have proved functionality in explaining insect development under experimental condi-
tions.
Wild stable flies show great variation in wing size in Nebraska. Discal medial cell
length of flies collected in emergence and sticky traps, range from 1.71 to 3.65mm (Tay-
lor unpublished data). Variation in temperature and nutrition during development may ex-
plain size variation. The objective of this study was to describe the effects of temperature,
nutrition, and their interaction on stable fly developmental parameters.
2.2 Materials and methods
Stable flies. Eggs of stable flies were collected from the Prairieland colony main-
tained by the Agroecosystem Management Research Unit at the University of Nebraska-
Lincoln (Berkebile et al. 2009). The colony, established in 2014, is maintaine at 23±2 °C,
30-50% RH and a 12L:12D photoperiod. Experimental diets were prepared using wheat
bran, fish meal, and vermiculite in different proportions (Table 1).
Treatments. Laboratory standard diet, considered optimal for stable fly develop-
ment, was compared against three suboptimal diets (Table 1). Each diet mixture, 60 g,
was combined with 36 mL of water and placed in a 5oz. plastic cup. Each cup was seeded
Page 55
43
with ~ 150 eggs. Cups were covered with a piece of cloth held in place with a rubber
band.
Four cups (replicates) of each diet were randomly assigned to growth chambers
with temperatures of 15, 20, 25, 30, and 35°C. Moisture levels of media were checked
visually, twice per week, and water was added to retain original consistency. Trays of
water with sponges were placed in the incubators to maintain humidity. Cups were
checked for puparation every other day. Puparia were individually placed in wells of a
microplate with featherweight forceps and kept in the same growth chamber. Plates were
checked every other day for adult emergence. A completely randomized design with five
temperatures and four diets was used, for 20 treatment combinations. Four replicate cups
per treatment were used. The experiment was repeated twice.
Wings. Once adults died inside of the microplates, the right wing of each insect
was removed, placed on a sticky card, and covered with transparent plastic. Measurement
of the discal cell length was performed with a Dino Lite® 2.0 digital microscope (AnMo
Electronics Corporation) by one technician only to reduce digitization error. The digital
microscope projected the image of the wing at 50x, the measurement was taken from the
inner to the outer corner of the discal medial cell (Fig. 1).
Page 56
44
2.3 Statistical analysis
Stable flies development
Lysyk, (1998), developed a model that uses the median pupation and total devel-
opmental times as response variables to study the effects of temperatures on stable fly de-
velopment. Comparison of standard diet results of this experiment with Lysyk, 1998, al-
lowed validation. Then, the Lysyk model was applied to suboptimal diets to see univer-
sality of the model, with respect to diet quality.
A second model was used to account for the effects of diet and its interaction with
temperature. The Boetel et al. (2003) model uses sigmoid growth curves of cumulative
developmental time to compare stressor effects and their interaction on insect develop-
ment. Both models-Lysyk (1998) and Boetel et al (2013) -will be reference through the
text as Lysyk and Boetel models.
Lysyk model:
The relationship between median pupariation and adult emergence times and the
temperature was established by fitting the model:
Equation 2-1
𝑦(𝜃) = 𝑎0 + 𝑎1𝜃 +𝑎2
𝜃
where y(𝜃) is the median developmental time at temperature 𝜃 (°C) and 𝑎0, 𝑎1,
𝑎2 are parameters determined using nonlinear regression with observed median puparia-
tion and emergence as dependent variables (Allen et al. 1995, Lysyk 1998). Values were
Page 57
45
used to predict median developmental time at specific temperatures. Correlation of pre-
dicted and observed median developmental times of each diet under five temperatures
were evaluated by an analysis of covariance.
Boetel model
A sigmoid population growth model was used to determine the effect of tempera-
ture and nutrient levels in pupation and emergence of flies (Dybing et al. 1988, Boetel et
al. 2003):
Equation 2-2
𝑐𝑢𝑚 =𝑎
[1 + 𝑒(𝑏+𝑐𝑥)]
Where 𝑎 = final cumulative fly pupation and emergence count (number of pupae
or adult flies), 𝑒 = the logarithmic constant, 𝑏 and 𝑐 = constants derived through PROC
NLR (SAS 9.4, SAS 2012) and 𝑥 = days. Population growth curves were obtained (Fig.
2.).
The descriptive variables (𝑚𝑎𝑥𝑐𝑜𝑢𝑛𝑡, 𝑚𝑎𝑥𝑡𝑖𝑚𝑒, 𝑜𝑛𝑠𝑒𝑡, 𝑒𝑛𝑑, 𝑎𝑛𝑑 𝑑𝑢𝑟𝑎𝑡𝑖𝑜𝑛)
of pupation and adult emergence growth curves, graphically depicted in figure 2, were
calculated using constants obtained with Boetel et al (2013) model.
Maximum count (maxcount) is the maximum point of increase, used as an indica-
tor for survival, was estimated by
Equation 2-3
𝑚𝑎𝑥𝑐𝑜𝑢𝑛𝑡 =𝑎
2
Page 58
46
Maximum time (maxtime) is the time in days to reach maximum count, calculated
as
Equation 2-4
𝑚𝑎𝑥𝑡𝑖𝑚𝑒 =𝑏
−𝑐
Onset (onset) is the number of days elapsed before attaining linear increase was
calculated as
Equation 2-5
𝑜𝑛𝑠𝑒𝑡 =𝑏 − 2
−𝑐
End (end) is the number of days to the end of the linear increase, determined by
Equation 2-6
𝑒𝑛𝑑 =𝑏 + 2
−𝑐
Duration (duration) is time from onset to end, calculated as
Equation 2-7
𝑑𝑢𝑟𝑎𝑡𝑖𝑜𝑛 =4
−𝑐
Comparisons of maxcount, maxtime, onset, end, and duration among treatments
were performed with generalized linear mixed models, assuming negative bionamial dis-
tribution (PROC GLIMMIX; SAS 9.4), with temperature and diet as discontinuous inde-
pendent variables. Effects were evaluated using the contrast statement.
Stable fly wings size.
Effects of temperature and diet on wing length were evaluated with ANOVA us-
ing a Gaussian distribution, taking into account the temperature and diet as fixed effects
Page 59
47
and experiments as random effects with a generalized linear mixed models (PROC
GLIMMIX SAS 9.4, SAS 2012).
2.4 Results
Lysyk model results
Temperature effects on stable fly development were significant. With standard
diet, median pupariation time ranged from 12 days at 35°C to 68 days at 15°C. With diet
4, pupation ranged from 17 days at 35 °C to 73 days at 15°C. Additionally, temperature
affects time to adult emergence in similar fashion. Flies reared on standard diet developed
between 14 d at 35°C and 77 d at 15°C. Flies reared in diet 3 exhibited adult emergence
time from 11 days at 35°C to 59 days at 15°C. Too few flies emerged from diet 4 to make
reliable estimates of emergence. The model accounted for 98% of the variance in median
pupariation time and adult emergence times (p<0.05, Fig. 3).
Boetel model results
Few pupae and adults developed from the diet 4 at all temperature treatments
(maxcount pupae=4 and maxcount adults=2). Therefore, diet 4 was not included in the
analysis.
Temperature effects
Temperature affected larval survival (F=10.80, df=4, 30 p <0.05), beginning of
pupariation (F=91.34, df=4, 30 p<0.05), termination of pupariation (F=121.54, df=4, 30
p<0.05), and duration of pupariation period (F=31.40, df=4, 30 p<0.05) (Fig. 4). Larval
survival was 60% greater at temperatures above 20°C. Additionally, flies pupariated 89%
Page 60
48
faster at 30°C than at 15°C (p<0.05). Low temperatures slow development, as well as in-
creases the duration of the pupariation period.
Temperature also influenced adult survival (F=7.08, df=4, 23, p<0.05) and
emergence. The highest adult emergence was observed at 30°C, over two-fold that at
25°C (p<0.05), which produced the lowest emergence. 15 °C could not be estimated be-
cause of the low number of adults that emerged.
Diet effects
Diet had a significant effect on larval survival (F=5.13, df=2, 30, p=0.01, Fig 2.4)
and pupariation onset (F=5.50, df=2, 30, p=0.009). Survival decreased 72% when reared
on poor diet. Larvae developing in poor diet initiated pupariation 25% earlier than those
reared in standard diet. Diet also influenced survival to adulthood (F=4.84, df=2, p=0.01),
although, had no effect in the end and duration of pupariation.
Diet x temperature interaction effects
The interaction between diet and temperature was significant for adult emergence
time (F=4.67, df=7, 23, p<0.05), beginning of emergence (F=2.97, df=7, 23, p<0.05) and,
end of emergence (F=4.4, df=7, 23, p<0.05) (Fig. 5). At ≤ 20°C, flies emerged different
depending on the diet: in combination with diet 2, emergence ended at 70 days, but when
reared in combination with standard diet, that time was reduced to half. The duration of
the emergence period was not affected by either diet (F=1.81, df=2, 23, p=0.18), tempera-
ture (F=1.60, df=4, 23, p=0.20), or their interaction (F=2.15, df=7, 23, p=0.07).
Page 61
49
Effects on wing size
The main driver of size variation was diet (F=32.62, df=2, p<0.05), largest flies
developed in standard diet, followed by flies reared on diet 2, and flies on diet 3.
However, the interaction of diet and temperature affected the size as well (F=43.87, df=7,
p<0.05). The largest flies were observed with standard diet at 20°C and 25°C. The small-
est flies emerged in treatment combinations with diet 3 exposed to 20°C (p<0.05) and
25°C ( p<0.05) (Fig. 6). Diet 3 at 15°C did not produce any adults. Thus, comparison
with this treatment combination is not possible.
2.5 Discussion
In this study, we compared two statistical approaches to analyze stable fly larval
and adult developmental parameters. We also analyzed wing length as an indicator of
stressor effects on stable fly development. Lysyk and Boetel models fitted the observed
data and explained relationship between variables.
The Lysyk model demonstrated that temperature leads development of stable
flies. Temperature decreases pupariation time of stable flies, as well as median develop-
mental times, which ranged between 14 and 77 days, and development was fastest at
30°C, in agreement with Lysyk’s (1998) findings. This model fits our data, and it can
predict developmental time of stable fly larvae exposed to different temperatures, inde-
pendently of diet. Further, computation of median pupariation time and total develop-
mental time, allows calculation of the duration of pupariation. For instance, at 35°C, flies
pupated at day 12, and emerged at day 15, thus pupal development took three days. At 15
°C, pupariation occurred at day 68, but emergence at day 77.
Page 62
50
Results from the Boetel model were similar, the variance in pupariation increases
with low temperature. One of the variables calculated by this model was duration of pu-
pation, at 30°C flies pupariated within two days, but at 15°C pupation took over 30 days.
In addition, descriptive variables of pupation and adult emergence growth curves help to
conclude that temperature affects larval development and diet interacts with temperature
to affect pupation onset; interaction of the two factors determine when the larva enters
pupation.
Although several authors (Berry, Kunz, et al. 1976, Berry and Kunz 1977, Kunz
et al. 1977, Beerwinkle et al. 1978) investigated the effect of temperature on stable flies
development, our study considered nutritional quality and temperature diet interaction.
Sutherland (1978) concluded that larval nutrition influences pupal mortality. That and
other studies (Berry, Foerster, et al. 1976, Berry, Kunz, et al. 1976, Berry and Kunz 1977,
Kunz et al. 1977, Beerwinkle et al. 1978) did not take nutritional variation as a fixed fac-
tor in their analyses. Diet 4 at 15°C, poorly supported the stable flies development, sug-
gesting the nutritional - thermal low threshold of development. The lack of nutrients for
larvae development or food to support an active microbial community that may produce
metabolites for larvae, may explain the failure of development in diet 4.
Diet influences the onset of pupation, larvae that developed in diet 2 and 3 initi-
ated metamorphosis faster, a sign of the bailout response (Nijhout and Callier 2015). Fast
growth reduces exposure time to predators and ensures earlier reproductive output
(Metcalfe and Monaghan 2001). However, fast growth may decrease size, which can re-
duce reproductive success. Insects that develop in ephemeral substrates, such as stable
flies, need to balance the situation, to spend enough time acquiring the right size. These
Page 63
51
insects cannot spare development time unnecessary if that will not represent a competi-
tive advantage later in adulthood.
Stable fly development is affected by temperature and diet interaction in complex
ways, where size, developmental rate, and survival are visible outcomes. Variations in
growth and development rate may explain size changes. In this sutdy, high temperatures
combined with standard diet increased the development rate, which could lead to a reduc-
tion in size because of the faster development, results that agreed with the temperature-
size rule: at high temperatures, organisms attain a smaller adult size (Atkinson 1994), a
phenotypical expression. However, flies reared in diet 3 at ≥ 30°C were bigger than flies
at ≤25°C in the same diet, violating the temperature-size rule. Similar results were
obtained by Diamond and Kingsolver 2010 in Manduca sexta reared at different tempera-
tures and two diets, high and low quality. They showed that interaction of stressful condi-
tions such as thermal stress in addition to the low food quality could reverse the tempera-
ture-size rule.
Results from this experiment show the influence of the environment in insects.
Stable flies are dependent on the temperature and food resources to successfully finish
their life cycle. At high temperatures, development is faster but size is reduced. At low
temperatures, development is slower, they are more exposed to predators, but size in-
creases, thus reproductive success may also increase. Although, the interactions change
when food is limited, it is better to grow at small size for an opportunity to reproduce.
Understanding of stable flies biology helps to discern population dynamics. Stable flies
exhibit an evolutive plasticity allowing successful development in a variety of conditions.
Page 64
52
This plasticity may account for their global colonization and prevalence in a variety of
habitats. Trade-offs between fast growth and small size, and slow growth and larger size
on stable flies, needs further study. Studies that compare stable flies size from field are
required to understand their phenology and how these conclusions may apply.
Page 65
53
2.6 References
Allen, J. C., Y. Yang, and J. L. Knapp. 1995. Temperature effects on development and
fecundity of the citrus rust mite (Acari: Eriophyidae). Environ. Entomol. 24: 996–1004.
Atkinson, D. 1994. Temperature and organism size-A biological law for ectotherms?, pp.
1–58. In Adv. Ecol. Res. Academic Press Limited, Cambridge.
Beerwinkle, K. R., I. L. Berry, and S. E. Kunz. 1978. Prediction models for mortality
of immature stable flies caused by cold temperatures. Environ. Entomol. 7: 273–277.
Berkebile, D. R., A. P. Weinhold, and D. B. Taylor. 2009. A new method for collecting
clean stable fly (Diptera: Muscidae) pupae of known age. Southwest. Entomol. 34: 469–
476.
Berry, I. L., K. W. Foerster, and E. H. Ilcken. 1976. Prediction model for development
time of stable flies. Trans. ASAE. 123–127.
Berry, I. L., and S. E. Kunz. 1977. Mortality of adult stable flies. Environ. Entomol. 6:
569–574.
Berry, I. L., S. E. Kunz, and K. W. Foerster. 1976. A dynamic model of the
physiological development of immature stable flies. Ann. Entomol. Soc. Am. 70: 173–
176.
Page 66
54
Boetel, M. A., B. W. Fuller, and P. D. Evenson. 2003. Emergence of adult northern and
western corn rootworms (Coleoptera: Chrysomelidae) following reduced soil insecticide
applications. J. Econ. Entomol. 96: 714–729.
Broce, A. B., J. Hogsette, and S. Paisley. 2005. Winter feeding sites of hay in round
bales as major developmental sites of Stomoxys calcitrans (Diptera: Muscidae) in
pastures in spring and summer. J. Econ. Entomol. 98: 2307–2312.
Bruce, W. N., and G. C. Decker. 1958. The relationship of stable fly abundance to milk
production in dairy cattle. J. Econ. Entomol. 51: 269–274.
Campbell, J. B., S. R. Skoda, D. R. Berkebile, D. J. Boxler, G. D. Thomas, D. C.
Adams, and R. Davis. 2001. Effects of stable flies (Diptera: Muscidae) on weight gains
of grazing yearling cattle. J. Econ. Entomol. 94: 780–783.
Cook, D. 1997. Stable flies on the Swan Coastal Plain. J. Dep. Agric. 38: 1–6.
D’Amico, L. J., G. Davidowitz, and H. F. Nijhout. 2001. The developmental and
physiological basis of body size evolution in an insect. Proc. Biol. Sci. 268: 1589–1593.
Davidowitz, G., L. J. D’Amico, and H. F. Nijhout. 2003. Critical weight in the
development of insect body size. Evol. Dev. 5: 188–197.
Diamond, S. E., and J. G. Kingsolver. 2010. Environmental dependence of thermal
reaction norms: Host plant quality can reverse the temperature-size rule. Am. Nat. 175:
1–10.
Page 67
55
Dougherty, C. ., F. W. Knapp, P. B. Burrus, D. C. Willis, and P. L. Cornelius. 1995.
Behavior of grazing cattle exposed to small populations of stable flies (Stomoxys
calcitrans L.). Appl. Anim. Behav. Sci. 42: 231–248.
Dougherty, C. T., F. W. Knapp, P. B. Burrus, D. C. Willis, and P. L. Cornelius.
1994. Moderation of grazing behavior of beef cattle by stable flies (Stomoxys calcitrans
L). Appl. Anim. Behav. Sci. 40: 113–127.
Dougherty, C. T., F. W. Knapp, P. B. Burrus, D. C. Willis, P. L. Cornelius, and N.
W. Bradley. 1993. Stable flies (Stomoxys calcitrans L.) and the behaviour of grazing
beef cattle. Appl. Anim. Behav. Sci. 38: 191–212.
Dujardin, J. P. 2008. Morphometrics applied to medical entomology. Infect. Genet.
Evol. 8: 875–890.
Dybing, C. D., P. D. Evenson, and C. Lay. 1988. Relationships among daily flower
production, length of the flowering period, and seed yield of flax. Crop Sci. 28: 287.
Hall, R. D., G. D. Thomas, and M. C. E. 1982. Stable fly, Stomoxys calcitrans (L.),
breeding in large round hay bales: initial associations (Diptera: Muscidae). J. Kansas
Entomol. Soc. 55: 617–620.
Krams, I., S. Kecko, K. Kangassalo, F. R. Moore, E. Jankevics, I. Inashkina, T.
Krama, V. Lietuvietis, L. Meija, and M. J. Rantala. 2015. Effects of food quality on
trade-offs among growth, immunity and survival in the greater wax moth Galleria
mellonella. Insect Sci. 22: 431–439.
Page 68
56
Kunz, S. E., I. L. Berry, and K. W. Foerster. 1977. The development of the immature
forms of Stomoxys calcitrans. Ann. Entomol. Soc. Am. 70: 173–176.
Lee, K. P., S. J. Simpson, and K. Wilson. 2008. Dietary protein-quality influences
melanization and immune function in an insect. Funct. Ecol. 22: 1052–1061.
Lysyk, T. J. 1998. Relationships between temperature and life-history parameters of
Stomoxys calcitrans (Diptera: Muscidae). J. Med. Entomol. 35: 107–19.
Lysyk, T. J., L. Kalischuk-Tymensen, L. B. Selinger, R. C. Lancaster, L. Wever, and
K. J. Cheng. 1999. Rearing stable fly larvae (Diptera: Muscidae) on an egg yolk
medium. J. Med. Entomol. 36: 382–8.
Metcalfe, N. B., and P. Monaghan. 2001. Compensation for a bad start: Grow now, pay
later? Trends Ecol. Evol. 16: 254–260.
Meyer, J. A., and J. J. Petersen. 1983. Characterization and seasonal distribution of
breeding sites of stable and house flies (Diptera: Muscidae) associated with confined
livestock in eastern Nebraska. J. Econ. Entomol. 76: 103–108.
Miller, R. W., L. G. Pickens, N. O. Morgan, R. W. Thimijan, and R. L. Wilson.
1973. Effect of stable flies on feed intake and milk production of dairy cows. J. Econ.
Entomol. 66: 711–3.
Nijhout, H. F., and V. Callier. 2015. Developmental mechanisms of body size and
wing-body scaling in insects. Annu. Rev. Entomol. 60: 141–156.
Page 69
57
Parker, J., and L. a Johnston. 2006. The proximate determinants of insect size. J. Biol.
5: 15.
Romero, A., A. Broce, and L. Zurek. 2006. Role of bacteria in the oviposition
behaviour and larval development of stable flies. Med. Vet. Entomol. 20: 115–21.
Sutherland, B. 1978. The suitability of varius types of dung and vegetable matter as
larval breeding media for Stomoxys calcitrans L. (Diptera: Muscidae). Ondersterpoort J.
Vet. Res. 45: 241–243.
Taylor, D. B., and D. R. Berkebile. 2011. Phenology of stable fly (Diptera: Muscidae)
larvae in round bale hay feeding sites in eastern Nebraska. Environ. Entomol. 40: 184–
193.
Taylor, D. B., R. D. Moon, and D. R. Mark. 2012. Economic impact of stable flies
(Diptera: Muscidae) on dairy and beef cattle production. J. Med. Entomol. 49: 198–209.
Todd, D. H. 1964. The biting fly Stomoxys calcitrans (L.) in dairy herds in New Zealand.
New Zeal. J. Agric. Res. 7: 60–79.
Wieman, G., J. B. Campbell, J. Deshazer, and I. L. Berry. 1992. Effects of stable flies
(Diptera: Muscidae) and heat stress on weight gain and feed efficiency of feeder cattle. J.
Econ. Entomol. 85: 1835–1842.
Page 70
58
2.7 Figures and tables
Table 2.1. Standard and dilution diets with reduced nutrient to inert in-
gredient ratios (vermiculite). 60% water by weight was added to each
diet
Ingredients (%)
Diet % nutrients Wheat bran Fish meal Vermiculite
standard 100 59 13 28
2 50 30 8 63
3 25 15 3 82
4 12 7 2 91
Figure 2.1. Example of a mounted wing on a sticky card showing landmarks for
measuring cell length.
Page 71
59
Figure 2.2. Growth curve with descriptive variables exemplified. Cumulative pupariation
and cumulative adult emergence over time
Figure 2.3. predicted (lines) and calculated (points) stable flies developmental times as
determined using Lysyk model.
Predicted pupation times
temperature °C
10 15 20 25 30 35 40
Media
n p
upation tim
es (
days)
0
10
20
30
40
50
60
70
80
standard diet
diet 2
diet 3
diet 4
Predicted total developmental times
temperature °C
10 15 20 25 30 35 40
media
n d
evelo
pm
enta
l tim
e in d
ays
0
20
40
60
80
100
standard diet
diet 2
diet 3
Page 72
60
Figure 2.4. Temperature and diet effects on larval development calculated using Boetel
model.
Page 73
61
Figure 2.5. Diet and temperature interaction on adult emergence calculated using Boetel
model.
Figure 2.6. Wing length of stable flies emerging from variable temperature and diet com-
binations
Page 74
62
CHAPTER 3 DIFFERENTIAL GENE EXPRESSION IN RE-
SPONSE TO TEMPERATURE AND DIET IN STABLE FLIES
3.1 Introduction
Immature stable flies are typically associated with fermenting vegetative materials
(Broce and Haas 1999, Romero et al. 2006), such pineapple wastes, rotting vegetables,
and hay residues (Cook 1997, Broce et al. 2005, Solórzano et al. 2015). Cattle production
is the most affected industry from stable fly blood feeding, as animals decrease milk pro-
duction and weight gains. Livestock producers are losing more than $2 million dollars
due to stable flies effects in the U.S (Taylor, et al. 2012).
Temperature and food availability induce physiological changes in insects. The
response to thermal stress of stable flies is phenotypically plastic; larger flies appeared at
temperature < 20°C. In addition, temperature also induces variation in the developmental
rate; larvae developed faster at high temperature 30°C (Chapter II). Food stress also influ-
ences stable fly development. Response to starvation and low nutrient availability during
development, leads to different results. In the first situation, insects pupate for a chance to
reproduce, but if food is available even in small quantities, they will continue growing to
reach the characteristic species-specific size (Nijhout and Callier 2015).
Knowledge of the molecular mechanisms underlying thermal and diet stress re-
sponses in stable flies are required to fully understand stable fly development. Analysis of
gene regulation of stable flies in response to thermal and diet variations was performed
using RNA-Seq. Results give insight into stable flies mechanisms of development and
Page 75
63
adaptation to the environment, and would give insight into the physiological explanation
of previous chapter results.
3.2 Materials and methods
Stable flies. Flies used for this study originated from the Prairieland colony main-
tained by the USDA-ARS Lincoln, Nebraska. The colony was established in 2014, and is
maintained at 23±2°C, 30 to 50% RH, and 12L:12D photoperiod (Berkebile et al. 2009).
Experiment. Eggs were harvest according to Berkebile et al. 2009, 150 eggs were
inoculated into a 150ml (5oz) cup with 60 g of experimental diet and 36 mL of water.
The standard diet contains 59% of wheat bran, 13% of fish meal, and 28% of vermicu-
late, it is the standard rearing mix and is considered optimal. The diet 2 contains 30%
wheat bran, 7% fish meal, and 63% vermiculate. The diet 3 contains 7% wheat bran, 2%
fish meal, and 91% vermiculite. Cups were covered with a piece of cloth. A complete
random design was used. Four cups (replicates) of each experimental diet were randomly
place in a growth chamber with experimental temperatures of 25 and 35 °C. Trays full of
water with sponges were placed inside the chambers to avoid excessive dry out of the
substrate. Water was added according to the consistency of the substrate.
RNA isolation. Two 100g third instar larvae samples were obtained from 4 cups
within each treatment. RNA was isolated from each sample, treated independently. Total
RNA was extracted with TRIzol reagent (Life Technologies, USA). BCP (1-bromo-3-
chloropropane) was used during the separation phase. RNA was extracted, washed with
70% ethanol, and diluted with DEPC (Diethylpyrocarbonate) water. Quantity and quality
Page 76
64
of the RNA were checked by spectrophotometry (Nanodrop Technologies, Wilmington,
DE, USA).
Differential expression analysis. Quality control for the raw reads was performed
using FastQC (http://www.bioinformatics.babraham.ac.uk/projects/fastqc/). Results were
summarized by MultiQC (http://multiqc.info/). The stable fly (Stomoxys calcitrans) ge-
nome and annotations were downloaded from NCBI (Glossina Genomes Consortium
2016). The reads from each sample were aligned to the genome using bowtie2 (Version
2.2.6) and tophat2 (Version 2.1.0) with default parameters, and assembled into transcripts
with Cufflinks. The expression levels (FPKM, Fragments Per Kilobase per Million
mapped reads) and differential expression between conditions were determined by Cuffd-
iff (Trapnell et al. 2012). Gene ontology analysis was completed on the genes with differ-
ences in expression.
Differential expression comparisons were performed within diets (Diets 3, 2 and
standard comparison of temperatures 25 vs 35°C) and within temperatures (At 25°C and
35°C, comparison of diets 3 vs standard and diets 3 vs 2). Description of up and down
regulation in based on diet 3 or 35°C.
3.3 Results
An exploratory analysis of the gene expression data, shows differences driven
mainly by temperature. Clustering of data with principal components helped to visualize
similarities and differences between samples. First three principal components explained
Page 77
65
71% of the variation (Fig. 3.1). Temperatures appear to be separated by principal compo-
nents. Heat map displays high levels of gene expression. Gene expression was similar
between samples from the same treatment (Fig. 3.2).
To identify genes with altered expression levels under high temperature, the
mRNA profile of 25°C was compared with those of larvae that developed at 35°C. To
identify genes with differential expression under starvation, mRNA profile of standard
diet was compared with those of larvae developed in diet 2 and 3. 4776 genes were iden-
tified as differentially expressed genes (DEG). To focus on a smaller data set with higher
expression, the two-fold change criteria was used in the 4776 DEG. 581 genes were up-
regulated and 646 genes were downregulated. Gene expression reached a peak of 344 up-
regulated genes in the comparison 25°C with 3 vs standard diet, and was reduced to 5
downregulated genes in the comparison 35°C diet 3 vs 2.
Gene ontology (GO) analysis on the significant genes
Diet. Differentially expressed genes were identified in the three comparisons
among diets at 35°C. Those genes were primarily involved in metabolism, response to
external stimulus, including stress and heat, cuticle-related processes, oxidation-reduction
process, and immunity. Genes encoding proteins related to immunity, response to exter-
nal stimuli, and defense processes were upregulated. No general pattern for the downreg-
ulated genes was apparent (Appendix 1: Table 3.1, 3.2 & 3.3).
Page 78
66
Temperature. Differential gene expression at 35°C diet 2 vs 3 was center in up-
regulation of genes related to immunity and response to external stimuli. All other com-
parisons within temperatures showed similar gene expression. Genes related to metabo-
lism, oxido-reduction, immunity, and catecholamine were downregulated. On the other
hand, response to starvation was the only process upregulated.
At 25°C, comparisons of diet 3 vs diets 2 and standard, genes related to metabo-
lism, cuticle, defense and immunity, response to external stimuli, oxidation-reduction,
and catecholamine processes were recognized. In general, catecholamine, metabolic, de-
fense, and immunity were downregulated. Response to starvation genes were upregu-
lated. In the same comparison at 35°C, immunity and response to starvation processes en-
coded genes were upregulated, and metabolic, catecholamine, and oxidation-reduction
were downregulated (Appendix 1: Table 3.4, 3.5, 3.6, 3.7, and 3.8).
For an easier visualization of the GO terms of the biological processes, terms
were summarized using REVIGO (Supek et al. 2011) to reduce redundancy, and group
by semantic similarity. It provides a measure of functional similarity. Semantic similarity
assesses the degree of relatedness between two entities by the similarity in meaning of
their annotations. Scatterplots are presented in appendix 1. Along with scatterplots, this
web-based tool also output reduced GO term lists from the treatment comparisons useful
for further analysis.
Page 79
67
3.4 Discussion
Most of the differentially regulated biological processes among treatment compar-
isons were those related with metabolism, cuticle development, defense, response to ex-
ternal stimulus, catecholamine, immunity, and oxidation-reduction.
Metabolism processes genes were affected by temperature and diet. At 35°C, met-
abolic genes were upregulated, but when larvae were exposed to a restricted diet at the
same temperature, they were downregulated. During growth, energy obtained from food
(F) is divided between the energy deposited as biomass (S), and metabolism (B). Thus,
F=B+S (Van Der Meer 2006). When food scarcest, the balance among the previous
equation is lost, and a trade-off between S or B must occur (Hayes et al. 2015). In this
case, gene expression shows that at high temperature and restricted nutrition, metabolism
decreases, which identifies the molecular explanation of the phenomena.
However, metabolism increases along with growth rate at high temperatures
(Atkinson 1994). In stable flies, growth rate and size are not affected by diet at tempera-
tures >30°C. Thus, F=B+S cannot explain the previous finding; at high temperatures, de-
velopment is the same independently of food availability. In this experiment, downregu-
lation of genes related to metabolic processes in flies exposed to high temperatures and
low diet quality may be associate to the nutritional stress.
Heat shock proteins (HSPs) 22, 23, 27, 67, and 70 were upregulated in flies ex-
posed to 35°C and poor diet. These proteins increase in response to stresses such as tem-
perature and starvation. They function as molecular chaperons by binding other proteins,
Page 80
68
thereby ameliorating the negative effects of misfolding and promoting recycling of these
proteins, once favorable conditions prevail again (Rinehart et al. 2007).
Genes related with immunity processes were upregulated high temperature, inde-
pendent of diet. Response to external stimulus, starvation, nutrient levels, and heat-re-
lated genes were also upregulated. Stress may reconfigure the immune system strategies
against diseases, inducing a pro-inflammatory state that may enhances early immune re-
sponses (Adamo 2017). In contrast, defense-related genes, such as defense response to
bacterium, showed no pattern of expression among the treatments.
Cuticle biological related processes were differentially expressed in six out of the
seven treatment comparisons, although with little pattern. In Drosophila, cold acclima-
tion involves upregulation of genes related to chitin metabolism and cuticle binding
(MacMillan et al. 2016). Mucin, a product of one of the differentially expressed genes, is
vital for protection from the environment due to the barrier function on the perithrophic
matrix. Thus, mucin and cuticle processes expression may improve the insect immune re-
sponse under conditions of stress.
Enrichment analyses are need it to find over-represented or under-represented GO
terms in the output from REVIGO. This allows incorporation of biological meaning into
the differential expression analysis.
Page 81
69
3.5 References
Adamo, S. A. 2017. Stress responses sculpt the insect immune system, optimizing
defense in an ever-changing world. Dev. Comp. Immunol. 66: 24–32.
Atkinson, D. 1994. Temperature and organism size-A biological law for ectotherms?, pp.
1–58. In Advanced Ecological Research. Academic Press Limited, Cambridge.
Berkebile, D. R., A. P. Weinhold, and D. B. Taylor. 2009. A new method for collecting
clean stable fly (Diptera: Muscidae) pupae of known age. Southwest. Entomol. 34: 469–
476.
Broce, A. B., J. Hogsette, and S. Paisley. 2005. Winter feeding sites of hay in round
bales as major developmental sites of Stomoxys calcitrans (Diptera: Muscidae) in
pastures in spring and summer. J. Econ. Entomol. 98: 2307–2312.
Broce, A., and M. S. Haas. 1999. Relation of cattle manure age to colonization by stable
fly and house fly. J. Kansas Entomol. Soc. 1: 60–72.
Cook, D. 1997. Stable flies on the Swan Coastal Plain. J. Dep. Agric. 38: 1–6.
Glossina Genomes Consortium. 2016. NCBI Stomoxys calcitrans genome.
(https://www.ncbi.nlm.nih.gov/genome/?term=stable+fly). Visited August 2016.
Hayes, M. B., L. Jiao, T. hsuan Tsao, I. King, M. Jennings, and C. Hou. 2015. High
temperature slows down growth in tobacco hornworms (Manduca sexta) under food
restriction. Insect Sci. 22: 424–430.
Page 82
70
MacMillan, H. A., J. M. Knee, A. B. Dennis, H. Udaka, K. E. Marshall, T. J. S.
Merritt, and B. J. Sinclair. 2016. Cold acclimation wholly reorganizes the Drosophila
melanogaster transcriptome and metabolome. Sci. Rep. 6: 28999.
Van Der Meer, J. 2006. Metabolic theories in ecology. Trends Ecol. Evol. 21: 136–140.
Nijhout, H. F., and V. Callier. 2015. Developmental mechanisms of body size and
wing-body scaling in insects. Annu. Rev. Entomol. 60: 141–156.
Rinehart, J. P., A. Li, G. D. Yocum, R. M. Robich, S. a. L. Hayward, and D. L.
Denlinger. 2007. Up-regulation of heat shock proteins is essential for cold survival
during insect diapause. Proc. Natl. Acad. Sci. 104: 11130–11137.
Romero, A., A. Broce, and L. Zurek. 2006. Role of bacteria in the oviposition
behaviour and larval development of stable flies. Med. Vet. Entomol. 20: 115–21.
Solórzano, J.-A., J. Gilles, O. Bravo, C. Vargas, Y. Gomez-Bonilla, G. V. Bingham,
and D. B. Taylor. 2015. Biology and trapping of stable flies (Diptera: Muscidae)
developing in pineapple residues (Ananas comosus) in Costa Rica. J. Insect Sci. 15: 145.
Supek, F., M. Bošnjak, N. Škunca, and T. Šmuc. 2011. Revigo summarizes and
visualizes long lists of gene ontology terms. PLoS One. 6: 1–9.
Taylor, D. B., R. D. Moon, and D. R. Mark. 2012. Economic impact of stable flies
(Diptera: Muscidae) on dairy and beef cattle production. J. Med. Entomol. 49: 198–209.
Page 83
71
Trapnell, C., A. Roberts, L. Goff, G. Pertea, D. Kim, D. R. Kelley, H. Pimentel, S. L.
Salzberg, J. L. Rinn, and L. Pachter. 2012. Differential gene and transcript expression
analysis of RNA-seq experiments with TopHat and Cufflinks. Nat. Protoc. 7: 562–78.
Page 84
72
3.6 Figures and tables
Figure 3.1. PCA plots. Three principal component plots of expressed genes. Plot 1:
PC1 vs PC2, Plot 2: PC1 vs PC3, Plot 3: PC2 vs PC3. Each point is an individual sam-
ple, with red = temp 35°C, blue = temp 25°C, square = diet standard, triangle = diet 2,
and diamond = diet 3.
Page 85
73
Figure 3.2 Heatmaps of differentially expressed genes. 3671 genes were identified as be-
ing differentially expressed (FDR-adjusted p-value < 0.05 and max log2 fold-change > 1
in a quick all-vs-all analysis). Plot 1 (left) shows the expression profile of the DEGs on
an individual gene basis while Plot 2 (right) shows the expression profile with the biolog-
ical replicates averaged together. Magenta is high expression, black is intermediate ex-
pression, and cyan is low expression.
Page 86
74
Appendix 1.
Results of Gene Ontology analysis
Table 3.1 Expressed genes on each of the GO terms are related in percentage. Treatment
diet 3, temperature 25°C vs 35°C.
Number
of genes GO term %down %up
30 chitin-based cuticle development 63 37
33 cuticle development 61 39
15 defense response to Gram-positive bacterium 27 73
15 humoral immune response 33 67
19 defense response to bacterium 26 74
5 aromatic amino acid family metabolic process 100 0
24 response to external biotic stimulus 29 71
24 response to other organism 29 71
24 response to biotic stimulus 29 71
19 response to bacterium 26 74
58 single-organism metabolic process 31 69
25 oxidation-reduction process 36 64
18 immune response 28 72
10 antibacterial humoral response 40 60
19 defense response to other organism 26 74
20 defense response 25 75
11 antimicrobial humoral response 45 55
14 molting cycle 43 57
14 molting cycle, chitin-based cuticle 43 57
4 sterol transport 75 25
7 hormone metabolic process 14 86
9 cellular amino acid metabolic process 100 0
5 lipid transport 60 40
13 single-organism catabolic process 23 77
4 organic hydroxy compound transport 75 25
Page 87
75
Table 3.2. Expressed genes on each of the GO terms are related in percentage.
Treatment diet 2, temperature 25°C vs 35°C.
Number of
genes GO term %down %up
135 single-organism metabolic process 76 24
78 oxidation-reduction process 81 19
72 small molecule metabolic process 86 14
250 metabolic process 72 28
24
purine nucleoside monophosphate meta-
bolic process 88 13
24
ribonucleoside monophosphate metabolic
process 88 13
24
nucleoside monophosphate metabolic pro-
cess 88 13
32 chitin-based cuticle development 66 34
26 purine nucleotide metabolic process 85 15
27
purine-containing compound metabolic pro-
cess 85 15
18 electron transport chain 100 0
17 oxidative phosphorylation 100 0
16
mitochondrial ATP synthesis coupled elec-
tron transport 100 0
17 respiratory electron transport chain 100 0
40 cuticle development 58 43
28 nucleotide metabolic process 86 14
16 ATP synthesis coupled electron transport 100 0
28 nucleoside phosphate metabolic process 86 14
24 purine ribonucleotide metabolic process 88 13
24 ribonucleotide metabolic process 88 13
23
generation of precursor metabolites and en-
ergy 100 0
39 lipid metabolic process 72 28
24 ribose phosphate metabolic process 88 13
34 organophosphate metabolic process 85 15
52 carbohydrate derivative metabolic process 88 12
19 cellular respiration 100 0
29
nucleobase-containing small molecule met-
abolic process 86 14
21 purine ribonucleoside metabolic process 100 0
19 ATP metabolic process 100 0
19
energy derivation by oxidation of organic
compounds 100 0
21 purine nucleoside metabolic process 100 0
28 single-organism catabolic process 75 25
19
purine nucleoside triphosphate metabolic
process 100 0
Page 88
76
Table 3. Continuation
Number of
genes GO term %down %up
19
purine ribonucleoside triphosphate meta-
bolic process 100 0
19
ribonucleoside triphosphate metabolic pro-
cess 100 0
21 ribonucleoside metabolic process 100 0
20 lipid catabolic process 70 30
19 nucleoside triphosphate metabolic process 100 0
22 nucleoside metabolic process 100 0
22 glycosyl compound metabolic process 100 0
308 single-organism process 60 40
35 carboxylic acid metabolic process 91 9
19 fatty acid metabolic process 89 11
22 monocarboxylic acid metabolic process 91 9
35 organic acid metabolic process 91 9
35 oxoacid metabolic process 91 9
15 cellular lipid catabolic process 87 13
14 monocarboxylic acid catabolic process 93 7
22
defense response to Gram-positive bacte-
rium 18 82
28 cellular lipid metabolic process 82 18
201 organic substance metabolic process 73 27
33 immune response 30 70
13 fatty acid catabolic process 92 8
17 small molecule catabolic process 94 6
12 fatty acid beta-oxidation 92 8
31 defense response to bacterium 19 81
76
organonitrogen compound metabolic pro-
cess 80 20
12 fatty acid oxidation 92 8
38 response to biotic stimulus 24 76
38 response to external biotic stimulus 24 76
38 response to other organism 24 76
12 lipid oxidation 92 8
49 phosphorus metabolic process 80 20
3 disaccharide biosynthetic process 33 67
3 trehalose biosynthetic process 33 67
3 'de novo' IMP biosynthetic process 0 100
29 single-organism biosynthetic process 69 31
5
mitochondrial electron transport, ubiquinol
to cytochrome c 100 0
24 humoral immune response 21 79
14 carboxylic acid catabolic process 93 7
14 organic acid catabolic process 93 7
Page 89
77
Table 3. Continuation
Number of
genes GO term %down %up
7 triglyceride homeostasis 71 29
31 response to bacterium 19 81
7 acylglycerol homeostasis 71 29
42
phosphate-containing compound metabolic
process 76 24
3 IMP metabolic process 0 100
3 IMP biosynthetic process 0 100
35 immune system process 31 69
4
mitochondrial electron transport, cyto-
chrome c to oxygen 100 0
5 peroxisome organization 100 0
46 proteolysis 63 37
6 chaperone-mediated protein folding 17 83
6
purine nucleoside monophosphate biosyn-
thetic process 50 50
6
purine ribonucleoside monophosphate bio-
synthetic process 50 50
31 defense response to other organism 19 81
20 antimicrobial humoral response 25 75
18
defense response to Gram-negative bacte-
rium 17 83
8 lipid homeostasis 75 25
3 disaccharide metabolic process 33 67
3 trehalose metabolic process 33 67
8 purine nucleotide biosynthetic process 50 50
34 defense response 21 79
6
ribonucleoside monophosphate biosynthetic
process 50 50
6
mitochondrial electron transport, NADH to
ubiquinone 100 0
7 lipid localization 86 14
13 lipid modification 92 8
6
nucleoside monophosphate biosynthetic
process 50 50
13 organophosphate biosynthetic process 69 31
17 antibacterial humoral response 24 76
8
purine-containing compound biosynthetic
process 50 50
3 response to xenobiotic stimulus 67 33
3 cellular response to xenobiotic stimulus 67 33
3 xenobiotic metabolic process 67 33
2 insecticide metabolic process 50 50
2 toxin metabolic process 50 50
4 amine metabolic process 75 25
Page 90
78
Table 3. Continuation
Number of
genes GO term %down %up
4 cellular biogenic amine metabolic process 75 25
4 cellular amine metabolic process 75 25
5 lipid transport 100 0
17 multicellular organism aging 53 47
34 catabolic process 74 26
12 chemical homeostasis 83 17
2
regulation of biosynthetic process of anti-
bacterial peptides active against Gram-posi-
tive bacteria 0 100
2
positive regulation of biosynthetic process
of antibacterial peptides active against
Gram-positive bacteria 0 100
15 carbohydrate metabolic process 60 40
Page 91
79
Table 3.3. Expressed genes on each of the GO terms are related in percentage. Treatment
diet standard, temperature 25°C vs 35°C.
Number
of genes GO term %down %up
75 single-organism metabolic process 53 47
9 dopamine metabolic process 33 67
165 metabolic process 39 61
19 defense response to Gram-positive bacterium 5 95
11 ammonium ion metabolic process 27 73
9 catecholamine metabolic process 33 67
9 catechol-containing compound metabolic process 33 67
33 cuticle development 33 67
25 defense response to bacterium 20 80
41 proteolysis 27 73
6 sterol transport 67 33
15 chitin metabolic process 13 87
28 chitin-based cuticle development 25 75
17 aminoglycan metabolic process 12 88
27 immune response 19 81
15
glucosamine-containing compound metabolic pro-
cess 13 87
15 amino sugar metabolic process 13 87
25 response to bacterium 20 80
6 organic hydroxy compound transport 67 33
25 lipid metabolic process 36 64
3 'de novo' IMP biosynthetic process 100 0
29 defense response 24 76
25 defense response to other organism 20 80
32 oxidation-reduction process 56 44
3 IMP biosynthetic process 100 0
3 IMP metabolic process 100 0
17 humoral immune response 12 88
49 response to stress 33 67
28 immune system process 18 82
26 response to external biotic stimulus 19 81
26 response to other organism 19 81
26 response to biotic stimulus 19 81
10 phenol-containing compound metabolic process 40 60
11 response to wounding 45 55
11 antibacterial humoral response 9 91
12 organic hydroxy compound metabolic process 50 50
131 organic substance metabolic process 36 64
18 molting cycle 28 72
19 molting cycle, chitin-based cuticle 26 74
Page 92
80
Table 4. Continuation
Number
of genes GO term %down %up
6 lipid transport 67 33
5 organic hydroxy compound biosynthetic process 100 0
11 lipid catabolic process 0 100
3 phenol-containing compound biosynthetic process 100 0
17 single-organism catabolic process 6 94
27 carbohydrate derivative metabolic process 33 67
3 chaperone-mediated protein folding 0 100
12 carbohydrate metabolic process 42 58
2 disaccharide biosynthetic process 100 0
2 dopamine biosynthetic process 100 0
2 catecholamine biosynthetic process 100 0
2 catechol-containing compound biosynthetic process 100 0
2 trehalose biosynthetic process 100 0
18 single-organism biosynthetic process 94 6
5 hemolymph coagulation 20 80
5 adult chitin-containing cuticle pigmentation 80 20
3
regulation of adult chitin-containing cuticle pig-
mentation 100 0
5 hemostasis 20 80
3
peptidoglycan recognition protein signaling path-
way 100 0
5 coagulation 20 80
11 innate immune response 27 73
5 chitin-based cuticle sclerotization 80 20
3 regulation of chitin-based cuticle tanning 100 0
14 cellular lipid metabolic process 50 50
6 lipid localization 67 33
9 response to temperature stimulus 44 56
5 cuticle pigmentation 80 20
6 response to heat 17 83
Page 93
81
Table 3.4. Expressed genes on each of the GO terms are related in percentage. Treatment
diet 2 vs 3 at temperature 25°C.
Number
of genes GO term %down %up
111 single-organism metabolic process 79 21
68 oxidation-reduction process 87 13
20 ribosome biogenesis 0 100
24 cellular response to external stimulus 0 100
22 cellular response to starvation 0 100
22 cellular response to nutrient levels 0 100
22 cellular response to extracellular stimulus 0 100
226 metabolic process 70 30
14 rRNA metabolic process 0 100
20 ribonucleoprotein complex biogenesis 0 100
24 response to starvation 4 96
25 response to nutrient levels 4 96
25 response to extracellular stimulus 4 96
13 rRNA processing 0 100
27 single-organism catabolic process 93 7
296 single-organism process 59 41
21 regulation of hormone levels 57 43
13
positive regulation of multicellular organism
growth 0 100
14 regulation of multicellular organism growth 0 100
23 carbohydrate metabolic process 87 13
59 response to external stimulus 44 56
40 cuticle development 68 33
7 sterol transport 71 29
34 lipid metabolic process 68 32
28 response to biotic stimulus 75 25
28 response to external biotic stimulus 75 25
28 response to other organism 75 25
31 chitin-based cuticle development 58 42
10 cellular hormone metabolic process 80 20
15 lipid catabolic process 87 13
15 ncRNA processing 0 100
7 organic hydroxy compound transport 71 29
10 lipid transport 80 20
17 monocarboxylic acid metabolic process 88 12
45 small molecule metabolic process 82 18
10 defense response to Gram-positive bacterium 90 10
19 defense response to bacterium 79 21
5 catechol-containing compound metabolic process 60 40
5 catecholamine metabolic process 60 40
11 lipid localization 73 27
Page 94
82
Table 5. Continuation
Number
of genes GO term %down %up
20 response to bacterium 75 25
13 positive regulation of developmental growth 0 100
10 hormone metabolic process 80 20
14 positive regulation of growth 0 100
11 humoral immune response 73 27
3 hormone catabolic process 100 0
25 carboxylic acid metabolic process 92 8
8 pyridine-containing compound metabolic process 100 0
6 regulation of peptide hormone secretion 0 100
8 syncytium formation by plasma membrane fusion 63 38
8 syncytium formation 63 38
8 myoblast fusion 63 38
6 cellular aldehyde metabolic process 83 17
6 regulation of peptide secretion 0 100
6 regulation of peptide transport 0 100
7 ammonium ion metabolic process 57 43
25 organic acid metabolic process 92 8
25 oxoacid metabolic process 92 8
9 myotube differentiation 56 44
174 organic substance metabolic process 67 33
6 regulation of hormone secretion 0 100
4 dopamine metabolic process 75 25
6 carbohydrate catabolic process 100 0
6 single-organism carbohydrate catabolic process 100 0
3 sesquiterpenoid metabolic process 100 0
3 juvenile hormone metabolic process 100 0
19 defense response to other organism 79 21
12 single-organism carbohydrate metabolic process 83 17
52 response to stress 40 60
15 ncRNA metabolic process 0 100
22 defense response 77 23
3 peptidyl-diphthamide metabolic process 33 67
3
peptidyl-diphthamide biosynthetic process from
peptidyl-histidine 33 67
3 peptidyl-histidine modification 33 67
4 hemolymph coagulation 75 25
21 regulation of growth 29 71
7 ecdysteroid metabolic process 71 29
11 cellular modified amino acid metabolic process 91 9
5 glycolytic process 100 0
5 ATP generation from ADP 100 0
6 pyruvate metabolic process 100 0
Page 95
83
Table 5. Continuation
Number
of genes GO term %down %up
14 sleep 79 21
4 positive regulation of peptide hormone secretion 0 100
4 coagulation 75 25
4 hemostasis 75 25
10 fatty acid metabolic process 80 20
9 glutathione metabolic process 89 11
14 chemical homeostasis 57 43
16 immune response 75 25
5 purine nucleoside diphosphate metabolic process 100 0
5 ADP metabolic process 100 0
5
purine ribonucleoside diphosphate metabolic pro-
cess 100 0
5 ribonucleoside diphosphate metabolic process 100 0
4 positive regulation of peptide secretion 0 100
4 positive regulation of hormone secretion 0 100
6 response to metal ion 100 0
6 nicotinamide nucleotide metabolic process 100 0
6 pyridine nucleotide metabolic process 100 0
3 ribosomal large subunit biogenesis 0 100
2 inorganic cation import into cell 100 0
2
maturation of SSU-rRNA from tricistronic rRNA
transcript 0 100
2 inorganic ion import into cell 100 0
2 maturation of SSU-rRNA 0 100
2 juvenile hormone catabolic process 100 0
2 iron ion import 100 0
2 iron ion import into cell 100 0
2 sesquiterpenoid catabolic process 100 0
2 terpenoid catabolic process 100 0
2 detoxification of iron ion 100 0
7 steroid metabolic process 71 29
5 nucleotide phosphorylation 100 0
5 nucleoside diphosphate phosphorylation 100 0
10 organic hydroxy compound metabolic process 70 30
6 response to toxic substance 83 17
15
positive regulation of multicellular organismal pro-
cess 13 87
8 cellular lipid catabolic process 100 0
3 ribosome assembly 0 100
3 iron ion homeostasis 100 0
3 terpenoid metabolic process 100 0
18 cellular lipid metabolic process 72 28
17 regulation of developmental growth 12 88
Page 96
84
Table 5. Continuation
Number
of genes GO term %down %up
10 muscle cell differentiation 50 50
10 small molecule catabolic process 100 0
67 neurogenesis 31 69
8 response to fungus 88 13
5 nucleoside diphosphate metabolic process 100 0
5 organic hydroxy compound biosynthetic process 80 20
9 striated muscle cell differentiation 56 44
6 oxidoreduction coenzyme metabolic process 100 0
30 catabolic process 93 7
160 single-multicellular organism process 50 50
7 lipid homeostasis 43 57
4 regulation of body fluid levels 75 25
7 cellular ketone metabolic process 71 29
2 isoprenoid catabolic process 100 0
2 detoxification of inorganic compound 100 0
2 pyridoxine metabolic process 100 0
2 pyridoxine biosynthetic process 100 0
2 regulation of cell adhesion mediated by integrin 100 0
2 D-amino acid metabolic process 100 0
2 response to iron ion 100 0
2 vitamin B6 biosynthetic process 100 0
2 positive regulation of lipid transport 50 50
2 O-glycan processing 50 50
2 regulation of trehalose metabolic process 0 100
5 response to alkaloid 60 40
9 response to organonitrogen compound 56 44
6 fatty acid beta-oxidation 100 0
7 regulation of secretion 0 100
3 cellular transition metal ion homeostasis 100 0
3 glycogen metabolic process 67 33
3 cellular glucan metabolic process 67 33
3 energy reserve metabolic process 67 33
3 glucan metabolic process 67 33
4 regulation of circadian sleep/wake cycle, sleep 75 25
5 triglyceride homeostasis 40 60
4 regulation of insulin receptor signaling pathway 0 100
4 regulation of cellular response to insulin stimulus 0 100
71 nervous system development 32 68
5 regulation of hemocyte proliferation 60 40
26 cellular response to stress 12 88
2 import into cell 100 0
2 water-soluble vitamin biosynthetic process 100 0
Page 97
85
Table 5. Continuation
Number
of genes GO term %down %up
2 vitamin B6 metabolic process 100 0
2 iron ion transport 100 0
8 coenzyme metabolic process 100 0
5 acylglycerol homeostasis 40 60
Page 98
86
Table 3.5. Expressed genes on each of the GO terms are related in percentage. Treatment
diet standard vs 3 at temperature 25°C.
Number
of
genes GO terms %down %up
528 metabolic process 53 47
39 cytoplasmic translation 0 100
228 single-organism metabolic process 66 34
434 organic substance metabolic process 47 53
659 single-organism process 50 50
117 oxidation-reduction process 75 25
379 primary metabolic process 44 56
57 carboxylic acid metabolic process 61 39
58 oxoacid metabolic process 60 40
58 organic acid metabolic process 60 40
97 small molecule metabolic process 60 40
154 organonitrogen compound metabolic process 42 58
14 lipid transport 71 29
21 ribosome biogenesis 0 100
23 cellular response to starvation 0 100
23 cellular response to nutrient levels 0 100
25 cellular response to external stimulus 0 100
8 catechol-containing compound metabolic process 63 38
8 catecholamine metabolic process 63 38
26 cellular response to extracellular stimulus 12 88
158 biosynthetic process 37 63
336 cellular metabolic process 44 56
61 lipid metabolic process 54 46
150 organic substance biosynthetic process 36 64
34 response to nutrient levels 15 85
23 ribonucleoprotein complex biogenesis 0 100
34 response to extracellular stimulus 15 85
40 carbohydrate metabolic process 63 38
32 sleep 63 38
148 cellular biosynthetic process 36 64
8 sterol transport 75 25
31 response to starvation 16 84
120 response to stress 49 51
59 single-organism biosynthetic process 66 34
26 regulation of hormone levels 38 62
27 cellular amino acid metabolic process 44 56
436 single-organism cellular process 43 57
15 lipid localization 73 27
15
positive regulation of multicellular organism
growth 0 100
Page 99
87
Table 6. Continuation
Number
of genes GO term %down %up
109 response to external stimulus 42 58
57 cuticle development 56 44
34 single-organism catabolic process 68 32
221 nitrogen compound metabolic process 41 59
94 organonitrogen compound biosynthetic process 27 73
26 monocarboxylic acid metabolic process 77 23
6 dopamine metabolic process 83 17
25 small molecule biosynthetic process 60 40
19 regulation of multicellular organism growth 0 100
8 organic hydroxy compound transport 75 25
355 single-multicellular organism process 42 58
22 organic hydroxy compound metabolic process 55 45
65 cytoskeleton organization 32 68
23 single-organism carbohydrate metabolic process 61 39
23 positive regulation of growth 4 96
582 cellular process 43 57
6 hemolymph coagulation 83 17
19 positive regulation of developmental growth 5 95
43 chitin-based cuticle development 49 51
11 translational initiation 0 100
6 coagulation 83 17
6 hemostasis 83 17
16 centrosome duplication 19 81
45 response to biotic stimulus 62 38
45 response to external biotic stimulus 62 38
45 response to other organism 62 38
160 nervous system development 30 70
17 coenzyme metabolic process 82 18
8 ammonium ion metabolic process 75 25
144 neurogenesis 28 72
18 response to wounding 78 22
19 striated muscle cell differentiation 37 63
9 hormone biosynthetic process 22 78
20 centrosome organization 20 80
13 steroid metabolic process 38 62
24 response to organonitrogen compound 58 42
9 single-organism carbohydrate catabolic process 89 11
9 carbohydrate catabolic process 89 11
312 multicellular organism development 38 62
3 dopamine biosynthetic process 100 0
3 catecholamine biosynthetic process 100 0
3 catechol-containing compound biosynthetic process 100 0
Page 100
88
Table 6. Continuation
Number
of genes GO term %down %up
3 tetrahydrobiopterin metabolic process 100 0
3 'de novo' IMP biosynthetic process 100 0
3 tetrahydrobiopterin biosynthetic process 100 0
20 microtubule organizing center organization 20 80
9 response to toxic substance 89 11
13 defense response to Gram-positive bacterium 77 23
14 hormone metabolic process 43 57
13 cellular carbohydrate metabolic process 38 62
6 response to methotrexate 67 33
6 monocarboxylic acid transport 17 83
21 muscle cell differentiation 38 62
9 pyridine-containing compound metabolic process 89 11
10 rRNA metabolic process 0 100
7 regulation of peptide hormone secretion 0 100
8 cellular amino acid biosynthetic process 75 25
8 positive regulation of cell size 0 100
4 ribosomal large subunit biogenesis 0 100
16 centrosome cycle 19 81
32 regulation of developmental growth 16 84
114 regulation of biological quality 46 54
12 cellular hormone metabolic process 42 58
7 regulation of peptide secretion 0 100
7 regulation of peptide transport 0 100
10 organic hydroxy compound biosynthetic process 50 50
21 developmental pigmentation 71 29
144 transport 53 47
14 alpha-amino acid metabolic process 57 43
24 lipid biosynthetic process 58 42
12 muscle cell development 25 75
9 pyridine nucleotide metabolic process 89 11
9 nicotinamide nucleotide metabolic process 89 11
29
positive regulation of multicellular organismal pro-
cess 24 76
15 wound healing 73 27
14 carboxylic acid biosynthetic process 79 21
14 organic acid biosynthetic process 79 21
133 organic cyclic compound metabolic process 47 53
196 protein metabolic process 36 64
5 positive regulation of peptide hormone secretion 0 100
351 single-organism developmental process 39 61
3 ribosomal subunit export from nucleus 0 100
3 ribosome localization 0 100
Page 101
89
Table 6. Continuation
Number
of genes GO term %down %up
3 establishment of ribosome localization 0 100
3 IMP metabolic process 100 0
3
rRNA-containing ribonucleoprotein complex export
from nucleus 0 100
3 IMP biosynthetic process 100 0
40 regulation of growth 18 83
7 regulation of hormone secretion 0 100
13 adult chitin-containing cuticle pigmentation 85 15
12 myotube differentiation 50 50
9 rRNA processing 0 100
240 response to stimulus 54 46
39 microtubule cytoskeleton organization 26 74
353 developmental process 39 61
30 response to endogenous stimulus 53 47
8 pyruvate metabolic process 75 25
7 regulation of body fluid levels 86 14
447 multicellular organismal process 44 56
14 small molecule catabolic process 50 50
5 positive regulation of peptide secretion 0 100
183 cellular nitrogen compound metabolic process 39 61
24 response to nitrogen compound 58 42
12 actomyosin structure organization 25 75
4
progression of morphogenetic furrow involved in
compound eye morphogenesis 25 75
21 pigmentation 71 29
6 muscle system process 17 83
56 cellular response to stress 36 64
269 macromolecule metabolic process 35 65
16 fatty acid metabolic process 75 25
96 cellular nitrogen compound biosynthetic process 23 77
5 positive regulation of hormone secretion 0 100
17 cofactor metabolic process 82 18
13 chitin-based cuticle sclerotization 85 15
6 glycolytic process 100 0
8 steroid biosynthetic process 25 75
6 ATP generation from ADP 100 0
Page 102
90
Table 3.6. Expressed genes on each of the GO terms are related in percentage. Treatment
diet 2 vs 3 at temperature 35°C.
Number
of genes Description %down %up
6 defense response to Gram-positive bacterium 83 17
5 antibacterial humoral response 100 0
8 defense response to bacterium 88 13
8 response to bacterium 88 13
9 defense response 89 11
6 humoral immune response 100 0
8 defense response to other organism 88 13
5 antimicrobial humoral response 100 0
7 immune response 86 14
8 response to external biotic stimulus 88 13
8 response to biotic stimulus 88 13
8 response to other organism 88 13
5 defense response to Gram-negative bacterium 100 0
12 response to stress 83 17
7 immune system process 86 14
6 cuticle development 50 50
5 chitin-based cuticle development 40 60
2 triglyceride homeostasis 50 50
2 acylglycerol homeostasis 50 50
8 response to external stimulus 88 13
1 ARF protein signal transduction 100 0
Page 103
91
Table 3.8. Expressed genes on each of the GO terms are related in percentage. Treatment
diet standard vs 3 at temperature 35°C.
Number
of
genes Description %down %up
120 single-organism metabolic process 68 32
236 metabolic process 71 29
30 single-organism catabolic process 63 37
59 oxidation-reduction process 85 15
12 ammonium ion metabolic process 75 25
9 catechol-containing compound metabolic process 67 33
9 catecholamine metabolic process 67 33
35 lipid metabolic process 51 49
52 small molecule metabolic process 65 35
33 carboxylic acid metabolic process 76 24
33 organic acid metabolic process 76 24
33 oxoacid metabolic process 76 24
8 dopamine metabolic process 75 25
15 lipid catabolic process 53 47
18 regulation of hormone levels 39 61
18 monocarboxylic acid metabolic process 94 6
13 organonitrogen compound catabolic process 62 38
277 single-organism process 65 35
42 cuticle development 79 21
36 chitin-based cuticle development 81 19
10 cellular lipid catabolic process 70 30
19 sleep 74 26
5 sterol transport 80 20
35 organic substance catabolic process 63 37
185 organic substance metabolic process 65 35
35 catabolic process 63 37
13 small molecule catabolic process 62 38
4 membrane lipid catabolic process 75 25
4 sphingolipid catabolic process 75 25
4 disaccharide metabolic process 50 50
4 trehalose metabolic process 50 50
3 disaccharide biosynthetic process 33 67
3 trehalose biosynthetic process 33 67
3 sphingomyelin catabolic process 67 33
11 carboxylic acid catabolic process 64 36
11 organic acid catabolic process 64 36
40 carbohydrate derivative metabolic process 83 18
5 organic hydroxy compound transport 80 20
20 cellular lipid metabolic process 65 35
9 cellular ketone metabolic process 22 78
Page 104
92
Table 8. Continuation
Number
of genes GO term %down %up
11 regulation of multicellular organism growth 18 82
8 cellular hormone metabolic process 25 75
18 multicellular organism aging 44 56
3 phospholipid catabolic process 67 33
3 sphingomyelin metabolic process 67 33
28 single-organism biosynthetic process 39 61
5 amine metabolic process 40 60
5 cellular biogenic amine metabolic process 40 60
5 cellular amine metabolic process 40 60
18 aging 44 56
13 response to organonitrogen compound 69 31
14 organic hydroxy compound metabolic process 43 57
5 response to methotrexate 100 0
70 organonitrogen compound metabolic process 74 26
6 regulation of protein processing 100 0
6 regulation of protein maturation 100 0
8 syncytium formation by plasma membrane fusion 50 50
8 syncytium formation 50 50
8 myoblast fusion 50 50
16 cellular modified amino acid metabolic process 100 0
7 ecdysteroid metabolic process 29 71
17 determination of adult lifespan 47 53
25 response to biotic stimulus 64 36
25 response to external biotic stimulus 64 36
25 response to other organism 64 36
5 glycolytic process 100 0
5 ATP generation from ADP 100 0
10 fatty acid metabolic process 90 10
12 small molecule biosynthetic process 50 50
5 regulation of peptide hormone secretion 0 100
8 myotube differentiation 50 50
15 glutathione metabolic process 100 0
12 single-organism carbohydrate metabolic process 58 42
19 sulfur compound metabolic process 89 11
15 response to nutrient levels 20 80
5 purine nucleoside diphosphate metabolic process 100 0
5 ADP metabolic process 100 0
5 purine ribonucleoside diphosphate metabolic process 100 0
5 ribonucleoside diphosphate metabolic process 100 0
5 regulation of peptide secretion 0 100
5 regulation of peptide transport 0 100
8 hormone metabolic process 25 75
Page 105
93
Table 8. Continuation
Number
of genes GO term %down %up
15 response to extracellular stimulus 20 80
14 response to starvation 21 79
20
nucleobase-containing small molecule metabolic
process 60 40
6 nicotinamide nucleotide metabolic process 83 17
6 pyridine nucleotide metabolic process 83 17
5 regulation of hormone secretion 0 100
13 response to nitrogen compound 69 31
3 response to xenobiotic stimulus 100 0
3 cellular response to xenobiotic stimulus 100 0
3 xenobiotic metabolic process 100 0
6 negative regulation of endopeptidase activity 100 0
20 response to bacterium 65 35
7 steroid metabolic process 29 71
9 phenol-containing compound metabolic process 67 33
5 nucleotide phosphorylation 100 0
5 nucleoside diphosphate phosphorylation 100 0
5 carbohydrate catabolic process 100 0
5 single-organism carbohydrate catabolic process 100 0
9 alpha-amino acid metabolic process 33 67
2 inorganic cation import into cell 100 0
2
regulation of hematopoietic progenitor cell differen-
tiation 50 50
2 inorganic ion import into cell 100 0
2 regulation of hematopoietic stem cell differentiation 50 50
2 histamine metabolic process 50 50
2 iron ion import 100 0
2 iron ion import into cell 100 0
2 imidazole-containing compound metabolic process 50 50
2 detoxification of iron ion 100 0
7 positive regulation of multicellular organism growth 0 100
11 nucleotide-sugar metabolic process 100 0
4 neutral lipid metabolic process 25 75
4 acylglycerol metabolic process 25 75
21 homeostatic process 57 43
8 carboxylic acid biosynthetic process 75 25
8 organic acid biosynthetic process 75 25
5 response to toxic substance 100 0
10 defense response to Gram-positive bacterium 90 10
9 coenzyme metabolic process 67 33
3 iron ion homeostasis 100 0
4 'de novo' pyrimidine nucleobase biosynthetic process 50 50
Page 106
94
Table 8. Continuation
Number
of genes GO term %down %up
6 negative regulation of peptidase activity 100 0
4 pyrimidine nucleobase biosynthetic process 50 50
16 carbohydrate metabolic process 56 44
24 cellular catabolic process 63 38
11 chemical homeostasis 64 36
6 pyridine-containing compound metabolic process 83 17
5 cellular amino acid biosynthetic process 60 40
5 nucleoside diphosphate metabolic process 100 0
6 organic hydroxy compound biosynthetic process 17 83
5 lipid transport 80 20
6 oxidoreduction coenzyme metabolic process 83 17
9 organic cyclic compound catabolic process 56 44
6 lipid homeostasis 33 67
7 monocarboxylic acid catabolic process 86 14
10 UDP-glucose metabolic process 100 0
5 pyruvate metabolic process 100 0
2 detoxification of inorganic compound 100 0
2 neutral lipid catabolic process 0 100
2 acylglycerol catabolic process 0 100
2 glycerolipid catabolic process 0 100
2 response to iron ion 100 0
5 negative regulation of protein maturation 100 0
5 negative regulation of protein processing 100 0
2 triglyceride catabolic process 0 100
7 cellular carbohydrate metabolic process 29 71
23 molting cycle 83 17
23 molting cycle, chitin-based cuticle 83 17
5 inorganic anion transport 40 60
3 sulfate transport 67 33
4 pyrimidine nucleobase metabolic process 50 50
10 ATP metabolic process 100 0
45 response to external stimulus 49 51
5 regulation of lipid storage 40 60
51 regulation of biological quality 55 45
13 purine nucleotide metabolic process 77 23
10 purine nucleoside triphosphate metabolic process 100 0
10 purine ribonucleoside triphosphate metabolic process 100 0
4 nucleobase biosynthetic process 50 50
4 hemolymph coagulation 75 25
10 ribonucleoside triphosphate metabolic process 100 0
4 triglyceride homeostasis 50 50
15 nucleotide metabolic process 67 33
Page 107
95
Table 8. Continuation
Number
of genes GO term %down %up
16 defense response to bacterium 75 25
49 response to stress 57 43
2 import into cell 100 0
2 indole-containing compound catabolic process 50 50
2 phosphate ion transmembrane transport 50 50
2 positive regulation of lipid storage 50 50
2 iron ion transport 100 0
2 malate transport 100 0
44 phosphorus metabolic process 70 30
4 acylglycerol homeostasis 50 50
10 nucleoside triphosphate metabolic process 100 0
8 heterocycle catabolic process 63 38
15 nucleoside phosphate metabolic process 67 33
11 lipid biosynthetic process 45 55
10 purine nucleoside monophosphate metabolic process 100 0
10
purine ribonucleoside monophosphate metabolic
process 100 0
11 cellular amino acid metabolic process 36 64
12 nucleoside metabolic process 92 8
3 positive regulation of peptide hormone secretion 0 100
4 coagulation 75 25
4 ecdysone biosynthetic process 0 100
4 hemostasis 75 25
12 glycosyl compound metabolic process 92 8
36 proteolysis 78 22
5 hormone biosynthetic process 0 100
4 sphingolipid metabolic process 75 25
14 response to endogenous stimulus 71 29
9 cofactor metabolic process 67 33
9 somatic muscle development 44 56
9 secondary metabolic process 44 56
11 ribonucleoside metabolic process 100 0
12 generation of precursor metabolites and energy 75 25
5 glutamine family amino acid metabolic process 20 80
4 alpha-amino acid biosynthetic process 75 25
5 pyrimidine-containing compound metabolic process 60 40
9 cellular response to starvation 11 89
4 secondary alcohol biosynthetic process 0 100
3 triglyceride metabolic process 0 100
3 positive regulation of peptide secretion 0 100
4 sterol biosynthetic process 0 100
Page 108
96
REVIGO scatter plots
Figure 3.3. Scatterplots to visualize GO terms grouped by semantic similarity. The axes
have no intrinsic meaning. REVIGO uses multidimensional scaling to reduce dimension-
ality of a matrix of the GO terms’ pairwise semantic similarities. Bubble color indicates
the p-value (legend in upper right-hand corner); size indicates the frequency of the GO
term in the underlying GOA database (bubbles of more general terms are larger).
- Diet 3 temperature 25°C vs 35°C
semantic space x
Page 109
97
- Diet 2 temperature 25°C vs 35°C
semantic space x
- Diet standard temperature 25°C vs 35°C
semantic space x
Page 110
98
- Diet standard vs 3 temperature 25°C
semantic space x
- Diet 2 vs 3 temperature 25°C
semantic space x
Page 111
99
- Diet standard vs 3 temperature 35°C
semantic space x
- Diet 2 vs 3 temperature 35°C
-
semantic space x


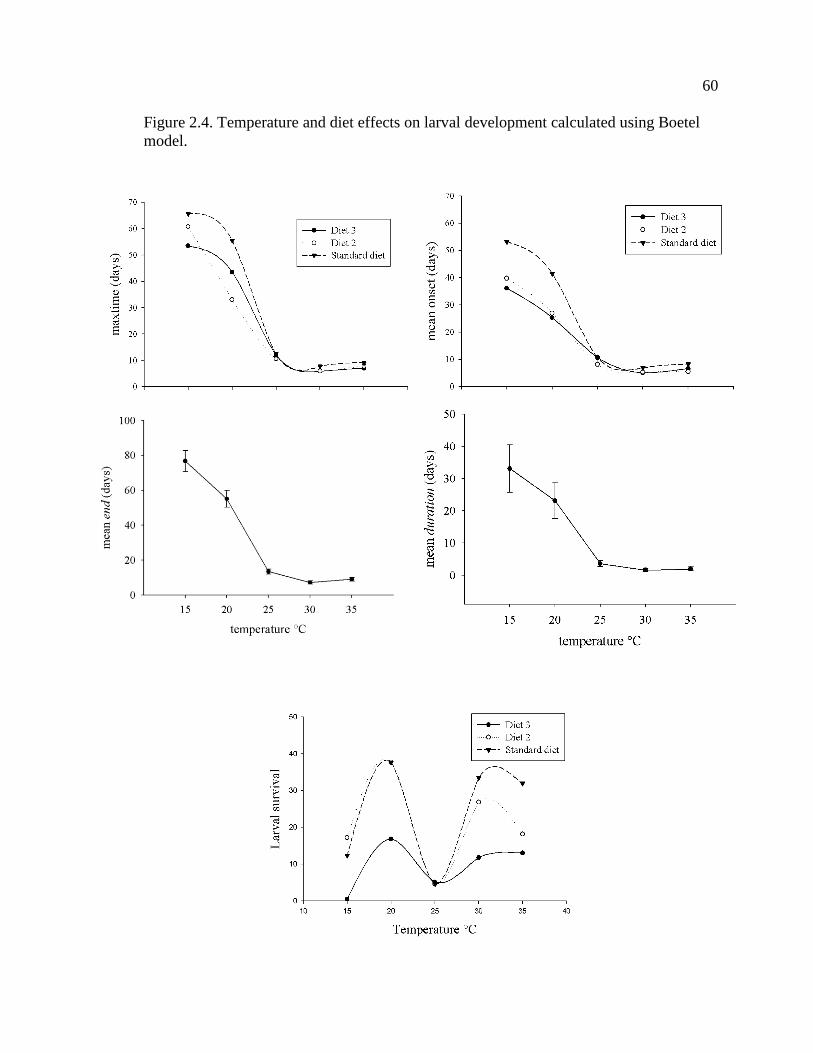


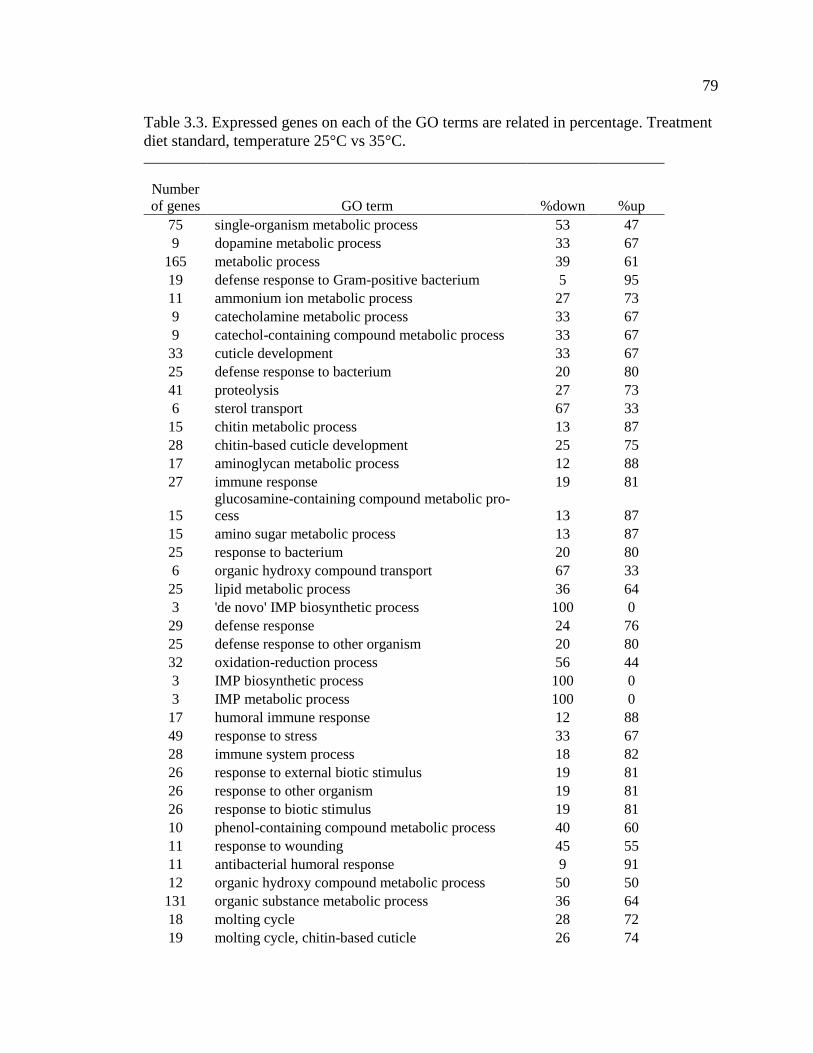


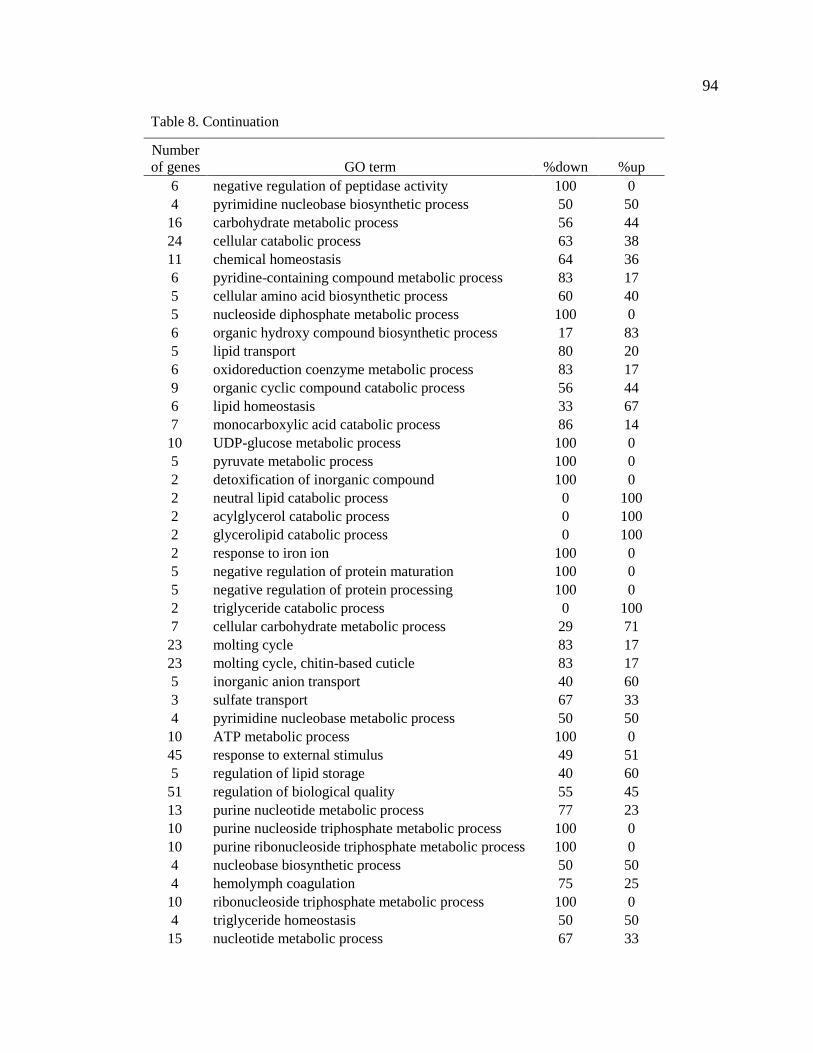


![The Embryology of Dacus tryoni (Frogg.) [Diptera, Trypetidae (= … · The Embryology of Dacus tryoni (Frogg.) [Diptera, Trypetidae (= Tephritidae)], the Queensland Fruit-Fly by D.](https://static.documents.pub/doc/80x56/5f8e605cdcba044de1264898/the-embryology-of-dacus-tryoni-frogg-diptera-trypetidae-the-embryology-of.jpg)


