EFFECTS OF TEMPERATURE ON THE DEVELOPMENT OF LOW PERMEABILITY IN CONCRETES Celik Ozyildirim, Ph.D. Principal Research Scientist (The opinions, findings, and conclusions expressed in this report are those of the author and not necessarily those of the sponsoring agencies.) Virginia Transportation Research Council (A Cooperative Organization Sponsored Jointly by the Virginia Department of Transportation and the University of Virginia) Charlottesville, Virginia February 1998 VTRC 98-R14
Transcript
EFFECTS OF TEMPERATURE ON THE DEVELOPMENT OF LOW PERMEABILITY IN CONCRETES
Celik Ozyildirim, Ph.D. Principal Research Scientist
(The opinions, findings, and conclusions expressed in this report are those of the author and not necessarily those of
the sponsoring agencies.)
Virginia Transportation Research Council (A Cooperative Organization Sponsored Jointly by the
Virginia Department of Transportation and the University of Virginia)
Charlottesville, Virginia
February 1998 VTRC 98-R14
iii
ABSTRACT This study evaluated the effects of temperature on the strength and permeability of concretes containing pozzolans (fly ash and silica fume) and slag. Two test programs were conducted. In the first, one control and five experimental mixtures containing silica fume, fly ash, or slag were evaluated. In the second, one control and three experimental mixtures containing fly ash or slag at a higher water-cementitious material ratio (W/CM) than used in the first program were evaluated. Concretes cured at higher temperatures had higher strengths up to 28 days but lower strengths at 1 year. Permeability decreased with time. Increasing early curing temperatures enabled the achievement of lower long-term permeability for 6 months and beyond at 28 days. Concretes containing a pozzolan or slag had a lower long-term permeability than the control. Adding a pozzolan was more effective in reducing permeability than reducing the W/CM. At cold temperatures, if the specified properties are not achieved, the contractor should change the mix design and/or provide insulating blankets and/or external heat to ensure the desired product.
EFFECTS OF TEMPERATURE ON THE DEVELOPMENT OF LOW PERMEABILITY IN CONCRETES
Celik Ozyildirim, Ph.D.
Principal Research Scientist
INTRODUCTION
Reinforced concrete structures exposed to the environment require durable concretes to provide long-lasting performance with minimal maintenance. Low permeability is an important characteristic of durable concretes and may be obtained by lowering the water-cementitious material ratio (W/CM) and using pozzolans (fly ash and silica fume) or slag as a portion of the cementitious material. A convenient method to measure the permeability of concretes is the rapid permeability test (AASHTO T 277 or ASTM C 1202). In this test, coulomb values above 4,000 indicate high permeability; 2,000 to 3,000, moderate; 1,000 to 2,000, low; 100 to 1,000, very low; and less than 100, negligible.
During the hydration reaction between portland cement and water, a cementitious gel
(calcium silicate hydrate) and lime (calcium hydroxide) are formed. Pozzolanic materials react with this lime in the presence of moisture to form additional cementitious gel. Slag also undergoes this pozzolanic reaction. This reaction leads to a reduction in the permeability of the concrete and an increase in its strength.1 These improvements are time dependent and with Class F fly ash and slag may require extended periods of time to develop fully. Also, in common practice, fly ash and slag are used to replace a portion of the portland cement. With less cement to hydrate, the development of strength can be slower. Both the hydration and the pozzolanic reactions are temperature dependent, slowing in lower temperatures. The pozzolanic reactions are more sensitive to cold temperature. Thus, concretes containing Class F fly ash or slag have not shown the beneficial effects of low permeability and improved strength at early test ages, especially in cold weather.
The low permeability expected in pozzolanic systems may take months to develop, during
which time they may be subjected to aggressive, deleterious solutions. Similarly, in cold weather, the required 28-day strength, which is 28 MPa for bridge deck concrete, may not be achieved when pozzolan or slag replaces the portland cement, and the slow strength development at early ages extends the form removal times, slowing the construction process. The time of setting is also delayed in concretes with pozzolans, especially in cold weather, which could result in problems with curing, form stripping, and forming for superimposed elements. Reactions can be accelerated if external heat is provided to the concrete, resulting in improvements in early strength development and a reduction in permeability.2,3,4
High-temperature curing is widely used in precast plants to accelerate the development of
strength properties in concretes and enable the rapid turnover of forms. Development of high early strength in portland cement concretes (PCC) generally results in lower ultimate strength and
2
higher permeability. For example, tests on PCC cured at temperatures between 23 and 49 C have shown that higher concrete temperatures provided higher early strength but, at later ages, lower ultimate strengths.5 The failure to develop equal strength and permeability at high temperatures is attributed to a less uniform distribution of the hydration products in the paste because of rapid initial hydration and the formation of a coarser pore structure.6,7
The effect of temperature on concretes containing pozzolans or slag is different from the
effect on plain PCC.8,9 In cold temperatures, the development of properties is slower than in PCC but at high temperatures may be equal to or faster than in PCC.10
Permeability is a very important characteristic of durable concrete and should be included
in the specifications. However, low permeability may take a long time to develop. Different concretes have different rates of reduction in permeability, and the standard test age of 28 days is too early to develop long-term permeability. Accelerating the development of permeability with increased temperature would eliminate the need to wait many months. The Virginia Department of Transportation (VDOT) is developing and experimenting with a low-permeability specification that requires the determination of permeability at 28 days.
PURPOSE AND SCOPE
This laboratory study investigated the effects of temperature on the strength and permeability of concretes containing pozzolans (fly ash and silica fume) and slag. Two sets of tests were conducted. In Test 1, 12 batches of concrete duplicating six combinations of cementitious materials were prepared at a constant water content and subjected to varying temperatures. In Test 2, 4 batches of potential combinations of cementitious material at a higher water content than in the first program were prepared. Concretes were tested in the freshly mixed state for air content, slump, and unit weight and in the hardened state for compressive strength and permeability.
METHODOLOGY
Test 1
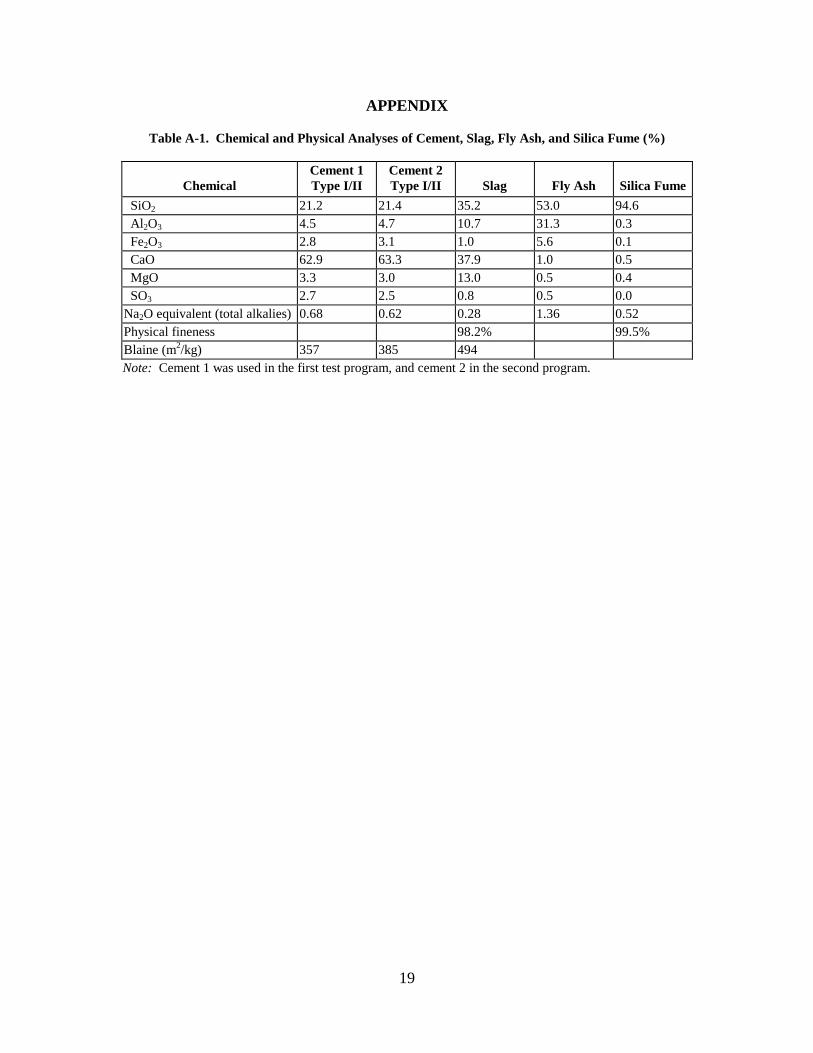
The six cementitious material combinations given in Table 1 were prepared. The chemical and physical analyses of the cementitious material are given in Table A-1 of the Appendix. In the control mixture, the amount of portland cement was 377 kg/m3. Two of the mixtures contained fly ash and had more cementitious material than the control. In one fly ash mixture, a higher amount of fly ash was added than the portland cement replaced. This practice is followed by the industry to minimize the delays in early strength development in fly ash concretes. In the other fly ash mixture, the amount of portland cement was not reduced to ensure that the properties of control concretes were attained and 20 percent fly ash by weight was added for durability. Similarly, one of the two slag mixtures had a higher amount of cementitious
3
Table 1. Combinations of Cementitious Materials for Test 1
material since a large amount of portland cement, 75 percent of the control, was used and 40 percent slag by weight of the portland cement in the control was added for durability. The other slag mixture had 50 percent cement replaced with slag. The mixtures with a large amount of portland cement were expected to provide early development of properties. Mixtures had a constant amount of water, 151 kg/m3. Thus, the water-cementitious material ratio (W/CM) was 0.40 for the control and the slag mixture that contained 50 percent slag. The other mixtures had a lower W/CM, as low as 0.33 for the concrete with fly ash. The mixture proportions and W/CM are given in Table 2. The coarse aggregate was a crushed granite gneiss with a nominal maximum size of 25 mm. The fine aggregate was natural sand.
For each mixture combination, two duplicate batches were made because of the limited
capacity of the drum mixer used. From each batch, a single specimen was tested for the various conditions studied. The values from the two batches for each condition were averaged. A statistical analysis was conducted to determine the coefficient of variability. All batches contained an air-entraining admixture as needed and a water-reducing admixture at a rate of 2 ml per kg of cementitious material. A naphthalene-based high-range water-reducing admixture (HRWRA) was added at amounts shown in Table 3 to maintain the desired workability at the fixed water content.
Concretes were prepared in accordance with ASTM C 192 and tested in the freshly mixed
state for air content (ASTM C 231), slump (ASTM C 143), and unit weight (ASTM C 138). Cylindrical specimens were prepared for compressive strength and permeability tests in the
4
Table 3. Characteristics of Freshly Mixed Concrete for Test 1
Note: PC = portland cement; SF = silica fume; FA = fly ash; S = slag; HRWRA = high-range water-reducing admixture.
hardened state. Compressive strength was determined at different ages and curing conditions as shown in Table 4 using 100 x 200 mm cylinders. The permeability test was conducted in accordance with AASHTO T 277 (or ASTM C 1202) using the top 50 mm of 100-mm-diameter cylindrical specimens. The curing conditions used in the permeability test are shown in Table 5 for high-temperature curing for 28 days and Table 6 for low-temperature curing for ages up to 1 year. Specimens tested at 1 year were cured either at a constant 23 C or initially at a low temperature of 5 or 10 C or a high temperature of 38 C followed at 23 C.
Table 4. Average Compressive Strengths for Test 1 (MPa) Mixture (PC/FA/SF/S)
The specimens were prepared at room temperature (23 C) and, then, within 45 minutes placed in different temperature environments and kept moist. Some specimens were cured in a given constant environment until tested, and some were cured initially at a low temperature but then placed at room temperature to determine the level of improvement with delayed exposure to favorable temperatures. This simulates the increase in temperature in the spring and summer subsequent to the casting of concrete in the fall or winter. Also, to test for permeability, a set of specimens was cured at 23 C for 1 week and then left outdoors for tests at 1 year.
Test 2 Test 2 was based on the results of Test 1. The concretes with the potential for use with a
higher W/CM that still provided the desired strength, permeability, and workability in variable temperature environments were selected for Test 2. Four batches of concrete were prepared with the mixture proportions given in Table 7. In three batches, the one with portland cement only,
the one with 85 percent portland cement and 20 percent fly ash, and the one with 75 percent portland cement and 40 percent slag, the same amount of water was used, 170 kg/m3. The W/CM was 0.45 for the control, 0.43 for the fly ash, and 0.39 for the slag concretes. In the fourth batch, which contained 75 percent portland cement and 40 percent slag, the water content was increased to 195 kg/m3 to match the 0.45 W/CM of the control.
Freshly mixed concretes were tested for slump, air content, and unit weight. A water-
reducing admixture was added at the amount shown in Table 8. Specimens were prepared and placed in different temperature environments within 45 minutes. The number of temperature conditions was fewer than in the first program since trends were already established, reducing the number of conditions with the potential for high strength and low permeability. With a reduced number of conditions, it was possible to prepare and test two specimens for each condition for an average value from the same batch. The temperature conditions for compressive strength are given in Table 9 and for permeability in Table 10.
Table 8. Characteristics of Freshly Mixed Concrete for Test 2
The characteristics of freshly mixed concretes are given in Table 3. Slump values ranged from 90 to 180 mm, providing workable concretes with the use of HRWRA. The batches with silica fume had the largest amount of HRWRA, and the batch with 50 percent slag had the least. The air content ranged from 5.0 to 6.9 percent, meeting VDOT’s bridge deck specification of 6.5 � 1.5 percent. The unit weights ranged from 2307 to 2384 kg/m3. The low values coincided with a high air content as expected. The strength values as an average of two specimens are given in Table 4. Figure 1 shows strength data for specimens cured at 23 C and tested at 1, 7, and 28 days and 1 year. The strength values for specimens cured at 38 C are given in Figure 2, those at 5 C in Figure 3, and those at 10 C in Figure 4. Figure 5 displays the 28-day strengths under different curing temperatures.
The results indicated that at 1 day all the concretes had low strength, ranging from 0.8
MPa for the 50 percent slag to 5.2 MPa for the silica fume concretes, when cured at a low temperature (10 C). At 23 C, the strengths ranged from 3.6 MPa for the 50 percent slag to 20.4 MPa for the silica fume concretes. The strength of the concrete with 85 percent portland cement and 20 percent fly ash was 11.3 MPa, which is close to the strength with 75 percent portland cement and 40 percent slag, but less than that of the control (18.3 MPa). At 38 C, strength had increased, the lowest being that of the 50 percent slag concrete at 9.7 MPa.
At 7 days at 10 C, the 50 percent slag concrete had the lowest strength of 13.7 MPa, and the rest of the concretes had a strength in excess of 26.3 MPa. At 23 C, the concrete with 50 percent slag had the lowest strength of 25.9 MPa, which is close to the minimum 28-day design strength of 28 MPa for bridge decks. At 38 C, the lowest strength was 32.6 MPa for the concrete with 20 percent fly ash.
8
Figure 1. Compressive Strength of Specimens Cured at 23 C
Figure 2. Compressive Strength of Specimens Cured at 38 C for Up to 28 Days and Then at 23 C
Figure 3. Compressive Strength of Specimens Cured at 5 C for 28 Days and Then at 23 C
9
Figure 4. Compressive Strength of Specimens Cured at 10 C for Up to 28 Days and Then at 23 C
Figure 5. 28-Day Compressive Strength
At 28 days, strengths were satisfactory and in excess of 31.6 MPa at all temperatures (5 to 38 C), except for the 50 percent slag concrete cured at 5 C, which had a strength of 24.8 MPa. The highest strengths for the control and silica fume concretes were obtained when they were cured at 23 C and for fly ash or slag concretes when they were cured at 38 C. Concretes cured at low temperatures had lower strengths, but differences in strength with varying temperature were less in the control concrete than in the concretes with pozzolan or slag.
At 1 year, the compressive strengths were high, ranging from 51.9 to 75.1 MPa. The
control concrete had a similar strength regardless of the initial curing conditions. Concretes containing pozzolans or slag had higher 1-year strengths when initially cured at a low temperature. Testing of specimens cured at 5 or 10 C for 1 year was not planned since such an
10
environment is not typical for most states. Higher amounts of portland cement with fly ash or slag at a constant water content (lower W/CM) resulted in higher strength values.
The strength of each cylinder is given in Table A-2 of the Appendix. The coefficient of
variation for each batch is also shown. The results indicated that the average coefficient of variation was 4.5 percent, which is considered satisfactory.
Permeability values at 28 days are given in Table 5 for high-temperature curing and displayed in Figure 6 for 23 and 38 C combinations and in Figure 7 for 23 and 50 C combinations. Concretes had lower permeabilities at higher curing temperatures. The permeabilities were also lower when the duration of the high temperature was longer. The difference in permeability for concretes cured between 23 C and a higher temperature was largest for the fly ash concretes. The control concretes had coulomb values ranging from 4844 to 5892 at temperatures of 23 C and above, which are in the high range. The concretes with pozzolans or slag had 28-day coulomb values from 1029 to 4991 when cured at 23 C, which are in the low to high range. Silica fume concretes had the lowest values, followed by slag concretes. However, the values ranged from 540 to 2323 for various periods of high-temperature curing, which are in the very low to moderate range. Thus, high-temperature curing results in a lower 28-day permeability to a greater extent in concretes containing pozzolans or slag. The permeability values of concretes cured at 23 C for 28 and 90 days, 6 months, and 1 year are given in Table 6 and displayed in Figure 8. The results indicated that at 1 year, the coulomb value of the control decreased from a high to a moderate range. In concretes with pozzolans or slag, the coulomb values at 1 year were in the very low range, or close to it. Fly ash concretes showed the largest rate of reduction in permeability. In concretes with pozzolan or slag, the coulomb values at 1 year were similar to the values at 28 days when the specimens were cured 7 days at 23 C and 3 weeks at 50 C. At 6 months, the values were low or very low and similar to the 28-day results where specimens were cured 7 days at 23 C and 3 weeks at 38 C.
Figure 6. 28-Day Permeability of Concretes Cured at 23 and 38 C Combinations
11
Figure 7. 28-Day Permeability of Concretes Cured at 23 and 50 C Combinations
Figure 8. Reduction in Permeability of Concretes Cured at 23 C Even though control concretes also showed reductions with high-temperature curing, the reduction was not as much as in those in concretes with pozzolans or slag. Figure 9 shows direct comparisons of the 28-day permeability for specimens cured at 38 or 50 C after 7 days at 23 C; 6- and 12-month permeability for specimens cured at 23 C; and the 1-year permeability for specimens cured outdoors after 7 days in a moist room at 23 C. For specification purposes, the 28-day curing with the last 3 weeks at 38 C was selected since it is conservative and since a 38 C curing environment is more readily available. Table 6 and Figure 10 show that specimens cured at a low temperature had higher coulomb values at 28 days. To determine if additional favorable curing conditions would improve the permeability of concretes, specimens were cured at 5 or 10 C for 1 month and at 5 C for 90 days and then placed at 23 C up to 1 year. The results are shown in Figure 11 for an initial
12
Figure 9. Permeability with Different Curing Conditions and Ages
Figure 10. 28-Day Permeability of Concretes Cured at Different Temperatures
cure at 5 C and in Figure 12 for an initial cure at 10 C. They indicate that given time and favorable temperatures, the permeability is reduced to levels obtained at a regular constant curing temperature of 23 C. Also, concretes exposed to the outdoors after an initial 7-day cure at 23 C had the lowest coulomb values at 1 year. This shows that the environment in Charlottesville, Virginia, provided the moisture and favorable temperature needed to develop the desired permeability with time.
The permeability of each cylinder is given in Table A-3 of the Appendix. The coefficient of variation for each batch is also shown. The results indicated that the average coefficient of variation was 6.9 percent, which is considered satisfactory.
13
Figure 11. Reduction in Permeability of Concretes Cured for 1 Month at 5 C and Then at 23 C
Figure 12. Reduction in Permeability of Concretes Cured for 1 Month at 10 C and Then at 23 C
Fly ash concretes with more cement and a lower W/CM had higher strength and slightly
lower permeability. Slag concretes with more cement but less slag and a lower W/CM had higher strength but about the same or a slightly higher permeability.
Test 2
The water content and W/CM were higher in the concretes used in Test 2 than in those used in Test 1. As Table 8 shows, the strength and workability of these concretes were satisfactory. The compressive strength values given in Table 9 indicate that at day 1, the
14
compressive strengths were low, ranging from 1.0 to 2.6 MPa when specimens were cured at 10 C. At 23 C, strengths ranged from 5.8 to 12.4 MPa, with the control concrete having the highest strength. At 7 days, strengths were in excess of 16.8 MPa, most exceeding 21 MPa. As given in Table 9 and displayed in Figure 13, at 28 days, all values were 28 MPa or above, the lowest being that for fly ash concrete. The slag concrete with the lower W/CM had a higher strength than the one with the higher W/CM, as expected. Figure 14 shows the 1-year strengths of concretes cured at 23 C. The strengths were high, and the lowest value of 46.1 MPa was obtained for the fly ash concrete.
Figure 13. 28-Day Compressive Strength
Figure 14. 1-Year Compressive Strength
The permeability values given in Table 10 indicate that at 28 days, high coulomb values of 3577 and above were obtained with all concretes cured at 10 and 23 F, with values being higher with the low-temperature curing. With time, permeability decreased, as shown in Figure 15 for concretes cured at 23 C up to 1 year and in Figure 16 for concretes cured 1 month at 10 C and then 11 months at 23 C. At 1 year at 23 C, the control concrete had a coulomb value in the high range. Concretes with fly ash and slag had values ranging from 1198 to 2083, generally in the
15
Figure 15. Reduction in Permeability with Age for Concretes Cured at 23 C
Figure 16. Reduction in Permeability with Age for Concretes Cured at 10 C for 1 Month and Then at 23 C low range. The difference in coulomb values between the slag concretes with 2 W/CM was minimal, indicating that adding slag has a greater effect than changing the W/CM in achieving the desired permeability. The results for concretes cured at 10 C for 1 month and then at 23 C were similar to those for concretes cured at 23 C for 1 year. Specimens kept outdoors up to 1 year after a 7-day moist cure at 23 C had the lowest coulomb values.
CONCLUSIONS • Concretes cured at lower temperatures had lower strengths at earlier ages. Concretes with fly
ash and slag were more sensitive to temperature than control and silica fume concretes. Concretes with a low strength initially had the highest final strength.
16
• Concretes had a lower 28-day permeability when cured at higher temperatures. Concretes with pozzolan or slag had a lower permeability than the controls. The longer the duration of high-temperature curing and the higher the temperature, the lower the permeability, especially for concretes with pozzolan. Even though exposure to cold weather at early ages adversely affects permeability, further exposure to favorable temperatures in a moist environment lowers the permeability, negating the effects of the early cold temperature.
• Adding a pozzolan or slag had a greater effect on reducing the permeability of concretes than
changing the W/CM.
RECOMMENDATIONS
• Use pozzolans (fly ash or silica fume) or slag in concrete when durability is of concern. • Use high-temperature curing to obtain long-term permeability (6 months and beyond) at 28
days. For acceptance, cure specimens 1 week at 23 C and 3 weeks at 38 C and test them at 28 days.
• At cold temperatures, if the specified properties are not achieved, require the contractor to
change the mix design and/or protect the concrete by providing insulating blankets and/or external heat to ensure the desired product.
ACKNOWLEDGMENTS
This report was reviewed by Claude Napier, Richard Steele, Bill Bailey, Steve Lane, and Michael Sprinkel and edited by Linda Evans.
Englewood Cliffs, N.J. 2. Ozyildirim, C. 1994. Low-permeability concrete with slag and silica fume. ACI Materials
Journal, 91(2):197-202. 3. Ozyildirim, C. 1994. Resistance to penetration of chlorides into concretes containing latex,
fly ash, slag, and silica fume. In Durability of concrete. ACI SP-145, pp. 35-61. American Concrete Institute, Detroit.
17
4. Ozyildirim, C., and Halstead, W.J. 1994. Improved quality with fly ash and silica fume. ACI Materials Journal, 91(6):587-594.
5. Klieger, P. 1958. Effect of mixing and curing temperature on concrete strength. Journal of
the American Concrete Institute, 29(12):1063-1081. 6. Mindess, S., and Young, J. F. 1981. Concrete. Prentice-Hall Inc., Englewood Cliffs, N.J. 7. Kjellsen, K.O., Detwiler, R.J., and Gjorv, O.E. 1990. Pore structure of plain cement pastes
hydrated at different temperatures. Cement and Concrete Research, 20(6):927-933. 8. Campbell, G.M., and Detwiler, R.J. 1993. Development of mix designs for strength and
durability. Concrete International, 15(7):37-39. 9. Detwiler, R.J., Fapohunda, C.A., and Natale, J. 1994. Use of supplementary cementing
materials to increase the resistance to chloride ion penetration of concretes cured at elevated temperatures. ACI Materials Journal, 91(1):63-66.
10. Ozyildirim, C. 1992. Effect of calcium nitrite on the properties of concrete used in
prestressed piles and beams. VTRC 93-R5. Virginia Transportation Research Council, Charlottesville.
18
19
APPENDIX
Table A-1. Chemical and Physical Analyses of Cement, Slag, Fly Ash, and Silica Fume (%)