Final Research Report Research Project T1803, Task 42 Effects of Turbidity on Salmon EFFECTS OF TURBIDITY AND SUSPENDED SOLIDS ON SALMONIDS by Jeff Bash Cara Berman Research Technician Research Scientist Susan Bolton Associate Professor and Director Center for Streamside Studies University of Washington, Box 352100 Seattle, Washington 98195 Washington State Transportation Center University of Washington, Box 354802 University District Building 1107 NE 45 th Street, Suite 535 Seattle, Washington 98105-4631 Washington State Department of Transportation Technical Monitor Edward Molash Environmental Affairs Prepared for Washington State Transportation Commission Department of Transportation and in cooperation with U.S. Department of Transportation Federal Highway Administration November 2001
Transcript
Final Research Report Research Project T1803, Task 42 Effects of Turbidity on Salmon
EFFECTS OF TURBIDITY AND SUSPENDED SOLIDS ON
SALMONIDS
by Jeff Bash Cara Berman Research Technician Research Scientist
Susan Bolton Associate Professor and Director Center for Streamside Studies
University of Washington, Box 352100 Seattle, Washington 98195
Washington State Transportation Center
University of Washington, Box 354802 University District Building
1107 NE 45th Street, Suite 535 Seattle, Washington 98105-4631
Washington State Department of Transportation
Technical Monitor Edward Molash
Environmental Affairs
Prepared for
Washington State Transportation Commission Department of Transportation
and in cooperation with U.S. Department of Transportation
Federal Highway Administration
November 2001
iii
Disclaimer
The contents of this report reflect the views of the authors, who are responsible
for the facts and the accuracy of the data presented herein. The contents do not
necessarily reflect the official views or policies of the Washington State Transportation
Commission, Department of Transportation, or the Federal Highway Administration.
This report does not constitute a standard, specification, or regulation.
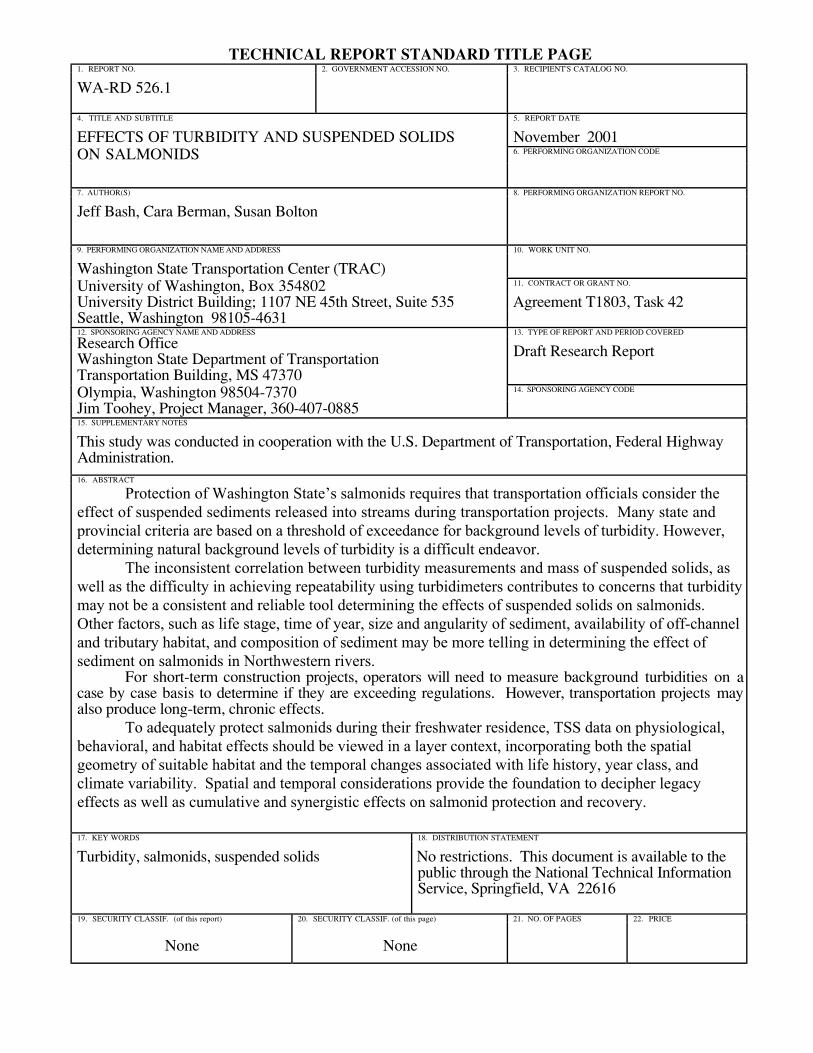
TECHNICAL REPORT STANDARD TITLE PAGE1. REPORT NO. 2. GOVERNMENT ACCESSION NO. 3. RECIPIENT'S CATALOG NO.
WA-RD 526.1
4. TITLE AND SUBTITLE 5. REPORT DATE
EFFECTS OF TURBIDITY AND SUSPENDED SOLIDS November 2001ON SALMONIDS 6. PERFORMING ORGANIZATION CODE
9. PERFORMING ORGANIZATION NAME AND ADDRESS 10. WORK UNIT NO.
Washington State Transportation Center (TRAC)University of Washington, Box 354802 11. CONTRACT OR GRANT NO.
University District Building; 1107 NE 45th Street, Suite 535 Agreement T1803, Task 42Seattle, Washington 98105-463112. SPONSORING AGENCY NAME AND ADDRESS 13. TYPE OF REPORT AND PERIOD COVERED
Research OfficeWashington State Department of TransportationTransportation Building, MS 47370
Draft Research Report
Olympia, Washington 98504-7370 14. SPONSORING AGENCY CODE
Jim Toohey, Project Manager, 360-407-088515. SUPPLEMENTARY NOTES
This study was conducted in cooperation with the U.S. Department of Transportation, Federal HighwayAdministration.16. ABSTRACT
Protection of Washington State’s salmonids requires that transportation officials consider theeffect of suspended sediments released into streams during transportation projects. Many state andprovincial criteria are based on a threshold of exceedance for background levels of turbidity. However,determining natural background levels of turbidity is a difficult endeavor.
The inconsistent correlation between turbidity measurements and mass of suspended solids, aswell as the difficulty in achieving repeatability using turbidimeters contributes to concerns that turbiditymay not be a consistent and reliable tool determining the effects of suspended solids on salmonids.Other factors, such as life stage, time of year, size and angularity of sediment, availability of off-channeland tributary habitat, and composition of sediment may be more telling in determining the effect ofsediment on salmonids in Northwestern rivers.
For short-term construction projects, operators will need to measure background turbidities on acase by case basis to determine if they are exceeding regulations. However, transportation projects mayalso produce long-term, chronic effects.
To adequately protect salmonids during their freshwater residence, TSS data on physiological,behavioral, and habitat effects should be viewed in a layer context, incorporating both the spatialgeometry of suitable habitat and the temporal changes associated with life history, year class, andclimate variability. Spatial and temporal considerations provide the foundation to decipher legacyeffects as well as cumulative and synergistic effects on salmonid protection and recovery.
17. KEY WORDS 18. DISTRIBUTION STATEMENT
Turbidity, salmonids, suspended solids No restrictions. This document is available to thepublic through the National Technical InformationService, Springfield, VA 22616
19. SECURITY CLASSIF. (of this report) 20. SECURITY CLASSIF. (of this page) 21. NO. OF PAGES 22. PRICE
None None
v
Table of Contents I. Introduction .....................................................................................................................1
II. Definitions.......................................................................................................................3 MEASUREMENTS ......................................................................................................................................... 3 LIMITATIONS OF USING TURBIDITY AS A MEASUREMENT ........................................................................... 5 TURBIDITY METERS .................................................................................................................................... 6 SUMMARY ................................................................................................................................................... 6
III. Natural Background Levels of Turbidity in the Pacific Northwest ..............................7 SUMMARY ................................................................................................................................................... 8
IV. Effects of Turbidity and Suspended Solids on Salmonids............................................9 RANGE OF EFFECTS ON SALMONIDS............................................................................................................ 9 CUMULATIVE EFFECTS.............................................................................................................................. 10 ENVIRONMENTAL FACTORS AFFECTING THE EFFECT OF SEDIMENT ON SALMONIDS................................. 11 REDUCTION IN BUFFERING CAPACITY....................................................................................................... 12 RESEARCH SUMMARY ............................................................................................................................... 13 NOTE ON TURBIDITY AND SEDIMENT STUDIES.......................................................................................... 14 A. PHYSIOLOGICAL EFFECTS .............................................................................................................. 14
B. BEHAVIORAL EFFECTS................................................................................................................... 19 Avoidance ............................................................................................................................................. 19 Territoriality ......................................................................................................................................... 20 Foraging and Predation ....................................................................................................................... 21 Abundance and Diversity of Prey ......................................................................................................... 25 Microfauna ........................................................................................................................................... 26 Primary Production.............................................................................................................................. 27 Homing and Migration ......................................................................................................................... 28
C. HABITAT ....................................................................................................................................... 29 Increased Embeddedness...................................................................................................................... 29 Reduction in Habitat Complexity and Abundance................................................................................ 30 Refugia.................................................................................................................................................. 30 Alterations to Hyporheic Inputs............................................................................................................ 30 Note on Bull Trout ................................................................................................................................ 31 Specific Road and Devegetation Effects ............................................................................................... 31
PREVIOUS LITERATURE REVIEWS : LLOYD (1987) AND NEWCOMBE AND MACDONALD (1991) ............. 32 V. Assessment of Whether Emulsion Characteristics of Turbidity have a
Significant Differential Effect on Salmonid Survival, Growth, and Reproduction. ..............................................................................................44
SUMMARY ................................................................................................................................................. 46 VI. Current State and Provincial Turbidity Standards. ......................................................47
SUMMARY ................................................................................................................................................. 50 VII. Turbidity Requirements for Hatcheries.....................................................................51
CONTROLLING TURBIDITY AND SUSPENDED SOLIDS IN HATCHERY WATER ............................................. 51 OUTFLOW FROM HATCHERIES................................................................................................................... 52 SUMMARY ................................................................................................................................................. 52
VIII. Recommendations....................................................................................................53
Web Sites……………. ......................................................................................................65
Appendix A 1999 Washington State Water Quality Data ..................................................1
Appendix B Tables from Newcombe and MacDonald (1991) ...........................................1
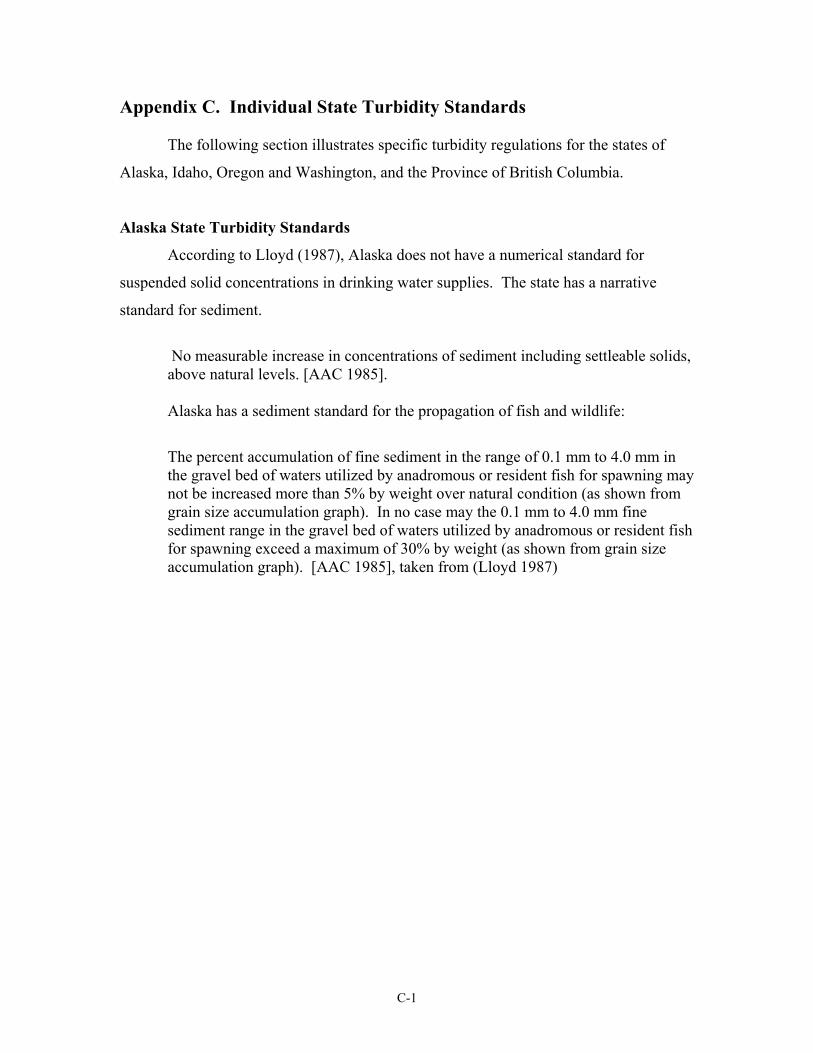
Appendix C Individual State Turbidity Standards.............................................................1 ALASKA STATE TURBIDITY STANDARDS..................................................................................................... 1 IDAHO STATE TURBIDITY STANDARDS........................................................................................................ 2 OREGON STATE TURBIDITY STANDARDS .................................................................................................... 3 WASHINGTON STATE TURBIDITY STANDARDS............................................................................................ 4 BRITISH COLUMBIA STANDARDS ................................................................................................................ 5 EUROPEAN INLAND FISHERIES ADVISORY COMMITTEE (EIFAC) ............................................................... 6
Appendix D Total Maximum Daily Loads .........................................................................1 UMATILLA TMDL (OREGON) ..................................................................................................................... 1 LOWER YAKIMA TMDL (WASHINGTON).................................................................................................... 1 IDAHO TMDLS............................................................................................................................................ 3 SUMMARY ....................................................................................................................................................3
vii
Tables Table 1. Effects of turbidity on salmonids ................................................................10
Table 2. Some reported effects of turbidity and suspended sediment concentrations on salmonids outside Alaska (Lloyd 1987).........................35
Table 3. Summary of suspended sediment effects on selected salmonids commonly present in the Yakima River basin ............................................38
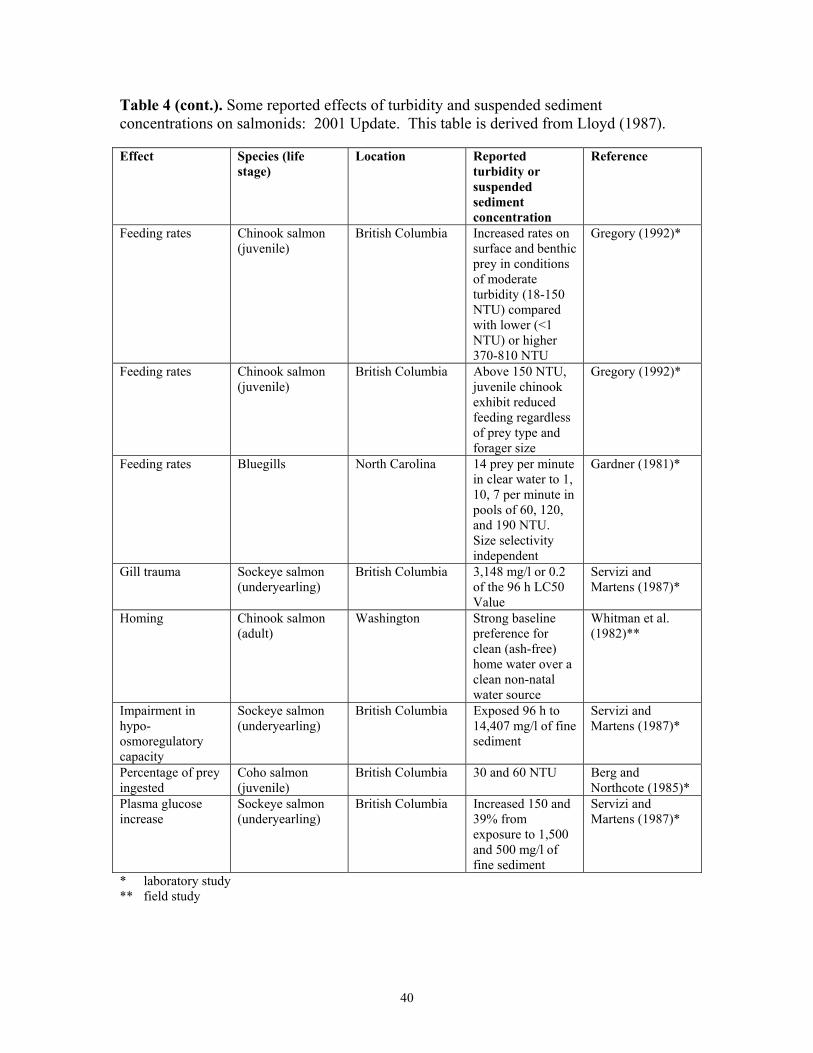
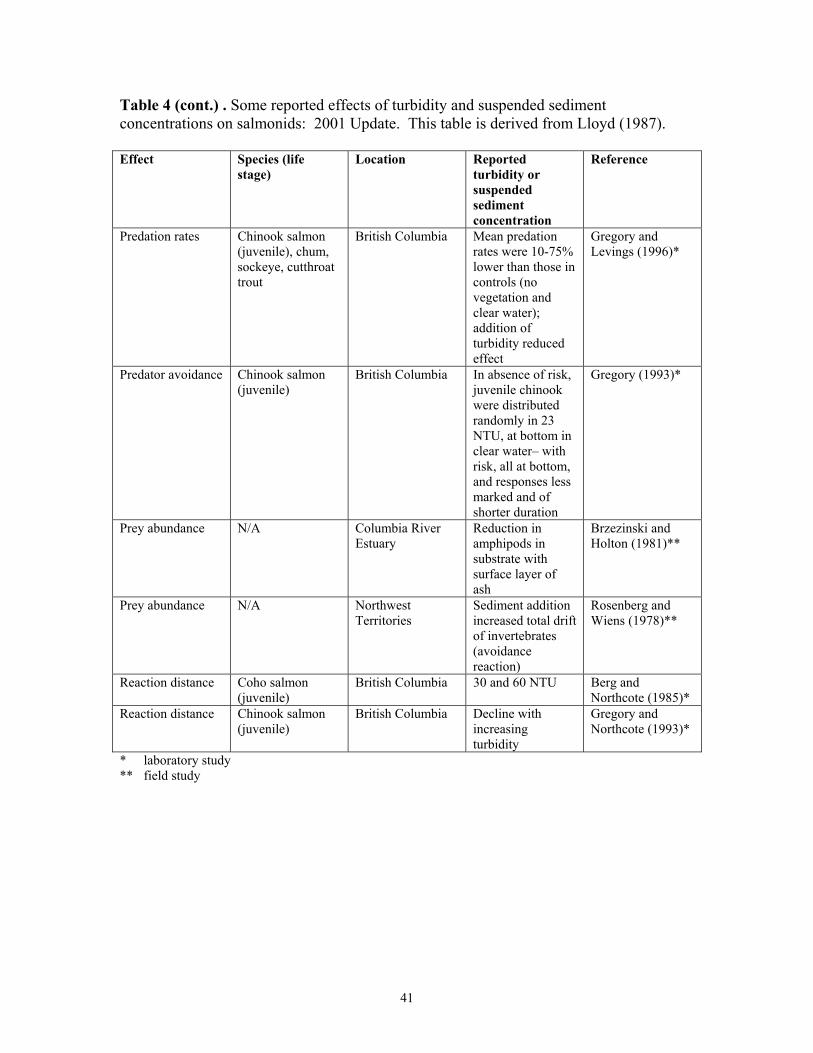
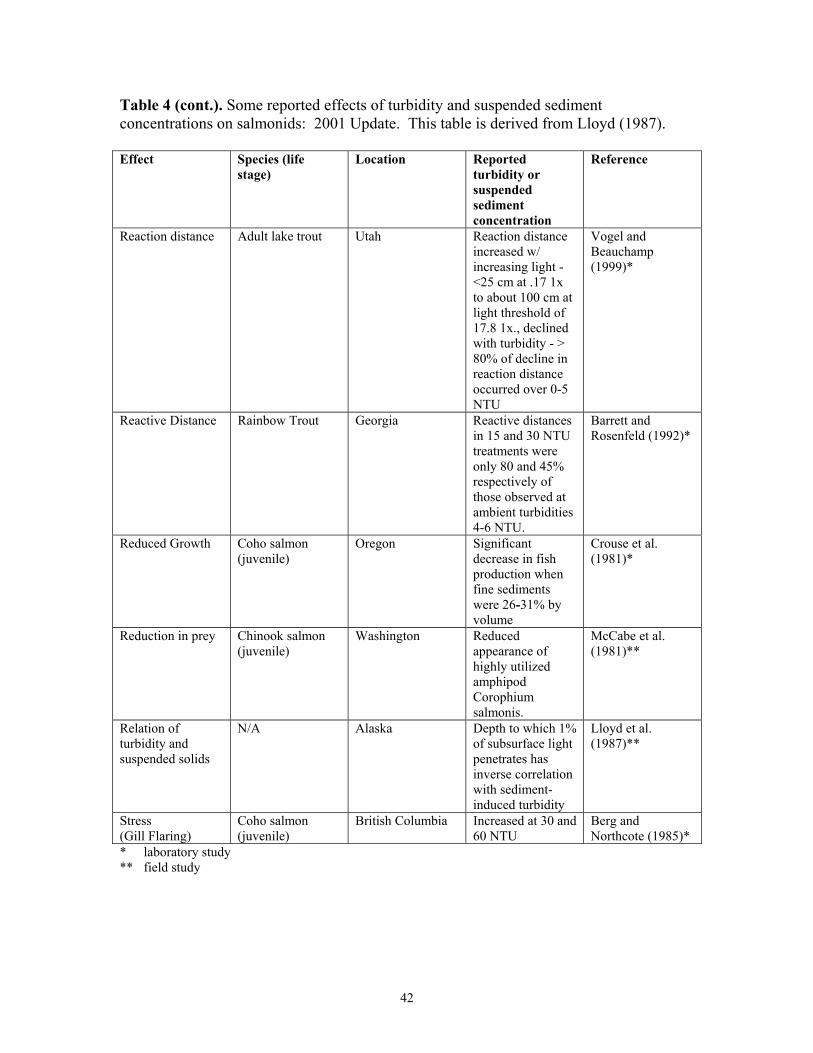
Table 4. Some reported effects of turbidity and suspended sediment concentrations on salmonids: 2001 update. ...............................................39
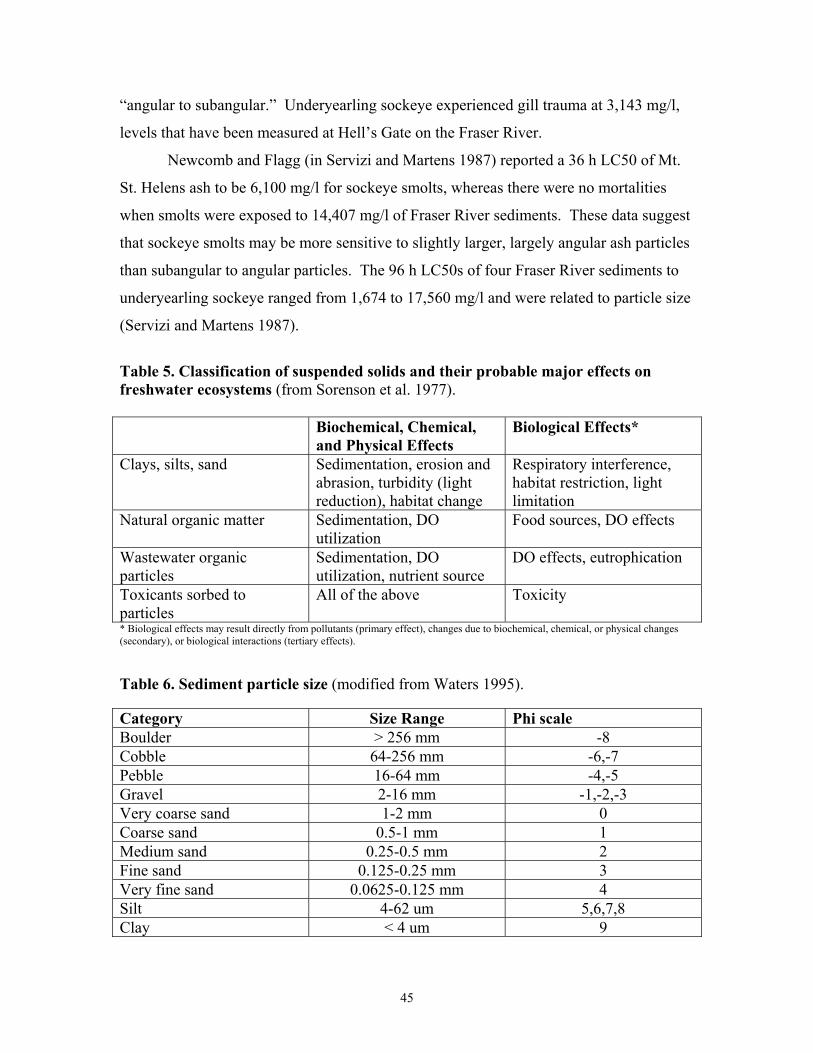
Table 5. Classification of suspended solids and their probable major effects on freshwater ecosystems............................................................................45
Table 6. Sediment particle size (modified from Waters 1995) .................................45
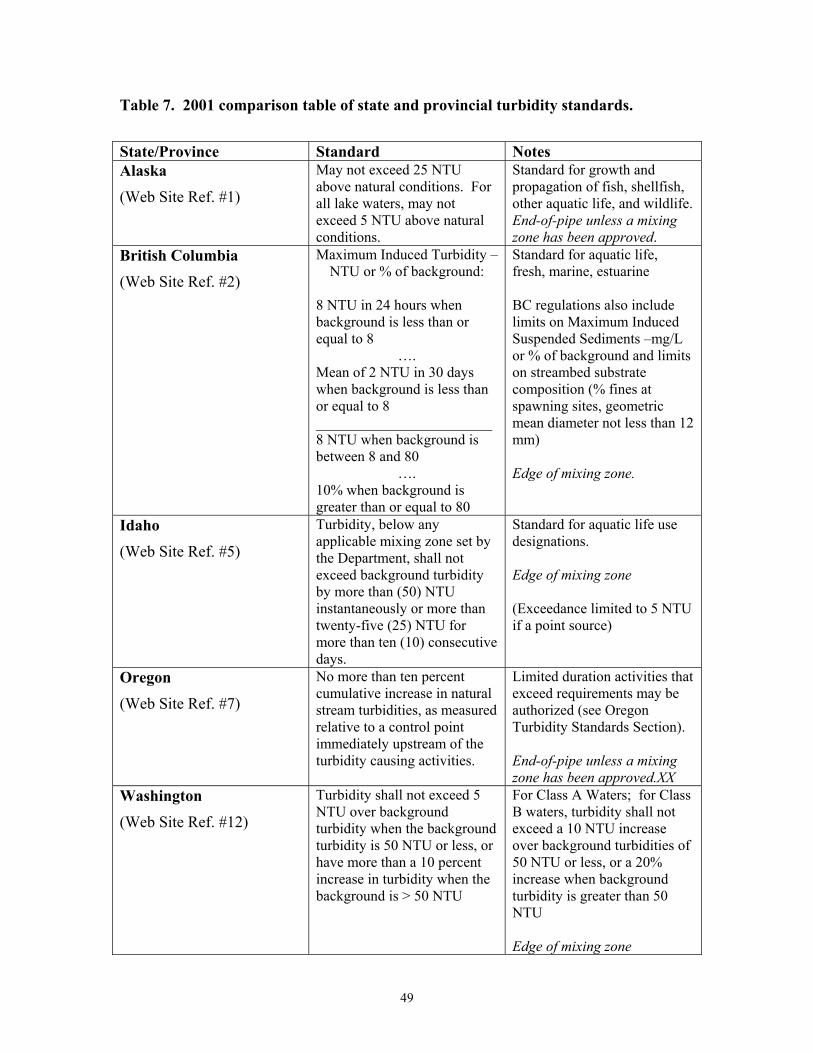
Table 7. 2001 comparison table of state and provincial turbidity standards .............49
Table 8. Numerical turbidity standards for protection of fish and wildlife habitats in Alaska and other states……………………………………………........50
Table A-1. Discharge (cfs) and turbidity (NTUs) measured in Western Washington streams during 1988-99 .................................................................................1
Table A-2. Turbidity (NTUs) measured in three Western Washington streams during 1988-99 .................................................................................1
Table A-3. TSS (mg/l) measured in three Western Washington streams during 1988-99 ..........................……………………………………………1
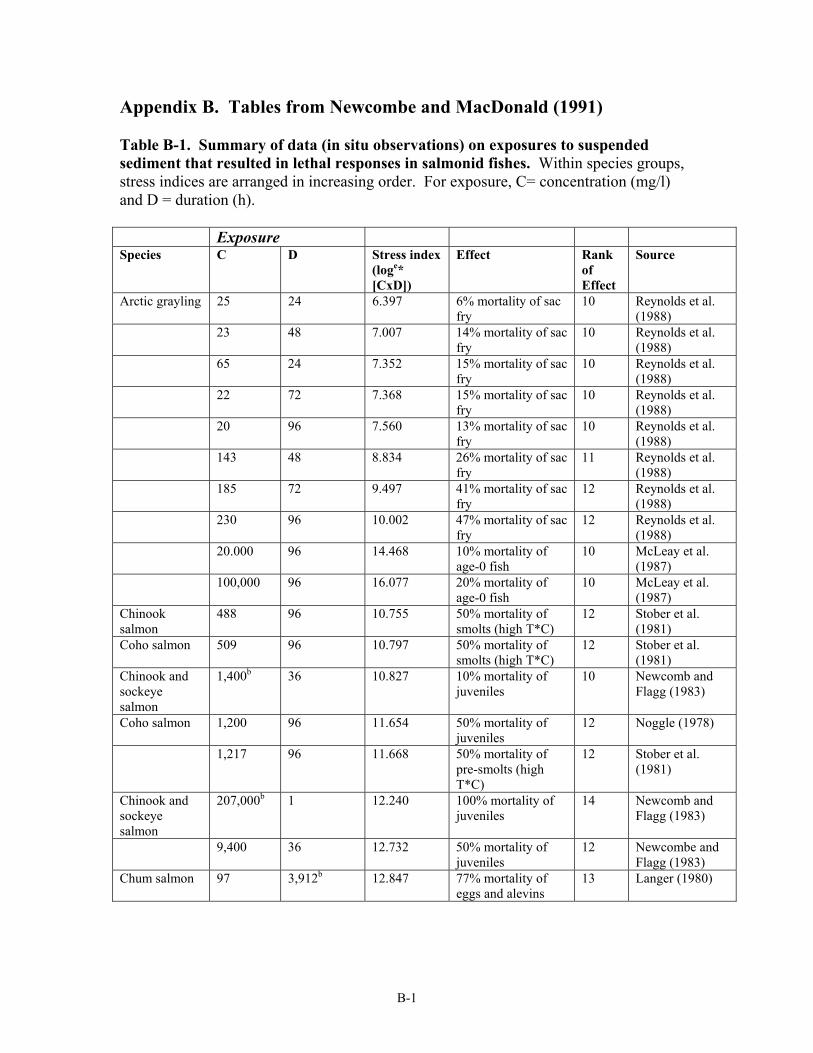
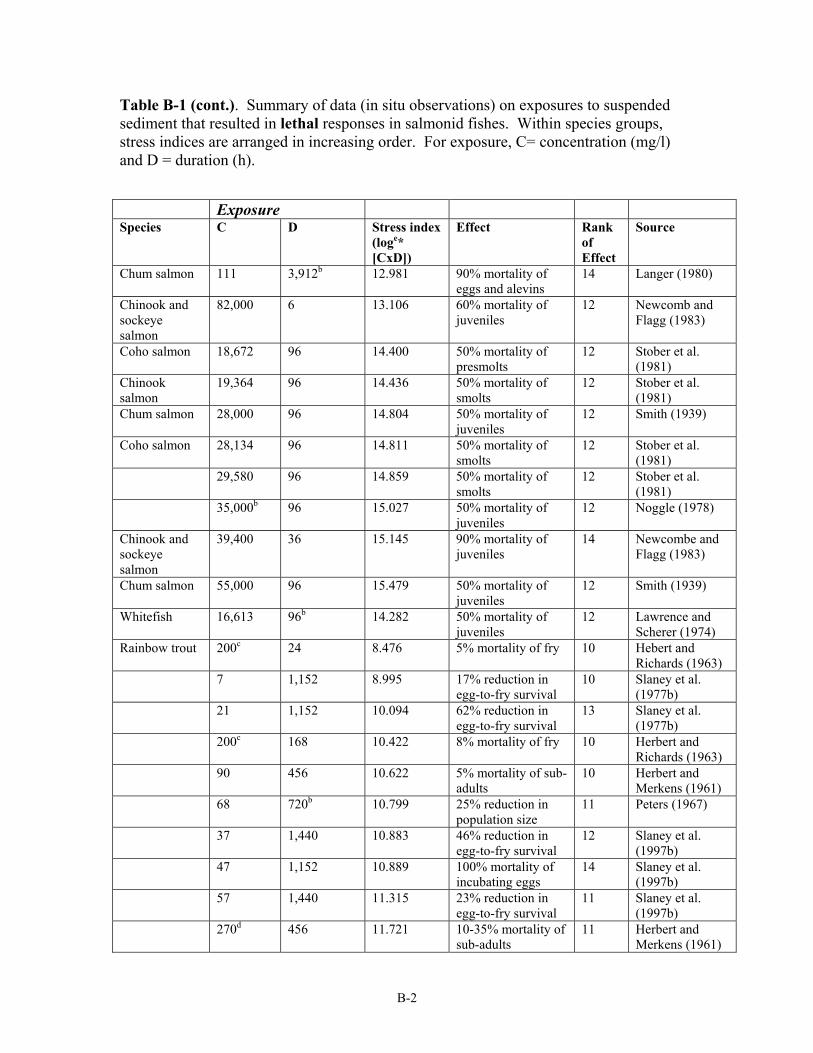
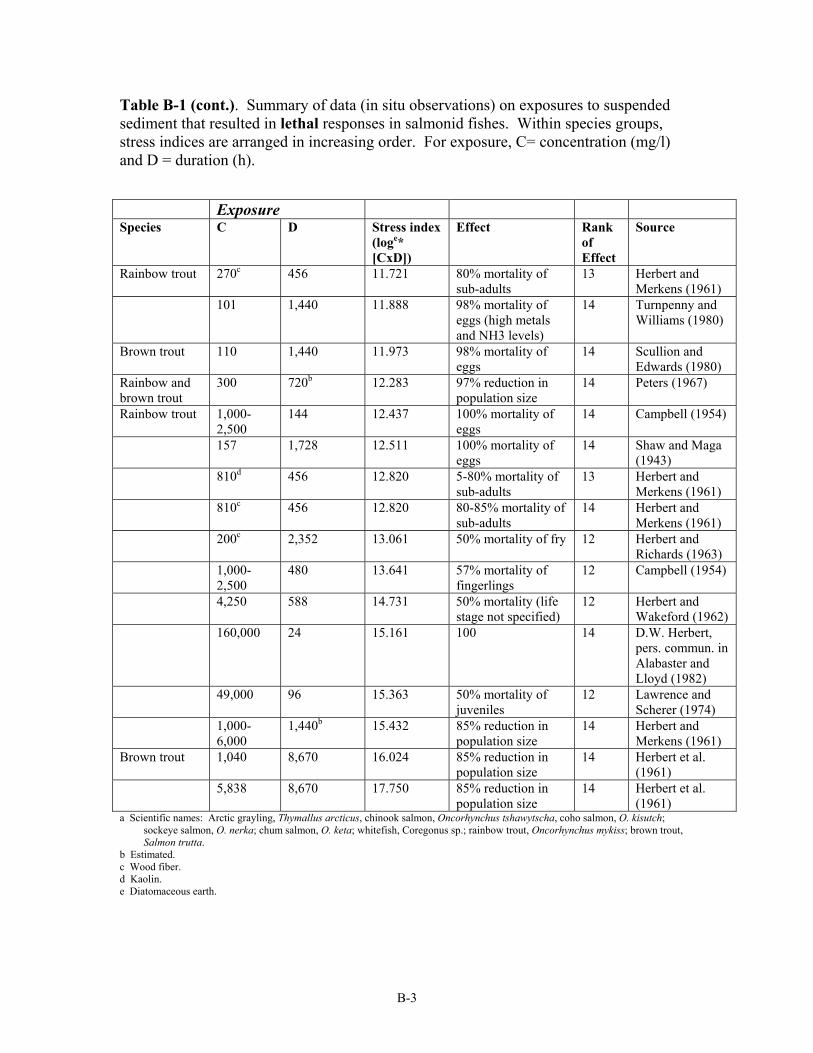
Table B-1. Summary of data (in situ observations) on exposures to suspended sediment that resulted in lethal responses in salmonid fishes. ......................1
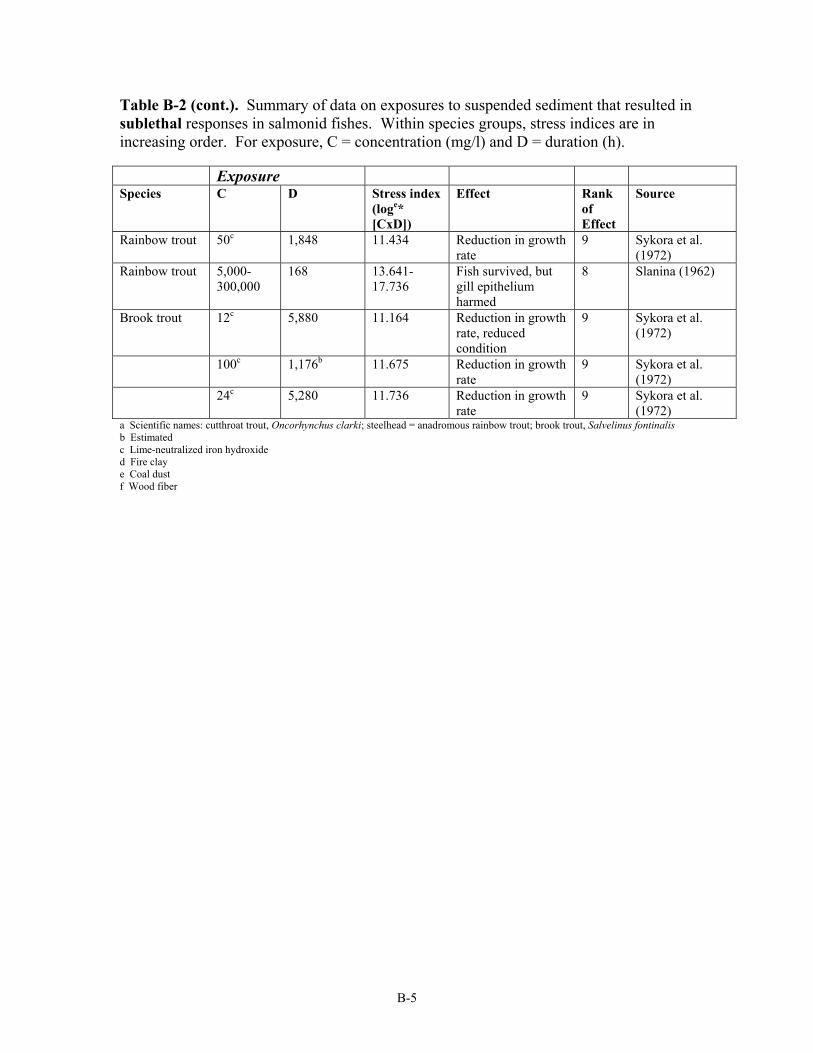
Table B-2. Summary of data on exposures to suspended sediment that resulted in sublethal responsesin salmonid fishes.......................................................4
Table B-3. Summary of data on exposures to suspended sediment that resulted in behavioral responses in salmonid fishes. ..................................................6
Table C-1. Alaska state turbidity standards.....................................................................2
Table C-2. Washington state turbidity standards ............................................................4
Table C-3 British Columbia turbidity and suspended sediment standards....................5
viii
ix
Summary
Human activities in Northwestern watersheds, including logging, grazing,
agriculture, mining, road building, urbanization, and commercial construction contribute
to periodic pulses or chronic levels of suspended sediment in streams. Suspended
sediment is associated with negative effects on the spawning, growth, and reproduction of
salmonids.
Effects on salmonids will differ based on their developmental stage. Suspended
sediments may affect salmonids by altering their physiology, behavior, and habitat, all of
which may lead to physiological stress and reduced survival rates. A sizable body of data
(laboratory and field-based) has been gathered in North America focusing on the
relationship between turbidity, total suspended sediments, and salmonid health. The
controlled environment of laboratory studies tends to give clearer results than field
studies.
Understanding the relationship between turbidity measurements, suspended
sediments, and their effects on salmonids at various life stages will assist agencies
implementing transportation projects to devise techniques to reduce temporary and
chronic erosion and sedimentation associated with these activities. There are three
primary ways in which sediment in the water column is measured: turbidity, total
suspended solids, and water clarity. While these measures are frequently correlated with
one another, the strength of correlation may vary widely between samples from different
monitoring sites and between different watersheds. Turbidity is currently in widespread
use by resource managers, partially due to the ease of taking turbidity measurements. In
addition, current state regulations addressing suspended sediment are usually NTU-based.
The disadvantage of turbidity is that it is only an indicator of suspended sediment effects,
rather than a direct measure, and may not accurately reflect the effect on salmonids. Protection of Washington State’s salmonids requires that transportation officials
consider the effect of suspended sediments released into streams during transportation
projects.
Many state and provincial criteria are based on a threshold of exceedance for
background levels of turbidity. However, determining natural background levels of
turbidity is a difficult endeavor. Turbidity measures may be affected by 1) differing
physical processes between watersheds including geologic, hydrologic and hydraulic
x
conditions; 2) legacy issues (activities historically conducted in the watershed); and 3)
problems with instrumentation and repeatability of turbidity measurements. Altered
systems may not provide accurate baseline conditions.
The inconsistent correlation between turbidity measurements and mass of
suspended solids, as well as the difficulty in achieving repeatability using turbidimeters
contributes to concerns that turbidity may not be a consistent and reliable tool
determining the effects of suspended solids on salmonids. Other factors, such as life
stage, time of year, size and angularity of sediment, availability of off-channel and
tributary habitat, and composition of sediment may be more telling in determining the
effect of sediment on salmonids in Northwestern rivers.
Although salmonids are found in naturally turbid river systems in the Northwest,
this does not necessarily mean that salmonids in general can tolerate increases over time
of suspended sediments. An understanding of sediment size, shape, and composition,
salmonid species and life history stages, cumulative and synergistic stressor effects, and
overall habitat complexity and availability in a watershed is required.
For short-term construction projects, operators will need to measure background
turbidities on a case by case basis to determine if they are exceeding regulations.
However, transportation projects may also produce long-term, chronic effects. Short-
term pulses will presumably have a different effect on salmonids than chronic exposure.
To adequately protect salmonids during their freshwater residence, TSS data on
physiological, behavioral, and habitat effects should be viewed in a layer context
incorporating both the spatial geometry of suitable habitat and the temporal changes
associated with life history, year class, and climate variability. Spatial and temporal
considerations provide the foundation to decipher legacy effects as well as cumulative
and synergistic effects on salmonid protection and recovery.
1
I. Introduction
Human activities in Northwestern watersheds, including logging, grazing,
agriculture,
mining, road building, urbanization, and commercial construction have often
resulted in periodic pulses or chronic levels of suspended sediment in streams.
Suspended sediment is associated with negative effects on the spawning, growth, and
reproduction of salmonids (e.g., Noggle 1978, Berg 1982, Lloyd et al. 1987, Reid 1998).
Effects on salmonids will differ based on their developmental stage. Suspended
sediments may affect salmonids by altering their physiology, behavior, and habitat, all of
which may lead to physiological stress and reduced survival rates. A sizable body of data
has been gathered in North America focusing on the relationship between turbidity, total
suspended sediments, and salmonid health.
Recent listings of salmonids under the Endangered Species Act (ESA) and the
desire to protect and restore declining stocks have increased interest in the relationship
between the release of fine sediment and salmonid productivity and survival. The
purpose of this report is to provide an analysis of the current state of the science
regarding the relationship between turbidity levels and the survival, reproduction, and
growth functions of salmonids. We will also examine research that measures the effect
of total suspended sediment on the health of salmonids.
Transportation projects often include activities that may negatively affect water
quality, via disturbance of instream sediments for bridge and culvert construction or
stormwater runoff from transportation construction sites (E. Molash, pers. commun.).
Road-related erosion may significantly increase chronic turbidity levels in streams (Reid
1998). Roading may also affect subsurface flows, affecting upwelling in the stream
(Sedell et al. 1990). It should be noted that much of the research on the effects of roads
on suspended sediment and turbidity has focused on unpaved forest roads.
Understanding the relationship between turbidity measurements, suspended
sediments, and their effects on salmonids at various life stages will assist agencies
implementing transportation projects to devise techniques to reduce temporary and
chronic erosion and sedimentation associated with these activities. Methods such as soil
covers, project staging, land clearing windows, and water treatment systems could be
2
implemented to prevent occurrence of critical turbidity levels (E. Molash, pers.
commun.).
3
II. Definitions Measurements
There are three primary ways in which sediment in the water column is measured:
turbidity, total suspended solids, and water clarity. Although these three metrics measure
different aspects of suspended sediments, they are often incorrectly used in research
papers (A. Steel, pers. commun.). While these measures are frequently correlated with
one another, the strength of correlation may vary widely between samples from different
monitoring sites and between different watersheds (Duchrow and Everhart 1971, A.
Steel, pers. commun.). For example, parent material in a basin, weathering rate, texture
of sediment and soils produced through weathering and erodibility all have a great
influence on the amount, texture, and behavior of fine sediments in streams (Everest et al.
1987).
Turbidity is an optical property of water where suspended and dissolved
materials such as silt, clay, finely divided organic and inorganic matter, chemicals,
plankton, and other microscopic organisms cause light to be scattered rather than
transmitted in straight lines. Measurements of turbidity have been developed to quickly
estimate the amount of sediment within a sample of water and to describe the effect of
suspended solids blocking the transmission of light through a body of water (Lloyd
1987).
Turbidity is usually measured by nephelometry – the relative measurement of
light scattering through a restricted range of angles to the incident light beam. Typically,
nephelometers detect light scattered by a water sample usually at 90° to the incident
beam. Nephelometric turbidity units (NTUs) are used as a rough index of the fine
suspended sediment content of the water (Davies-Colley and Smith 2000). In the past,
turbidity was measured using Jackson Turbidity Units (JTUs). The Jackson Candle
Turbidimeter was limited in that it could not measure turbidities lower than 25 JTU and
was dependent on human judgment (Web Site Ref. #3). At high turbidities, JTUs and
NTUs are roughly equivalent (Lloyd 1987). Please note that JTUs are only used in this
report in tables culled from previous literature reviews.
Total Suspended Solids (TSS) represents the actual measure of mineral and
organic particles transported in the water column. TSS is an important measure of
4
erosion, and is linked to transport of nutrients, metals, and industrial and agricultural
chemicals through river systems. Suspended sediment consists primarily of silt and clay-
size particles that may be rapidly transported downstream and locally deposited on
floodplains and overbank storage locations or may infiltrate into gravel interstices of the
bed (Everest et al. 1987). Note that in older literature, TSS may also be referred to as
suspended sediment concentration (SSC). This term will be used in the literature review
where appropriate. Fluctuating TSS levels may influence aquatic life from fish to
phytoplankton. Fine particles may carry substances that are harmful or toxic to aquatic
life.
TSS is determined by measuring the residue in a well-mixed sample of water
which will not pass a standard (glass fiber) filter. The residue trapped on the filter is
dried (103-105 °C) and reported in units of weight per volume (typically mg/l) (Sorenson
et al. 1977).
Water clarity, a direct measure of visible distance through water is another
important measure related to the presence of sediment in the water column. Visual water
clarity describes the distance that an organism can see underwater. Water clarity is
affected by suspended and dissolved materials (Davies-Colley and Smith 2000).
Correlations between visual water clarity and turbidity (NTU) or TSS may vary
dramatically between watersheds.
Changes in water clarity alter the balance between predators and prey and may
have a strong effect on individual behaviors (A. Steel, pers. commun.). Historically,
water clarity has been measured with a Secchi disk, a black and white disk submerged
vertically into the water until it can no longer be seen (Davies-Colley and Smith 2000).
Three water quality tests are related to sedimentation in streams:
Turbidity Total Suspended Solids Water Clarity Measure of the refractory characteristics of material in the water. Not always correlated with total suspended solids
Actual measure of the amount of sediment suspended in the water column
Measure of visual distance in the water column
5
Limitations of Using Turbidity as a Measurement
The widespread use of turbidity as a water quality standard and indicator of
suspended solid concentration can, at least in part, be attributed to the ease and cost of
using a nephelometric turbidity meter in the field (Davis-Colley and Smith 2000) in
comparison to the direct measurement of suspended solids. Duchrow and Everhart
(1971) noted that direct measurement of settleable solids is difficult and time consuming.
Turbidity cannot always be correlated with suspended solid concentrations due to
the effects of size, shape, and refractive index of particles (Sorenson et al. 1977).
Duchrow and Everhart (1971) noted that turbidity measurements are primarily useful if:
1) a major portion of the total turbidity is contributed by settleable solids; 2) a
relationship exists between turbidity readings and weight per unit of volume of suspended
sediment and; 3) if a reliable meter is available.
Duchrow and Everhart (1971) tested different materials to determine if similar
turbidity readings were obtained at the same concentration. At higher turbidity readings,
they found a poor correlation between readings and suspended sediment concentrations
(SSC) for all materials tested. Duchrow and Everhart (1971) questioned the use of
turbidity as a parameter for establishing water quality standards, as too many factors must
remain constant before a turbidity measurement can be converted to a corresponding
SSC.
The relationship between turbidity and SSC may also change along a downstream
gradient from a sediment source. Larger particles, which generally produce less turbidity
per unit concentration than smaller particles, gradually settle out, thus shifting the
turbidity versus SSC relationship to a higher NTU per unit SSC in reaches progressively
farther down stream (Lloyd 1987).
Davies-Colley and Smith (2000) have suggested that water clarity is a more useful
measure for determining the effect of suspended solids. These researchers suggest that
turbidity is only a relative measurement that has no environmental relevance in itself,
unless calibrated to clarity or some other absolute optical quantity or to suspended
sediment mass concentration, at each site of interest.
6
This research implies that turbidity may not be a reliable tool for determining the
effects of suspended solids on salmonids. The inconsistent correlation between turbidity
measurements and mass of suspended solids, as well as the difficulty in achieving
repeatability using turbidimeters contributes to concerns regarding this technique.
Turbidity Meters
The consistency of turbidimeters is an issue of concern. Duchrow and Everhart
(1971) tested three different turbidimeters and found that there was a highly significant
difference between readings on the same sample of suspended sediment. Further
examination revealed increasing variance between readings with an increase in turbidity.
Highly significant differences were also present between readings obtained on the seven
materials for each meter. Recent studies in King County also noted problems with
reliability and consistency of turbidimeters (D. Booth, pers. commun.).
Summary
Turbidity, TSS and water clarity are three common measures used to determine
the effect of suspended sediment on salmonids. Turbidity is currently in widespread use
by resource managers, partially due to the ease of taking turbidity measurements. In
addition, current state regulations addressing suspended sediment are usually NTU-based.
The disadvantage of turbidity is that it is only an indicator of suspended sediment effects,
rather than a direct measure, and may not accurately reflect the effect on salmonids.
Other factors, such as life stage, time of year, size and angularity of sediment,
availability of off-channel and tributary habitat, and composition of sediment may be
more telling in determining the effect of sediment on salmonids in Northwestern rivers.
In addition, many watersheds have been affected by land use that alters sediment input
and transport, and therefore do not provide accurate baseline conditions. Unaltered
systems display wide ranges of turbidity over space and time, and therefore long-term
data are needed to understand baseline conditions.
7
III. Natural Background Levels of Turbidity in the Pacific Northwest
Determining natural background levels of turbidity is a difficult endeavor.
Turbidity measures may be affected by 1) differing physical processes between
watersheds; 2) legacy issues (activities historically conducted in the watershed); and 3)
problems with instrumentation and repeatability of turbidity measurements (as mentioned
in the previous section).
Turbidity can vary between watersheds, based on the geology of each particular
basin. For example, systems fed by glacial meltwater often have higher turbidities than
other systems (Lloyd et al. 1987). In addition, tributaries and stream segments within the
same system may have widely divergent background turbidities. Headwater streams tend
to be less turbid then mainstems or estuaries – faster flowing water transports suspended
sediment downstream quickly. The patchiness of turbidity, both spatially and temporally,
influences how salmonids use a river system in various life stages (Sedell et al. 1990).
In Northwestern watersheds, natural background turbidity varies on a seasonal
basis depending on when precipitation and runoff occur (higher in spring in the Fraser
River, Servizi and Martens 1987) and depends on the hydrologic regime (lowland
Washington streams typically see higher turbidity in fall and winter; Appendix A).
Increased rainfall and storm events usually produce an increase in erosion and transport
of sediments deposited in streams. Monitoring at specific sites throughout a watershed
would allow managers to understand the range of change that occurs at a particular site
and across the watershed. Methods of monitoring turbidity vary in quality and
convenience and their effectiveness changes with stream size (E. Ritzenthaler, pers.
commun.).
The State of Washington’s 1999 Water Quality Data Report provides water
quality data points for a number of Washington state creeks and rivers, including
turbidity measurements (Web Site Ref. #11). Twelve measures were taken between the
end of 1998 and September of 1999. Monthly values for turbidity from this report for
four sites (two on the Stilliguamish, one on the Skagit, one on the Samish) are in
Appendix A. Note the fluctuation in turbidity at some of these monitoring stations over
a twelve month period. In order to determine “natural background turbidity,” continuous
measurements would be necessary over time and across space. Historical and current
8
changes to the system affecting sediment input and processes, load, and transport must
also be understood. This data set does not provide enough context to determine “natural
background turbidity.” In addition to state water quality data, a sample of data collected
by King County METRO is included in Appendix A. Three rivers were sampled in
1988-1999 to determine where turbidity and total suspended solids were of concern.
Without continuous monitoring throughout a basin, turbidity data only provides a
series of scattered data points that are not linked to temporal or spatial parameters of the
watershed. Without this context, it is difficult to make a determination regarding how
turbidity levels are affecting the system. This problem is inherent in the collection of
water quality data and development of water quality criteria.
Summary
In order to develop “natural” background turbidities, a stratified sample allowing
one to differentiate between different physical and biological processes affecting
watersheds is necessary. Continuous sampling across these systems may also provide
information on how salmonids persist within highly variable systems. The historical
legacy of systems is also an important and necessary factor to consider in evaluating this
information.
9
IV. Effects of Turbidity and Suspended Solids on Salmonids
Sedimentation derived from land use activities is recognized as a primary cause of
habitat degradation in the range of west coast chinook, steelhead, cutthroat, and bull trout
(USFWS 1998, Web Site Ref. #6). Land-use practices, through alteration of vegetation,
hydrology and soil structure can alter the delivery of fine and coarse sediments to
streams, thus affecting salmonid habitats. Sediment delivery rates and composition are
controled by topography, climate, geology, hydrology, and vegetation (Spence et al.
1996).
The alteration of upslope hydrological and erosional processes with associated
changes in instream hydrological, erosional, and depositional processes has resulted in a
reduction in channel depth and increased fine and course sediment load. Logging,
grazing, irrigation, stream channelization, chemical and nutrient applications, mining,
agriculture, road construction, dam development and operation, and urban and rural
development have played a role in altering upslope and instream physical and biological
processes (Berman 1998).
Range of Effects on Salmonids
A range of studies have illustrated the effect of turbidity levels beyond natural
background on the physiology and behavior of salmonids (Lloyd 1987, Everest et al.
1987, Newcombe and MacDonald 1991, Gregory and Northcote 1993). Lloyd (1987)
suggested that high levels of suspended solids may be fatal to salmonids, while lower
levels of suspended solids and turbidity may cause chronic sublethal effects such as loss
or reduction of foraging capability, reduced growth, resistance to disease, increased
stress, and interference with cues necessary for orientation in homing and migration.
Salmonid populations not normally exposed to high levels of natural turbidity or
exposed to anthropogenic sediment sources may be deleteriously affected by levels of
turbidity considered to be relatively low (18-70 NTU) (Gregory 1992). Low levels of
turbidity appear to correspond to sediment concentrations that may adversely affect
coldwater salmonids (Lloyd 1987).
10
Newcombe and MacDonald (1991) grouped effects of sediment on salmonids into
three categories: lethal, sublethal and behavioral.
• Lethal effects kill individual fish, cause overall population reductions, and
damage the capacity of the system to produce future populations. This category
includes reductions caused by sublethal or behavioral effects.
• Sublethal effects relate to tissue injury or alteration of the physiology of an
organism. Effects are chronic in nature and while not leading to immediate death,
may produce mortalities and population decline over time.
• Behavioral effects are described by any effect that results in a change of activity
usually associated with an organism in an undisturbed environment. These
changes may lead to immediate death or population decline or mortality over
time.
It is apparent that salmonids have the ability to cope with some level of turbidity
at certain life stages (Gregory and Northcote 1993). Evidence of this is illustrated by the
presence of juvenile salmonids in turbid estuaries prior to leaving for the ocean and in
local streams characterized by high natural levels of glacial silt, and therefore high
turbidity and low visibility (Gregory and Northcote 1993).
Table 1. Effects of turbidity on salmonids
Physiological Behavioral Habitat gill trauma avoidance reduction in spawning habitat
osmoregulation territoriality effect on hyporheic upwelling blood chemistry foraging and predation reduction in BI habitat
reproduction and growth homing and migration damage to redds Cumulative Effects
Ecological setting, landscape and evolutionary processes, and the physiological
and behavioral response to sediment regime alteration are each important and contribute
to our understanding of species response to turbidity. Therefore, it is important to
examine a system as opposed to single effects or sites – without ecosystem based options
for salmonids, species flexibility is diminished in responding to variable sediment loading
(Berman 1998).
11
Anthropogenic disturbances often differ from natural disturbances in magnitude,
frequency, and duration of events. Cumulatively, anthropogenic disturbances may
decrease system heterogeneity, as well as connectivity. This reduces refuge options
available to species during disturbance events. Altered levels of turbidity are just one of
many conditions that may have a cumulative effect on the health and survival of salmon
stocks.
While many laboratory studies have been performed to determine the effect of
sediments on salmonids, the cumulative effect on salmonids is difficult to capture. Many
of the effects on salmon are synergistic in nature; one effect can lead to a host of other
effects that may affect the growth, reproduction, and survival of the fish. The following
factors mediate effects of sediment on salmonids.
Environmental Factors Affecting the Effect of Sediment on Salmonids
Duration of exposure Frequency of exposure
Toxicity Temperature
Life stage of fish Angularity of particle Size of particle Type of particle Severity/magnitude of pulse Natural background turbidity of area (e.g. watershed position, legacy) Time of occurrence
Other stressors and general condition of biota Availability of and access to refugia
Salmonid response (often measured in terms of physical stress) is dependent on
environmental factors such as duration of exposure and temperature (Servizi and Martens
1992). Rogers (1969) suggested that the variability in tolerance to suspended sediment
could be explained by sediment particle characteristics, water temperature, species
differences and other stressors that might have synergistic effects.
An example of a synergistic effect of sediment can be illustrated by examining the
avoidance response of salmonids to turbid water. Life history stages and populations
sensitive to sediment loads may be forced to move to other areas of the system to avoid
negative effects on survival. These “turbidity refugia” must be available and accessible.
12
Stream reach or segment emigration is a bioenergetic demand that may affect the growth
or reproductive success of the individual.
To illustrate seasonal and population differences, an example from the Western
Olympic Peninsula is provided. H. Michael (pers. commun.) suggested that fish respond
differentially to TSS in summer and winter. He noted that protective mucous secretions
are inadequate during summer months and thereby expose individuals to increased risks.
There are also salmonid populations that thrive in glacially turbid streams. However,
biological and physical mechanisms related to these systems are unclear. Finally,
“turbidity refugia” such as tributaries, sloughs, off-channel habitat, and lakes are
important during different parts of the year. Organismic response to variables such as
TSS require further understanding and evaluation.
Reduction in Buffering Capacity
The overall buffering capacity of a system may be reduced by frequent sediment
loading. Salmonids are known to use refugia in a river system to escape negative water
quality conditions, such as high temperatures (Berman and Quinn 1991). For example,
bull trout seek out side channels in the winter during high flow periods for protection
(USFWS 1998). Sediment may also cover intergravel crevices fish use for shelter
(Waters 1995). In laboratory experiments, it has been shown that salmonids will move to
less turbid waters, if available, after a short-term pulse (Berg and Northcote 1985).
Bisson and Bilby (1982) illustrated the displacement of salmonids in water with
turbidities greater than 70 NTU. These results suggest that salmonids in a river system
might seek out turbidity refugia when subjected to short-term pulses of sediment.
Loss of acceptable habitat and refugia as well as decreased connectivity between
habitat reduces the carrying capacity of streams for salmonids. In systems lacking
adequate number, distribution, and connectivity of refugia, fish may travel longer
distances or to less desirable habitat and may encounter a variety of other conditions
including increased bioenergetic demands.
Reid (1998) summed up the cumulative effect created by turbidity upon
salmonids in a disturbed system:
13
“Salmonid strategies for coping with high turbidity are likely to include use of off-channel, clean-water refugia and temporary holding at clean-water tributary mouths. These coping strategies are partially defeated by the spatial distribution of roads: road runoff discharges into low-order channels that once would have provided clean inflows, and riparian roads restrict access to flood-plain and off-channel refugia. The temporal distribution of the high-turbidity inflows also decreases the effectiveness of coping strategies: turbidities are high even during low-magnitude events when flows may not be sufficient to allow access to refugia. The combined influences of increased turbidity and restricted opportunities for escape from the effect constitute a cumulative effect. Further, traffic-related turbidity is highest during the day, when salmonids feed, and traffic produces high turbidity even during small and moderate storm flows of autumn and spring, when water is warmer than during winter floods. Because salmonid metabolic rates are temperature-dependent, salmonids may be particularly sensitive to these unseasonable bouts of high turbidity.”
In consideration of the effect of increased turbidities upon salmonids, the current
state of available habitat and refugia must be examined. Can a watershed, given past
management practices, provide the protection needed to salmonids at various life stages if
additional sediment pulses are released?
It is also important to note in reviewing the following section that much of the
research undertaken to examine turbidity effects on salmonids was performed in
laboratories, where control turbidities do not necessarily reflect field conditions, such as
prey quantities and other potential synergistic effects.
Research Summary
The purpose of this section is to review recent research regarding the effect of
turbidity and suspended sediments on salmonids. The research is summarized in three
sections:
A. Physiological effects B. Behavioral effects C. Habitat effects
Physiological effects cover stressors to the physical health of salmonids attributed
to the presence of high turbidity or high levels of suspended solids. Some indicators of
stress to salmonids that have been studied include gill trauma, blood sugar levels, and
osmoregulatory function.
14
Behavioral effects cover changes in activity attributed to increased sediment in
the water column. Behavioral effects reviewed here include avoidance, changes in
foraging ability, responses to predation risk, and reduced territoriality.
Habitat effects cover changes to spawning and rearing habitat of salmonids.
Note on Turbidity and Sediment Studies
Most laboratory studies examine the effect of sediment on salmonids in a
controlled environment, where individual variables are tested. Everest et al. (1987) note
that there are significant difficulties in extrapolating laboratory findings to the field.
Many laboratory survival studies use simplified unnatural gravel mixtures to test
incubation and emergence of salmonid fry. Other factors that may affect results include
disease organism presence, temperature, and prey availability.
The authors note that factors in streams, such as structural roughness and
spawning behavior of females complicate field application of laboratory studies. Studies
dealing with effects of sediment from forest management in natural environments have
been less conclusive, as increased fine sediment from forest management is almost
always accompanied by other environmental effects (Everest et al. 1987).
In general, studies focusing on physiological effects (gill trauma, blood chemistry,
osmoregulation, and reproduction and growth) were conducted in a laboratory
environment. Research on behavioral effects included both laboratory and field studies.
Studies related to avoidance, territoriality, foraging and predation were primarily
performed in artificial holding tanks. Field studies, however, were conducted in projects
focused on abundance and diversity of prey, primary production, and homing and
migration. Research related to the effect of sediment inputs on habitat were primarily
performed in the field.
A. Physiological Effects
Turbidity is associated with a number of physiological effects in Pacific salmon
(Berg 1982). Researchers have used several physiological indicators to determine the
effect of incremental increases of suspended sediment on salmonids. The outcome of a
stress response is dependent on synergistic factors such as duration of exposure,
15
frequency, magnitude, temperature, and other environmental variables (Servizi and
Martens 1992). Some physiological indicators used by researchers include gill trauma
(Berg 1982; Berg and Northcote 1985), increased levels of blood glucose, plasma
glucose, plasma cortisol, and osmoregulatory ability (Redding et al. 1987; Servizi and
Martens 1987). The stress response itself may compromise the organism’s immune
system (increasing disease susceptibility) thereby affecting mortality rates (USFWS
1998).
Among salmonids, some species may be more sensitive to suspended sediment
than others, and the sensitivity of the egg and juvenile stages of most species seemingly
exceed that of adults (Lloyd 1987). Owing to their extended fresh water residency,
juvenile chinook, coho, and steelhead may be more sensitive to increases in suspended
sediment (Noggle 1978), as opposed to pinks and chum, which spend very little time in
streams after hatching.
Gill Trauma
The presence of suspended sediments in the water column has been shown to
produce gill trauma in sockeye underyearlings (Servizi and Martens 1987), gill flaring in
response to short term sediment pulses (Berg 1982; Berg and Northcote 1985), and
increased coughing frequency (Servizi and Martens 1992).
Fish gills are delicate and easily damaged by abrasive silt particles. As sediment
begins to accumulate in the filaments, fish excessively open and close their gills to
expunge the silt. If irritation continues, mucus is produced to protect the gill surface,
which may impede the circulation of water over gills and interfere with fish respiration
(Berg 1982).
Laboratory Studies
Servizi and Martens (1987) found that the lethality of Fraser River sediments on
underyearling sockeye salmon (Oncorhynchus nerka) increased with increasing particle
size. Fines (0-740 µm) lodged in gills and caused gill trauma at 3,148 mg/l or 0.2 of the
96 h LC50 value. This value is consistent with normal levels of suspended solids
measured at Hell’s Gate on the Fraser River. Particle size and shape may also affect the
degree of damage to the gills (Servizi and Martens 1992). The LC50 decreased as
particle size increased, for particles described as angular to subangular, in their work with
16
Fraser River sediments. Sockeye exposed to volcanic ash by Newcomb and Flagg (1983)
experienced greater mortality at lower concentrations, indicating that the combination of
slightly larger, more angular particles in volcanic ash may cause higher mortality.
Cough frequency is a sublethal effect that impairs the respiratory ability of
salmonids. Servizi and Martens (1992) examined the effect of sublethal concentrations
of Fraser River suspended sediments on underyearling coho salmon. Cough frequency
was elevated eightfold over control levels at 240 mg/l (turbidity of 30 NTUs). Berg
(1982) examined the effect of a short-term sediment pulse (initially 3 days at 60 NTU,
then a reduction on the seventh day to 10 NTU) on coughing frequency of juvenile coho.
In two of four tests, coughing rates increased significantly when turbidity was raised to
60 NTU. As turbidity declined to 10 NTU, coughing declined or remained at
pretreatment levels. Noggle (1978), upon histological examination, found suspended
sediments damaged gill structures. Berg and Northcote (1985) reported increases in gill
flaring after a short-term sediment pulse, reaching 60 NTU. Flaring continued as
turbidity dropped to 30 and 20 NTU.
Blood Physiology
Measures of elevated blood sugars (Servizi and Martens 1992), plasma glucose
(Servizi and Martens 1987), and plasma cortisol have all been used as indicators of stress
in fishes. Physiological stress in fishes may decrease immunological competence,
growth, and reproductive success.
Laboratory Studies
Servizi and Martens (1987) identified increases in plasma glucose in juvenile
sockeye salmon exposed to fine sediment. Plasma glucose levels of adult sockeye
increased 150 and 39% as a result of exposures to 1,500 and 500 mg/l respectively of fine
sediment. Servizi and Martens (1992) noted elevated blood sugar levels in underyearling
coho salmon exposed to sublethal concentrations of Fraser River suspended sediments.
Redding et al. (1987) exposed yearling coho salmon and steelhead to high (2,000-
3,000 mg/l) or low (400-600 mg/l) concentrations of volcanic ash, topsoil and kaolin clay
for 7-8 days. Plasma cortisol levels were elevated in both species after exposure to high
levels of topsoil. Yearling steelhead exposed to high or low concentrations for 2 days
also showed elevated plasma cortisol levels.
17
A change in blood physiology is an indicator that a fish is experiencing some
level of stress. At the individual fish level, stress may affect physiological systems,
reduce growth, increase disease incidence, and reduce ability to tolerate additional
stressors. At the population level, the effects of stress may include reduced spawning
success, increased larval mortality, reduced recruitment to succeeding life stages and
overall population declines. Stress to salmonids can affect the parr-smolt transformation,
resulting in impaired migratory behavior, decreased osmoregulatory competence, and
reduced early marine survival (Wedemeyer and McLeay 1981).
Osmoregulation
Laboratory Studies
The process of smolt transformation is critical to successful transfer of juvenile
salmonids from fresh to marine waters. Disruptions of this process lead to osmotic
imbalances and produce sublethal effects and eventual mortality (Redding et al. 1987).
During the smolt transformation process, there appears to be an increased sensitivity to
total suspended solids. Noggle (1978) conducted studies to assess the effects of
suspended sediment upon juvenile salmonids in the stream environment. Results
indicated seasonal changes in tolerance of salmonids to suspended sediment. Bioassays
conducted in summer produced LC50’s less than 1,500 mg/l, while autumn bioassays
showed LC50’s in excess of 30,000 mg/l. Spring/summer bioassays were coincidental to
smolt transformation periods. Sockeye smolts suffered a slight impairment in
hypoosmoregulatory capacity when exposed 96 h to 14,407 mg/l of fine sediment
(Servizi and Martens 1987).
Reproduction and Growth
Salmonids require gravels that have low concentrations of fine sediments for
successful spawning and incubation (Spence et al. 1996). Chronic turbidity during
emergence and rearing of young anadromous salmonids could affect the quantity and
quality of fish produced (Sigler et al. 1984). Organic matter entering substrate interstices
depletes oxygen and reduces dissolved oxygen concentrations, harming eggs (Spence et
al. 1996).
18
Settleable solids may prevent eggs from receiving necessary oxygen and inhibit
removal of waste products within the redd and may create a physical barrier to fry
emergence. The greater the proportion of fine sediments in redds, the greater likelihood
that fry hatching from normally developed embryos will be entrapped and unable to
emerge (Everest et al. 1987). Eggs, larvae, and fingerling fish are generally more
susceptible to stress by dissolved or suspended solids than are adult fish. Intrusion of
fines may occur initially in the upper 10 cm of the streambed gravels (Beschta and
Jackson 1979). The intrusion or infiltration of fines into streambed gravels can thus alter
the quality of the bed for spawning by fish or for use by other instream biota (Everest et
al. 1987).
Sediments may also alter hyporheic inputs thereby reducing the availability of
upwelling areas and potentially decreasing egg to fry survival. Transportation projects
may affect these zones both by contribution of sediment and interception of sub-surface
flow by road networks (Sedell et al. 1990, Poole and Berman 2001).
Intragravel water flow (Vaux 1962; Cooper 1965) and availability of dissolved
oxygen for developing embryos (Cooper 1965; Daykin 1965) is key to egg survival. Low
dissolved oxygen can cause direct mortality or delay development of alevins (Shumway
et al. 1964; Brannon 1965). Delayed emergence may lead to smaller fry that are less able
to compete for environmental resources than their larger cohorts that have undergone
normal development and emergence (from Everest et al. 1987). Small size may also
affect migration timing and marine survival (Holtby 1988; Holtby et al. 1989).
Researchers have found an inverse relationship between fines (% sediment < 3
mm) and fry survival (Bjornn 1968; Phillips et al. 1975, Everest et al. 1987) with
decreases in survival ranging up to 3.4% for each 1% increase in fine sediment <
0.850mm (Cederholm et al. 1981).
Laboratory Studies
Sigler et al. (1984) identified a significant difference in growth rates between
steelhead and coho in clear versus turbid water. As little as 25 NTUs of turbidity caused
a reduction in fish growth. The implication of this finding is that fish subjected to
turbidity in this experiment might experience increased probability of mortality in
comparison to those fish experiencing normal growth (Sigler et al. 1984).
19
Shelton and Pollock (1966) demonstrated that low survival of chinook eggs in an
incubation channel occurred when 15 to 30% of voids in the gravel bed were filled with
sediment. Crouse et al. (1981) used Substrate Score, a visual technique for evaluating
stream substrate quality to determine the effect of sediment on juvenile coho salmon
production. The authors found that production of juvenile coho salmon was inversely
related to quantities of fine sediment. Significant decreases in fish production occurred in
streams with 80% and 100% embeddedness where fine sediments (<2.0 mm) were 26 and
31% by volume of the total substrate.
Sediments less than 0.850 mm diameter were inversely correlated with survival of
coho salmon in artificial streams. Coho salmon eggs in landslide affected gravels in the
East Fork Miller Creek survived only 40% as well to hatching when compared to the
control group and survived only 9% as well to the button-up stage of development
(Cederholm and Salo 1979).
B. Behavioral Effects
A number of research efforts have focused on the effect of turbidity levels on
salmonid behavior. Behaviors examined by researchers include avoidance, territoriality,
and foraging.
Avoidance
In many cases, salmonids avoid turbid water. In these instances, fish must
successfully emigrate to areas of lower TSS. Factors affecting emigration may include
availability and connectivity of patches with lower turbidity as well as the developmental
stage of the fish (Sedell et al. 1990).
Laboratory Studies
Sigler et al. (1984) conducted tests to determine the point at which juvenile
steelhead and coho subjected to continuous clay turbidities would emigrate from an area.
Tested turbidities ranged from 57 to 265 NTUs. In tanks with mean turbidities of 167
NTUs or higher, no fish were found. Fish were found in tanks with lower turbidities (57
and 77 NTUs) at numbers near carrying capacity.
Newly emerged fry appear to be more susceptible to even moderate turbidities
than are older fish. Turbidities in the 25-50 NTU range (equivalent to 125-175 mg/l of
20
bentonite clay) reduced growth and caused more young coho salmon and steelhead to
emigrate from laboratory streams than did clear water (Sigler et al. 1984). Juvenile
salmonids tend to avoid streams that are chronically turbid, such as glacial streams or
those disturbed by human activities (Lloyd et al. 1987), except when the fish have to
traverse them along migration routes.
A mean avoidance of 25% was discovered for juvenile coho exposed to a 7,000
mg/l level of suspended sediment (Servizi and Martens 1992). The authors estimated that
the threshold for avoidance by juvenile coho in the vertical plane was 37 NTU.
Berg (1982) found that juvenile coho exposed to a short-term pulse of 60 NTU
left the water column and congregated at the bottom of an experimental tank. When the
turbidity was reduced to 20 NTU, the fish returned to the water column. Bisson and
Bilby (1982) subjected juvenile coho to experimentally elevated concentrations of
suspended sediment. In their work, juveniles did not avoid moderate increases in
turbidity when background levels were low. Significant avoidance, however, was
observed at a level of 70 NTU.
Field Studies
In a study related to deposition of Mt. St. Helens ash in the Columbia River Basin,
McCabe et al. (1981) noted a severe decline in the catch of juvenile chinook in upper
reaches with highest ash deposition.
In addition to avoidance behavior by juveniles, suspended sediment may affect
the reproductive success of returning adults. Physiological, bioenergetic and behavioral
alterations stemming from increased suspended sediment loads (such as a delay in return
to spawning habitat) may affect egg quality or quantity and subsequent egg development.
Previous research on sublethal temperature exposure of adult chinook has illustrated this
point (Berman and Quinn 1991). We hypothesize that elevated TSS may lead to similar
results.
Territoriality
Laboratory Studies
The presence of turbid water appears to disturb normal social behavior and alter
the nature of aggressive interactions. It has been suggested that the loss of territoriality
and the breakdown of social structure can lead to secondary effects. Juvenile coho
21
rearing in streams affected by frequent short-term sediment pulses with concomitant loss
of territoriality may experience a decrease in growth and feeding rates, which may affect
overall mortality (Berg 1982).
Juvenile coho exposed to short-term sediment pulses exhibited altered territory
structure and altered feeding behavior (Berg and Northcote 1985). Normally, a dominant
fish positioned upstream would consume the majority of the prey. During turbid phases,
territories broke down, and subordinate fish captured a greater proportion of the prey.
This was most evident at 30 and 60 NTU.
Subsequent to a sediment pulse, a breakdown in social organization among
juvenile coho in an artificial stream occurred (Berg, 1982). Territoriality appeared to
cease during a short-term sediment pulse, possibly due to the inability of the fish to see
the positions of their neighbors. Territory was reestablished when turbidity decreased to
20 NTU. Lateral displays, a territorial action performed by salmonids, were limited
under the experimental conditions. Experiments conducted by Noggle (1978) within a
turbid artificial stream and clear tributary illustrated avoidance by fish of their established
territories.
Foraging and Predation
Turbidity appears to affect a number of factors related to feeding for salmonids,
including feeding rates, reaction distance, prey selection, and prey abundance. Changes
in feeding behavior are primarily related to the reduction in visibility that occurs in turbid
water. Effects on feeding ability are important as salmonids must meet energy demands
to compete with other fishes for resources and to avoid predators. Turbidity may lead to
a reduction in foraging rates, which has been linked to a decrease in growth and health of
fishes (Gardner 1981).
The literature presents two major themes on the effect of turbidity on foraging.
Many studies indicate that as visual feeders, the effectiveness of salmonids in obtaining
food is reduced by turbidity at levels as low as 20 NTU (Berg 1982). Other research
indicates that some species of salmonids (juvenile coho, steelhead, and chinook) appear
to prefer slightly to moderately turbid water for foraging, as reported in studies by Sigler
et al. (1984) and Gregory (1988). This behavior may represent a trade-off between
predation risk and bioenergetic demand and benefits of increased growth. While ability
22
to forage in turbid water may be reduced, the reduction in predation risk may make it
worthwhile to operate in partially turbid areas (Gregory and Northcote 1993).
Suspended particulate material reduces the underwater visual range of fish, which
may either act as a protective cover from predators or reduce the ability of these species
to detect predators (Gregory and Levings 1996). Reduced visual clarity of waters may
greatly affect the behavior of visual predators, notably fishes and piscivorous birds
(Davies-Colley and Smith 2000). The reaction of salmonids to these factors is variable,
as shown by the results reviewed below.
Laboratory Studies
Berg (1982) showed a decrease in feeding ability by juvenile coho in response to
short-term pulses of suspended sediment in a laboratory environment. At 0 NTU, 100%
of the prey items offered to the fish were consumed, whereas at 60 NTU, only 35% of
introduced prey were consumed. At a turbidity level of 10 NTU, fish were noted to
frequently misstrike prey items. A significant delay in the response of fish to introduced
prey was noted at turbidities of 20 and 60 NTU. The acquisition of food resources in
turbid waters may be reduced due to the effects of turbidity on behavior and vision. As
coho are visual feeders relying on drift, reduction in feeding ability may lead to depressed
growth rates (Berg 1982). Reid (1998) reported that published data suggest that feeding
efficiency of juvenile coho salmon drops by 45% at a turbidity of 100 NTU.
Additionally, prey behavior is also altered by TSS.
Berg and Northcote (1985) showed a reduction in reaction distance by juvenile
coho to adult brine shrimp after a sediment pulse (60-20 NTU) was introduced. Prey
acquisition increased as the pulse dropped from 60 NTU to 20 NTU, but remained below
levels occurring prior to the pulse. The authors suggested that feeding affects were
primarily the result of loss of vision. Ingestion rates decreased to below 50% at higher
turbidities (30 and 60 NTU).
Gregory and Northcote (1993) assessed the effects of turbidity on the foraging
behavior of juvenile chinook in the laboratory. The reaction distance of the fish to
planktonic adult Artemia prey was measured by examining the visual ability of the
subjects. The foraging rate by juvenile salmonids for surface, planktonic and benthic prey
was measured across a range of turbidity levels (<1, 18, 35, 70, 150, 370, 810 NTU). For
23
all three prey types, foraging was reduced at higher turbidities. Foraging rates for surface
and benthic prey were also reduced in clear water, with highest foraging rates attained at
35-150 NTU. The authors suggested that the increased feeding rate in turbid conditions
may reflect reduced risk from predators.
Gregory (1992) noted that preference for foraging in moderate turbidity appeared
to be size dependent, as smaller individuals exhibited greater foraging rates in clear
waters. The author suggested that it may be to the advantage of an individual to grow
quickly to sizes where it is less vulnerable to predation, even if it may temporarily expose
itself to greater risk by foraging in clear water.
Redding et al. (1987) observed reduced feeding rates among yearling coho and
steelhead exposed to 2,000-4,000 mg/l of topsoil, kaolin clay and volcanic ash. Less food
was found in the stomachs of yearling fish exposed to high concentrations of suspended
topsoil, suggesting suspended solids might inhibit feeding. The authors suggested that
inhibition may result from a loss of vision in turbid water or may be an indirect
consequence of stress.
Boehlert and Morgan (1985) studied the effects of turbidity on feeding abilities of
larval Pacific herring. Maximum feeding incidence and intensity occurred at 500 or
1,000 mg/l. Feeding was reduced at concentrations higher than 1,000 mg/l. The authors
hypothesized that suspension of sediment may enhance feeding for the larvae by
providing visual contrast of prey items.
Gardner (1981) showed reduced feeding rates for bluegills in turbid waters.
Feeding rates in a 3 minute period declined from 14 prey per minute in clear water to 11,
10, and 7 per minute in pools of 60, 120, and 190 NTU. Gardner suggested that high
(>50 NTU) levels of turbidity would reduce energy intake (through decreased feeding
rates) thus reducing production of fish populations.
Vogel and Beauchamp (1999) quantified the reaction distance of adult lake trout
(as predators) to rainbow trout and cutthroat as a function of light (0.17 – 261 1x; 1x is a
measurement of light intensity measured with a light meter), prey size (55, 75, and 139
mm) and turbidity (0.09, 3.18, and 7.40 NTU). Reaction distances of adult lake trout to
rainbow and cutthroat trout increased with increasing light (25 cm at .17 1x, to 100 cm at
17.8x). Reaction distance decreased as a decaying power function of turbidity. Vogel
24
and Beauchamp (1999) used results to model prey detection capabilities of piscivores at
varying depths and times of day in natural environments.
Gregory (1988) examined the foraging behavior of juvenile chinook in elevated
turbidity in a series of laboratory experiments. Experiments determined the reaction
distance to invertebrate prey, perceived risk to a model predator, and the foraging rate of
chinook on benthic Tubifex worms, in turbid conditions ranging from 0 to 800 mg/l.
Reaction distance and perceived risk declined inversely with turbidity. Foraging rates on
Tubifex worms were highest at intermediate levels (50-200 mg/l) and lowest at 0.0 mg/l
(control) and 800 mg/l. The results suggested a tradeoff between perceived risk to
predation and the effects of reduced reaction distance.
Gregory (1993) illustrated this consideration with research simulating predation in
both clear and turbid environments. In the absence of risk, fish occupied the bottom in
clear conditions (<1 NTU). In turbid conditions (NTU = 23), fish were randomly
distributed throughout the tank. In the presence of risk (bird and fish models to simulate
predators), the juveniles occupied the deep parts of the tank regardless of turbidity.
However, responses to simulated predation were less marked and of shorter duration in
the turbid conditions. Each simulation elicited a similar response – a distinct rapid
movement into deep water.
Gregory and Levings (1996) studied the effect of turbidity and artificial
vegetation (as cover types) on the predation mortality of juvenile salmonids in concrete
ponds. Adult coastal cutthroat trout were used as predators on juvenile chinook, chum,
sockeye, and cutthroat trout. The daily predation rate was determined for each turbidity
and vegetation treatment. In the presence of cover, daily predation rates were 10-75%
lower. The effects of turbidity were not significant and not additive with the effects of
vegetation – turbidity appeared to reduce the effectiveness of vegetation as cover for
chinook and sockeye. The authors suggested that the two forms of cover affected
predation risks by different mechanisms.
Ginetz and Larkin (1976) examined the predation of rainbow trout on migrant
sockeye fry. Feeding rates were higher on fry at lesser turbidities and at lower stream
velocities. The authors suggested that this information could be used to improve the
timing of hatchery releases of fry.
25
Abundance and Diversity of Prey
The presence of fine sediment in the substrate affects the benthic community,
especially those species living and feeding in the riverbottom. Effects on the benthic
community may negatively affect salmonids, as they are an important food source for the
fish. (Tebo 1955; Rosenberg and Wiens 1978; Cederholm and Salo 1979; Brzezinski and
Holton 1983). Decreased prey abundance may affect growth rate, susceptibility to
predation, competition, and susceptibility to disease.
As most experimental studies occur in a laboratory, prey abundance is controlled,
usually providing more than adequate prey quantity for salmon present. In natural
systems, salmonids may not be fed to satiation and stressor effects may therefore be
different. It is difficult to ascertain systemic effects on both fish feeding and benthic
health from these results.
Newcombe and MacDonald (1991) note that a change in sediment concentration
can adversely affect secondary production by affecting algal growth, biomass, and
species composition. Sediment can clog feeding structures, reducing efficiency and
growth rates of filter feeders. Benthic macroinvertebrates living in the substrate are
subject to scouring, which can damage respiratory organs and expose organisms to
predation through dislodgement. High sediment levels and high flow rates can scour
algae and reduce periphyton biomass.
Turbidity and siltation causes an overall reduction in the number of bottom
organisms, which results in changes to community structure, density, and diversity.
(Sorenson et al. 1977). Lloyd (1987) suggested that turbidity can account for the
decrease in primary production in shallow interior Alaskan streams, and subsequent
reductions in abundance of zooplankton and macroinvertebrates.
Field Studies
Tebo (1955) pointed to erosion and sedimentation produced by logging roads as a
factor in the decrease of benthic macroinvertebrates in a river system in North Carolina.
Two stations were used, above and below a logged watershed to determine effects of
sedimentation on bottom fauna. At the lower station there were 7.3 organisms per square
foot, in comparison to 25.5 organisms per square foot at the upper station.
26
Rosenberg and Wiens (1978) examined the responses of macroinvertebrates to
sediment addition. Increased sediment led to an increased number of macrobenthos
drifting in comparison with invertebrates in the control. Total drift was more than 3
times higher in August (sediment addition of 28.27 kg or 138,000 mg/m-2) and more than
2 times higher in September (sediment addition of 35.88 kg or 153,000 mg/m-2). No
significant difference was found in standing crops of macrobenthos in the substrate in the
control or sediment channels after sediment addition. The researchers suggested that
future efforts focus on the quantitative response of macrobenthos to settled rather than
suspended sediments. It was also suggested that highway and pipeline construction
undertaken in watersheds of this region resulting in sediment addition be performed in
the summer rather than spring or fall, providing discharge is adequate to transport added
sediment.
Brzezinski and Holton (1983) examined the relationship between abundance of
benthic taxa and the presence of ash in river sediments. The abundance was dependent
on distribution of ash within the sediment column. When ash is the top sediment layer,
amphipod abundance was zero. Amphipods were present if there were a distinct ash
layer at depth (12,500 individuals/m2) or if ash were mixed with sediment (13,300
individuals/m2). The authors concluded that the ash affects the fauna through some
physical effect, possibly related to fine grain size.
Gammon (1970) studied substrate types and their relation to benthic
macroinvertebrate numbers. Moss, gravel and rubble were the most occupied substrates.
Substrates with silt rated fairly low. Benthic populations residing below and above a
limestone quarry which contributed approximately 40 mg/l suspended solids to the
stream were examined. Suspended sediments above the quarry ranged from 13-52 mg/l,
and from 21 – 250 mg/l below. Drift rates increased linearly with increasing suspended
solids up to 160 mg/l. An increase of 40 mg/l suspended solids above normal resulted in
a 25% increase in drift. A 90% increase in drift occurred at an increase of 80 mg/l
suspended solids above normal.
Microfauna
The response of daphnia to suspensions of several types of solids was reviewed
by EIFAC (1965). The following results were reported:
Great Britain 110 mg/l Scullion and Edwards (1980)
Altered diet (terrestrial instead of aquatic)
Rainbow trout (juveniles)
Great Britain 110 mg/l Scullion and Edwards (1980)
Stress (increased plasma cortisol, hematocrit, and susceptibility to pathogens)
Coho salmon (juveniles) Steelhead (juveniles)
Oregon 500 mg/l 2,000 mg/l
Redding and Schreck (1980)
Stress (increased metabolic rate, susceptibility to toxicants)
Arctic grayling Yukon 300 mg/l McLeay et al. (1984)
Stress (increased plasma glucose)
Arctic grayling (juveniles)
Yukon 50 mg/l McLeay et al. (1983)
Stress (respiratory distress)
Coho salmon (juveniles)
Pennsylvania 6; 12 mg Fe/l (15-27 JTU)
Smith and Sykora (1976)
Stress (increased ventilation)
Brook trout Lake Superior 231 NTU Carlson (1984)
Disease (fin rot) Rainbow trout (juveniles)
Great Britain 270 ppm Herbert and Merkens (1961)
Disease (fin rot) Rainbow trout (juveniles)
Great Britain 100; 200 ppm Herbert and Merkens (1961)
a Arctic grayling (Thymallus arcticus) Coho salmon (Oncorhynchus kisutch) b Formazin (FTU), Jackson
Brook trout (Salvelinus fontinalis) Cutthroat trout (Salmo clarki) (JTU), and nephelometric Brown trout (Salmo trutta) Lake trout (Salvelinus namaycush) (NTU) turbidity units. Chinook salmon (Oncorhynchus tshawytscha) Rainbow trout (Salmo gairdneri) c Information not available. Chum salmon (Oncorhynchus keta) Steelhead (anadromous S. gairdneri)
37
Table 2 (cont.). Some reported effects of turbidity and suspended sediment concentrations on salmonids outside Alaska (Lloyd 1987).
Effect Speciesa (life stage)
Location Reported turbidityb or suspended sediment
concentration
Reference
Avoidance Chinook salmon (adults)
California “Natural turbidity” Sumner and Smith (1940)
Avoidance Chinook salmon (adults)
Washington 650 mg/l Whitman et al. (1982)
Avoidance Chinook salmon (adults)
Washington 350 mg/l Brannon et al. (1981)
Avoidance (sensitivity)
Lake trout Lake Superior 6 FTU Swenson (1978)
Avoidance Coho salmon (juveniles)
Washington 70 NTU Bisson and Bilby (1982)
Avoidance Coho salmon, steelhead (juveniles)
Idaho 22-265 NTU Sigler (1980), Sigler et al. (1984)
Displacement Coho salmon, steelhead (juveniles)
Idaho 40-50 NTU Sigler (1980)
Displacement Arctic grayling (juveniles)
Yukon 300; 1,000 mg/l McLeay et al. (1984)
Displacement Rainbow trout (juveniles)
Great Britain 110 mg/l Scullion and Edwards (1980)
Altered behavior (feeding)
Trout c 25 JTU Langer (1980)
Altered behavior (less use of overhead cover)
Brook trout Wisconsin 7 FTU Gradall and Swenson (1982)
Altered behavior (visual)
c c 25-30 JTU Bell (1984)
Altered behavior (visual)
Coho salmon (juveniles)
British Columbia 10-60 NTU Berg (1982), Berg and Northcote (1985)
Altered behavior (loss of territoriality)
Coho salmon (juveniles)
British Columbia 10-60 NTU Berg (1982), Berg and Northcote (1985)
Altered behavior (listlessness)
Coho salmon (juveniles)
Pennsylvania 6; 12 mg Fe/l (15-27 JTU)
Smith and Sykora (1976)
Change in body color
Arctic grayling (juveniles)
Yukon 300; 1,000 mg/l McLeay et al. (1984)
Change in body color
Coho salmon (juveniles)
Pennsylvania 6; 12 mg Fe/l (15-27 JTU)
Smith and Sykora (1976)
Reduced tolerance to saltwater
Chinook salmon (juveniles)
Washington 3,109 mg/l Stober et al. (1981)
a Arctic grayling (Thymallus arcticus) Coho salmon (Oncorhynchus kisutch) b Formazin (FTU), Jackson Brook trout (Salvelinus fontinalis) Cutthroat trout (Salmo clarki) (JTU), and nephelometric Brown trout (Salmo trutta) Lake trout (Salvelinus namaycush) (NTU) turbidity units. Chinook salmon (Oncorhynchus tshawytscha) Rainbow trout (Salmo gairdneri) c Information not available. Chum salmon (Oncorhynchus keta) Steelhead (anadromous S. gairdneri)
38
Table 3. Summary of suspended sediment effects on selected salmonids commonly present in the Yakima River basin (Newcombe and McDonald 1991)
(*) indicates estimated concentration. Species Concentration
(mg/l) Duration (hours)
Effect
Chinook Salmon 1400* 36 10% mortality of juveniles 488 96 50% mortality of smolts 82,000 6 60% mortality of juveniles 19,364 96 50% mortality of smolts 1.5-2.0 1,440 Gill hyperplasia, poor condition of fry 6 1,440 Reduction in growth rate 75 168 Harm to quality of habitat 84 336 Reduction in growth rate 1,547 96 Histological damage to gills 650 1 Homing performance disrupted Whitefish 16,613 96 50% mortality of juveniles .7 1 Overhead cover abandoned Salmon (general) 8 24 Sport fishing declines Steelhead 84 336 Reduction in growth rate Rainbow Trout 19,364 96 50% mortality of smolts 157 1728 100% mortality of eggs 21 1152 62% reduction in egg to fry survival 37 1440 46% reduction in egg to fry survival 7 1152 17% reduction in egg to fry survival 90 456 5% mortality in sub-adults 171 96 Histological damage 50 1848 Reduction in growth rate 100 1 Avoidance response Compiled by the Washington State Department of Ecology for “A Suspended Sediment and DDT Total Maximum Daily Load Evaluation Report for the Yakima River.” (Web Site Ref. #10)
39
Table 4. Some reported effects of turbidity and suspended sediment concentrations on salmonids: 2001 Update. This table is derived from Lloyd (1987). Effect Species (life
stage) Location Reported
turbidity or suspended sediment concentration
Reference
Activity Creek Chubs, Brook Trout
Wisconsin Increase in moderately turbid waters
Gradall and Swenson (1982)*
Avoidance Coho salmon (underyearling)
British Columbia After 60 NTU pulse, fish move to substrate
Berg (1982)*
Avoidance Coho salmon (underyearling)
British Columbia Approx 25% at 7,000 mg/l – estimated that the threshold for avoidance in the vertical plane was 37 NTU
Servizi and Martens (1992)*
Avoidance Creek Chubs Wisconsin Preferred 56.6 FTU
Gradall and Swenson (1982)*
Blood Sugar Coho salmon (underyearling)
British Columbia Elevated, proportional to SS exposure
Servizi and Martens (1992)*
Capture success per strike
Coho salmon (juvenile)
British Columbia 30 and 60 NTU Berg and Northcote (1985)*
Cough Frequency Coho salmon (underyearling)
British Columbia Elevated eightfold over control levels at 240 mg/l
Servizi and Martens (1992)*
Feeding rates Pacific herring (larval stage)
Oregon Maximum feeding potential at 500 and 1000 mg/l
Boehlert and Morgan (1985)*
Feeding rates Coho salmon (juvenile)
British Columbia Prey consumption only 35% of feeding in clear water at 60 NTU
Berg (1982)*
Feeding rates Coho salmon and steelhead (yearlings)
Oregon When exposed to 2,000-3,000 mg/l of topsoil, kaolin clay, volcanic ash, 7-8 days
Redding et al. (1987)*
Feeding rates Chinook salmon (juvenile)
British Columbia Reduced at higher turbidities, highest rates at intermediate turbidity 35-150 NTU for surface and benthic prey
Gregory and Northcote (1993)*
* laboratory study ** field study
40
Table 4 (cont.). Some reported effects of turbidity and suspended sediment concentrations on salmonids: 2001 Update. This table is derived from Lloyd (1987). Effect Species (life
stage) Location Reported
turbidity or suspended sediment concentration
Reference
Feeding rates Chinook salmon (juvenile)
British Columbia Increased rates on surface and benthic prey in conditions of moderate turbidity (18-150 NTU) compared with lower (<1 NTU) or higher 370-810 NTU
Gregory (1992)*
Feeding rates Chinook salmon (juvenile)
British Columbia Above 150 NTU, juvenile chinook exhibit reduced feeding regardless of prey type and forager size
Gregory (1992)*
Feeding rates Bluegills North Carolina 14 prey per minute in clear water to 1, 10, 7 per minute in pools of 60, 120, and 190 NTU. Size selectivity independent
Gardner (1981)*
Gill trauma Sockeye salmon (underyearling)
British Columbia 3,148 mg/l or 0.2 of the 96 h LC50 Value
Servizi and Martens (1987)*
Homing Chinook salmon (adult)
Washington Strong baseline preference for clean (ash-free) home water over a clean non-natal water source
Whitman et al. (1982)**
Impairment in hypo-osmoregulatory capacity
Sockeye salmon (underyearling)
British Columbia Exposed 96 h to 14,407 mg/l of fine sediment
Servizi and Martens (1987)*
Percentage of prey ingested
Coho salmon (juvenile)
British Columbia 30 and 60 NTU Berg and Northcote (1985)*
Plasma glucose increase
Sockeye salmon (underyearling)
British Columbia Increased 150 and 39% from exposure to 1,500 and 500 mg/l of fine sediment
Servizi and Martens (1987)*
* laboratory study ** field study
41
Table 4 (cont.) . Some reported effects of turbidity and suspended sediment concentrations on salmonids: 2001 Update. This table is derived from Lloyd (1987). Effect Species (life
British Columbia Mean predation rates were 10-75% lower than those in controls (no vegetation and clear water); addition of turbidity reduced effect
Gregory and Levings (1996)*
Predator avoidance Chinook salmon (juvenile)
British Columbia In absence of risk, juvenile chinook were distributed randomly in 23 NTU, at bottom in clear water– with risk, all at bottom, and responses less marked and of shorter duration
Gregory (1993)*
Prey abundance N/A Columbia River Estuary
Reduction in amphipods in substrate with surface layer of ash
Brzezinski and Holton (1981)**
Prey abundance N/A Northwest Territories
Sediment addition increased total drift of invertebrates (avoidance reaction)
Rosenberg and Wiens (1978)**
Reaction distance Coho salmon (juvenile)
British Columbia 30 and 60 NTU Berg and Northcote (1985)*
Reaction distance Chinook salmon (juvenile)
British Columbia Decline with increasing turbidity
Gregory and Northcote (1993)*
* laboratory study ** field study
42
Table 4 (cont.). Some reported effects of turbidity and suspended sediment concentrations on salmonids: 2001 Update. This table is derived from Lloyd (1987). Effect Species (life
stage) Location Reported
turbidity or suspended sediment concentration
Reference
Reaction distance Adult lake trout Utah Reaction distance increased w/ increasing light - <25 cm at .17 1x to about 100 cm at light threshold of 17.8 1x., declined with turbidity - > 80% of decline in reaction distance occurred over 0-5 NTU
Vogel and Beauchamp (1999)*
Reactive Distance Rainbow Trout Georgia Reactive distances in 15 and 30 NTU treatments were only 80 and 45% respectively of those observed at ambient turbidities 4-6 NTU.
Barrett and Rosenfeld (1992)*
Reduced Growth Coho salmon (juvenile)
Oregon Significant decrease in fish production when fine sediments were 26-31% by volume
Crouse et al. (1981)*
Reduction in prey Chinook salmon (juvenile)
Washington Reduced appearance of highly utilized amphipod Corophium salmonis.
McCabe et al. (1981)**
Relation of turbidity and suspended solids
N/A Alaska Depth to which 1% of subsurface light penetrates has inverse correlation with sediment-induced turbidity
Lloyd et al. (1987)**
Stress (Gill Flaring)
Coho salmon (juvenile)
British Columbia Increased at 30 and 60 NTU
Berg and Northcote (1985)*
* laboratory study ** field study
43
Table 4 (cont.). Some reported effects of turbidity and suspended sediment concentrations on salmonids: 2001 Update. This table is derived from Lloyd (1987). Effect Species (life
stage) Location Reported
turbidity or suspended sediment concentration
Reference
Stress (increased plasma cortisol)
Coho salmon and steelhead (yearlings)
Oregon When exposed to 2-3 g/L of topsoil, 7-8 days
Redding et al. (1987)*
Stress (blood hematrocrits and plasma cortisol)
Coho salmon and steelhead (yearlings)
Oregon Increased in fish exposed to high concentrations for two days, topsoil, kaolin clay, or ash.
Redding et al. (1987)*
Stress (resistance to bacterial pathogen)
Yearling steelhead and coho
Oregon Vibrio anguillarum Redding et al. (1987)*
Territoriality Coho salmon (juvenile)
British Columbia Territoriality ceases with 60 NTU pulse – re-established at 20 NTU – lateral displays minimized
Berg (1982)*
* laboratory study ** field study
44
V. Assessment of Whether Emulsion Characteristics of Turbidity Have a Significant Differential Effect on Salmonid Survival, Growth, and Reproduction
Salmonids encounter “naturally” turbid conditions in estuaries and glacially-fed
streams. Managers are interested in determining whether there is something inherent in
“natural” turbidity sources that make them somehow less harmful to fish then
anthropogenic sediment inputs. A pertinent question is the relationship between sediment
size, shape, and composition and salmonids viability.
It is difficult to determine the effect of sediments of various sizes and shapes
based on laboratory experimentation owing to the complexity of natural systems. In
addition to the character of the material, a number of other factors must be considered in
evaluating salmonid response to suspended sediments. These factors include the life
history stage, presence of cumulative stressors, availability of refugia that are well
distributed, connected, and accessible, condition of biotic community, frequency and
magnitude of exposure to the sediments, and the physical processes associated with
hydrology, sediment input, transport, and storage present in a particular watershed. Past
land use practices within a watershed are also of import.
Various types of sediment have been used in experiments developed to test the
effect of suspended solids on salmonid health. Very few studies, however, provide a
comparison of the effect of different sediment types and sizes on salmonids.
Davies-Colley and Smith (2000) noted that the physical and chemical, and
therefore optical, character of suspended particles can vary widely between stream
systems as well as within the same system. The important attributes of aquatic particles
in addition to optical character include settling velocity and particle size, shape, and
composition.
Based on current studies, it appears that gill injuries increase as angularity and
particle size increase. Servizi and Martens (1987) studied gill injuries among
underyearling sockeye exposed to fine and medium coarse sediments. The size and shape
of particles appeared to affect the yearlings differentially. The study demonstrated that
tolerance decreased as particle size increased, specifically for particles described as
45
“angular to subangular.” Underyearling sockeye experienced gill trauma at 3,143 mg/l,
levels that have been measured at Hell’s Gate on the Fraser River.
Newcomb and Flagg (in Servizi and Martens 1987) reported a 36 h LC50 of Mt.
St. Helens ash to be 6,100 mg/l for sockeye smolts, whereas there were no mortalities
when smolts were exposed to 14,407 mg/l of Fraser River sediments. These data suggest
that sockeye smolts may be more sensitive to slightly larger, largely angular ash particles
than subangular to angular particles. The 96 h LC50s of four Fraser River sediments to
underyearling sockeye ranged from 1,674 to 17,560 mg/l and were related to particle size
(Servizi and Martens 1987).
Table 5. Classification of suspended solids and their probable major effects on freshwater ecosystems (from Sorenson et al. 1977). Biochemical, Chemical,
Natural organic matter Sedimentation, DO utilization
Food sources, DO effects
Wastewater organic particles
Sedimentation, DO utilization, nutrient source
DO effects, eutrophication
Toxicants sorbed to particles
All of the above Toxicity
* Biological effects may result directly from pollutants (primary effect), changes due to biochemical, chemical, or physical changes (secondary), or biological interactions (tertiary effects).
Table 6. Sediment particle size (modified from Waters 1995). Category Size Range Phi scale Boulder > 256 mm -8 Cobble 64-256 mm -6,-7 Pebble 16-64 mm -4,-5 Gravel 2-16 mm -1,-2,-3 Very coarse sand 1-2 mm 0 Coarse sand 0.5-1 mm 1 Medium sand 0.25-0.5 mm 2 Fine sand 0.125-0.25 mm 3 Very fine sand 0.0625-0.125 mm 4 Silt 4-62 um 5,6,7,8 Clay < 4 um 9
46
Summary
Additional research needs to be undertaken in this area. Laboratory results
indicate that size, shape, and composition of sediment particles may have differential
effects on salmonids. It is important to understand all of the mechanisms by which
suspended sediments affect salmonids in order to reduce effects associated with land use.
47
VI. Current State and Provincial Turbidity Standards
This section provides a review of the current turbidity requirements in Alaska,
Idaho, Oregon, Washington, and British Columbia. The standards reviewed here require
that turbidity be measured against a “background turbidity,” established at a point
upstream of the affected area. Only two of the five standards reviewed include a limit on
the duration of exposure to a certain turbidity level (Idaho and British Columbia).
Best Available Technology (BAT) TSS requirements are commonly used in
writing National Pollutant Discharge Elimination System (NPDES) discharge permits in
Washington State. For many industrial applications, the BAT standard is 45 mg/l for a
long-term average and 90 mg/l for a daily maximum (E. Molash, pers. commun.). To
address watershed scale turbidity or total suspended solid issues, the four states have the
option of using the Total Maximum Daily Load (TMDL) process to assess the need for
overall reductions in turbidity levels and suspended sediments.
The TMDL process was established by section 303(d) of the Clean Water Act.
Federal law requires states to identify sources of pollution in waters that fail to meet state
water quality standards after all point sources have been permitted, and to develop
cleanup plans to address pollutants of concern. A TMDL is a calculation of the
maximum amount of a pollutant that a water body can receive and still meet state water
quality standards. Percentages of the total maximum daily load are allocated to the
various pollutant sources (Web Site Ref. #10). More detailed information on TMDLs in
Washington, Oregon, and Idaho can be found in Appendix D.
A number of researchers analyzed existing state regulations for turbidity and total
suspended solids to determine if the level of protection afforded to salmonids is adequate.
Bisson and Bilby (1982) noted that state regulations at that time did not consider
acclimation of stream biota to high turbidity, as regulations permitted only minor
increases in suspended sediment when background turbidity was low, but allowed greater
absolute increases as background levels rise.
Lloyd (1987) examined the use of turbidity as a water quality standard for
salmonid habitats in Alaska. Lloyd’s (1987) review indicated that water quality
standards allowing increases in coldwater habitats of 25 NTU above ambient turbidity
would provide “moderate” protection, while a standard allowing a 5 NTU increase above
48
ambient turbidity would provide “high” protection for salmonids. This determination
was based on a number of studies which indicated that turbidities as low as 10-25 NTUs
can have deleterious effects on fish (Berg 1982; McCabe and O’Brien 1983; Sigler et al.
1984; Berg and Northcote 1985).
Lloyd (1987) suggested that an acceptable turbidity standard must do two things
to protect aquatic habitats: prevent loss of aquatic productivity and cause no lethal or
chronic sublethal effects on fish and wildlife. Other researchers have suggested the need
for standards other than simple turbidity criteria to control pollution by sediment. The
National Academy of Sciences and National Academy of Engineering (1973)
recommended that depth of light penetration not be decreased by more than 10% and that
suspended sediment concentrations be limited to specific values.
Sorenson et al. (1977) cited concern over the difficulty in setting rigid standards
for suspended solids. The concentration of suspended solids in natural waters is
influenced by such factors as topography, geology, soil condition, intensity and duration
of rainfall, type and amount of vegetation in the drainage basin, and past and current
human activity. Flowing waters may have considerable variation in SSC from day-to-day
and year-to-year. Since natural variation in suspended solids is so great, the authors
suggested that it is not desirable to have fixed rigid standards.
Duchrow and Everhart (1971) and Bisson and Bilby (1982) called for
consideration of standards for settleable solids, as they are of primary concern in the
protection of aquatic fauna. As sediment type and aquatic fauna vary across and between
watersheds, specific standards might have to be applied depending on conditions within
and between watersheds.
Table 7 provides a summary of current turbidity standards for states in the
Northwestern United States and British Columbia, Canada. Table 8 provides standards
for the year 1987. This is provided to show changes in regulations between 1987 and
2001. Appendix C provides detailed information on turbidity standards for each state
and province.
49
Table 7. 2001 comparison table of state and provincial turbidity standards.
State/Province Standard Notes Alaska (Web Site Ref. #1)
May not exceed 25 NTU above natural conditions. For all lake waters, may not exceed 5 NTU above natural conditions.
Standard for growth and propagation of fish, shellfish, other aquatic life, and wildlife. End-of-pipe unless a mixing zone has been approved.
British Columbia (Web Site Ref. #2)
Maximum Induced Turbidity – NTU or % of background:
8 NTU in 24 hours when background is less than or equal to 8
…. Mean of 2 NTU in 30 days when background is less than or equal to 8 ________________________ 8 NTU when background is between 8 and 80
…. 10% when background is greater than or equal to 80
Standard for aquatic life, fresh, marine, estuarine BC regulations also include limits on Maximum Induced Suspended Sediments –mg/L or % of background and limits on streambed substrate composition (% fines at spawning sites, geometric mean diameter not less than 12 mm) Edge of mixing zone.
Idaho (Web Site Ref. #5)
Turbidity, below any applicable mixing zone set by the Department, shall not exceed background turbidity by more than (50) NTU instantaneously or more than twenty-five (25) NTU for more than ten (10) consecutive days.
Standard for aquatic life use designations. Edge of mixing zone (Exceedance limited to 5 NTU if a point source)
Oregon (Web Site Ref. #7)
No more than ten percent cumulative increase in natural stream turbidities, as measured relative to a control point immediately upstream of the turbidity causing activities.
Limited duration activities that exceed requirements may be authorized (see Oregon Turbidity Standards Section). End-of-pipe unless a mixing zone has been approved.XX
Washington (Web Site Ref. #12)
Turbidity shall not exceed 5 NTU over background turbidity when the background turbidity is 50 NTU or less, or have more than a 10 percent increase in turbidity when the background is > 50 NTU
For Class A Waters; for Class B waters, turbidity shall not exceed a 10 NTU increase over background turbidities of 50 NTU or less, or a 20% increase when background turbidity is greater than 50 NTU Edge of mixing zone
50
Table 8. Numerical turbidity standards for protection of fish and wildlife habitats in Alaska and other states (as cited by Lloyd 1987). State Turbidity (NTU or JTU)a Alaska 25 units above natural in streams
5 units above natural in lakes California 20% above natural, not to exceed 10 units
above natural Idaho 5 units above natural Minnesota 10 units Montana 10 units (5 above natural)b Oregon 10% above natural Washington 25 units above natural (5 and 10 above
natural)c Wyoming 10 units above natural a Nephelometric (NTU) and Jackson (JTU) turbidity units are roughly equivalent (USEPA 1983). b Montana places the more stringent limit on waters containing salmonid fishes. c API (1980) reports different values in Washington for “excellent” and “good” classes of water. Summary
Each state and province in the northwest attempts to control sediment input to
rivers by placing limits on turbidity increases above “natural background levels.” Natural
background turbidity levels may vary widely between watersheds due to factors such as
base geology, legacy conditions, and land-cover and within a system (e.g. headwaters
versus estuary). In addition, turbidity may change daily, seasonally, and annually
depending on physical and biological changes in the system. This variability makes it
difficult to quantify natural background turbidity.
To adequately protect salmonids during their freshwater residence, TSS data on
physiological, behavioral, and habitat effects should be viewed in a layer context
incorporating both the spatial geometry of suitable habitat and the temporal changes
associated with life history, year class, and climate variability. Spatial and temporal
considerations provide the foundation to decipher legacy effects as well as cumulative
and synergistic effects on salmonid protection and recovery.
51
VII. Turbidity Requirements for Hatcheries
In Washington State, hatcheries do not follow specific turbidity requirements
regarding water used for hatchery operations. However, hatchery operators often have
unstated guidelines to determine when turbidity levels pose a risk to eggs and juvenile
salmonids. In many cases, hatchery managers rely on visual measurement rather than
numeric guidelines to determine risk to developing salmonids.
Upland hatcheries are subject to regulations regarding the water released from
facilities and the byproducts of hatchery operations. Hatcheries must obtain NPDES
permits to address discharges from their facilities into streams.
Controlling Turbidity and Suspended Solids in Hatchery Water
In general, hatcheries in Washington State receive water supplies from nearby
creeks and rivers. In a minority of cases, groundwater or springs are used where
available (H. Michael, pers. commun.). The advantage of groundwater and spring
sources is 1) lower concentrations of suspended solids and 2) reduced pathogen presence
from river water. There are additional costs, however, associated with using groundwater
and spring sources, such as pumping the water from the source to the facility.
Hatchery operators must monitor the sediment concentration of the water and
determine the point at which the condition will be deleterious to fish at various life
stages. It is important for hatchery managers to determine when to “clean” eggs that are
exposed to suspended sediments. Even when the water supply contains low levels of
suspended sediment, operations must be observed carefully. Over a period of 3 or 4
months even a low level of sediment could eventually smother eggs (H. Michael, pers.
commun.).
The Soos Creek Hatchery in Auburn does not adhere to specific turbidity criteria
during operation. The staff use professional knowledge to identify when the water supply
is turbid to the point of endangering the eggs. In these cases, the eggs are temporarily
removed from their tanks until turbidity decreases. This emergency measure most often
occurs as the result of rainfall and a subsequent storm surge. The hatchery uses water
from Soos Creek for raising coho, and spring water for raising steelhead (T. Sorbo, pers.
commun.).
52
At a hatchery on the Cowlitz River in Southwestern Washington, glaciated river
water occasionally creates conditions where juveniles cannot see their food. H. Michael
(pers. commun.) stated that fish require 12-18” of visibility for feeding during rearing.
Reduced feeding can lead to reduced growth rates. Additionally, if glacial water slows
enough in the hatchery, glacial sediment may settle and pose a risk to eggs.
Outflow from Hatcheries
Washington State upland hatcheries (as opposed to netpens) require NPDES
discharge permits to account for all materials released from hatcheries back into the
stream. The amount of settleable solids allowed from normal hatchery operations is a
monthly average of 0.1 mg/l. For total suspended solids, the monthly average allowed is
5 mg/l. The instantaneous maximum allowed is 15 mg/l (H. Michael, pers. commun.).
Off-line settling basins are used to contain settleable solids from hatchery
operations. These ponds are drawn down and sediments are removed on a regular basis.
Dredged material is then removed for upland disposal. For the water returned to the
creek from off-line settling ponds, the NPDES requirement calls for monthly release rates
of 1 mg/l settleable solids, and 100 mg/l total of suspended solids.
Summary
Turbid water and related suspended sediment concentrations pose a threat to the
health of hatchery fish. Excessive sediment in hatchery water may smother eggs by
depriving them of oxygen, and reducing the ability of juveniles to capture prey. While
there appears to be no specific measurement guideline for determining when the
suspended sediment levels are a danger to eggs and juveniles, hatchery managers have
developed methods of visually estimating risk and acting accordingly. Hatcheries are
subject to discharge permits which limit the amount of sediment they may release
downstream of the facility.
53
VIII. Recommendations
Based on this literature review, there are a number of areas where additional
research would help managers better assess the effects of suspended sediment on
salmonid health, growth, and reproduction.
Regulatory requirements often force managers to focus on meeting a specific
requirement at a specific location and point in time. It is difficult to quantify the direct
effect of turbidity on salmonids by looking at the effect of one particular disturbance in a
watershed. This does not account for cumulative sediment loading throughout the basin
nor synergistic effects. If possible, transportation project managers should consider
watershed-scale effects in addition to the effect of their particular project. The key
questions for managers are: 1) whether there are various scale refugia accessible in the
system that will allow salmonids to cope with short term sediment effects; and
2) whether other cumulative and synergistic effects magnify short-term sediment
alterations.
Another important consideration is the inconsistency of turbidity measurements.
When devising monitoring strategies for transportation projects, Washington State
Department of Transportation (DOT) might want to consider collecting baseline TSS
data, which then may be correlated with turbidity readings for future monitoring.
Research, Monitoring, and Management Recommendations
Measurement
• Conduct baseline studies measuring “natural” background levels in undisturbed systems and disturbed systems, stratified by biophysical parameters.
• Prior to conducting construction projects, determine TSS concentrations and gather information on size, shape, and composition of sediment.
• Develop new exposure metrics that account for sublethal effects (as opposed to direct mortality).
• Conduct research in the field if possible – most work to date has been performed in laboratories, which may not provide an accurate picture of the effects of suspended sediment on salmonids.
54
• Consider use of other measurement tools, such as water clarity to determine levels of suspended sediments.
Sediment Effects
• Examine the effect of frequent short-term pulses of suspended sediment on
salmonids.
• Conduct additional research on correlations between particle size, shape, and composition of sediments to sensitivity effects on salmonids.
• Evaluate how loss of groundwater/surface water interactions affect availability and abundance of salmonid habitat.
• Study relationships between seasonal timing and effect of sediment load on salmon.
• View TSS data on physiological, behavioral, and habitat effects in a layered context, incorporating both the spatial geometry of suitable habitat and the temporal changes associated with life history stage, year class, and climate variability. Spatial and temporal considerations provide the foundation to decipher legacy effects as well as cumulative and synergistic effects on salmonid protection and recovery.
Management
• Consider watershed condition when evaluating projects. Examine legacy of land use in watershed and determine how planned disturbance will contribute to cumulative effects.
• Analyze other sources of sediment contribution to the watershed, such as grazing allotments, roads and culverts, and timber harvest areas. Reduce sediment loads from these areas if possible.
• Restore tributaries and off-channel habitat to create potential turbidity refuges.
• Determine whether knowledge of salmonid survival responses to turbid flows can be used to develop mixing zones, work windows, treatment systems, and buffers that will allow fish to perform their necessary life functions during project construction and operation.
• Test a variety of existing and new technologies used to reduce TSS during road construction projects. Collect quantitative data.
55
Given that salmonids encounter “naturally” turbid conditions in estuaries and
glacially-fed streams, as well as during flood events and have developed survival
responses for those turbid conditions there are some additional critical questions for
consideration . Is there something inherent in “natural” turbidity sources that makes
exposure less harmful to fish? For instance, is the “angularity” of suspended sediments a
factor? How about particle size ranges? During flood events, does available habitat
provide “turbidity” refugia?
Establishing Baseline Turbidity Values
The difficulty of establishing overall “natural background turbidities” was
discussed earlier in this paper. One possibility for setting baseline turbidity ranges is to
measure background turbidity levels in unmanaged or “natural” areas of basins with
differing morphologies. Continuous sampling would be required to define turbidity
fluctuations under various hydrological conditions (such as a storm event). Once a range
of conditions has been identified for the watershed, a distribution may be plotted. This
distribution can be used to establish guidelines for similar watersheds.
Regulatory Suggestions in the Literature
Lloyd (1987) suggested that a turbidity standard could be used to address the
effects of turbidity as an optical property of water and as an indicator of SSC. The effects
of sedimentation on lake and stream bottoms could be addressed by separate enforceable
settable solid or streambed standards. Lloyd (1987) cites a need to establish or reaffirm
the levels of turbidity, and associated suspended solids concentrations that are appropriate
as standards for regulating human-induced effects on aquatic systems. Turbidity
standards can be tiered or graded (if necessary) to ambient water quality conditions and
the level of protection desired for a body of water (Lloyd 1987).
Lloyd (1987) also suggested that any alternative standards account for the primary
aspects of turbidity– extinction of light and presence of suspended sediment. Direct
measurement is possible of both, but the measure of turbidity was developed to facilitate
suspended sediment estimates. Light penetration can be measured in situ with portable
photometers and extinction coefficients calculated with simple graphs or equations, but
56
discrete samples cannot be removed and analyzed separately. Sediment concentration
can be sampled in the field and measured gravimetrically in a laboratory. Filtering,
drying and weighing procedures are required (Lloyd 1987).
Reasonable turbidity criteria that are established to protect aquatic habitats from
decreased light penetration may also protect systems from high concentrations of
suspended sediments and heavy metals. Separate settleable solids or streambed standards
could then be applied to protect aquatic habitats from effects on benthic substrates (Lloyd
1987).
Cairns (1968) suggested that truly responsive regulations should be developed on
a drainage-by-drainage basis, and should change with stream flow and other habitat
conditions. Lloyd (1987) noted that this type of standard would require enormous
baseline studies and almost continuous surveillance and monitoring, and subsequently
questioned whether such an approach is feasible in Alaska or elsewhere.
Lloyd (1987) indicated that for salmonids, a “moderate” level of protection (SSC
up to 100 mg/l) roughly translates to turbidity values up to 23 NTUs. Recommendations
for a “high” level of protection (0-25 mg/l) roughly translate to turbidity values up to 7
NTUs. Stricter limits might be warranted to protect extremely clear waters, due to the
dramatic initial effect of turbidity on light penetration. Naturally turbid systems might
need tiered or graded standards based on ambient water quality.
USFWS (1998) suggested that managers avoid new road construction in areas
vulnerable to mass wasting and in areas that may initiate or exacerbate stream bank
erosion. On a larger scale, it was suggested that managers identify land management
activities (upland and riparian) that have potential to contribute sediment to spawning and
rearing areas above natural levels (USFWS 1998).
Castro and Reckendorf (1995) suggest that fish are not good indicators of excess
sedimentation, as separating the effects of sediment from other environmental factors can
be impossible in a natural system. While sometimes obvious effects of excessive fine
sediment can be viewed, often effects are not apparent. The authors suggested using
another indicator species, such as benthic macroinvertebrates, which are more sensitive to
small changes in sediment quality and quantity, less mobile, and have shorter life cycles.
57
IX. Summary
Protection of Washington State’s salmonids requires that transportation officials
consider the effect of suspended sediments released into streams during road
construction. Numerous studies have shown that the presence of suspended sediments
can have a detrimental effect on the physiology, behavior, and habitat of salmonids.
Different species and even different life stages of species are susceptible to adverse
effects from different levels of sediment and to sediments of different sizes.
Turbidity is the measure most commonly used by agencies to indicate the level of
suspended solids in the water column. It is an indirect measure, however, and may not
always be correlated with suspended solid concentrations. Turbidity may vary depending
on geomorphic, hydrologic, and hydraulic factors.
Although salmonids are found in naturally turbid river systems in the Northwest,
this does not necessarily mean that salmonids in general can tolerate increases over time
of suspended sediments. An understanding of sediment size, shape, and composition,
salmonid species and life history stages, cumulative and synergistic stressor effects, and
overall habitat complexity and availability in a watershed is required.
For short-term construction projects, operators will need to measure background
turbidities on a case by case basis to determine if they are exceeding regulations.
However, transportation projects may also produce long-term, chronic effects. Short-
term pulses will presumably have a different effect on salmonids than chronic exposure.
Turbidity standards developed by several states and provinces in this region
attempt to consider natural variability in turbidity by requiring the regulated community
to measure “background turbidity” upstream of any proposed activity. The background
turbidity measured in these situations represents a measurement at one point in time.
Regulating turbidity levels based on this type of measurement may not be protective of
salmonid health.
58
Bibliography AAC (Alaska Administrative Code). 1985. Water quality standards. AAC, Title 18,
Chapter 70, Juneau. Barrett,J.C., G.D. Grossman, and J. Rosenfeld. 1992. Turbidity-induced changes in
reactive distance of rainbow trout. Trans. Am. Fish. Soc. 121 (4): 437-443 Baxter, C.V. and F.R. Hauer. 2000. Geomorphology, hyporheic exchange, and selection
of spawning habitat by bull trout (Salvelinus confuentus). Canadian Journal of Fisheries and Aquatic Sciences 57(7):1470-1481.
Berg, L. 1982. The effect of exposure to short-term pulses of suspended sediment on the
behavior of juvenile salmonids. P. 177-196 in G.F. Hartman et al. [eds.] Proceedings of the Carnation Creek workshop: a ten-year review. Department of Fisheries and Oceans, Pacific Biological Station, Nanaimo, Canada.
Berg, L. and T.G. Northcote. 1985. Changes in territorial, gill-flaring, and feeding
behaviour in juvenile coho salmon (Oncohynchus kisutch) following short-term pulses of suspended sediment. Canadian Journal of Fisheries and Aquatic Sciences 42: 1410-1417.
Berman, Cara. 1998. Oregon Temperature Standard Review. EPA Region 10. 65 pp. Berman, C.H. and T.P. Quinn. 1991. Behavioral thermoregulation and homing by spring
Chinook salmon, Onchorhynchus tshawytscha (Walbaum), in the Yakima River. Journal of Fish Biology 39:301-312.
Beschta, R.L., and W.L. Jackson. 1979. The intrusion of fine sediments into a stable
gravel bed. J. Fish. Res. Board. Can. 36(2):204-210. Bisson, P.A. and R.E. Bilby. 1982. Avoidance of suspended sediment by juvenile coho
salmon. North American Journal of Fisheries Management 4: 371-374. Bjornn, T.C. 1968. Survival and emergence of trout and salmon in various gravel-sand
mixtures. In Proceedings, Forum on the Relation Between Logging and Salmon, p. 80-88. American Institute of Fishery Research Biologists and Alaska Department of Fish and Game, Juneau.
Bjornn, T.C. and D.W. Reiser. 1991. Habitat requirements of salmonids in streams. P.
83-138. In W.R. Meehan [ed.] Influences of Forest and Rangeland Management on Salmonid Fishes and Their Habitat. American Fisheries Society Special Publication.
Boehlert, G.W. and J.B. Morgan. 1985. Turbidity enhances feeding abilities of larval
Booth, D.B. 2001. Center for Urban Water Resources Management, University of
Washington. Personal communication. Brannon, E.L. 1965. The influence of physical factors on the development and weight of
sockeye salmon embryos and alevins. Int. Pac. Salmon Fish Comm. Prog. Rep. 12. 26 p.
Brown, G.W. and J.T. Krygier. 1971. Clear-cut logging and sediment production in the
Oregon Coast range. Water Resources Research 7(5): 1189-1198 Brzezinski, M.A. and R.L. Holton. 1983. A report on the macroinvertebrates of the
Columbia River Estuary found in deposits of volcanic ash from the May 18, 1980 eruption of Mt. St. Helens. Estuaries 6(2):172-175.
Burns, J.W. 1972. Some effects of logging and associated road construction on northern
California streams. Transactions of the American Fisheries Society 101(1):1-17. Cairns, J., Jr. 1968. Suspended solids standards for the protection of aquatic organisms.
Engineering Bulletin Purdue University 12:16-27. Castro, Janine and Frank Reckendorf. 1995. Effects of sediment on the aquatic
environment. Potential NRCS Actions to Improve Aquatic Habitat. Working Paper No. 6. Natural Resources Conservation Service. Oregon State University, Department of Geosciences.
Cederholm, C.J. and E.O. Salo. 1979. The effects of logging road landslide siltation on
the salmon and trout spawning gravels of Stequaleho Creek and the Clearwater River basin, Jefferson County, Washington, 1972-1978. FRI-UW-7915. Fisheries Research Institute, University of Washington, Seattle. 99 p.
Cederholm, C.J., L.M. Reid, and E.O. Salo. 1981. Cumulative effects of logging road
sediment on salmonid populations in the Clearwater River, Jefferson County, Washington. In Proceedings from the conference Salmon-Spawning Gravel: A Renewable Resource in the Pacific Northwest? p. 38-74. Rep. 39. State of Washington Water Research Center, Pullman.
Cooper, A.C. 1965. The effect of transported stream sediments on the survival of sockeye
and pink salmon eggs and alevins. Int. Pac. Salmon Fish. Comm. Bull. 18. 71 p. Cordone, A.J. and D.W. Kelley. 1961. The influences of inorganic sediment on the
aquatic life of streams. Calif. Fish and Game 47(2):189-228. Crouse, M.R., C.A. Callahan, K.W. Malueg, and S.E. Dominguez. 1981. Effects of fine
sediments on growth of juvenile coho salmon in laboratory streams. Transactions of the American Fisheries Society 110: 281-286.
60
Davies-Colley, R.J. and D.G. Smith. 2000. Suspended Sediment, Turbidity and Clarity of
Water, a Review. Unpublished draft. Daykin, P.N. 1965. Application of mass transfer theory to the problem of respiration of
fish eggs. J. Fish. Res. Board Can. 22(1):159-171. Duchrow, R.M. and W.H. Everhart. 1971. Turbidity measurement. Transactions of the
American Fisheries Society 4:682-690. European Inland Fisheries Advisory Commission (EIFAC). 1965. Working Party on
Water Quality Criteria for European Freshwater Fish. Water quality criteria for European freshwater fish. Report on finely divided solids and inland fisheries (EIFAC Technical Paper No. 1), Air and Water Pollution 9(3):151-168.
1987. Fine sediment and salmonid production: a paradox. In E.O. Salo and T.W. Cundy [ed.] Streamside Management: Forestry and Fishery Interactions. University of Washington Institute of Forest Resources, Seattle, Washington.
Fox, Martin. 2001. University of Washington, College of Forest Resources. Personal
communication. Gammon, J.R. 1970. The effect of inorganic sediment on stream biota. Environmental
Protection Agency, Water Pollution Control Research Series 18050 DWC12/70. Gov. Printing Office, Washington, D.C. 20402.
Gardner, M.B. 1981. Effects of turbidity on feeding rates and selectivity of bluegills.
Transactions of the American Fisheries Society 110: 446-450. Ginetz, R.M. and P.A. Larkin. 1976. Factors affecting rainbow trout (Salmo dairdneri)
predation on migrant fry of sockeye salmon (Oncorhynchus nerka). Journal of the Fisheries Research Board of Canada 33: 19-24.
Gradall, K.S. and W.A. Swenson. 1982. Responses of brook trout and creek cubs to
turbidity. Transactions of the American Fisheries Society 111: 392-395. Gregory, R.S. 1988. Effects of turbidity on benthic foraging and predation risk in juvenile
chinook salmon, p. 65-73. In C.A. Simenstad [ed.] Effects of dredging on anadromous Pacific coast fishes. Workshop Proceedings, September 8-9, 1988. Washington Sea Grant Program, University of Washington, Seattle, USA.
Gregory, R.S. 1992. The influence of ontogeny, perceived risk of predation, and visual
ability on the foraging behavior of juvenile chinook salmon. Theory and Application of Fish Feeding Ecology 18: 271-284.
61
Gregory, R.S. 1993. The effect of turbidity on the predator avoidance behaviour of juvenile chinook salmon (Oncorhyncchus tshawytscha) in turbid laboratory conditions. Canadian Journal of Fisheries and Aquatic Sciences 50: 241-246.
Gregory, R.S. and T.G. Northcote. 1993. Surface, plantonic, and benthic foraging by
juvenile chinook salmon (Oncorhynchus tshawytscha) in turbid laboratory conditions. Canadian Journal of Fisheries and Aquatic Sciences 50: 233-240.
Gregory, R.S. and C.D. Levings. 1996. The effects of turbidity and vegetation on the risk
of juvenile salmonids, Oncorhynchus spp., to predation by adult cutthroat trout, O. clarkii. Environmental Biology of Fishes 47: 279-288.
Holtby, L.B. 1988. Effects of logging on stream temperatures in Carnation Creek, British
Columbia, and associated impacts on the coho salmon (Oncorhynchus kisutch). Canadian Journal of Fisheries and Aquatic Sciences 45:502-515.
Holtby, L.B., T.E. McMahon, and J.C. Scrivener. 1989. Stream temperatures and inter-
annual variability in the emigration timing of coho salmon (Oncorhynchus kisutch) smolts and fry and chum salmon (O. keta) fry from Carnation Creek, British Columbia. Canadian Journal of Fisheries and Aquatic Sciences 46:1396-1405.
Joy, Joe. 2001. Washington State Department of Ecology. E-mail. February 1, 2001. King County, Department of Natural Resources, Water and Land Resources Division.
June 2000. Water Quality Monitoring in Drainage Basins No. 6, No. 10, and No. 29: A Progress Report for the City of Mercer Island.
Lloyd, D.S. 1987. Turbidity as a water quality standard for salmonid habitats in Alaska.
North American Journal of Fisheries Management 7: 34-45. Lloyd, D.S., J.P. Koenings, J.D. LaPerriere. 1987. Effects of turbidity in fresh waters of
Alaska. North American Journal of Fisheries Management 7: 18-33. McCabe, G.T., T.C. Coley, R.L. Emmett, W.D. Muir, and J.T. Durkin. 1981. The effects
of the eruption of Mt. St. Helens on Fishes in the Columbia River Estuary. Estuaries. 4(3):p. 247.
McCabe, G.D., and W.J. O’Brien. 1983. The effects of suspended silt on feeding and
reproduction of Daphnia pulex. American Midland Naturalist 110:324-337. Michael, Hal. 2001. Washington State Department of Fish and Wildlife Hatchery
Program. Personal communication.. Molash, Ed. 2001. Washington State Department of Transportation. Personal
communication.
62
NAS (National Academy of Sciences) and NAE (National Academy of Engineering).
1973. Water quality criteria 1972. U.S. Environmental Protection Agency Ecological Research Series EPA-R3-73-033.
Newcomb, T.W., and T.A. Flagg. 1983. Some effects of Mt. St. Helens volcanic ash on
juvenile salmon smolts. Mar. Fish. Review 45(2): 8-12. Newcombe, C.P. and D.D. MacDonald. 1991. Effects of suspended sediments on aquatic
ecosystems. North American Journal of Fisheries Management 11: 72-82. Noggle, C.C. 1978. Behavioral, physiological and lethal effects of suspended sediment on
juvenile salmonids. Master’s thesis. University of Washington, Seattle, Washington, USA.
Phillips, R.W., R.L. Lantz, E.W. Claire, and J.R. Moring. 1975. Some effects of gravel
mixtures on emergence of coho salmon and steelhead trout fry. Transactions of the American Fisheries Society 104(3):461-466.
Platts, W.S., and W.F. Megahan. 1975. Time trends in channel sediment size composition
in salmon and steelhead spawning areas: South Fork Salmon River, Idaho. USDA For. Serv. Gen. Rep. Intermountain For. And Range Exp. Stn., Ogden, Utah. 21 p.
Poole, G.C. and C.H. Berman. 2001. An ecological perspective on in-stream temperature:
natural heat dynamics and mechanisms of human-caused thermal degradation. Environmental Management 27(6): 787-802.
Quinn, T.P. and K. Fresh. 1984. Homing and straying in chinook salmon (Oncorhynchus
tshawytscha) from Cowlitz River Hatchery, Washington. Can. J. Fish. Aquat. Sci. Vol. 41: 1078-1082
Redding, J.M., C.B. Schreck, and F.H. Everest. 1987. Physiological effects on coho
salmon and steelhead of exposure to suspended solids. Transactions of the American Fisheries Society 116: 737-744.
Reid, L. M. 1998. Forest roads, chronic turbidity, and salmon. EOS, Transactions,
American Geophysical Union 79(45): F285. Abstract from <www.rsl.psw.fs.fed.us/people/lreid.html>
Ritzenthaler, Elizabeth. 2001. King County Department of Natural Resources. Personal
communication. Rogers, B.A. 1969. Tolerance levels of four species of estuarine fishes to suspended
mineral solids. M.S. thesis, Univ. Rhode Island, Kingston, RI. 60 p.
63
Rosenberg, D.M. and A.P. Wiens. 1978. Effects of sediment addition on macrobenthic invertebrates in a northern Canadian river. Water Research 12: 753-763.
Scrivener, J.C., and M.J. Brownlee. 1982. An analysis of Carnation Creek gravel-quality
data 1973-1981. In G. F. Hartman [ed.] Proceedings of the Carnation Creek Workshop: A ten-year review, p. 154-173. Pacific Biological Station, Nanaimo, B.C.
Sedell, J.R., G.H. Reeves, F.R. Hauer, J.A. Stanford, and C.P. Hawkins. 1990. Role of
refugia in recovery from disturbance: modern fragmented and disconnected river systems. Environmental Management. 14:711-724.
Servizi, J.A. and D.W. Martens. 1987. Some effects of suspended Fraser River sediments
on sockeye salmon (Oncorhynchus nerka), p. 254-264. In H.D. Smith, L. Margolis, and C.C. Wood [ed.] Sockeye salmon (Oncorhynchus nerka) population biology and future management. Can. Spec. Publ. Fish. Aquat. Sci. 96.
Servizi, J.A. and D.W. Martens. 1992. Sublethal responses of coho salmon
(Oncorhynchus kisutch) to suspended sediments. Can. J. Fish. Aquat. Sci., Vol. 49: 1389-1395.
Shelton, J.M., and R.D. Pollock. 1966. Siltation and egg survival in incubation channels.
Transactions of the American Fisheries Society 95(2):183-187. Shumway, D.L., C.E. Warren, and P. Doudoroff. 1964. Influence of oxygen
concentration and water movement on the growth of steelhead trout and coho salmon embryos. Transactions of the American Fisheries Society 93:342-356.
Sigler, J.W., T.C. Bjornn, and F.H. Everest. 1984. Effects of chronic turbidity on density
and growth of steelheads and coho salmon. Transactions of the American Fisheries Society 113: 142-150.
Smedley, S.C., K.E. Durleg, C.C. Larson, D. Bishop, W.L. Sheridan, and F. Stephens.
1970. ADF&G completion report – projects 5-8-R and 5-19-R; July 1, 1965 to June 30, 1970. Alaska Department of Fish and Game, Juneau. 82 p.
Sorbo, Trudy. 2001. Washington Department of Fish and Wildlife. Personal
Suspended and dissolved solids effects on freshwater biota: a review. United States Environmental Protection Agency, Report 600/3-77-042, Environmental Research Laboratory, Corvallis, Oregon, USA.
64
Spence, B.C., G.A. Lomnicky, R.M. Hughes, and R.P. Novitzki. 1996. An Ecosystem Approach to Salmonid Conservation. Management Technology. TR-4501-96-6057.
Steel, Ashley. 2001. National Marine Fisheries Service. Personal communication. Tebo, L.B. 1955. Effects of siltation, resulting from improper logging, on the bottom
fauna of a small trout stream in the southern Appalachians. The Progressive Fish-Culturist: 64-70.
Total Maximum Daily Load Report for the Yakima River. 1997. Washington State
Department of Ecology. Pp. 30-33. United States Fish and Wildlife Service. 1998. Bull Trout Interim Conservation
Guidance. 47 pp. Vaux, W.G. 1962. Interchange of stream and intragravel water in a salmon spawning
riffle. U.S. Fish and Wildlife Service Spec. Sci. Rep., Fish. 405. 11 p. Vogel, J.L. and D.A. Beauchamp. 1999. Effects of light, prey size, and turbidity on
reaction distances of lake trout (Salvelinus namaycush) to salmonid prey. Canadian Journal of Fisheries and Aquatic Sciences 56: 1293-1297.
Waters, Thomas F. 1995. Sediment in Streams. Sources, Biological Effects, and Control.
American Fisheries Society Monograph 7. American Fisheries Society, Bethesda, Maryland.
Wedemeyer, G.A. and D.J. McLeay. 1981. Methods for Determining the Tolerance of
Fishes to Environmental Stressors. Pp. 247-268. In A.D. Pickering [ed.] Stress and fish. Academic Press, Toronto, Ont.
Whitman, R.P., T.P. Quinn, and E.L. Brannon. 1982. Influence of suspended volcanic ash
on homing behavior of adult chinook salmon. Transactions of the American Fisheries Society 111: 63-69.
Wiltsey, Mike. 2001. Oregon Department of Environmental Quality. Personal
communication.
65
Web Sites 1 Alaska Department of Environmental Conservation. Water Quality Standards.
1999. <http://www.state.ak.us/local/akpages/ENV.CONSERV/title18/70wqs.pdf> 2 British Columbia Ministry of Environment, Lands and Parks. British Columbia
Water Approved Water Quality Guidelines (Criteria) 1998 Edition. < http://www.elp.gov.bc.ca/wat/wq/BCguidelines/turbidity.html> 3 Honeywell Micro Switch Division. Turbidity Sensing: Building Block for Smart
4 Idaho Department of Environmental Quality. Idaho TMDL Approval Status
Summary as of 2/6/2001. <www2.state.id.us/deq/water/tmdls/tmdlstatus2_6_01.htm>
5 Idaho Department of Environmental Quality. Idaho State Water Quality
Standards (IDAPA 58.01.02) <http://www2.state.id.us/adm/adminrules/rules/idapa58/0102.pdf> 6 National Marine Fisheries Service. Major Threats and Impacts to Pacific
7 Oregon State Archives. Department of Environmental Quality. Water Pollution.
State-Wide Water Quality Management Plan; Beneficial Uses, Policies, Standards, and Treatment Criteria for Oregon. (Administrative Code 340-041). 2001.
< http://arcweb.sos.state.or.us/rules/OARS_300/OAR_340/340_041.html > 8 Washington State Department of Ecology. Citizen’s Guide to TSS and Turbidity
Chapter 3: Streams. <www.ecy.wa.gov/programs/wq/plants/management/joysmanual/streamtss.html> 9 Washington State Department of Ecology. Yakima Basin Water Quality. 2001.
<http://www.ecy.wa.gov/programs/wq/tmdl/watershed/yakima_wq/index.html> 10 Washington State Department of Ecology Publications. A Suspended Sediment
and DDT Total Maximum Daily Load Evaluation Report for the Yakima River. 1997. <www.ecy.wa.gov/biblio/97321.html>
11 Washington State Department of Ecology Publications. River and Stream
Ambient Monitoring Report for Water Year 1999. 2001. <http://www.ecy.wa.gov/biblio/0103013.html>
66
12 Washington State Department of Ecology Publications. Chapter 173-201A WAC, Water Quality Standards For Surface Waters Of The State Of Washington. <http://www.ecy.wa.gov/biblio/wac173201a.html>
A-1
Appendix A. 1999 Washington State Water Quality Data (Web Site Ref. #11) Table A-1. Discharge (cfs) and turbidity (NTUs) measured in Western Washington streams during 1988-99 (Web Site Ref. #11) Sample month Skagit River @
Marblemount Cfs NTU
Samish River near Burlington
NF Stillaguamish @Cicero
Stillaguamish R. near Silvana
October 4390 0.6 150 6.3 1420 6 1400 8.3 November 6330 1.1 450 10 5300 145 5870 60 December 7600 1.4 793 16 6600 100 7710 55 January 8360 0.9 583 7.7 4840 170 8810 55 February 7640 0.5 406 5.5 1050 19 2830 29 March 6190 0.8 359 5.4 2260 22 5210 29 April 6230 1.6 327 9.6 2120 19 5890 60 May 12700 4.8 180 6.3 3690 60 8200 50 June 7080 3 .2 107 3.3 2010 8 4480 17 July 10600 2.7 78 2.2 1300 3.1 2460 4.9 August 8550 2.2 62 2.7 641 2.1 1600 4.2 September 4290 0.7 32 1.1 270 1.6 574 1.7 Table A-2. Turbidity (NTUs) measured in three Western Washington streams during 1988-99 Yearly Average Summer Range
(May-Oct.) Winter Range (Nov. – Apr.)
Cedar River 1.1 0.4 – 1.2 1.0 – 2.0 Newaukum Creek 2.4 0.7 – 1.5 3.1 – 4.0 Springbrook Creek 22.0 13.0 – 44.0 13.0 – 35.0 Table A-3. TSS (mg/l) measured in three Western Washington streams during 1988-99 Yearly Average Summer Range
(May-Oct.) Winter Range (Nov. – Apr.)
Cedar River 3.6 0.6 – 5.0 3.5 – 6.2 Newaukum Creek 5.7 1.6 – 5.1 7.5 – 8.8 Springbrook Creek 19.8 8.0 – 26.0 6.7 – 44.0 Source: Metro 1990. Quality of Local Lakes and Streams 1988-89 Status Report. Municipality of Metropolitan Seattle, Water Resources Section, from: Washington Department of Ecology, A Citizen’s Guide to Understanding and Monitoring Lakes and Streams. (Web Site Ref. #8)
A-2
B-1
Appendix B. Tables from Newcombe and MacDonald (1991) Table B-1. Summary of data (in situ observations) on exposures to suspended sediment that resulted in lethal responses in salmonid fishes. Within species groups, stress indices are arranged in increasing order. For exposure, C= concentration (mg/l) and D = duration (h). Exposure Species C D Stress index
(loge* [CxD])
Effect Rank of Effect
Source
Arctic grayling 25 24 6.397 6% mortality of sac fry
Coho salmon 1,200 96 11.654 50% mortality of juveniles
12 Noggle (1978)
1,217 96 11.668 50% mortality of pre-smolts (high T*C)
12 Stober et al. (1981)
Chinook and sockeye salmon
207,000b 1 12.240 100% mortality of juveniles
14 Newcomb and Flagg (1983)
9,400 36 12.732 50% mortality of juveniles
12 Newcombe and Flagg (1983)
Chum salmon 97 3,912b 12.847 77% mortality of eggs and alevins
13 Langer (1980)
B-2
Table B-1 (cont.). Summary of data (in situ observations) on exposures to suspended sediment that resulted in lethal responses in salmonid fishes. Within species groups, stress indices are arranged in increasing order. For exposure, C= concentration (mg/l) and D = duration (h). Exposure Species C D Stress index
(loge* [CxD])
Effect Rank of Effect
Source
Chum salmon 111 3,912b 12.981 90% mortality of eggs and alevins
14 Langer (1980)
Chinook and sockeye salmon
82,000 6 13.106 60% mortality of juveniles
12 Newcomb and Flagg (1983)
Coho salmon 18,672 96 14.400 50% mortality of presmolts
12 Stober et al. (1981)
Chinook salmon
19,364 96 14.436 50% mortality of smolts
12 Stober et al. (1981)
Chum salmon 28,000 96 14.804 50% mortality of juveniles
12 Smith (1939)
Coho salmon 28,134 96 14.811 50% mortality of smolts
12 Stober et al. (1981)
29,580 96 14.859 50% mortality of smolts
12 Stober et al. (1981)
35,000b 96 15.027 50% mortality of juveniles
12 Noggle (1978)
Chinook and sockeye salmon
39,400 36 15.145 90% mortality of juveniles
14 Newcombe and Flagg (1983)
Chum salmon 55,000 96 15.479 50% mortality of juveniles
12 Smith (1939)
Whitefish 16,613 96b 14.282 50% mortality of juveniles
12 Lawrence and Scherer (1974)
Rainbow trout 200c 24 8.476 5% mortality of fry 10 Hebert and Richards (1963)
7 1,152 8.995 17% reduction in egg-to-fry survival
10 Slaney et al. (1977b)
21 1,152 10.094 62% reduction in egg-to-fry survival
13 Slaney et al. (1977b)
200c 168 10.422 8% mortality of fry 10 Herbert and Richards (1963)
90 456 10.622 5% mortality of sub-adults
10 Herbert and Merkens (1961)
68 720b 10.799 25% reduction in population size
11 Peters (1967)
37 1,440 10.883 46% reduction in egg-to-fry survival
12 Slaney et al. (1997b)
47 1,152 10.889 100% mortality of incubating eggs
14 Slaney et al. (1997b)
57 1,440 11.315 23% reduction in egg-to-fry survival
11 Slaney et al. (1997b)
270d 456 11.721 10-35% mortality of sub-adults
11 Herbert and Merkens (1961)
B-3
Table B-1 (cont.). Summary of data (in situ observations) on exposures to suspended sediment that resulted in lethal responses in salmonid fishes. Within species groups, stress indices are arranged in increasing order. For exposure, C= concentration (mg/l) and D = duration (h). Exposure Species C D Stress index
(loge* [CxD])
Effect Rank of Effect
Source
Rainbow trout 270c 456 11.721 80% mortality of sub-adults
13 Herbert and Merkens (1961)
101 1,440 11.888 98% mortality of eggs (high metals and NH3 levels)
14 Turnpenny and Williams (1980)
Brown trout 110 1,440 11.973 98% mortality of eggs
14 Scullion and Edwards (1980)
Rainbow and brown trout
300 720b 12.283 97% reduction in population size
14 Peters (1967)
Rainbow trout 1,000-2,500
144 12.437 100% mortality of eggs
14 Campbell (1954)
157 1,728 12.511 100% mortality of eggs
14 Shaw and Maga (1943)
810d 456 12.820 5-80% mortality of sub-adults
13 Herbert and Merkens (1961)
810c 456 12.820 80-85% mortality of sub-adults
14 Herbert and Merkens (1961)
200c 2,352 13.061 50% mortality of fry 12 Herbert and Richards (1963)
1,000-2,500
480 13.641 57% mortality of fingerlings
12 Campbell (1954)
4,250 588 14.731 50% mortality (life stage not specified)
12 Herbert and Wakeford (1962)
160,000 24 15.161 100 14 D.W. Herbert, pers. commun. in Alabaster and Lloyd (1982)
49,000 96 15.363 50% mortality of juveniles
12 Lawrence and Scherer (1974)
1,000-6,000
1,440b 15.432 85% reduction in population size
14 Herbert and Merkens (1961)
Brown trout 1,040 8,670 16.024 85% reduction in population size
14 Herbert et al. (1961)
5,838 8,670 17.750 85% reduction in population size
14 Herbert et al. (1961)
a Scientific names: Arctic grayling, Thymallus arcticus, chinook salmon, Oncorhynchus tshawytscha, coho salmon, O. kisutch; sockeye salmon, O. nerka; chum salmon, O. keta; whitefish, Coregonus sp.; rainbow trout, Oncorhynchus mykiss; brown trout, Salmon trutta.
b Estimated. c Wood fiber. d Kaolin. e Diatomaceous earth.
B-4
Table B-2. Summary of data on exposures to suspended sediment that resulted in sublethal responses in salmonid fishes. Within species groups, stress indices are in increasing order. For exposure, C = concentration (mg/l) and D = duration (h). Exposure Species C D Stress index
(loge* [CxD])
Effect Rank of Effect
Source
Arctic grayling 100 1 4.605 Reduction in feeding rate
4 McLeay et al. (1984)
100 1,008 11.521 6% reduction in growth rate
9 McLeay et al. (1984)
300 1,008 12.620 Physiological stress 8 McLeay et al. (1987)
300 1,008 12.620 10% reduction in growth rate
9 McLeay et al. (1987)
1,000 1,008 13.823 33% reduction in growth rate
9 McLeay et al. (1987)
Coho salmon 14 1 2.639 Reduction in feeding efficiency
Table B-2 (cont.). Summary of data on exposures to suspended sediment that resulted in sublethal responses in salmonid fishes. Within species groups, stress indices are in increasing order. For exposure, C = concentration (mg/l) and D = duration (h). Exposure Species C D Stress index
(loge* [CxD])
Effect Rank of Effect
Source
Rainbow trout 50c 1,848 11.434 Reduction in growth rate
a Scientific names: cutthroat trout, Oncorhynchus clarki; steelhead = anadromous rainbow trout; brook trout, Salvelinus fontinalis b Estimated c Lime-neutralized iron hydroxide d Fire clay e Coal dust f Wood fiber
B-6
Table B-3. Summary of data on exposures to suspended sediment that resulted in behavioral responses in salmonid fishes. Within species groups, stress indices are in increasing order. For exposure, C = concentration (mg/l) and D = duration (h). Exposure Species C D Stress index
(loge* [CxD])
Effect Rank of Effect
Source
Arctic grayling 100a 1 2.303 Avoidance response 3 Suchanek et al. (1984a), Suchanek et al. (1984b)
a Estimated. b Lime-neutralized iron hydroxide. c Coal dust. d Wood fiber.
C-1
Appendix C. Individual State Turbidity Standards
The following section illustrates specific turbidity regulations for the states of
Alaska, Idaho, Oregon and Washington, and the Province of British Columbia.
Alaska State Turbidity Standards
According to Lloyd (1987), Alaska does not have a numerical standard for
suspended solid concentrations in drinking water supplies. The state has a narrative
standard for sediment.
No measurable increase in concentrations of sediment including settleable solids, above natural levels. [AAC 1985].
Alaska has a sediment standard for the propagation of fish and wildlife:
The percent accumulation of fine sediment in the range of 0.1 mm to 4.0 mm in the gravel bed of waters utilized by anadromous or resident fish for spawning may not be increased more than 5% by weight over natural condition (as shown from grain size accumulation graph). In no case may the 0.1 mm to 4.0 mm fine sediment range in the gravel bed of waters utilized by anadromous or resident fish for spawning exceed a maximum of 30% by weight (as shown from grain size accumulation graph). [AAC 1985], taken from (Lloyd 1987)
C-2
Table C-1. Alaska state turbidity standards (Web Site Ref. #1) (1) Fresh Water Uses Turbidity (not applicable to groundwater) (A) Water Supply (i) drinking, culinary, and food processing
May not exceed 5 nephelometric turbidity units (NTU) above natural conditions when the natural turbidity is 50 NTU or less, and may not have more than 10% increase in turbidity when the natural turbidity is more than 50 NTU, not to exceed a maximum increase of 25 NTU.
(A) Water Supply (ii) agriculture, including irrigation and stock watering
May not cause detrimental effects on indicated use.
(A) Water Supply (iii) aquaculture May not exceed 25 NTU above natural conditions. For all lake waters, may not exceed 5 NTU above natural conditions.
(A) Water Supply (iv) industrial May not cause detrimental effects on established water supply treatment levels.
(B) Water Recreation (I) contact recreation
May not exceed 5 NTU above natural conditions when the natural turbidity is 50 NTU or less, and may not have more than 10% increase in turbidity when the turbidity is more than 50 NTU, not to exceed a maximum increase of 15 NTU. May not exceed 5 NTU above natural turbidity for all lake waters.
(B) Water Recreation (I) secondary recreation
May not exceed 10 NTU above natural conditions when natural turbidity is 50 NTU or less, and may not have more than 20% increase in turbidity when the natural turbidity is greater than 50 NTU, not to exceed a maximum increase of 15 NTU. For all lake waters, turbidity may not exceed 5 NTU above natural turbidity.
(C) Growth and Propagation of Fish, Shellfish, Other Aquatic Life, and Wildlife
Same as (1)(A)(iii).
Idaho State Turbidity Standards
The Idaho Division of Environmental Quality adopted turbidity criteria for the
protection of cold water biota in 1994. The criteria focus on requirements of salmon as
an indicator species. The 50 NTU background turbidity is based on data suggesting that
displacement of salmonids occurs at 50 NTU (Lloyd et al. 1987). The 25 NTU for 10
days limit is based on literature showing that salmonid feeding and growth are affected
by prolonged exposure to turbidity over 25 NTU (Sigler et al. 1984).
C-3
Surface Water Quality Criteria for aquatic life use designations – turbidity, below
any applicable mixing zone set by the Department shall not exceed background turbidity
by more than fifty (50) NTU instantaneously or more than twenty-five (25) NTU for
more then ten (10) consecutive days.
For comparison, turbidity criteria for water supply (measured at a public water
intake) is as follows:
(1) No increase by more than five (5) NTU above natural background,
measured at a location upstream from or not influenced by any human
induced non-point source activity, when background turbidity is fifty (50)
NTU or less.
(2) No increase by more than ten percent (10%) above natural background,
measured at a location upstream from or not influenced by any human
induced non-point source activity, not to exceed twenty-five (25) NTU,
when background turbidity is greater than fifty (50) NTU (Web Site Ref.
#5).
Oregon State Turbidity Standards
Oregon turbidity standards are applied to all watersheds in the state. The
requirement may be applied to temporary projects affecting a stream or activities
responsible for long-term sediment inputs.
In all basins, no more than 10% cumulative increase in natural stream turbidities
shall be allowed, as measured relative to a control point immediately upstream of the
turbidity causing activity. The criteria for listing a water body as 303(d) limited due to
turbidity is a systematic or persistent increase (of greater than 10%) in turbidity due to an
operational activity that occurs on a persistent basis (e.g., dam release, irrigation return)
The requirements for listing a water body include collection of TSS data since water year
1986 (10/85) on a frequent enough basis (e.g., daily) to establish a relationship between
water quality and a turbidity causing activity (Oregon Administrative Code).
Limited duration activities necessary to address an emergency or to accommodate
essential dredging, construction, or other legitimate activities and which cause the
C-4
standard to be exceeded may be authorized provided “practicable” turbidity control
techniques have been applied and one of the following has been granted:
(A) Emergency activities: Approval coordinated by the Department of Environmental
Quality with Department of Fish and Wildlife under conditions they may
prescribe to accommodate response to emergencies or to protect public health and
welfare;
(B) Dredging, Construction or other Legitimate Activities: Permit or certification
authorized under terms of Section 401 or 404 (Permits and Licenses, Federal
Water Pollution Control Act) or Oregon Administrative Rule 141-085-0100 et
seq. (Removal and Fill Permits, Division of State Lands), with limitations and
conditions governing the activity set forth in the permit or certificate (Web Site
Ref. #7).
Washington State Turbidity Standards
Table C-2. Washington state turbidity standards Class A Waters Class B Waters Turbidity shall not exceed 5 NTU over background turbidity when the background turbidity is 50 NTU or less, or have more than a 10 percent increase in turbidity when the background is more than 50 NTU.
Turbidity shall not exceed 10 NTU over background turbidity when the background turbidity is 50 NTU or less, or have more than a 20 percent increase in turbidity when the background is more than 50 NTU
(Web Site Ref. #12)
C-5
British Columbia Standards Table C-3. British Columbia turbidity and suspended sediment standards
Water Use Maximum Induced Turbidity – NTU
or % of background
Maximum Induced Suspended
Sediments –mg/l or % of background
Streambed Substrate
Composition
Drinking Water – raw untreated
1 NTU when background is less than or equal to 5
No guideline No guideline
Drinking Water – raw treated
5 NTU when background is less than or equal to 50
No guideline No guideline
Recreation and Aesthetics
Maximum 50 NTU …..
secchi disc visible at 1.2 m
No guideline No guideline
Aquatic Life -fresh-
-marine- -estuarine-
8 NTU in 24 hours when background is less than or equal to
8 ….
Mean of 2 NTU in 30 days when
background is less than or equal to 8
25 mg/l in 24 hours when background is less than or equal to
25 ….
Mean of 5 mg/l in 30 days when
background is less than or equal to 25
Fines not to exceed -10% as less than
2mm- -19% as less than
3mm- -25% as less than
6.35mm- at salmonid spawning
sites Aquatic Life
-fresh- -marine-
-estuarine-
8 NTU when background is
between 8 and 80 ….
10% when background is
greater than or equal to 80
25 mg/l when background is
between 25 and 250 ….
10% when background is
greater than or equal to 250
Geometric mean diameter not less
than 12 mm ….
Fredle number not less than 5mm
Terrestrial Life -wildlife-
-livestock water- Irrigation Industrial
10 NTU when background is less than or equal to 50
…. 20% when
background is greater than or equal
to 50
20 mg/l when background is less
than or equal to 100 ….
20% when background is
greater than or equal to 100
No guideline
(Web Site Ref. #2)
C-6
European Inland Fisheries Advisory Committee (EIFAC)
EIFAC (1965) presented five pathways that fine sediments may harm freshwater
fishes:
1. By acting directly on the fish swimming in water in which solids are
suspended, and either killing them or reducing their growth rate, affecting
their resistance to disease
2. Preventing the successful development of fish eggs and larvae
3. By modifying natural movements and migrations of fish
4. By reducing the abundance of food available to the fish
5. By affecting the efficiency of methods of catching fish
Subsequent EIFAC recommendations:
Level of Protection Maximum Concentration of Suspended Solids High 25 mg/l Moderate 80 mg/l Low 400 mg/l Very Low over 400 mg/l (Protective levels established based on EIFAC Study.)
D-1
Appendix D . Total Maximum Daily Loads
The Total Maximum Daily Load (TMDL) process was established by section
303(d) of the Clean Water Act. Federal law requires states to identify sources of
pollution in waters that fail to meet state water quality standards after all point sources
have been permitted and to develop cleanup plans to address pollutants of concern. A
TMDL is a calculation of the maximum amount of a pollutant that a water body can
receive and still meets state water quality standards. Percentages of the total maximum
daily load are allocated to the various pollutant sources. (Web Site Ref. #11).
Uses are identified for each water body, such as drinking water, contact
recreation, and aquatic life support. The TMDL is meant to reflect the sum of allowable
loads from a single pollutant for all point and non-point sources. TMDL calculations
include a “margin of safety” to ensure protection in the case of unforeseen events or
unknown sources of the pollutant. Calculation must also account for seasonable variation
in background water quality (Web Site Ref. #11).
In Oregon and Washington, few rivers to date have TMDL requirements for 1)
turbidity levels or 2) suspended solids.
Umatilla TMDL (Oregon)
The Umatilla TMDL for turbidity requires that measurements not exceed 30 NTU
for 48 hours. The state collected TSS and turbidity data with automated ISCO samplers
in the Umatilla, and determined that the Umatilla needed improvement in this area. The
state did not focus on background concentrations. High turbidity levels in the Umatilla
are associated with agricultural practices in the watershed. Upstream forested areas did
not require a sediment load allocation. The TSS requirement for the Umatilla is 80-110
mg/l, except when stream flow is high (greater than 1.5 times bank) (Wiltsey, pers.
commun.).
Lower Yakima TMDL (Washington)
The Washington State Department of Ecology conducted a TMDL evaluation of
the lower Yakima River basin in 1994 and 1995. The process was conducted with the
D-2
cooperation of the Yakama Nation and the USEPA. The evaluation focused on total
suspended sediment (TSS) and DDT loads from irrigated agricultural areas during the
irrigation season. Historical and TMDL data indicated significant correlations between
TSS and turbidity, and TSS and DDT. It was assumed reductions in TSS would decrease
DDT levels. Turbidity targets were recommended for mainstem and tributary sites on a
15-year implementation schedule (Web Site Ref. #10).
The Department of Ecology needed to build a “narrative criteria” argument
because the state water quality criteria were written exclusively for point source rather
than non-point source control. There are few turbidity (under 10) listings on the state
303(d) list because the criteria require a “background” turbidity measurement. Few
monitoring agencies are equipped to establish a background NTU value when turbid
conditions arise from a diffuse set of streams affected by non-point sources. The Palouse
River is and example of a river with TSS concentrations in the hundreds and thousands
that has escaped 303(d) listing. Glacial headwaters are not helpful in some systems
either, as they may produce a high level of natural background turbidity (Joy, e-mail).
The Washington State Class A turbidity criterion was applied to the mainstem to
control TSS loading. In-stream turbidity will be limited to a 5 NTU increase in the 86.4
mile reach between the confluence of the Yakima and Naches River and Benton city. A
90th percentile turbidity target of 25 NTUs (56 mg/l TSS) for the tributaries and return
drains was recommended to significantly reduce t-DDT loads and to protect aquatic
communities from TSS effects. The target will require the largest return drains to reduce
TSS loads 70% or more during an irrigation season with normal water availability.
Based on the current correlation equation, tributary TSS concentrations will need to be
further reduced to 7 mg/l to meet the 1 mg/l DDT chronic toxicity criterion for protection
of aquatic life. However, more data from tributaries for TSS and t-DDT at lower TSS
concentrations are needed to confirm this target (Web Site Ref. #10).
Currently, two systems in Washington State with turbidity problems are targeted
for TMDL work: the upper Yakima River and tributaries, and Portage Creek in the
Stillaguamish River System. The state is applying narrative type criteria for protection of
aquatic life where it is unable to provide background conditions for applying turbidity
criteria. (Joy, e-mail).
D-3
Idaho TMDLs
The State of Idaho has developed a number of TMDLs focused on reducing
sediment as a pollutant. (Web Site Ref. #4)
Watershed/Sub-Basin with sediment TMDLs done for sediment Paradise Creek (1997) 1 segment Lower Boise River (1998) 3 segment MF Payette River (1998) 1 segment Winchester Lake (1998) and Upper Lapwai (2003)
1 lake for sediment, 1 river segment for sediment
Portneuf River (1998) 26 segments Lake Walcott (1999) 3 segments Upper Snake-Rock (1999) 34 segments Lemhi River (1998) 7 segments Coeur d’Alene Lake/Lower River (1999) 7 segments Pend Oreille (1999) 4 segments Jim Ford Creek (1999 & 2003) 1 segments Cottonwood Creek (1999 & 2003) 6 segments Little Lost (1999) 3 segments Bruneau (2000) 3 segments Palisades (2000) 2 segments
Summary
TMDLs offer an opportunity for regulators and stakeholders in a watershed to
reduce pollutant loads in the system. In Washington, Oregon, and Idaho, control of
sediment is of concern, particularly in agricultural areas. Sediment is a concern both for
its direct physical effect on aquatic life and its ability to transport pesticides through the