University of Massachuses Amherst ScholarWorks@UMass Amherst Doctoral Dissertations 1896 - February 2014 1-1-1983 Effects of type of visual information on characteristics of standing sway. Ann-Patrice, Hickey University of Massachuses Amherst Follow this and additional works at: hps://scholarworks.umass.edu/dissertations_1 is Open Access Dissertation is brought to you for free and open access by ScholarWorks@UMass Amherst. It has been accepted for inclusion in Doctoral Dissertations 1896 - February 2014 by an authorized administrator of ScholarWorks@UMass Amherst. For more information, please contact [email protected]. Recommended Citation Hickey, Ann-Patrice,, "Effects of type of visual information on characteristics of standing sway." (1983). Doctoral Dissertations 1896 - February 2014. 1715. hps://scholarworks.umass.edu/dissertations_1/1715
Transcript
University of Massachusetts AmherstScholarWorks@UMass Amherst
Doctoral Dissertations 1896 - February 2014
1-1-1983
Effects of type of visual information oncharacteristics of standing sway.Ann-Patrice, HickeyUniversity of Massachusetts Amherst
Follow this and additional works at: https://scholarworks.umass.edu/dissertations_1
This Open Access Dissertation is brought to you for free and open access by ScholarWorks@UMass Amherst. It has been accepted for inclusion inDoctoral Dissertations 1896 - February 2014 by an authorized administrator of ScholarWorks@UMass Amherst. For more information, please [email protected].
Recommended CitationHickey, Ann-Patrice,, "Effects of type of visual information on characteristics of standing sway." (1983). Doctoral Dissertations 1896 -February 2014. 1715.https://scholarworks.umass.edu/dissertations_1/1715
Effects of Type of Visual Informationon Characteristics of Standing Sway
A Dissertation Presented
By
Ann-Patrice Hie key
Submitted to the Graduate School of theUniversity of Massachusetts in partial fulfillment
of the requirements for the degree of
DOCTOR OF PHILOSOPHY
MAY 1983
Psychology
Effects of Type of Visual Informationon Characteristics of Standing Sway
A Dissertation Presented
By
Ann-Patrice Hickey
Approved as to style and content by:
Dr. Ernest Dzendols/t, ^Chairperson of the Committee
Dr. Kathrine^V. fite, Member'
JOld Well, Member"
Dr. Michael Arbib, Member
Dr. [Bonnie Strickland.f Department HeadPsyghclogy \J
Ann-Patrice Hie key
All Rights Reserved
iii
ACKNOWLEDGEMENTS
I would like to thank ray committee, Dr. Kathrine V. Fite,Dr. Arnold Well, Dr. Michael Arbib and Dr. Ernest Dzendolet fortheir kind assistance with this project. I would especially liketo thank Dr. Dzendolet for the patience and guidance he has givenme over the years as my advisor and mentor.
There are many people who I would like to thank for their support,wisdom and friendship during this project. Lorraine Yazinski
,
Sally Freeman, Joan Sweeney, and Suzanne Lerner kept my mind andgood spirits alive with many worthwhile distractions. Dr. RachelFerris helped me get "unstuck". My housemates provided technicalas well as emotional support during this work. I would especiallylike to thank Mike Freidman and Peg Larson and their son Nicky, foropening their home and hearts to me and Elizabeth Stern for helpingme keep focused on future work. Other housemates, Miriam Defant,Jon Schwartz, and Dick Mc Leester, have listened well, done mydishes on occasion, typed and edited, thank-you.
This dissertation is dedicated to my family.
iv
ABSTRACT
Effects of Type of Visual Informationon Characteristics of Standing Sway
May, 1983
Ann-Patrice Hickey, B.S.M.E., Clarkson College.3. .Clarkson College, Ph.D., University of Massachusetts
Directed by: Dr. Ernest Dzendolet
A series of experiments were conducted to investigate the effectsof various types of visual information on a subjects lateral sway,as measured by a sway platform and analysed via a Power SpectralDensity (PSD) analysis. The subjects were 56 normal young adultsubjects, 28 women and 28 men. In the first three of the fourexperiments conducted, an unusual visual condition; blindfold witheyes open, ganzfeld, or a helmet with an attached visual scene, wascompared with a visual condition in which the stimuli were those ofthe lab room. In the fourth experiment, the helmet with theattached visual scene was compared with another helmet matched forweight and torque loading on the neck but without an attachedvisual scene. For each experiment two ANOVA's were performed, eachover a different frequency range. Each ANOVA utilized a onebetween-subject variable (gender) and two within-subject variable(condition and frequency), repeated measurement design. Severalsign tests were also performed on the data to tease out consistentif small differences between conditions. In addition, the subjectsdata were pooled by gender and condition and these average recordswere plotted with PSD vs frequency on a semi- log scale. The plotscould be fit by four linear segnents. Results suggest thatsubjects sway less in the ganzfeld condition than in the
environmental condition. Gender differences were found in theblindfold vs lab environment experiment and the helmet with the
visual scene vs the control helmet experiment but not in the othercomparisons, suggesting that gender differences may be eitherunstable or condition dependent. Results are discussed and a
chapter on directions for future research is included.
v
TABLE OF CONTENTS
ACKNOWLEDGEMENT
Chapter
I. INTRODUCTION^
Review of relevant literatureT
Aspects of the visual field to be considered ........... 5Peripheral Visual field to be considered '.*.!!!.* 5Pattern ''^
^Eyes open vs. eyes closed 7
Effects of gender and biological rythyms 7Experimental design *
gThe measure
11
II. METHOD 12Subjects 12Apparatus I3
Sway transducer 13Visual stimuli
, 14Procedure
, I5Data analysis 17
III. RESULTS 19
ANOVA on the larger range (.02 to .92 Hz) 19ANOVA on the smaller range (.12 to .44 Hz) 21
Sign tests 22Standard deviation vs frequency plots 24Mean graphs 24Subjective Reports 2?
IV. DISCUSSION 29Synopsis of the results 29
Frequency 30
Gender 31
Standard deviation 33
Condition 35
Helmet conditions 35
Black and white visual fields 36
The measure 40
Conclusion 42
vi
V. FUTURE RESEARCHOverall directions J°^sig" '^'^y^y////^'^'^'.',
.12-. 44 Hz), helmet-VS vs helraet-C 66Summary of sign tests
5YComparison of average graphs *.
**
' 68
viii
LIST OF ILLUSTRATIONS
Figure
1. Standard deviation vs. freq., environment condition 702. Standard deviation vs. freq., blindfold condition 723. Standard deviation vs. freq., ganzfeld condition Ji]
Standard deviation vs. freq., helmet control condition. .. 765. Standard deviation vs. freq., helmet-VS condition 786A. PSD vs. freq. (semilog), environment condi tion , women. ... 806B. PSD vs. freq. (semilog), environment condition, men 827A. PSD vs. freq. (semilog), blindfold condition, women 847B. PSD vs. freq. (semilog), blindfold condition, men 868A. PSD vs. freq. (semilog), ganzfeld condition, women 888B. PSD vs. freq. (semilog), ganzfeld condition, men 909A. PSD vs. freq. (semilog), helmet-VS, women. 929B. PSD vs. freq. (semilog), helmet-VS, men 9410A. PSD vs. freq. (semilog), helmet-C , women 9610B. PSD vs. freq. (semilog), helmet-C, men 9811. PSD's of other motor systems 100
ix
C H A P T E R 1
INTRODUCTION
The series of experiments conducted were part of a preliminary
investigation into the effects of various types of visual
information on a subject's lateral sway, as measured by a sway
platform and analysed via a Power Spectral Density (PSD) analysis.
The sway platform is a measure of "whole body" motor output which
does not involve lengthy procedures, injection or other invasive
techniques, does not cause physical or emotional trama to the
subject, and requires a minimum of instruction and other subject
preparation. This platform has the potential of becoming a
sensitive clinical tool which could be used by non-professionals.
For this potential to be fulfilled however, the measurement must be
1
2
thoroughly explored with various subjects pools under a broad range
of conditions. Although the use of the PSD measure for sway
analysis was introduced into the field by this lab (Bensel and
Dzendolet, 1969). the measurement configuration used here currently
has only been in existence for about three years. Thus far this
configuration has been used to study the influences of morphology
and athleticism (Powell, 198I) and foot placement ( Allen , 1982 ) ,
however in each case the measurements were taken only for male
subjects and these subjects were always blindfolded. The study
described in this paper expands the subject pool to include women
and investigates not only the blindfolded but other visual
conditions as well. Previous studies in other labs of the effects
of visual stimuli on PSD's of sway have focused on
anterior-posterior, as opposed to lateral, sway, (Mauritz et al .
,
1972, Dichgans et al. , 1976, Dichgans and Brandt, 1978). Because
the organization of muscular action, innervation and structure is
spatially different in these two vertical planes, one would suspect
that the specific parameters of a sway response to similiar stimuli
may also differ between these planes. On the other hand, sway in
both planes seems to be a result of interaction of cues from the
proprioceptive, vestibular and visual systems. Therefore,
information about the general effects of visual stimuli on
equilibrium which comes from studies of anterior-posterior sway ,
3
as well as other paradigms for investigation of
vestibular-visual-proprioceptive interaction, will be discussed in
this introduction.
The importance of visual cues for standing equilibrium is
dramatically evident in clinical research on patients with
disorders of one of the other two systems. Patients with diseases
of muscle and joint afferents have great difficulty balancing in
the dark, (Andre-Thomas, 1946). The difficulty experienced by
patients with bilateral vestibular lesions is less dramatic but
still evident in the absence of visual cues, (Dichgans and Brandt,
1974). The influence of visual information on standing can be made
apparent in normal subjects by having them experimentally deprived
of ankle muscle and joint information (Lee and Lishman, 1975), or
by presenting them with visual cues which are discrepant with cues
from the vestibular and proprioceptive systems (Lishman and Lee,
1973).
Visual cues are often taken as predominant in cases of
experimentally produced conflict between visual and vestibular
cues. In studies involving circular or linear vection (Brandt et
al., 1963, Nashner and Berthoz, 1978), as well as studies using
4
visual cues artificially stabilized with regard to the subject's
head, (Lishman and Lee, 1973). results clearly indicate that the
visual information presented, while incorrect, is nonetheless taken
as the stationary reference.
The influence of visual information on equilibrium is also
demonstrated by severe disorganization of motor control experienced
by subjects wearing reversing prism goggles, (Gonshor and Mellvill
Jones, 1980). Reversing prism goggles provide full-color,
three-dimensional visual information of the surround which is
discrepant from a normal view by having its right-left polarity
Hz), in order to de-emphasize the variance due to frequency and
examine the other variables more closely.
In addition, several sign tests were conducted to tease out
18
small but consistent differences between conditions. The first
group of these sigr tests was conducted on PSD values (in dB form),
at .42 Hz for all subjects in each experiment. The second group of
tests was performed on the mean PSD's of subjects in each condition
by gender over the 9 frequencies used in the restricted Anova test.
For example, for each experiment, the average PSD value for all the
women in one condition were compared to the average PSD values for
all the women in the second condition, for each of the nine
frequencies
.
PSD records of the individual trials were also averaged across
subjects within gender and condition, and averaged records were
plotted. Standard deviations • were also calculated and plotted.
CHAPTERS
RESULTS
ANOVA on the larger range ( .02 to Hz)
BMDP2V was used to conduct an analysis of variance on ten
frequencies between .02 and ,92 inclusive, for each of the four
experiments. In each case, gender was analyzed as a
between-subject variable while frequency and condition were
analyzed as within-subject variables, in a repeated measures
design. Summary tables of these four analyses are presented in
tables 1-4.
19
20
vsResults of the Anova for Experiment 1 (environment
blindfolded) indicate that only the frequency variable is
significant over this range of the data (f=72.82. p$.0001 ). A
significant frequency effect means that much of the variability
found in the data is solely due to the change over frequencies
regardless of gender or condition. The analysis of Experiment 2
(environment vs. ganz) also reveals a significant effect due to
frequency (F=102.25, p$. 00001). m addition, the frequency by
gender interaction was also found to be significant in Experiment
2(F=1.96, p$.05). This effect suggests that the PSD values change
across frequencies in a different way for the two genders. The
analysis of Experiment 3 (environment vs. helmet-VS) shows once
again a significant effect due to fr equency( F=1 05. 34 , p$.00001 ),
but also in this case a significant frequency by condition effect
(F=3.00, p$.0032), indicating a significant difference between the
slope of the PSD by frequency curves of the two conditions.
Analysis of Experiment 4 (helmet environment vs. helmet-VS) was by
far the most prolific with regard to significance. Gender (F=5.18,
p$.0421), frequency(F=93.96, p$.0001 ), frequency by gender (F=2.12,
p$.03), and condition by frequency (F=2.64, p$.008) , were found to
be significant.
21
ANOVA on the four experiments using ^ rpHno^ range (.12 to .44
Hz) .
A smaller range of the data was re-analysed in each experiment
in order to reduce the great amount of variance due to frequency,
and possibly enhance the presence of other effects. In each case
nine points between .12 and .44 Hz were used in this second
analysis
.
In each experiment, frequency was also found to be significant
in this second analysis ( p$. 00001, see tables 5-8). Analysis of
the reduced range in Experiment 1 (environment vs blind) uncovered
a significant effect due to gender (F=6.3, p$.02, men swayed more)
but still did not support a condition effect. Experiment 2, when
analysed over this range, produced no new significant results and
revealed a reduced effect due to frequency by gender interaction
(F=1.75, p$.095). Analysis of Experiment 3 revealed not only
significant frequency (F=32.02, p$. 00001 ) and condition by
frequency(F=3.96, p$.0004) but significance due to
condition(F=19.6, p$.0008). The secondary analysis of Experiment 4
confirmed both the gender and frequency effects over this
restricted range but failed to show the frequency by gender and
condition by frequency effects found in the analysis of the larger
22
range.
Sign tests
The analysis of variance is a test which is sensitive to the
absolute magnitude of a variation from the mean but not to the
directionality of the variations. Because we are measuring a
signal for which relatively small differences of consistent
directionality may be of importance, several • sign tests were
performed on the data to tease out consistent though small
differences between the PSD values produced in response to the
various conditions.
Test J (conducted between subjects at .^2 Hz for each
experiment) . For each experiment a sign test (Hayes, 197M) was
performed between subjects across conditions at .42 Hz. Results of
these tests are presented in table 9.
Sign test analysis on Experiment 1 shows that across subjects
the blindfold condition consistently produced more sway at .42 Hz
than did the environmental condition( z=1 .8, 1-f( z)=.036) . In
Experiment 2 the ganzfeld condition produced consistently less sway
than the environmental condition ( z= 1 . 80 , 1-f( z) = . 036) . Experiment
23
3 Showed consistently higher PSD values in the helmet- VS
condition(z=1.8.1-f(z)=.036). The sign test for Experiment U at .42
Hz revealed no consistent directionality of the difference between
the two helmet conditions.
Test 2 (between conditions for average records at nine
frequencies). A second group of sign tests were conducted on the
means of the PSD values used in the restricted range anova. This
sign test of Experiment 1 indicated a consistent difference between
the means of PSD values on the two conditions with the blindfold
condition causing higher mean PSD values for both men and women
(z=3.8, 1-f(z) = .0001 , for women; z=2.0, 1-f(z) = .023, for men). The
sign test analysis of Experiment 2 confirmed a small condition
difference for both men and women (z=3.8, 1-f( z) = . 0001 .for both
genders). Sign test analysis of the means in Experiments 3 and 4
both show consistently higher values in the treatment conditions
(z=3.8, 1-f(z) = .0001 , for both genders).
One may conclude, based on a comparison between the results of
the analysis of variance and the sign tests that differences
between conditions on Experiments 1 and 2 are small but consistent,
while those in Experiment 3 are relativly large and consistent and
those on Experiment 4 are small and not consistent.
24
Standard deviation
The standard deviations of the PSD values were calculated and
plotted by frequency for each condition and gender. (See figures
1-5) In the blindfold and helraet-VS conditions, the men showed
higher standard ieviations than the women over most of the
spectrum. In the environmental condition the two genders exhibited
very similiar standard deviations across the frequencies. In the
helmet and ganzfeld conditions the women varied more from each
other than did the men. The standard deviations from the different
conditions are based on different numbers of subjects. The
environmental condition standard deviation was based on 21 subjects
in each gender, the helmet-VS on 14 subjects per gender, the
blindfold, ganzfeld and helmet environment on 7 subject per gender.
Mean Graphs
Subjects were pooled by gender and condition and average
records were plotted with PSD vs log Frequency, for ease of
comparison with previous data from this lab. (Figures 6a to 10 b)
In each case, the curves approximate four linear segments between
.02 and 2.5 Hz. The slopes of the segments and the intercepts of
the segments as well as the crossover points between segments
25
change over condition and gender (Table 10). Lines were fit by eye
to these segments and dB/decade loss (or gain) as well as crossover
points were approximated for each average curve. PSD values were
read from the fitted lines for points corresponding to 0.1 Hz, 0.7
Hz. 1.4 Hz and 2.3 Hz are reported in Table (10) because they
correspond to the visual midpoint of the line segments, and they
can be used to convey a sense of the "height" of the segment. The
erages are based on different numbers of subjects. The
vironmental condition had a total of 21 subjects per gender,
while the helmet-VS condition had a total of 14 subjects per
gender, (7 from Experiment 3 and 7 from Experiment 4) and the
blindfolded, ganzfeld and helmet control conditions had 7 subjects
each.
av
en
PSD values for the men's averaged curves were greater than
those for the women's averaged curves for each condition. In
Experiment 3, however, the men's PSD values were less than the
women's averaged values. For women the lowest PSD values are found
in the ganzfeld condition across the spectrum. For women, the
highest PSD values are found in the helmet-VS condition for segment
1, and in the blindfolded and environmental conditions for segments
2 & 3i yet the PSD values for the averaged curves for these three
26
conditions are not far different,
are found in the blindfolded
segments 1, 2 and 3.
For men the highest PSD values
and helmet control conditions for
Both the crossover points from segment 2 to segment 3. and the
dB loss/decade of segment three are similar across both conditions
and genders. While the effects which occur in crossover points and
and slope, as result of these conditions, appear below 1.1 Hz, in
segments1 and 2, a shift of the height of segment three does seem
to occur in the helmet conditions .for women, and in the ganzfeld
condition, for both genders. For both men and women, the
environmental condition shows great loss in each segment and a long
first segment (refer Figures . 6A and 6B and table 10) with a
crossover point between segment 1 and segment 2 at around .165 Hz.
The ganzfeld and helmet conditions produced a shorter, less
negatively sloped segment 1 for the women with a crossover point
between segment 1 and segment 2 at about .138 Hz. The average
curves for the male subjects show a bit more variability in the
crossover points between segment 1 and segment 2, across condition,
with the longest segment 1 (after that of the environmental
condition) found in the helmet control condition (crossover at
about .156 Hz), the next longest in the ganzfeld condition
27
(crossover at about .148 Hz) and the shortest segment 1 in the
helmet-VS condition (crossover at about .135 Hz). The first
segment in the average graph for the blindfolded condition for
women is somewhat longer than the first segments of the other three
unusual condition for women (crossover at about .145 Hz), whereas
for men the first segment is somewhat shorter in comparison to the
first segments of the other average male graphs (crossover at about
.128 Hz). Since the crossover points and slope for segment 3 are
fairly consistent, differences between graphs which occur in the
first segment are reflected and amplified in the second segment.
In the ganzfeld condition, the effect is to greatly reduce the
evidence for an independent second segment. For the women
especially segments 1 and 2 could be fit fairly well to a single
line. This reduction of the presence of segment 2 in the average
graphs is also found, although to a lesser extent in the helmet
control condition for both genders. On the other hand, the
blindfold condition and helmet-VS condition for men and the
helmet-VS condition for women show evidence of an enhancement of
segment 2.
Subjective reports
.
Subjective reports were not solicited but were noted when
28
volunteered. Comments were made about both the ganzfeld and
helmet-VS conditions. Four subjects (three men and one woman )
made statements after the ganzfeld condition to the effect that
they felt hypnotised or "spaced" while wearing the goggles. One
subject said he kept seeing horizon lines fly away from him. One
subject (man) simply said "Wierd". Two subjects (one man and one
woman) in the helmet-VS condition asked if the experimentor was
moving the platform while they were wearing the helmat . One
subject (woman) said that she felt very aware of where the edges
between the bottom of the picture on the helmet and the beginning
of the bib were.
CHAPTER4
DISCUSSION
A brief synopsis of the results is : a) Significant frequency
effects are found in all experiments over the range of 0.02 to .92
Hz; b) Average records for the subjects by gender and condition can
be fit by four line segments on a PSD (dB) by log frequency (Hz)
curve, where segments 1 and 2 extend from the lowest frequencies up
to about 1.2 Hz, se^ent 3 runs from about 1.2 to about 2.1 Hz and
segment 4 runs beyond 2.1 Hz; c)Significant gender effects are
found in the anova tests of Experiments 1 and 4; d) Significant
frequency by gender effects are found in Experiments 4 and 2; e)
Relative variability between genders may depend upon stimulus
conditions., f) Condition was found to be significant in Experiment
29
30
3. but not in Experiment 4; g) Blindfolded subjects seemed to sway
more than subjects did when viewing an environmental visual scene;
h) Subjects viewing a ganzfeld stimulus seemed to sway less than
when viewing an environmental stimulus; i) The changes in the
ganzfeld condition include a shift of the third line segment (
which extends from about 1.2 Hz to about 2.1 Hz).
Frequency
In each experiment, there were significantly different PSD
values found across frequency (for both the large and restricted
range tests). Most of the power is found at the low frequencies
and drops off as frequency increases. On the PSD (in dB units) vs
log frequency curves for average records, this drop-off occurs in 3
linear segments from .02 to 2.0 Hz and power increases again in a
fourth line segment from about 2.0 to 2.5 Hz. This linear decrease
of power from low to high frequencies with a slight increase at
higher frequencies corresponds well to PSD records of other
biological motor systems (see Fig. 11, Campbell et al . , 1959).
Perhaps an examination of even higher frequencies would reveal a
second quick drop off as is found in the records of the other motor
systems. The expansion of the frequency range of observation would
require, however, an adjustment of the observation period and of
the mathmatical window used in the analysis.
31
Gender
Significant gender effects were found by the analysis of
variance tests for Experiment 4 (both large and restricted ranges),
and for Experiment 1 (restricted range). Previous studies
examining gender differences in their relation to standing
anterior-posterior sway have used either environmental or
blindfolded conditions and the gender difference found in
Experiment 1 verifies that this effect can be found in lateral sway
under these conditions as well. Significant results in Experiment
4 suggest that the genders also differ in the way they respond to
the weight of the helmet. In both cases, examination of the cell
means reveals that the men had higher PSD values in these ranges of
frequencies than the women did. When the average curves are
examined, PSD values seem to be higher for men than women over the
whole range of frequencies observed for these conditions.
Significant frequency-by-gender effects were found in Experiment 4
(restricted range tests) and Experiment 2 ( both large and
restricted range tests). This implies that a difference between
genders in lateral sway can manifest itself as a change of slope of
the line segments as well as a difference in the magnitude of
values over the entire curve. Lack of a gender effect in
32
Experiment 3 and. in fact, lower PSD values for men than women in
this experiment imply that, as is found in most studies of gender
difference, there is a great overlap of the distributions of the
values of sway for the 2 populations (Sherman. 1978).
Without a strong model of underlying mechanisms which produce
the various segments of the PSD by log frequency curves . it is
difficult to decide to what to attribute the differences between
the genders. It is possible that the difference between the
genders is due to structural or experiential differences. Previous
work in this laboratory, with blindfolded men, which fit the data
to a single exponential function demonstrated that center of
gravity accounted for about 15.8 percent of 1 parameter and 7.8
percent of another (Powell, 1981). Since men and women tend to
differ with regard to center of gravity, this factor probably
contributes to the differencies found between genders in this
study. Data on height, weight and center of gravity was taken for
the subjects in this study and examination of these factors will be
part of future research in this laboratory.
Athletes in Powell's (1981) study were found to have higher
PSD values than sedentary subjects, over the frequencies from 0.02
to 1.2 Hz (or the first two segments) and to have lower PSD values
over the frequencies higher than 1.2 Hz (segments 3 and 4). Since
33
men, in general, have had more
participate in sports than women
also contributes to the current
however, that the differences
frequencies, suggesting that the
one operating.
access to and encouragement to
,this experiental factor probably
finding. It should be noted,
between genders occurs over all
athleticism factor is not the only
norNeither the condition-by-gender interaction
condition-by- frequency-by-gender interaction were found to be
significant over the ranges tested. This indicates that at least
over the lower frequencies (.02 to 1.2 Hz), men and women respond
similarly to the visual stimuli presented. It is interesting,
however, that women seem to have lower PSD values in segment 3 in
the two helmet conditions than in the environmental condition while
men have very similiar PSD values for segment 3 across those 3
conditions. Since this higher range was founa to be a region of
disparity between athletes and sedentary types in Powell's (1981)
study, there may be an athletisim factor involved here as well.
Standard deviation and gender
Although previous studies have found men to be more variable
34
in their sway. (Nashner. 1978). this study indicates that the
relative amount o^ variability may depend upon the stimulus
conditions. Men varied much more in their sway in the blindfolded
condition over frequencies greater than about ,30 Hz. The
blindfolded condition is one which is frequently used as a baseline
condition in the study of anterior-posterior standing sway and this
study indicates that men are more variable in their lateral sway
under a blindfold as well. Men also seemed to vary a bit more than
women in the helmet-VS condition, from about .5 Hz and higher.
However, men and women sampled in this study had very similiar
standard deviations across frequencies for the environmental
condition. In fact, women sampled in this study were found to be
more variable in their sway in the helmet-control and ganzfeld
conditions than men were. The helmet-VS condition and the
environmental condition standard deviations were based on 14 and 21
subjects per gender, respectively, while the estimates from the
other conditions were only based on 7 subjects per gender.
Sampling error may be a factor in these results and further
research may resolve this question. If, however, such condition
dependent variability differences do exist between genders, we are
left again with the question of vrfiether the differences in
variability are due to experience or to structural differences.
35
Condition
MlHt condition^ Analysis of variance tests over both the
larger and restricted ranges demonstrated a significant condition
effect in experiment 3. Subjects, both women and men. swayed more
in the helmet condition. Only slight differences were found
between means and no consistent difference between PSD values for
.42 Hz in Experiment 4. This indicates that most of the difference
between conditions in Experiment 3 was due to weight of the helmet
itself and not to the visual scene. It could be that the visual
scene used in this study was too mosaic in quality (it was composed
of cut and pasted photographs) to be taken seriously by the
subjects as a visual surround. The slight differences found on the
average curves and subjective reports suggest that perhaps this
type of visual surround should be studied again with another type
of situation.
It is, however, of interest that the wearing of a helmet would
cause sway which was significantly different from that in the
environmental condition. Since the introduction of the weight of
the helmet (less than a pound and a half) to the head would only
change the overall center of gravity of the body by a few
36
centimeters, it seems more likely that the differences uncovered
were due to change in the loading of the neck muscles and changes
in the dynamics of movement of the head. From the average curves,
it seems that the addition of the weight of the helmets caused a
diminishing of the demarcation between the first and second line
segments, producing curves in which the first two segments looked
more like a single segment. A change in the dynamics of motion of
the head would change visual and vestibular input, (since those
organs are located in the head), as well as neck muscle input. The
effects of the helmet could therefore be a result of any of the
three systems or perhaps more likely, a combination of the three.
Black and white visual fields. Slight but consistant
differences were found between conditions for mean values (across
subjects) as well as individual PSD values at .42 Hz (within
subject) for Experiments 1 and 2. The slight increase in PSD
values for lateral sway caused by removal of visual cues
(blindfolded) corresponds to results found for anterior-posterior
sway, both in direction of the effects and the range over which the
effects show themselves (up to about 1.2 Hz). The decrease of sway
caused by the ganzfeld condition is, however, a suprise.
Furthermore, average PSD records of the ganzfeld condition are
37
different not only in crossover points between segments 1 and 2 and
the magnitude of PSD values of these two segments but also in the
magnitude of the PSD values of segment 3 (1.2 Hz to about 2.1 Hz).
This indicated an effect of a visual stimulus in a range above 1.2
Hz. These results raise two questions. The first question is. why
would an apparent reduction of visual cues produce lower PSD
values? The second question raised is. is the reduction of PSD
values in segment 3 under the ganzfeld condition a visual effect?
In reponse to the first question. I would like to draw upon
the subjective responses of several subjects who implied that
something like a trance state occurred under this condition. I
wonder whether there was.- in fact . a change of "state of
conciousness" which had its affect upon the subject's sway. In the
counter-intuitive nature of the results of the ganzfeld condition,
I am reminded of Powell's 1981 results which showed that athletes
in his sample swayed more than non-athletes over much of the range
of observation. Since his measurement of athleticism depended
heavily upon participation in organized sports, his athletes
probably had the kind of physical prowess that could be related to
an emphasis on strength and a certain tense readiness for action.
If a relaxed state produces less sway, perhaps a study of other
38
types of physical prowess which emphasis a "strength without
tension", such as yoga. Tai Chi. Alexander or Aikido would produce
results Which were similiar to those of the ganzfeld condition.
Likewise a study of people who meditate might show them to sway
less than other subjects, if in fact the ganzfeld truly did produce
a trance-like effect.
Response to the second question is more complicated. The
change in overall PSD values for frequencies higher than 1.2 Hz in
the helmet conditions for women can be attributed to the weight of
the helmets as opposed to a visual effect. No such attributions
can be made in the case of the ganzfeld condition. To seek the
ranges of effect of the various input systems to standing sway is
to assume a relative independence of the input, if not the output,
of these three systems. Recent neurophysiological data from many
species suggests however that the three, broad-ranging "systems"
which contribute to standing sway also inform each others neural
signals and even share neural "circuitry" in the reticular and
cerebellar regions, (Precht . 1978) . Specific frequency ranges of
effect of visual input may depend upon the type of visual
information and the level of the central nervous system which is
affected by that level of information. It is evident from the
39
results of Experiments1 and 3 that a flat-black visual field
(blindfolded) and a flat-white field (ganzfeld) produce opposite
effects on standing sway. The only information difference is at
the level of light being available or not, since neither field
includes contour, three dimensional information or movement. It
seems reasonable that a "no-light" condition could trigger a
response to seek more information from other systems, e.g.,
proprioceptive or vestibular. Sway does stimulate the
proprioceptors of the feet, muscle spindle and stretch receptors of
the legs, torso and neck, as well as stimulating the vestibular
apparatus and. under normal circumstances, the visual system
itself, through increased motion of the head. Increased sway may
be not only an output caused by a lack of information, but also
part of an active search for more information. From this
perspective, it is plausible that it is the visual message
"no-light" and not the message "no- features" which triggers a
search (more sway). From this research it seems that the visual
message "light-no-features" causes a state in which there is less
sway, less of a search for information. Whether this effect is due
to a type of hypnotic change, a simple relaxation or some effect by
which a "light-no- features" visual message causes the amplification
of signals from vestibular apparatus and proprioceptive systems,
internal to the CNS (eliminating the need for a search) is unknown.
40
It would be interesting to see if an effect similiar to that
caused by the ganzfeld could be found in a condition in which a
single hue (e.g. .blue) were presented.
The measure
As noted in the introduction, the sway platform, used as the
measuring device in these experiments, produces signals which are
directly proportional to the differential pressures applied to the
soles of the subjects' feet by their own motion. As explained
briefly in the introduction, the changes in the force applied to
the platform by the subjects feet have two components; that
imbalance of forces due to displacement of the subjects center of
gravity and the imbalance of forces caused by the subject "pushing
off" from one side to bring the body back into a vertical position.
It seems reasonable to assume that the second type of imbalance,
under normal circumstances, is somehow related to, possibly a
function of, the first. That is, we usually think of the subject's
needing to right himself when his center of gravity has gotten to a
certain angle of displacement. It may be that the second type of
41
imbalance is caused by a feedforward. as opposed to a
feedback. Signal. Such a feedfoward signal would be a function of
past experience and might be overridden, in unusual circumstances
(i.e.. unusually large angle of displacement) by a feedback signal
which would be a function of the imbalance due to displacement. In
any case since the second type of imbalance causes a change in the
first (acceleration changes the rate of displacement), the two
types of imbalance are not independant. In addition, the second
type of imbalance may be not only a righting response during
unusual conditions but an information gathering response as well.
These two types of imbalance of forces cause two components of the
voltage output of the platform. The ratio of these contributing
voltages changes over frequency. At 0.2 Hz. the voltage due to
acceleration is only about .16 times that due to displacement,
whereas at 1.0 Hz. voltage change due to acceleration is about
four times that caused by displacement (Scott and Dzendolet. 1972).
The visual effects may particularly affect the portion of the
signal due to acceleration, since this is a control type of signal.
As stated above, though, a change in one type of imbalance will
affect the other type as well. What we have then is a complex
relationship between two type of forces on the platform, each of
which could be responding, for various reasons, to visual
information, and this relationship changes over frequency. The
42
line segments found in this study, if in fact they do exist, are
some function of the relationship between these two types of
imbalance and the differences between conditions and between
genders, visible via these line segments, are a result of
alterations of that function. It would certainly be helpful if a
model of this function could be developed. The data presented here
should be of interest to modelers wishing to model standing sway
and achieve at least replicative validity (Zeigler. 1976).
Concl usion
In conclusion, it seems from the results of this study that
the ranges of effect of visual conditions, the relative standard
deviations of the two genders, as well as the crossover points of
the hypothesised line segments and the value of the PSDs of those
line segments are complexly dependent upon the type of visual
information presented. This research raises as many questions as
it poses answers about the relationship between the three systems
thought to control standing sway ( the proprioceptive, vastibular
and visual). It raises questions as well about the relationship
between the two types of imbalance, acceleration and displacement,
which are measured by the sway platform.
CHAPTERS
FUTURE RESEARCH
Future exploration into standing sway using the sway platform
and PSD analysis could expand along any of the following four
dimensions: the design (eg. which conditions are compared), the
stimulus used, the measure, and the subject population
investigated. Of course many thousands of combinations and
permutations of changes in these dimensions exist. This chapter
will focus on those combinations which occured to me in the course
of running the current experiment.
^3
44
The desi gn
Neither the blindfolded and ganzfeld conditions, nor the
helmet environment and the environment condition, were made
directly comparable (eg. measured within subject) by the design of
the current study. Keeping all other variables constant, the
stimuli used in this experiment could be further investigated by
comparing the conditions which would isolate the variables of black
vs white and helmet vs no-helmet. In both cases there is evidence
from the current study which indicates that the differences found
could be significant.
The discovery of line segments in the average records of
subjects in this study, indicates that a regression analysis may
provide more information than the ANOVA about the data gathered.
With a regression analysis , the question of whether one second
order function or four linear first order functions, fit the data
best, could be resolved. The gathering of data on more subjects of
both genders under each condition would be necessary for such an
analysis
.
45
The stimulus
My suggestions for stimuli to use in future studies fall into
two catagories: sensory (visual/mechanical) and psychological
(emotional/persuasive)
.
The first catagory is more obviously an outgrowth of the
present study and is ripe with possibility. The effects of static
presentation of patterns of black and white (beyond stripes) or
other colors, shapes (2-d or 3-d) or single hue fields could be
explored. For instance, what effect would the presentation of a
visual illusion have on sway records? As an addition to the level
of complexity of the stimulus, patterns of motion ( eg. circular
,
sinusiodal or translational) -could be added to any of the stimuli
studied in the static case to discover something about the
interconnection between the sway response to color, light intensity
and shape information and the response to motion of the stimulus.
It would be especially interesting to look for the relation between
the movement of the stimulus and the dynamics of motion of the
subject as measured by the sway platform. Other sorts of sensory
stimuli which could be investigated either in conjunction with the
visual stimuli or alone are: 1) foam under the feet which would
alter the feedback from the proprioceptors on the bottom of the
46
feet b.t not the joint receptors and 2) imraobUlzation of either or
both the ankles or knees of the subject which would affect the
Joint receptors and relative body part dynamics but not the
sensitivity of the receptors on the bottom of the feet. Study of
these variables Is necessary to discern the contribution of each of
these sensory sources to the overall standing equilibrium system
response
.
The second, more psychological, catagory of stimuli is
relatively unstudied with regard to effects on standing sway. The
internal psychological state of the subject is of course related to
blood chemistry and therefore muscle tone and readiness, which
affect sway in the present, but perhaps more interesting is the
relation of mood, and expectation to the state transition function
for various conditions. Stimuli which would produce an emotional
state in the subject such as pictures, stories, or experimenter
demeanor (eg. authoritarian vs nurturative) could be
systematically studied with regard to their affect on sway records.
Even without the introduction of evocative stimulus, a simple mood
measure questionairre could be included in the course of
investigation of other variables, the way a measure of athleticism
is currently taken for each subject. Experimentor expectations and
17
parsuaalveness could also use so^e attention as stimuli which could
be relevant to the simplest sway study. Evidence Is already
available In this lab which Indicates that the sway measure is
sensitive to changes caused by instructional set. What differences
exist between a situation where the subject reads the Instructions
and one where the experimenter reads the instructions? Should
instructions be videotaped to provide conslstancy?
The measure
Several different kinds of expansions could be made in the
measurement dimension. For instance, a relatively simple change
would be to expand the range of frequencies measured and analysed
in order to see if the second drop off of Power found in the high
frequency range of PSD records of other muscles can be found in the
sway records. A great boon to understanding contributions to
lateral standing sway could be made if this measure was used in
conjunction with other measures, for instance; an anterior measure
of sway, some measure of neural signals or muscular action (such as
EMG) or measures of the dynamics of body part motion.
Combination and comparison of the lateral and
anterior-posterior sway records could give some indication about
48
whether certian conditions affect sway in these two Him •^»ay ill tnese two dimensions
differentially .3 well as give a S-di.ensional picture of the
dynamics Of motion of the pressure on the bottom of the feet under
"normal" conditions.
Other external sway or motion detectors which could be
combined with the sway platform include records from either
mechanical or electrical styluses attached to various parts of the
body, (eg. trunk. legs or head). The point of this sort of measure
would be to get a picture of the motion of the body parts in
relation to each other and to overall sway as measured by the
platform (by implication therefore, the relation to the presure
stimulating the feet receptors)
In addition to these measures of the external state of the
body during standing sway, the sway records could also be combined
and correlated to measures of internal state of the subject,
whether at the level of muscular action, such as EMG recordings, or
at the level of psychlogical state, such as subjective reports.
EMG data could be recorded for muscles of the legs, trunk or neck
of the subject. Such recording in combination with the sway
platform would shed some light on the pattern of muscular activity
which plays itself out during standing sway and the relation of
49
that pattern to the pattern of sway behavior externally measurable.At the level of individual muscle groups a system description ofthe standing sway situation could then be attempted.
The second type of internal measure which I suggest using in
combination with the sway platform is subjective report. This
could take the form of a mood questionairre . as suggested in the
previous section, or a structured interview. Subjective reports
gathered informally in the study described in this paper were
helpful in understanding the unexpected decrease in sway in the
ganzfeld condition. Expectations of. and the assignment of meaning
by, the subject to various variables of the experimental situation
are important factors to have some knowledge of. since they
probably affect the subjects response. Furthermore, as was seen in
this study, subjective reports can provide information (such as
similarity to other experiences) about the experimental situation
which would be difficult to access any other way.
The subjects
Many features of the subject population could differentially
affect sway under various conditions including: age, gender, general
morphology, biorhythms, experience and health. Some aspects of
50
gender. morphology, biorhythms (primarily menstral cycles in
women), and health (in the form Of pathology) have already been
studied and these studies could be expanded . Work on biorhythms
could be expanded to involve male subjects to see whether their
reported higher variability over the course of the month can be
seen to follow any pattern. Likewise, thus far only severe mental
or physical pathology have been studied as health variables. The
well known effects of such health states as the comman cold on
muscle fatigue and overall dizziness has not promted much research
on effects of such minor illness, nor conditions such as depression
or allergies, on sway patterns.
Developmental effects on standing sway offer a rich source of
future research ideas. One might suspect that sway under normal
stimulus conditions would change with development and aging of the
subject. In addition such changes may occur differently for
different subject populations, eg. males and females, or during
different stimulus conditions. For instance, one gender may not
change much over time with regard to their response to sway v^ile
blindfolded, whereas the other gender may show change.
Some work on the effects of subject experience, in the form of
51
sports experience, been done in this lab . (Powell. 1981 ) . There
are many other aspects of experience Which could be investigated.
Individual experience in the form of participation in dance of
various kinds, TAX CHI or related martial arts, or job related
movement experience, such as high steel construction work or highly
repetative manual labor, can be seen as analogous to sports
activity in that certian patterns of functional relationship
between sensory input and motor output are formed and strengthened
by practice. Such relationships may manifest themselves in
characteristic sway under some conditions. Along the same lines,
the presence of culture specific movement patterns is clear to
anyone who has tryed to master the dance form of another culture.
Families seem to mimic this effect on a smaller scale by having a
sort of formal signature of movement patterns. We hold our hands
just like our mothers did or shake our heads when we laugh just
like our father or grandfather. These patterns may be learned or
may be passed on genetically via genetic transmission of morphology
and therefore relations between certian muscle groups (such as long
legs and a short waist which would favor a certian type of stride).
Chances are good that such differences are transmitted via some
combination of both routes, and of course, psychology's favorite
population for answering such questions, identical twins reared
together or apart, could be used to study this. In any case, do
52
c
such .otor pattern tendencies reveal themselves In oharacterlstlsway patterns? Only research with such specific subject groupWill tell.
Model inR
The sway platform and PSD analysis result in a record of the
relationship of power to frequency of a subjects sway. Variables
which may either shape that function or change the shape of that
function fall into three catagories; biochemical, structural, and
experiential. Biochemical variables which might figure into a
model of systems which impact upon the subjects sway are: hormone
level, fatigue, drugs, metabolism, allergies, etc. Variables of
importance at the structural level are: morphology (ratios of the
lengths, widths and depth of muscles, bones and ligiments)
.
parameters and transfer functions of all the neural pathways
involved in all the sensory and motor systems which impact upon the
subjects sway, stance of the subject upon the platform, or
structural history (broken bones, sprained muscles, disease, or
nerve pinches). The experiential variables which may be of
importance are: historical experience (family and cultural movement
pattern, individual movement history, history in experimental
situations, or training). present experience (experimental
conditions, self image of health, mood, interpretation of
53
experimenter expectations, or seriousness about the study), and
experience of the future (expectations, developmental predictionsor state of degenerative desease known to the subject. or
interpretation of future benifit attached to study). Models
proposed to explain the interconnection and relative Importance of
these variables could be tested via a multiple regression upon the
curves found in subjects records.
54
REFERENCES
"len. B.. (,982). Unpublished Dissertation. University of
Massachusetts.
Andre-Thomas. (1940): Equilibre et equilibration. Paris: Massion.
Begbie. G. H.. (1966): The effects of alcohol and of varying
amounts of visual information on a balancing test. Ergonomics. 9.
325-333.
Brandt. Th. and Dichgans. J.. (1972): Circularvection optishe
Pseudocoriolis-Effekte unter optokinetischen Nachnystagnus
.
Albrecht y Graefes Arch. Klin. Exp. Opthal. . 184. 42-57.
ionBrandt, Th.. Dirner
, H,H., and Dichgans, J., (1975): Mot
sickness induced through angular oscillations of the body and the
visual surround in normals and after labyrintine lesions. XXII
International Congress of Aviation and Space Medicine, Acapulco,
Mexico.
Dichgans. J. and Brandt. T. . (1974): The psychophysics of visually
induced perception of self motion and tilt. In; The neurosciences
:
Third Study Program. Schmitt. F. , 0., and Worden, F.
.
editors-in-chief. Cambridge. Mass: MIT Press, 123-129.
Frequency by Gender 19 .49 9 2. 16 .96 .4745Error 242 .83 108 2. 24
Condition by Frequency " 30 . 12 9 3. 34 3.00 .0032 *
Cond. by Freq. by Gend
.
! 9 .12 9 1. 01 .91 .52
Error 120 .671
1
1081
1
1. 111 1
1
62
Table 4
Analysis of Variance Experiment 4Summary Table io points
(.02-.92HZ)
1
1
1
1
1 Sum of1
1 SquaresI
DF1
1
1
MS1 F
1 Tail
Gender
Error
1
433.161004.36
1
1
12
j
433.16
83.695.18
j
.042 *
ConditionCond . by Gender
Error
8.242.21
1
1
8.242.21
.17
.05
.68
.83
FrequencyFrequency by Gender
Error
2839.5764.05
9
9
315.507.11
93.962. 12
.0000 »
.033 *
Condition by FrequencyCond. by Freq. by Gend
.
Error
28.04
4.97
127.571
1
9
9
108
j
3.11
.55
1.181
1
2.64
.47
.0084 *
.89
1
1
I
63
Table 5
Analysis of Variance.
Summary Table "periment 1
9 points
(.12-.44HZ)
• I Sum of
Squares| i !
^> Tail
! Prob
Gender, ,
Error 315.52600.25 IP c:n r.i
^'^^ -027 *
Condition ,'
Cond by Gender W"^^'^^
Erro rI
I I
I I
Frequency, ,
Frequency by Gender i"- ^"^^o^Error
I I
I I
Condition by Frequency i; ,„Cond by Freq. by Gend\ '06 , 'T
DF1
1
1
MS
1
1 315.5212 50.02
1 40.441 1.52
12 21.34
8 33.828 .24
96 1.90
8 .418 .53
96 .52
256.17 12 J, '^^ -79
1.93 8 OH^^-"^^ -0000
182.59 96 i'nn•'•3 -99
64
Table 6
Analysis of VarianceSummary Table
Experiment 2
9 points
(.12-.44HZ)
Gender
Error
ConditionCond by Gender
Error
FrequencyFrequency by Gender
Error
Condition by FrequencyCond. by Freq. by Gend
.
Error
Sum of1 DF
1 MSSquares
|
1
1
1
12.79
1
1
1 12.792787. 13 12 232.26
49.91 1 49.915.25 1 5.25
332.56 12 27.71
315.23 8 39.404.47 8 .55
30.65 96 .31
1.21 8 .152.48 8 • 31
24.72 96 .25
Tail
Prob
.06 .81
1.80
.19
123.41
1.75
.591.21
.20
.67
.0000 »
.09 *
.78
.30
65
Table 7
Analysis of VarianceSummary Table
Experiment 39 points
(.12-.44HZ)
I ! Sum ofI
' SquaresDF MS
! Tail! Prob
Gender
Error
ConditionCond by Gender
Error
FrequencyFrequency by Gender
Error
Condition by FrequencyCond
. by Freq. by Gend
.
Error
32.89 1 32.89825.29 12 68.77
108.90 1 108.903.51 1 3.51
66.58 12 5.54
206.74 8 25.84.17 8 .02
77.47 96 .80
9.34 8 1. 16.72 8 .09
28.31 96 .29
.48 .50
19.63 .0008 *
.63 .44
32.02 .0000 *
.03 1.0
3.96 .0004 »
.31 .96
66
Table 8
Analysis of VarianceSummary Table
Experiment 4
9 points
(.12-.44HZ)
Sura of
SquaresDF MS Tail
Prob
Gender
Error
ConditionCond by Gender
Error
FrequencyFrequency by Gender
Error
Condition by FrequencyCond . by Freq . by Gend
.
Error
341.32 1 341.32888.48 12 74.04
27.02 1 27.022.42 1 2.42
347. 39 12 28.95
264. 19 8 33.0210.55 8 1.3194.37 96 .98
.6.09 8 .766.42 8 .80
44.73 96 .46
4.61 .05 *
.93 .35
.08 .77
33.60 .0000 »
1.39 .2320
1.63 .12531 . 72 . 1 02
67
Table 9 Comparison of Average Graphs
!Helmet-Cntl iHelraet-VS1 Ganzfe Id 1 Blindfolded 1 Environment
FEMALES
-Seg 1
—PSD .1Hz db—loss db/dec—cross over
-Seg 2
—PSD .7Hz db—loss db/dec—cross over
3.86.5
.165
-1.616
1.2
3.74.5
. 145
-1.4
10
1. 15
2.6
5
.138
-3
9
1.1
4.24.5
.138
-1.7
13
1. 15
2.54
.135
-2.510.5
1.1
-Seg 3
—PSD 1.4 Hz
—loss
—cross over
-7.540
2.0
-7.840
2.05
-9
38
2.0
-8.540
2.0
-8.5
382.
1
-Seg 4
—PSD 2.3 Hz i-13.5— gain I 25
-13.530
-14
26-13.5
37
-14.224
MALES
-Seg 1
—PSD .1 Hz
—loss—cross over
4.8
7.5.165
6.1
4.5.128
4.5
6.6.148 .135
5.76.3.156
-Seg 2
—PSD .7 Hz
—loss—cross over
-1
15.51.25
-.6
12
1. 15
-2.8
14.5
1.2
-1
12
1.25
-1
8.5
1.05
-Seg 3
—PSD 1.4 Hz
—loss—cross over
-6.8
392.
1
-6.5
39
2.
1
-9.1
392.
1
-6.5
372.04
-6.542
2.04
-Seg 4
—PSD 2.3 Hz 1-12.5
— gain db/dec 1 36
-12.2
36
-15
32
-12.6
27
-12.5
26
68
Table 10
Summary of Sign-Tests
Where z = ( |P-pl - 1 /2N ) / SQRT( pq/N )
P(z) - Portion of the distribution beyond z
Test 1 ( on PSD values between conditonsfor all subjects at .42 Hz. )
Exp! z
1P(z)
! Significant?
1 I 1 .8 .036 Yes2 I 1. 8 .036 Yes3 ! 1 .8 .036 Yes4 I .26 .397 No
Test 2 ( between conditions for records averagedover Gender at nine frequencies. )
Gender Female 1
1 Male
Exp! z
1 P(z)1 Signif.?
1 1 z1
P(z)! Signif.?
1 ! 3.8 .0001 Yes 1 1 2.0 .023 Yes2
1 3.8 .0001 YesI ! 3.8 .0001 Yes
3 I 3.8 .0001 Yesi 1 3.8 .0001 Yes
41 3.8 .0001 Yes
1 ! 3.8 .0001 Yes
Z)
69
Figure 1: Standard deviation vs ' frequency is plotted for both
genders in the environmental condition (21 females and 21 males) on
a linear scale. Standard deviation varies between about 2.0 and
2.3 dB for both genders.
70
• o•0
0 _
NX
uc
o• II
cII Dc Ea; o:^
o •
«o*
3 •
0QCM
ca;
co
>c
• 0• o»0 •o <
0o «
o •o_ •
• e
o •
0 •
ocap) Aaa pjppup)5 CM
71
Figure 2: Standard deviation is plotted here for both genders (7
males and 7 females) in the blindfolded condition. From about .3
to about 2.5 Hz the standard deviations of the males sampled in
this condition, are higher than those of females.
72
73
rigur. 3: standard deviation vs frequency la plotted for bothrenders (7 ™ales and 7 fe^alea) In the gan.feld condition. Thestandard deviations for the fe.ale. sampled in this conditionhigher than those for ™ales. over ™ost of the frequencies.
are
74
• oII II
c c
Eo
• o• o
• o• 0• o
• 0
0o
»
2a;
NCnU
oao
oo
o0
oo
o •
NI>^uC<V
3
inTsr ST
(ap) a so
75
Figure 4: Standard deviation vs frequency is plotted for both
gender in the helmet-control condition. Standard deviations are
higher for the females sampled in this condition (7 males and 7
females) than those of the males over the range of. 02 to about 1.3
76
77
Figure 5: Standard deviation vs frequency is plotted for both
genders in the helmet-VS condition (7 females and 7 males ).
Standard deviation is higher for males than females for frequencies
.5 to 2.5 Hz.
78
>
•OJ
_£(V
±1
c•OJ
Eo
cOJ
NI
uc
Q-
qcvi
Q w (gpj ascvi
79
Figure 6A: This graph represents a PSD vs Frequency record (plotted
on a log-linear scale) averaged over the records of the 21 female
subjects in the environmental visual condition. Note the
relatively long first segnent, with a crossover point between
segnent 1 and segment 2, at about .165.
80
CDEco
>c
c
Eo
NX>uca;
o-a;
Q
/
/.•••
If
<1
6(ap) asd
81
Figure 6B: This graph represents a PSD vs Frequency record (plotted
on a log-linear scale) averaged over the records of the 21 male
subjects in the environmental visual condition. Overall PSD values
are higher than those of the averaged record for females in this
condition. As was the case with the records for females in this
condition, the first segment is long compared to that of other
conditions
.
82
/.
/:
in in
(ap) asdoV
U)
I
uc
cr Na; X
CO
U
83
Figure 7A: A PSD vs Frequency record (plotted on a log-linear
scale) averaged over the records of the 7 female subjects in the
blindfolded condition. Overall PSD values corresponding to
frequencies from about .10 to 1.2 are higher here than in the
environmental condition.
84
"D
/
/.•
/:
/
:
/
/
/ .
NX>-uc<u
cr
<
U
U)
rap) asdo
85
Figure 7B: This is . a PSD vs Frequency record (plotted on a log
linear scale) averaged over the records of the 7 male subjects in
the blindfolded condition. PSD values are higher over the entire
record than those of the females in this condition.
86
NX
NC
U
c
Eo
>uc0)
a;
CM
/
/
<00
U
vo o «o
(gpiasd '
in
87
Figure 8A: A PSD vs Frequency (plotted on a log-linear scale)
record averaged over the records of the 7 female subject in the
ganzfeld condition. PSD values are the lowest in this condition.
Also the distinction between segnent 1 and segnent 2 is harder to
distinguish here than in the environmental condition.
88
0)
ac
NX>-uc
CJ
in
'c«i
/
I.'
CO
U
-Lo
(gp) asd
89
Figure 8B: A PSD vs Frequency (plotted on a log-linear scale)
record averaged over the records of the 7 males in the ganzfeld
condition. Although PSD values are somewhat higher for males than
females in this condition, this is the record with the lowest
values for the males. As with the record for females in this
condition, the distinction between segment 1 and segment 2 is
reduced.
90
3.
c
U
c01
NX>.ucO)
qCM
//
/.
/
//
COCO
in o(ap) asd '
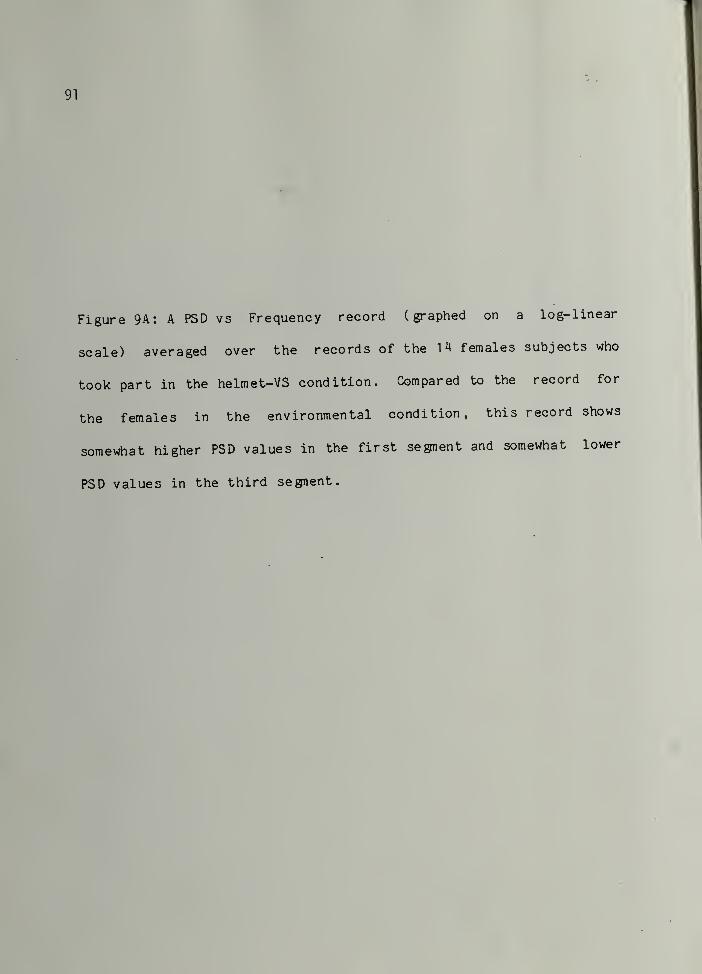
91
Figure 9A: A PSD vs Frequency record (graphed on a log-linear
scale) averaged over the records of the 14 females subjects who
took part in the helmet-VS condition. Compared to the record for
the females in the environmental condition, this record shows
somewhat higher PSD values in the first segnent and somewhat lower
PSD values in the third segnent.
92
E
X
C
Eo
N
uc
'Z!
rr
o
"A
I
I :
I:'
I.''
<
(J
in o u)
Cap) asd '
in
93
Figure 9B: A PSD vs Frequency record (plotted on a log-linear
scale) averaged over records from the 14 males who experienced the
helmet-VS condition. As with the females records, the PSD values
in this record seem higher in the first segnent and lower in the
third seginent, when compared to those of the environmental
condition.
94
NX
c
8"
E
X o
/
/
I :
If
/.'
/ •
/
/
/
/•
cc
m o »n
(ap) asd
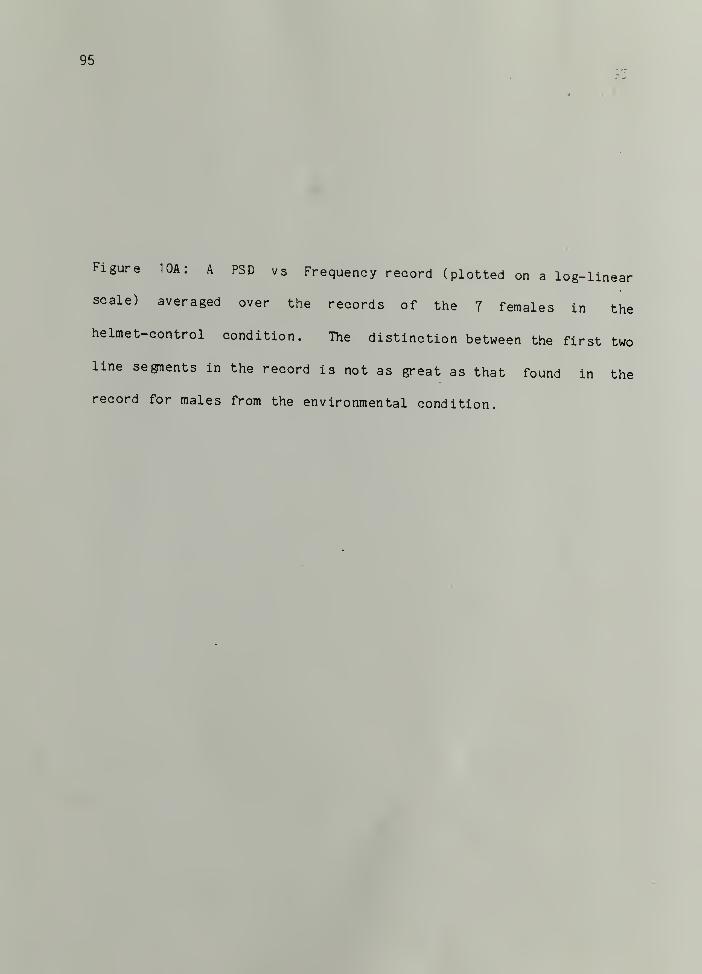
95
Figure 10A: A PSD vs Frequency record (plotted on a log-linear
scale) averaged over the records of the 7 females in the
helmet-control condition. The distinction between the first two
line segnents in the record is not as great as that found in the
record for males from the environmental condition.
96
in o(a p) a sd
97
Figure 10B: A PSD vs Frequency record (plotted on a log linear
scale) averaged over the records of 7 males from the helmet-control
condition. As was true for the females records, the distinction
between the first two segments in this record is not as great as
that of the record for males in the environmental condition.
98
c
E
•E
a;
X
NXuca;
!T
O
COO
in o m(ap) asd
'
in
99
Figure 11: PSD vs frequency records for several motor control