56
Effects of urbanization on incidence of noncommunicable diseases Community-Based Initiatives Series 16
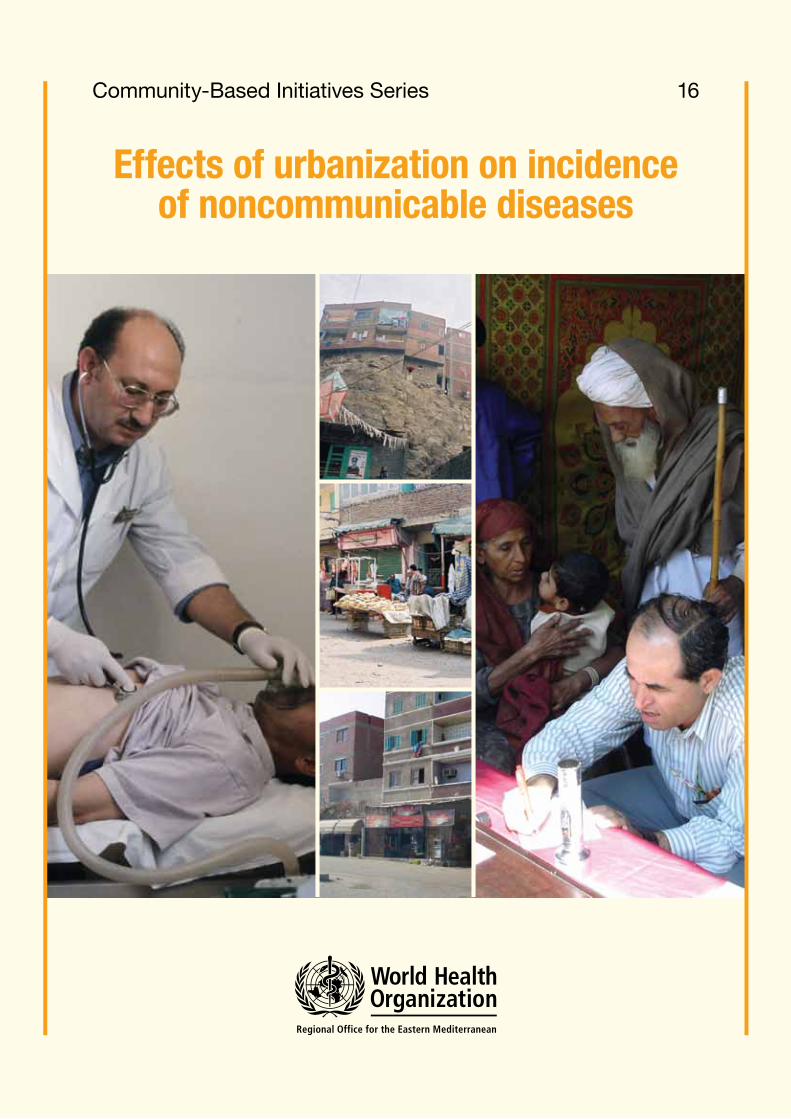
Effects of urbanization on incidenceof noncommunicable diseases
Community-Based Initiatives Series 16

Effects of urbanization on incidenceof noncommunicable diseases
Community-Based Initiatives Series 16
© World Health Organization 2012
All rights reserved.
The designations employed and the presentation of the material in this publication do not imply the expression of any opinion whatsoever on the part of the World Health Organization concerning the legal status of any country, territory, city or area or of its authorities, or concerning the delimitation of its frontiers or boundaries. Dotted lines on maps represent approximate border lines for which there may not yet be full agreement.
The mention of specific companies or of certain manufacturers’ products does not imply that they are endorsed or recommended by the World Health Organization in preference to others of a similar nature that are not mentioned. Errors and omissions excepted, the names of proprietary products are distinguished by initial capital letters.
All reasonable precautions have been taken by the World Health Organization to verify the information contained in this publication. However, the published material is being distributed without warranty of any kind, either expressed or implied. The responsibility for the interpretation and use of the material lies with the reader. In no event shall the World Health Organization be liable for damages arising from its use.
Publications of the World Health Organization can be obtained from Distribution and Sales, World Health Organization, Regional Office for the Eastern Mediterranean, PO Box 7608, Nasr City, Cairo 11371, Egypt (tel: +202 2670 2535, fax: +202 2670 2492; email: [email protected]). Requests for permission to reproduce, in part or in whole, or to translate publications of WHO Regional Office for the Eastern Mediterranean – whether for sale or for noncommercial distribution – should be addressed to WHO Regional Office for the Eastern Mediterranean, at the above address: email: [email protected] .
Design and layout by Pulp Pictures
Printed by Integrity Corp, Cairo
WHO Library Cataloguing in Publication Data
World Health Organization. Regional Office for the Eastern MediterraneanGood practices in delivery of primary health care in urban settings / World Health Organization.Regional Office for the Eastern Mediterraneanp. (Community-Based Initiative Series; 15)ISBN: 978-92-9021-855-5ISBN: 978-92-9021-856-2 (online)1. Delivery of Health Care 2. Urban Health – Iran - Oman 3. Primary Health Care 4. Urbanization5. Refugees - Palestine I. Title II. Regional Office for the Eastern Mediterranean III. Series
(NLM Classification: WA 395)
Community-Based Initiatives
Contents
Preface .................................................................................................................................................................................................................................................
Acknowledgements ....................................................................................................................................................................................................
Executive Summary ...................................................................................................................................................................................................
Egypt .......................................................................................................................................................................................................................................................
Introduction .............................................................................................................................................................................................................................
Literature review ................................................................................................................................................................................................................
Methodology ...........................................................................................................................................................................................................................
Results ............................................................................................................................................................................................................................................
Discussion ..................................................................................................................................................................................................................................
Conclusion .................................................................................................................................................................................................................................
References ................................................................................................................................................................................................................................
Islamic Republic of Iran .....................................................................................................................................................................................
Introduction ..............................................................................................................................................................................................................................
Literature review .................................................................................................................................................................................................................
Methodology ...........................................................................................................................................................................................................................
Results ............................................................................................................................................................................................................................................
Discussion ..................................................................................................................................................................................................................................
Conclusion .................................................................................................................................................................................................................................
Acknowledgement ..........................................................................................................................................................................................................
References ................................................................................................................................................................................................................................
Pakistan .............................................................................................................................................................................................................................................
Introduction ..............................................................................................................................................................................................................................
Methodology ...........................................................................................................................................................................................................................
Results ............................................................................................................................................................................................................................................
Discussion ..................................................................................................................................................................................................................................
Acknowledgement ..........................................................................................................................................................................................................
References ................................................................................................................................................................................................................................
5679
1111131519212123252527293436363639414143485050

5Community-Based Initiatives
Preface
Evidence about the prevalence of noncommunicable diseases and related risk factors has been widely documented. However, the effects of rapid urbanization on lifestyles and the consequent noncommunicable disease outcomes are rarely documented, particularly in the Eastern Mediterranean Region. The relationship between cities and health was an early consideration of public health, but the impact of local government policies on health gained prominence with the WHO-sponsored Healthy Cities Programme, starting in the mid-1980s. More recently, within the work of the Commission on Social Determinants and Health established by WHO, the Knowledge Network on Urban Settings extensively reviewed the relationship between health and urbanization.
There are numerous behavioural, environmental and social risk factors for noncommunicable diseases. The WHO STEPwise surveillance project has shown that most noncommunicable disease conditions are attributable to unhealthy diet, physical inactivity and smoking. WHO Regional Office for the Eastern Mediterranean commissioned studies in the megacities of Cairo, Karachi and Isfahan to look in detail at these three risk factors and their significance for noncommunicable diseases in urban settings. The studies focused on the effect of urbanization on lifestyle, on identifying policies, programmes and interventions that can promote healthy lifestyle in urban areas, and on identifying steps that can be taken to reduce community exposure to these risk factors. This publication provides evidence that can support policy-makers and decision-makers in allocating additional resources to improving healthy lifestyle choices in urban areas.


6
Acknowledgements
This publication was prepared by WHO Regional Office for the Eastern Mediterranean. The project was conceptualized and coordinated by a regional task force composed of Mohamed Assai, Ibtihal Fadhil and Jaffar Hussein, regional advisers for community-based initiatives, noncommunicable diseases and healthy lifestyles, respectively.
Taking the concept paper prepared by the task force into consideration, a study was designed to look at the effect of urbanization and healthy lifestyles on the prevalence of noncommunicable diseases in Cairo, Egypt, Isfahan, Islamic Republic of Iran, and Karachi, Pakistan. Ibtihal Fadhil and Jaffar Hussein also contributed to the design and technical review of these case studies.
The following experts conducted the studies: Mohsen Gadalla, Community Medicine Department, Ain Shams University, Egypt; Alireza Moghisi, Deputy Director-General, Centre for Disease Management on Noncommunicable Disease, Ministry of Health and Medical Education, Islamic Republic of Iran, and Huma Qureshi, Executive Director, Pakistan Medical Research Council. Technical input and final review of the three case studies was provided by Samar Elfeky, WHO Regional Office for the Eastern Mediterranean and Riikka Rantala, WHO Centre for Health Development, Kobe, Japan. Funding for the project was provided by the WHO Centre for Health Development, Kobe, Japan. The support of Jakob Kumaresan, former Director of the WHO Centre for Health Development, Kobe, Japan, is gratefully acknowledged.

Community-Based Initiatives 7
Executive summary
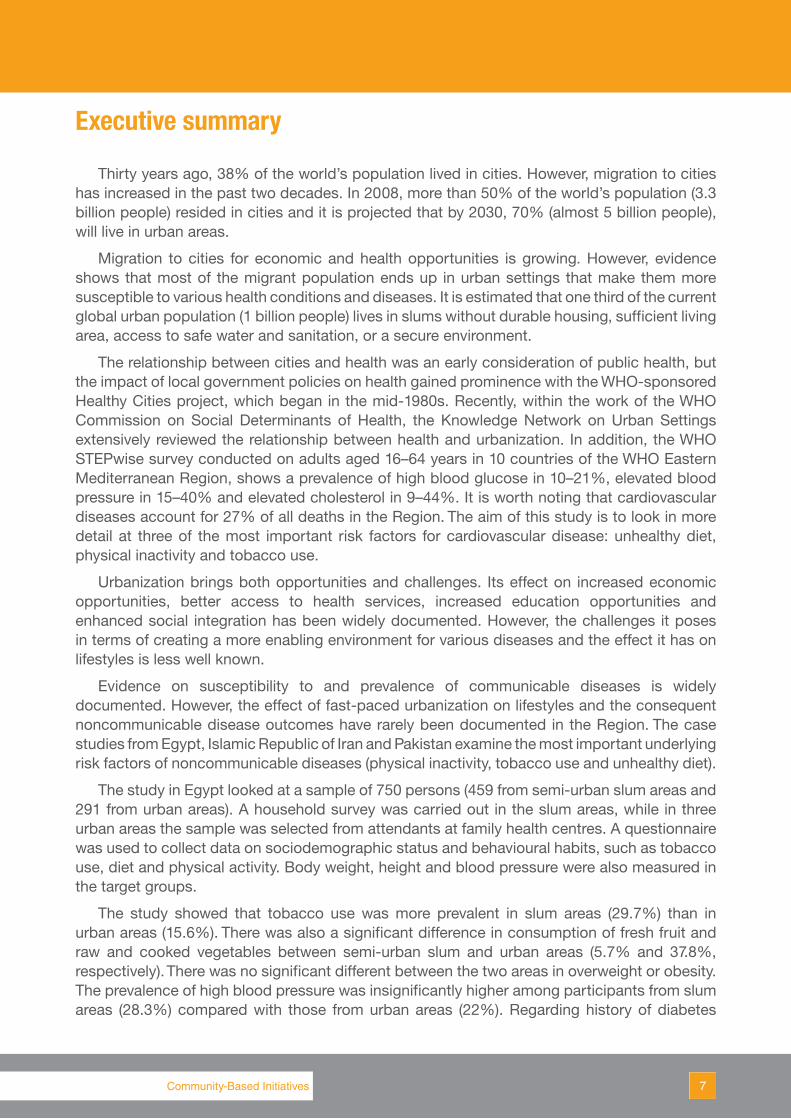
Thirty years ago, 38% of the world’s population lived in cities. However, migration to cities has increased in the past two decades. In 2008, more than 50% of the world’s population (3.3 billion people) resided in cities and it is projected that by 2030, 70% (almost 5 billion people), will live in urban areas.
Migration to cities for economic and health opportunities is growing. However, evidence shows that most of the migrant population ends up in urban settings that make them more susceptible to various health conditions and diseases. It is estimated that one third of the current global urban population (1 billion people) lives in slums without durable housing, sufficient living area, access to safe water and sanitation, or a secure environment.
The relationship between cities and health was an early consideration of public health, but the impact of local government policies on health gained prominence with the WHO-sponsored Healthy Cities project, which began in the mid-1980s. Recently, within the work of the WHO Commission on Social Determinants of Health, the Knowledge Network on Urban Settings extensively reviewed the relationship between health and urbanization. In addition, the WHO STEPwise survey conducted on adults aged 16–64 years in 10 countries of the WHO Eastern Mediterranean Region, shows a prevalence of high blood glucose in 10–21%, elevated blood pressure in 15–40% and elevated cholesterol in 9–44%. It is worth noting that cardiovascular diseases account for 27% of all deaths in the Region. The aim of this study is to look in more detail at three of the most important risk factors for cardiovascular disease: unhealthy diet, physical inactivity and tobacco use.
Urbanization brings both opportunities and challenges. Its effect on increased economic opportunities, better access to health services, increased education opportunities and enhanced social integration has been widely documented. However, the challenges it poses in terms of creating a more enabling environment for various diseases and the effect it has on lifestyles is less well known.
Evidence on susceptibility to and prevalence of communicable diseases is widely documented. However, the effect of fast-paced urbanization on lifestyles and the consequent noncommunicable disease outcomes have rarely been documented in the Region. The case studies from Egypt, Islamic Republic of Iran and Pakistan examine the most important underlying risk factors of noncommunicable diseases (physical inactivity, tobacco use and unhealthy diet).
The study in Egypt looked at a sample of 750 persons (459 from semi-urban slum areas and 291 from urban areas). A household survey was carried out in the slum areas, while in three urban areas the sample was selected from attendants at family health centres. A questionnaire was used to collect data on sociodemographic status and behavioural habits, such as tobacco use, diet and physical activity. Body weight, height and blood pressure were also measured in the target groups.
The study showed that tobacco use was more prevalent in slum areas (29.7%) than in urban areas (15.6%). There was also a significant difference in consumption of fresh fruit and raw and cooked vegetables between semi-urban slum and urban areas (5.7% and 37.8%, respectively). There was no significant different between the two areas in overweight or obesity. The prevalence of high blood pressure was insignificantly higher among participants from slum areas (28.3%) compared with those from urban areas (22%). Regarding history of diabetes
8
Effects of urbanization on incidence of noncommunicable diseases
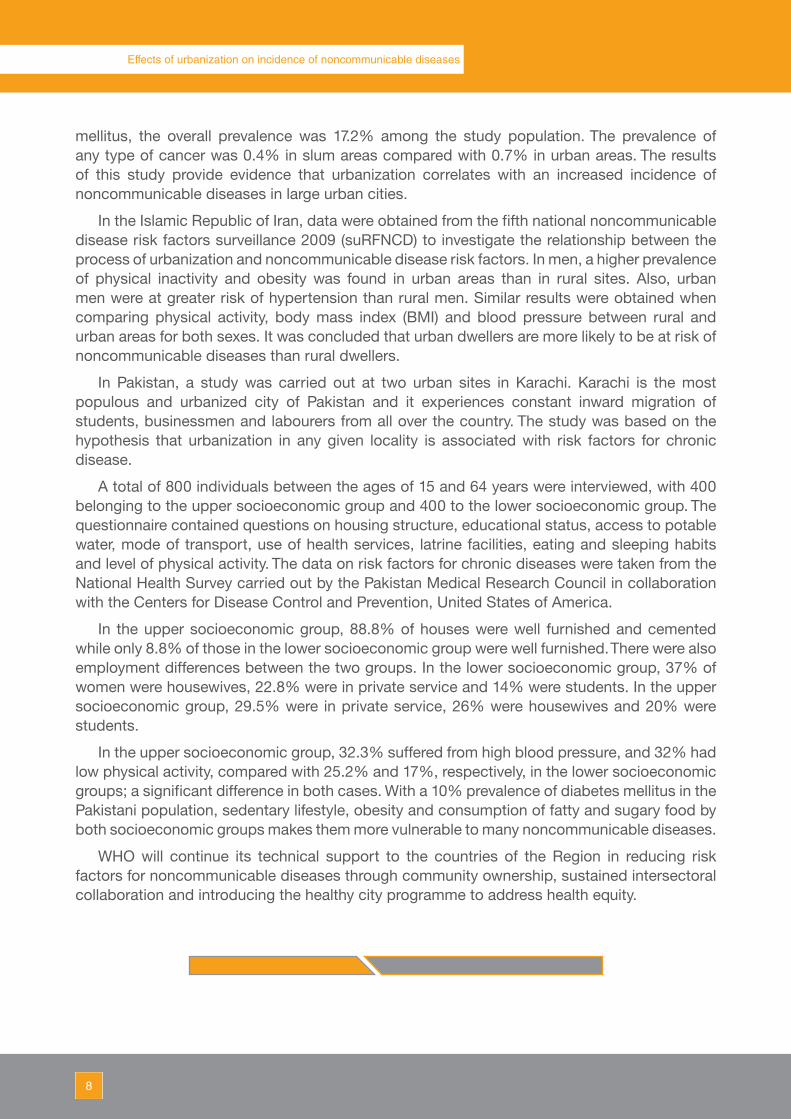
mellitus, the overall prevalence was 17.2% among the study population. The prevalence of any type of cancer was 0.4% in slum areas compared with 0.7% in urban areas. The results of this study provide evidence that urbanization correlates with an increased incidence of noncommunicable diseases in large urban cities.
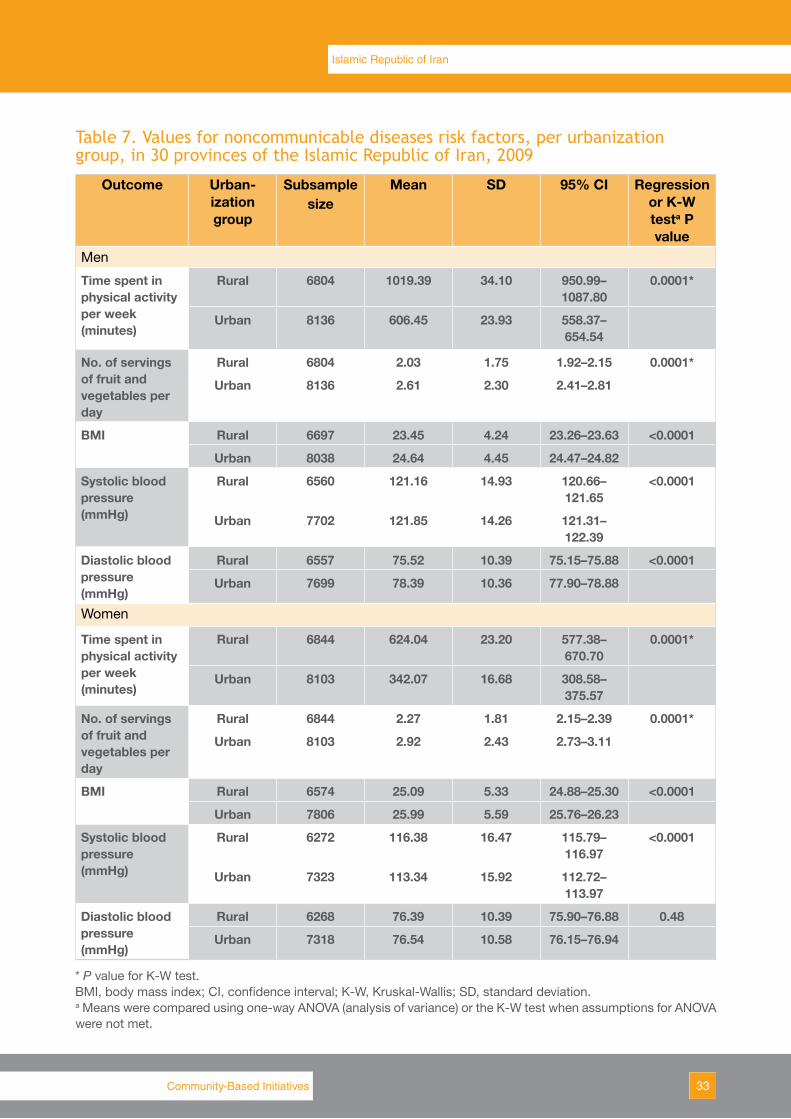
In the Islamic Republic of Iran, data were obtained from the fifth national noncommunicable disease risk factors surveillance 2009 (suRFNCD) to investigate the relationship between the process of urbanization and noncommunicable disease risk factors. In men, a higher prevalence of physical inactivity and obesity was found in urban areas than in rural sites. Also, urban men were at greater risk of hypertension than rural men. Similar results were obtained when comparing physical activity, body mass index (BMI) and blood pressure between rural and urban areas for both sexes. It was concluded that urban dwellers are more likely to be at risk of noncommunicable diseases than rural dwellers.
In Pakistan, a study was carried out at two urban sites in Karachi. Karachi is the most populous and urbanized city of Pakistan and it experiences constant inward migration of students, businessmen and labourers from all over the country. The study was based on the hypothesis that urbanization in any given locality is associated with risk factors for chronic disease.
A total of 800 individuals between the ages of 15 and 64 years were interviewed, with 400 belonging to the upper socioeconomic group and 400 to the lower socioeconomic group. The questionnaire contained questions on housing structure, educational status, access to potable water, mode of transport, use of health services, latrine facilities, eating and sleeping habits and level of physical activity. The data on risk factors for chronic diseases were taken from the National Health Survey carried out by the Pakistan Medical Research Council in collaboration with the Centers for Disease Control and Prevention, United States of America.
In the upper socioeconomic group, 88.8% of houses were well furnished and cemented while only 8.8% of those in the lower socioeconomic group were well furnished. There were also employment differences between the two groups. In the lower socioeconomic group, 37% of women were housewives, 22.8% were in private service and 14% were students. In the upper socioeconomic group, 29.5% were in private service, 26% were housewives and 20% were students.
In the upper socioeconomic group, 32.3% suffered from high blood pressure, and 32% had low physical activity, compared with 25.2% and 17%, respectively, in the lower socioeconomic groups; a significant difference in both cases. With a 10% prevalence of diabetes mellitus in the Pakistani population, sedentary lifestyle, obesity and consumption of fatty and sugary food by both socioeconomic groups makes them more vulnerable to many noncommunicable diseases.
WHO will continue its technical support to the countries of the Region in reducing risk factors for noncommunicable diseases through community ownership, sustained intersectoral collaboration and introducing the healthy city programme to address health equity.

Egypt


11Community-Based Initiatives
IntroductionThe prevalence of preventable risk factors of noncommunicable diseases, such as tobacco
use unhealthy nutritional habits, sedentary lifestyle and physical inactivity, has been increasing rapidly in urbanized areas in developing countries. There is concern about the health and welfare of people in low- and middle-income countries who are living in urban areas, as many of them are living in what are classified as slums.
A sample of 750 persons (459 from semi-urban slum areas and 291 from urban areas) was taken. A household survey was carried out in semi-urban slum areas (Al-Sharabya and Al-Khalifa), while in urban areas the sample was selected from attendants at family health centres (Al-Nozha Al-Gadida, Haykstep and Saraya Al-Koba). A questionnaire was designed to collect sociodemographic data, including education, occupation and data on selected risk factors (tobacco use, diet and physical activity). Body weight, height and blood pressure were also measured. Questions were asked about past history of chronic diseases such as diabetes mellitus, hypertension and cancer.
The objectives of this study were to:
• study the effect of urbanization on the lifestyle of both men and women, focusing on physical inactivity, unhealthy nutritional habits, tobacco use and overweight/obesity;
• assess the effect of urbanization on the prevalence of noncommunicable diseases (hypertension and diabetes mellitus).
The questions of the study were:
• Is the prevalence of risk factors of noncommunicable diseases among adults residing in slum areas similar to the prevalence of risk factors of adults residing in urban areas?
• What is the prevalence of noncommunicable diseases in slum and urban areas?
Literature reviewThe World Health Day theme in 2010, “Urbanization and Health”, reflected the rising number
of people living in cities and urban areas around the world. In 2007, the world’s urban population surpassed 50% for the first time in history and by 2050 it is estimated it will exceed 70% (1). There is concern about the health and welfare of people living in urban areas in low- and middle-income countries, as many are based in what are classified as slums (2). According to The challenge of slums: global report on human settlements 2003, 43% of the urban population in developing regions lives in slums (3).
Rapid unplanned urban growth is accompanied by poverty, environmental degradation and increasing population demands that outstrip service capacity and place human health at risk. Accordingly, urban people face a double burden of ill health: communicable and noncommunicable diseases (4–6).
The Knowledge Network on Urban Settings report summarized findings concerning structural and intermediate social determinants of health that are important in urban settings. An example of the health inequities in these circumstances is the strong gradient in infant and
Egypt

12
Effects of urbanization on incidence of noncommunicable diseases
child mortality rates within Nairobi, Kenya, where rates in slums are more than three times higher than the city average and possibly 10 or more times higher than in richer parts of the city (7). From over 100 case studies reviewed, it was concluded that “health” can unite individuals, communities, institutions, donors, leaders and politicians. Examples of actions that emerge from the case studies that may contribute to strengthening the role of the health sector are: creating trust by facilitating dialogue among stakeholders; empowering communities through engagement and participation; and advocating for social and financial accountability (i.e. for health funds at local levels) (7).
Evidence about the susceptibility and prevalence of communicable diseases is widely documented. However, the effect of fast-paced urbanization on lifestyles and the consequent noncommunicable disease outcome is rarely documented, at least in the Region. While there may be numerous behavioural, environmental and social risk factors for noncommunicable diseases in such a scenario, the most important are physical inactivity, tobacco use and unhealthy nutritional habits. In developing countries, it was observed that higher mortality caused by cardiovascular diseases and risk factors was first noted in upper socioeconomic strata and is now expanding into the general population (8). Changes in traditional risk factors, namely smoking tobacco, physical inactivity and an unhealthy diet, in a population should produce changes in cardiovascular mortality in all age groups simultaneously. The decline in cardiovascular mortality during the past three decades is the best evidence available in western countries of the effectiveness of the prevention and treatment initiatives introduced to control these conditions, particularly since the decline is a period effect occurring in all age groups simultaneously and is consistent with time trends of reductions in population risk factors in adults (9,10). It is well established that most of the major noncommunicable diseases are linked through a cluster of risk factors and are responsible for the causation of the diseases. Knowledge about the distribution of these risk factors provides an opportunity for intervention (11).
The WHO STEPwise survey conducted in 10 countries of the Region among adults aged 15–65 years indicates the following.
• Prevalence of high blood glucose among adults is in the range of 10–21%. Six out of 10 countries with the highest prevalence of diabetes in the world are from the Region (Bahrain, Egypt, Kuwait, Qatar, Saudi Arabia, United Arab Emirates).
• Prevalence of high blood pressure ranges between 15% and 40%, while prevalence of high cholesterol ranges between 9% and 44%.
• Prevalence of low intake of fruit and vegetables ranges between 33% and 96%, while prevalence of low physical activity ranges between 31% and 87%.
• Prevalence of current daily smoking among Egyptian males is 34.4%, while in Jordan it is 49.6%.
A recent study conducted on urbanization and noncommunicable disease risk factors in Tamil Nadu, India, showed an association between tobacco prevalence and urbanization for men, negative association between physical activity and urbanization for both men and women, and no significant difference in the prevalence of low fruit and vegetable consumption across urbanization groups for either men or women (12).
13Community-Based Initiatives
Egypt
MethodologySample size
From the prevalence of diabetes mellitus measured from the Egypt STEPwise survey in 2005–2006, it was assumed that the lowest prevalence for any of the major risk factors would be 15%. With a precision of 5% (95% confidence interval [CI] = 10–20%), a sample of about 200 persons was calculated. The design effect is usually considered to be 1.5–2 in similar surveys, resulting in a cluster sample size of 300–400 persons.
Sampling scheme
The sample was divided into two: one representing semi-urban slum regions and the other representing urban areas with mostly middle-class residents. The prevalence of risk behaviour was estimated separately for each group. Two semi-urban slum areas, Al-Khalifa and Al-Sharabya, provided 10 clusters each of around 50 person. Three urban areas representing the middle class, Al-Nozha Al-Gadida, Haykstep and Saraya Al-Koba, provided six clusters each of around 50 persons. A household survey was carried out in the two semi-urban slum areas, while in the urban areas the sample was selected from attendants at family health centres.
Data collection tools
A questionnaire was designed to collect sociodemographic data, including education, job and the selected risk factors: tobacco use, diet and physical exercise. Measurements of body weight, height and blood pressure were included as examination tools. Past history of chronic diseases such as diabetes mellitus and cancer was also included. The questionnaire was pretested among 10 persons after which a few corrections and rephrasing of words were made. A one-day training course for field supervisors and surveyors was held to explain to them the objectives of the study and the proper way to collect data, the importance of the questionnaire, and how to convince people, especially in slum areas, to participate. All field supervisors and surveyors were familiar with these types of household surveys and their teams were familiar with the areas and the residents.
Data collection
In the slum areas, a household survey was carried out by a physician (field supervisor) who supervised two health auxiliaries (one female and one male from the primary health centre or health offices). In the urban areas, data were collected from apparently healthy attendants who accompanied outpatients or attended vaccination sessions with their children.
Definitions of risk factors
The risk factors were defined as follows.
• Tobacco use was defined as reported current smoking of cigarettes or shisha, or both.• Low fruit and vegetable consumption was defined as the sum of the number of portions of
fruit and raw vegetables plus the number of portions of cooked vegetables being equal to or less than 5 per day.
• Low physical activity was measured in two ways:
• less than 150 minutes of sport such as jogging or walking per week; • 10 minutes or less of any type of physical activity per day, such as walking to reach the
workplace, using physical activities during work or at home, riding bicycles or any similar activities.
14
Effects of urbanization on incidence of noncommunicable diseases
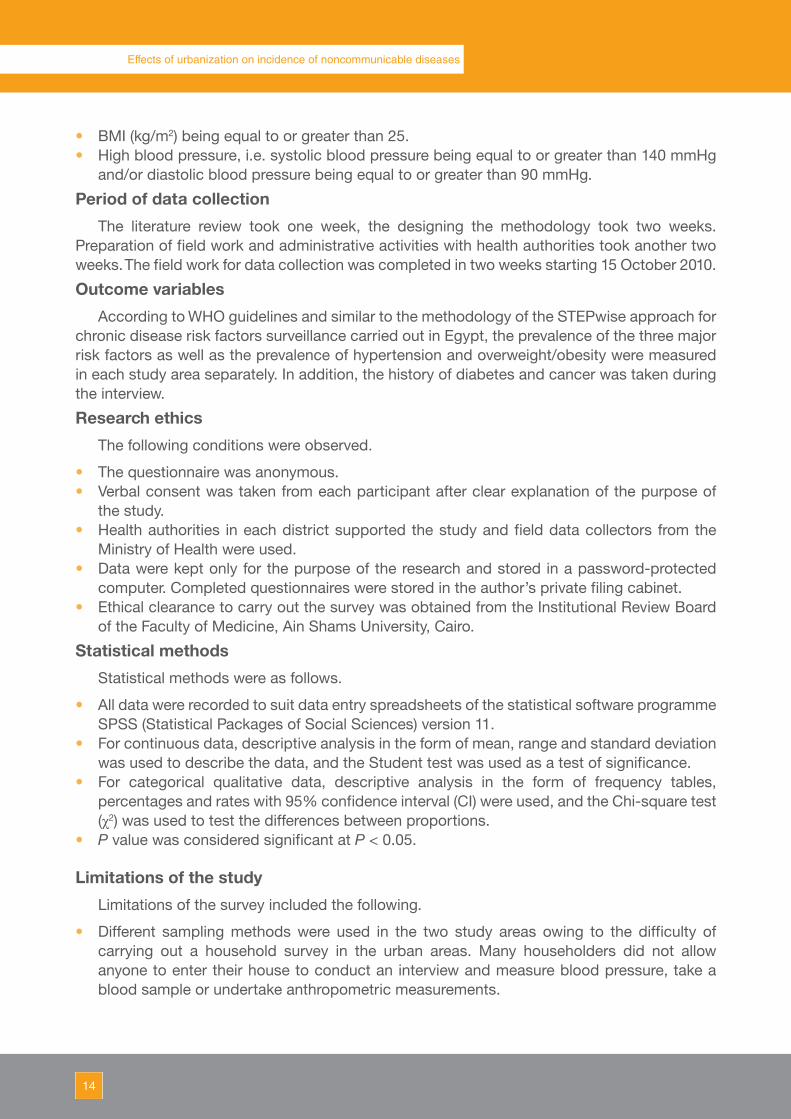
• BMI (kg/m2) being equal to or greater than 25.• High blood pressure, i.e. systolic blood pressure being equal to or greater than 140 mmHg
and/or diastolic blood pressure being equal to or greater than 90 mmHg.
Period of data collection
The literature review took one week, the designing the methodology took two weeks. Preparation of field work and administrative activities with health authorities took another two weeks. The field work for data collection was completed in two weeks starting 15 October 2010.
Outcome variables
According to WHO guidelines and similar to the methodology of the STEPwise approach for chronic disease risk factors surveillance carried out in Egypt, the prevalence of the three major risk factors as well as the prevalence of hypertension and overweight/obesity were measured in each study area separately. In addition, the history of diabetes and cancer was taken during the interview.
Research ethics
The following conditions were observed.
• The questionnaire was anonymous.• Verbal consent was taken from each participant after clear explanation of the purpose of
the study.• Health authorities in each district supported the study and field data collectors from the
Ministry of Health were used.• Data were kept only for the purpose of the research and stored in a password-protected
computer. Completed questionnaires were stored in the author’s private filing cabinet.• Ethical clearance to carry out the survey was obtained from the Institutional Review Board
of the Faculty of Medicine, Ain Shams University, Cairo.
Statistical methods
Statistical methods were as follows.
• All data were recorded to suit data entry spreadsheets of the statistical software programme SPSS (Statistical Packages of Social Sciences) version 11.
• For continuous data, descriptive analysis in the form of mean, range and standard deviation was used to describe the data, and the Student test was used as a test of significance.
• For categorical qualitative data, descriptive analysis in the form of frequency tables, percentages and rates with 95% confidence interval (CI) were used, and the Chi-square test (χ2) was used to test the differences between proportions.
• P value was considered significant at P < 0.05.
Limitations of the study
Limitations of the survey included the following.
• Different sampling methods were used in the two study areas owing to the difficulty of carrying out a household survey in the urban areas. Many householders did not allow anyone to enter their house to conduct an interview and measure blood pressure, take a blood sample or undertake anthropometric measurements.
15Community-Based Initiatives
Egypt
• Only verbal information was taken from participants regarding the history of diabetes and other noncommunicable diseases.
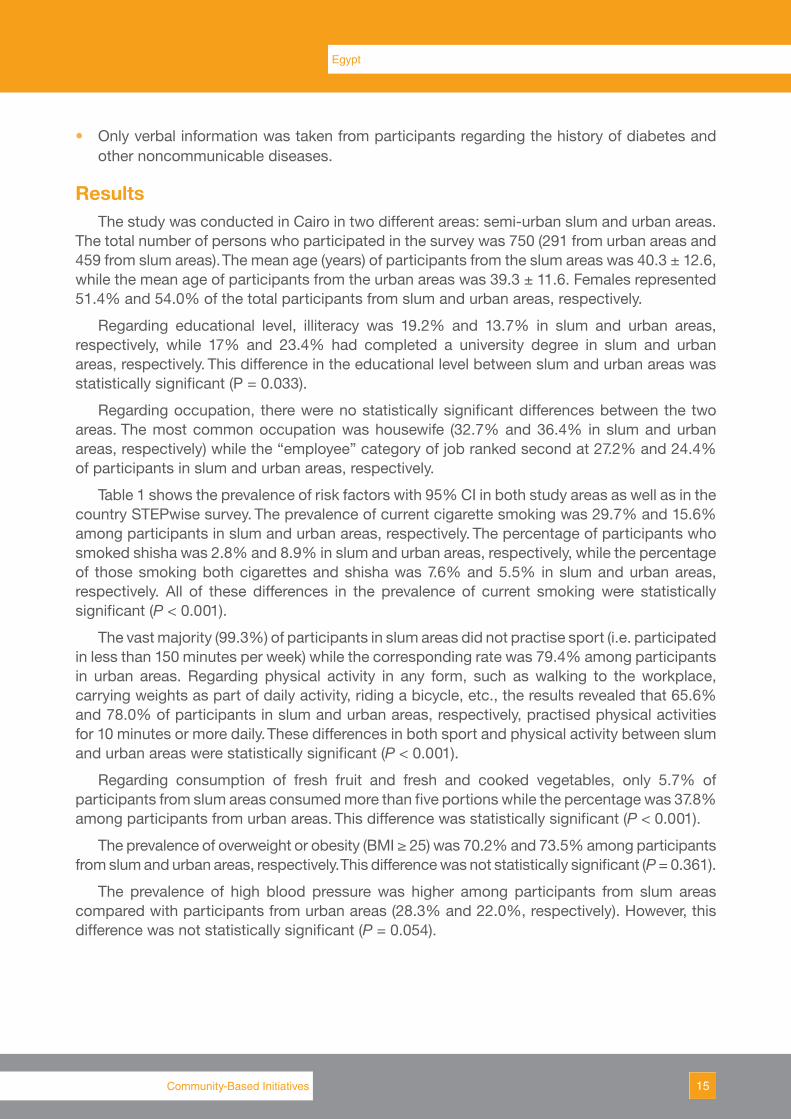
ResultsThe study was conducted in Cairo in two different areas: semi-urban slum and urban areas.
The total number of persons who participated in the survey was 750 (291 from urban areas and 459 from slum areas). The mean age (years) of participants from the slum areas was 40.3 ± 12.6, while the mean age of participants from the urban areas was 39.3 ± 11.6. Females represented 51.4% and 54.0% of the total participants from slum and urban areas, respectively.
Regarding educational level, illiteracy was 19.2% and 13.7% in slum and urban areas, respectively, while 17% and 23.4% had completed a university degree in slum and urban areas, respectively. This difference in the educational level between slum and urban areas was statistically significant (P = 0.033).
Regarding occupation, there were no statistically significant differences between the two areas. The most common occupation was housewife (32.7% and 36.4% in slum and urban areas, respectively) while the “employee” category of job ranked second at 27.2% and 24.4% of participants in slum and urban areas, respectively.
Table 1 shows the prevalence of risk factors with 95% CI in both study areas as well as in the country STEPwise survey. The prevalence of current cigarette smoking was 29.7% and 15.6% among participants in slum and urban areas, respectively. The percentage of participants who smoked shisha was 2.8% and 8.9% in slum and urban areas, respectively, while the percentage of those smoking both cigarettes and shisha was 7.6% and 5.5% in slum and urban areas, respectively. All of these differences in the prevalence of current smoking were statistically significant (P < 0.001).
The vast majority (99.3%) of participants in slum areas did not practise sport (i.e. participated in less than 150 minutes per week) while the corresponding rate was 79.4% among participants in urban areas. Regarding physical activity in any form, such as walking to the workplace, carrying weights as part of daily activity, riding a bicycle, etc., the results revealed that 65.6% and 78.0% of participants in slum and urban areas, respectively, practised physical activities for 10 minutes or more daily. These differences in both sport and physical activity between slum and urban areas were statistically significant (P < 0.001).
Regarding consumption of fresh fruit and fresh and cooked vegetables, only 5.7% of participants from slum areas consumed more than five portions while the percentage was 37.8% among participants from urban areas. This difference was statistically significant (P < 0.001).
The prevalence of overweight or obesity (BMI ≥ 25) was 70.2% and 73.5% among participants from slum and urban areas, respectively. This difference was not statistically significant (P = 0.361).
The prevalence of high blood pressure was higher among participants from slum areas compared with participants from urban areas (28.3% and 22.0%, respectively). However, this difference was not statistically significant (P = 0.054).
16
Effects of urbanization on incidence of noncommunicable diseases
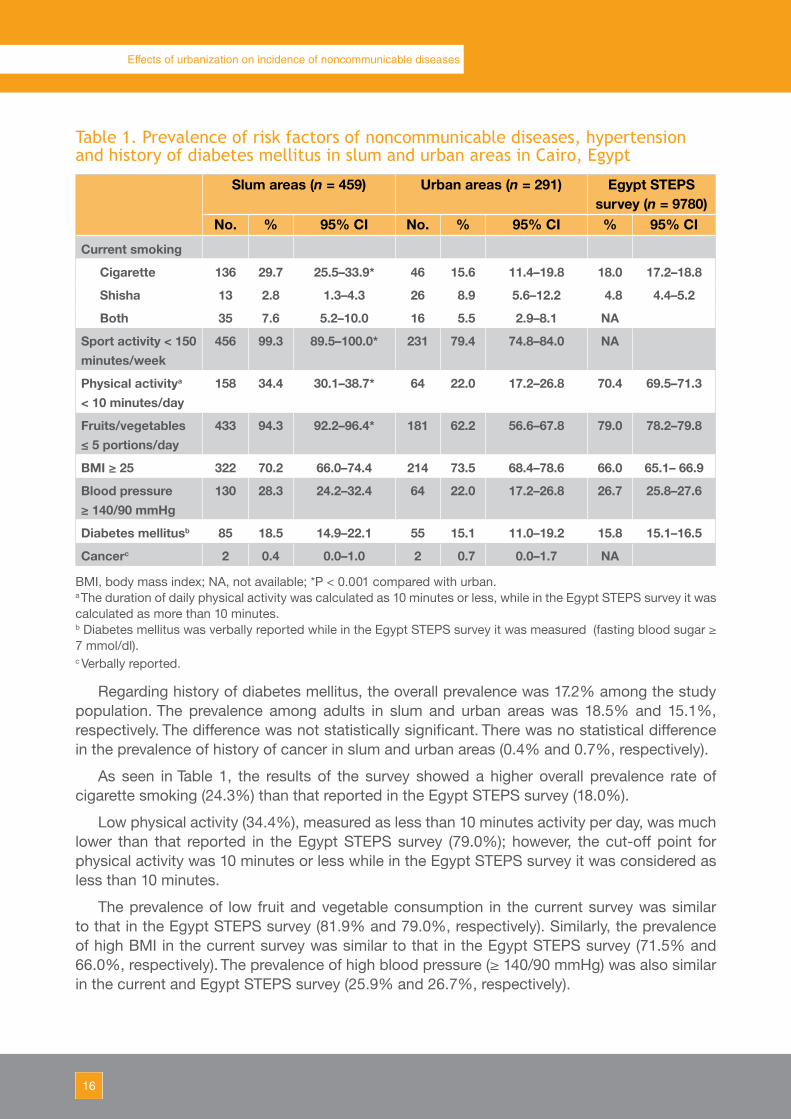
Table 1. Prevalence of risk factors of noncommunicable diseases, hypertension and history of diabetes mellitus in slum and urban areas in Cairo, Egypt
Slum areas (n = 459) Urban areas (n = 291) Egypt STEPS survey (n = 9780)
No. % 95% CI No. % 95% CI % 95% CI
Current smoking
Cigarette 136 29.7 25.5–33.9* 46 15.6 11.4–19.8 18.0 17.2–18.8
Shisha 13 2.8 1.3–4.3 26 8.9 5.6–12.2 4.8 4.4–5.2
Both 35 7.6 5.2–10.0 16 5.5 2.9–8.1 NA
Sport activity < 150 minutes/week
456 99.3 89.5–100.0* 231 79.4 74.8–84.0 NA
Physical activitya
< 10 minutes/day158 34.4 30.1–38.7* 64 22.0 17.2–26.8 70.4 69.5–71.3
Fruits/vegetables≤ 5 portions/day
433 94.3 92.2–96.4* 181 62.2 56.6–67.8 79.0 78.2–79.8
BMI ≥ 25 322 70.2 66.0–74.4 214 73.5 68.4–78.6 66.0 65.1– 66.9
Blood pressure≥ 140/90 mmHg
130 28.3 24.2–32.4 64 22.0 17.2–26.8 26.7 25.8–27.6
Diabetes mellitusb 85 18.5 14.9–22.1 55 15.1 11.0–19.2 15.8 15.1–16.5
Cancerc 2 0.4 0.0–1.0 2 0.7 0.0–1.7 NA
BMI, body mass index; NA, not available; *P < 0.001 compared with urban. a The duration of daily physical activity was calculated as 10 minutes or less, while in the Egypt STEPS survey it was calculated as more than 10 minutes.b Diabetes mellitus was verbally reported while in the Egypt STEPS survey it was measured (fasting blood sugar ≥ 7 mmol/dl).c Verbally reported.
Regarding history of diabetes mellitus, the overall prevalence was 17.2% among the study population. The prevalence among adults in slum and urban areas was 18.5% and 15.1%, respectively. The difference was not statistically significant. There was no statistical difference in the prevalence of history of cancer in slum and urban areas (0.4% and 0.7%, respectively).
As seen in Table 1, the results of the survey showed a higher overall prevalence rate of cigarette smoking (24.3%) than that reported in the Egypt STEPS survey (18.0%).
Low physical activity (34.4%), measured as less than 10 minutes activity per day, was much lower than that reported in the Egypt STEPS survey (79.0%); however, the cut-off point for physical activity was 10 minutes or less while in the Egypt STEPS survey it was considered as less than 10 minutes.
The prevalence of low fruit and vegetable consumption in the current survey was similar to that in the Egypt STEPS survey (81.9% and 79.0%, respectively). Similarly, the prevalence of high BMI in the current survey was similar to that in the Egypt STEPS survey (71.5% and 66.0%, respectively). The prevalence of high blood pressure (≥ 140/90 mmHg) was also similar in the current and Egypt STEPS survey (25.9% and 26.7%, respectively).

17Community-Based Initiatives
Egypt
Table 2. Comparison of noncommunicable risk factors and hypertension between males in slum and urban areas of Cairo, Egypt
Males in slum areas(n = 223)
Males in urban areas (n = 134)
X2 test P value
No. % No. %Current tobacco use
Non-smoker 58 26.0 55 41.0
Cigarette 120 53.8 38 28.4 34.501 < 0.001
Shisha 12 5.4 26 19.4
Both 33 14.8 15 11.2Sport activity
< 150 minutes/week 222 99.6 111 82.8 37.297 < 0.001
≥ 150 minutes/week 1 0.4 23 17.2Physical activity
< 10 minutes/day 55 24.7 26 19.4 1.321 0.250
≥ 10 minutes/day 168 75.3 108 80.6Fruit/vegetable intake
≤ 5 portions/day 210 94.2 81 60.4 63.166 < 0.001
> 5 portions/day 13 5.8 53 39.6BMI
≥ 25 154 69.1 92 68.7 0.006 0.937
< 25 69 30.9 42 31.3Blood pressure
High ≥ 140/90 mmHg 63 28.3 35 26.1 0.191 0.662
Normal < 140/90 mmHg 160 71.7 99 73.9
BMI, body mass index.
The prevalence rate of diabetes mellitus in the present survey was 17.2% (according to verbal reporting of history of the disease) while it was 15.8% in the Egypt STEPS survey (which measured fasting blood sugar ≥7 mmol/dl).
Analysis of the results according to sex is shown in Tables 2 and 3. The prevalence of current tobacco use in males was significantly higher in participants from slum areas (53.8% for cigarette, 5.4% for shisha, 14.8% for both) compared with urban areas (28.4% for cigarette, 19.4% for shisha, 11.2% for both). In females, there were no significant differences in tobacco use between slum and urban areas.
18
Effects of urbanization on incidence of noncommunicable diseases
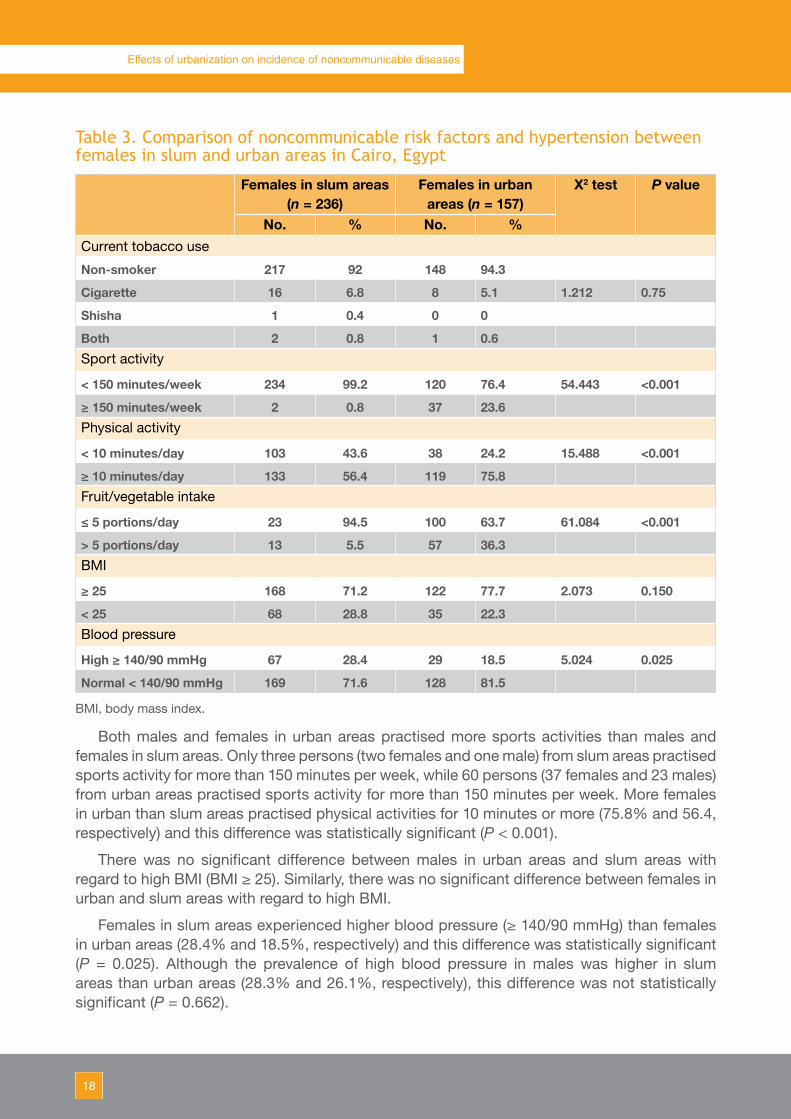
Table 3. Comparison of noncommunicable risk factors and hypertension between females in slum and urban areas in Cairo, Egypt
Females in slum areas (n = 236)
Females in urban areas (n = 157)
X2 test P value
No. % No. %Current tobacco use
Non-smoker 217 92 148 94.3
Cigarette 16 6.8 8 5.1 1.212 0.75
Shisha 1 0.4 0 0
Both 2 0.8 1 0.6Sport activity
< 150 minutes/week 234 99.2 120 76.4 54.443 <0.001
≥ 150 minutes/week 2 0.8 37 23.6Physical activity
< 10 minutes/day 103 43.6 38 24.2 15.488 <0.001
≥ 10 minutes/day 133 56.4 119 75.8Fruit/vegetable intake
≤ 5 portions/day 23 94.5 100 63.7 61.084 <0.001
> 5 portions/day 13 5.5 57 36.3BMI
≥ 25 168 71.2 122 77.7 2.073 0.150
< 25 68 28.8 35 22.3Blood pressure
High ≥ 140/90 mmHg 67 28.4 29 18.5 5.024 0.025
Normal < 140/90 mmHg 169 71.6 128 81.5
BMI, body mass index.
Both males and females in urban areas practised more sports activities than males and females in slum areas. Only three persons (two females and one male) from slum areas practised sports activity for more than 150 minutes per week, while 60 persons (37 females and 23 males) from urban areas practised sports activity for more than 150 minutes per week. More females in urban than slum areas practised physical activities for 10 minutes or more (75.8% and 56.4, respectively) and this difference was statistically significant (P < 0.001).
There was no significant difference between males in urban areas and slum areas with regard to high BMI (BMI ≥ 25). Similarly, there was no significant difference between females in urban and slum areas with regard to high BMI.
Females in slum areas experienced higher blood pressure (≥ 140/90 mmHg) than females in urban areas (28.4% and 18.5%, respectively) and this difference was statistically significant (P = 0.025). Although the prevalence of high blood pressure in males was higher in slum areas than urban areas (28.3% and 26.1%, respectively), this difference was not statistically significant (P = 0.662).
19Community-Based Initiatives
Egypt
DiscussionEgypt has faced urbanization during the past three decades as a result of rural to urban
migration and a natural increase of urban population. These newly growing urban areas are densely populated and underserved in terms of social and health care services. It is estimated that there are around 80 slum areas in Cairo. According to UNHABITAT (2), the main characteristics of Cairo slum areas are:
• environmental characteristics such as poor housing conditions; no planning, supervision or maintenance; extremely narrow irregular lanes that are usually unpaved; poor facilities such as no sewage disposal and no sanitary piped water supply; uncleanliness; and no parks or recreation facilities;
• economic and social characteristics such as low per capita income; high population density ranging from 1500 to 2000 people per hectare; and a high crowding index (up to four persons per room).
According to the literature review, there are few studies from slum areas in Egypt and no nationwide study had been carried out to assess the health status of families residing in these slum areas. Also, few studies have been carried out by nongovernmental organizations in Egypt. Most of the studies carried out concern mother and child health, in particular the prevalence and incidence of infectious diseases and malnutrition, and social life of families.
In addition to slum areas, there are frequently “slum pockets” scattered in many urban districts of Cairo. These slum pockets are similar in density and housing conditions to the slum areas. However, these slum pockets are often not included in health surveys conducted in Cairo as they are unknown, difficult to reach because of the narrow streets and unpaved lanes, and may be in an insecure environment. These slum pockets attract residents from various socioeconomic classes, owing to their proximity to the main urban centres and the low cost of buying or renting property there.
Samples from two such slum pockets have been selected in our study. The two slum pockets, Al-Sharabya and Al-Khalifa, are characterized by poor or very poor housing, lack of a municipal sewage system and unplanned, narrow streets. The majority of residents are considered poor or low socioeconomic class families.
The three urban areas chosen in this study were Al-Nozha Al-Gadida, Haykstep and Saraya Al-Koba. Al-Nohza Al-Gadida is a new residential area, close to the Heliopolis district and near Cairo International Airport. Most of its residents are middle class or rich and live in modern buildings. The Saraya Al-Koba area is characterized by both new and old buildings that are occupied by middle class and above-average socioeconomic class families. This area includes the famous El-Tahra Palace, and is close to the Republic Palace. Haykstep is a new compound and is characterized by new buildings. The residents of this area are middle class.
The hypothesis of the study was that social life in slum areas is more stressful than that in urban areas. Accordingly, the prevalence of major risk factors of communicable diseases in slum areas is higher, or at least similar to, that in urban areas. The results revealed that current use of tobacco, either cigarette or shisha, was significantly higher among participants residing in semi-urban slum areas (40.1%) compared with participants residing in urban areas (30%). The higher prevalence of smoking in slum areas may be attributed to the fact that the majority of workers are employed on a daily basis and have no permanent job and that this group of workers tends to smoke.
20
Effects of urbanization on incidence of noncommunicable diseases
Similar results have been reported in other countries. For example, in India self-reported tobacco use among males in urban slums area was 48.3% and in other urban area was 35.2% (13). In another recent study in India, there was an association between smoking prevalence and urbanicity (12). In China, high prevalence and clustering of major modifiable risk factors are common in suburban residents in Beijing (14). In Bangladesh, the prevalence of smoking was 59.8% among men in slum areas, which was significantly higher than the figure in non-slum areas (46.4%) (15).
In South America, urbanization has brought unfavourable and prominent changes, such as increased smoking rates, stress, lack of physical activity and poor diet (16). Studies in China and India have demonstrated high prevalence of physical inactivity among women and men in urban slum and urban community (17–18). However, a study conducted in north India had contrary results to our finding as it reported a higher prevalence of major risk factors for urban populations than slum populations (19).
This study showed that the practice of physical activity in the form of sport is extremely low (less than 1%) among both males and females in semi-urban slum areas, while around one fifth of participants in urban areas reported sport activity of at least 150 minutes/week. Daily activities of various forms were reported by about two thirds of the participants in semi-urban slum areas and by three quarters of the participants in urban areas. Those living in slums are more likely to be inactive as there are no recreation facilities and no paved streets or gardens for walking or jogging. However, at the same time, those residing in semi-urban slum areas have daily physical activity in the form of walking from homes to markets, shops or bus stations.
The study also pointed out that fruit and vegetable consumption in semi-urban slum areas was very low. Only 5.8% of men and 5.5% of women reported consumption of more than five portions per day. The corresponding figures for men and women in urban areas were 39.6% and 36.3%, respectively. The majority of countries in the Region that participated in the STEPSwise survey reported very low intake of fresh fruit and vegetables.
As a consequence of physical inactivity and unhealthy diet, the prevalence of high BMI (≥ 25) in the present study was demonstrated in more than 70% of the total participants, from both semi-urban slum and urban areas. There were no significant differences between the study areas. The results of the STEPwise surveys in Egypt, Iraq, Jordan, Kuwait and Saudi Arabia showed that the prevalence of high BMI ranged between 66% and 75.4% (20). The prevalence of diabetes mellitus among the study population was 17.2%, a figure that is higher than the national Egyptian figure (15.8%). In developing countries, the increasing prevalence of overweight and obesity and metabolic syndrome diseases in adults and children has mainly been linked to increasing urbanization, nutritional transition and decrease in physical activity (21).
The prevalence of high blood pressure among residents in the semi-urban slum areas (28.3%) was not significantly higher than that in urban population (22.0%). This insignificant difference was also found among males but there was a significant difference between females in semi-urban slum areas and females in urban areas (28.4% and 18.5%, respectively). This result is contrary to the results of the study in Tamil Nadu, India, which reported that the prevalence of high blood pressure was associated with urbanization in men but not in women (12). It is evident from the results of STEPwise surveys in countries in the Region that there is a high prevalence of high blood pressure, ranging from 15% to 40%.

21Community-Based Initiatives
Egypt
ConclusionThe high prevalence of the major preventable risk factors (tobacco use, unhealthy diet, lack
of physical activity) in our study sites (semi-urban slum and urban areas) is an alarming signal for urban populations, which are increasing year by year. These risk factors are associated with a high prevalence of noncommunicable diseases such as hypertension and diabetes. The results of this study provide evidence that urbanization correlates with an increased incidence of noncommunicable diseases in large urban cities for both men and women. Based on the study conclusions, a number of action points were identified.
• Since this study was conducted on a small scale and in one city, conduct a population-based study on a wider scale, targeting all slum areas and slum pockets in the larger cities of Egypt.
• Plan a national control policy for preventable major risk factors employing a collaborative multisectoral approach, involving all concerned ministries and organizations.
• Build partnerships with international health organizations to develop successful programmes on prevention of the major risk factors of noncommunicable diseases.
• Focus education programmes on the importance of regular physical exercise, healthy nutritional habits and the hazards of tobacco use and target schoolchildren and their parents.
References1. Urbanization and health. Bulletin of the World Health Organization, 2010, 88:245–246.2. The state of the world’s cities 2006/7. The Millennium Development Goals and urban
sustainability: 30 years of shaping the habitat agenda. United Nations Human Settlements Programme (UNHABITAT). London, Earthscan, 2006.
3. The challenge of slums: global report on human settlements 2003. Nairobi, United Nations Human Settlements Programme (UNHABITAT), 2003.
4. Moore M, Gould P, Keary BS. Global urbanization and impact on health. International Journal of Hygiene and Environmental Health, 2003, 206: 269–278.
5. Stephan C, Satterthwaite D. Urban health in developing countries. International Encyclopedia of Public Health 2008, 452–463.
6. Reddy KS. Cardiovascular diseases in the developing countries: dimensions, determinants, dynamics and directions for public health action. Public Health Nutrition, 2002, 5(1A):231–237.
7. Our cities, our health, our future. Acting on social determinants for health equity in urban settings. Report to the WHO Commission on Social Determinants of Health from the Knowledge Network on Urban Settings. Japan, WHO Centre for Health Development, Kobe, 2008.
8. Beaglehole R, Yach D. Globalisation and the prevention and control of non-communicable disease: the neglected chronic diseases of adults. Lancet, 2003, 362:903–908.
9. Kuulasmaa K et al. Estimation of contribution of changes in classic risk factors to trends in coronary-event rates across the WHO MONICA Project populations. Lancet, 2000, 355:675–687.
10. McElduff P et al. Rapid reduction in coronary risk for those who quit cigarette smoking. Australian and New Zealand Journal of Public Health, 1998, 22:787–791.
11. Mathur P. Risk factors for non-communicable diseases: getting beyond data. Journal of

22
Effects of urbanization on incidence of noncommunicable diseases
Postgraduate Medicine, 2006, 52:171–172.12. Allender S et al. Level of urbanization and noncommunicable disease risk factors in Tamil
Nadu, India. Bulletin of the World Health Organization, 2010, 88:297–304. 13. Gupta V, Yadav K, Anand K. Patterns of tobacco use across rural, urban, and urban-slum
populations in a north Indian community. Indian Journal of Community Medicine: official publication of Indian Association of Preventive & Social Medicine, 2010, 35:245–251.
14. Zhang L et al. Prevalence of cardiovascular risk factors clustering among suburban residents in Beijing, China. International Journal of Cardiology, 2010, 151:46-49.
15. Khan MM et al. Prevalence and correlates of smoking among urban adult men in Bangladesh: slum versus non-slum comparison. BMC Public Health, 2009, 9:149.
16. Avezum A et al. Cardiovascular disease in South America: current status and opportunities for prevention. Heart (British Cardiac Society), 2009, 95:1475–1482.
17. Anand K et al. Are the urban poor vulnerable to non-communicable diseases? A survey of risk factors for non-communicable diseases in urban slums of Faridabad. The National Medical Journal of India, 2007, 20:115–120.
18. Ng SW, Norton EC, Popkin BM. Why have physical activity levels declined among Chinese adults? Findings from the 1991–2006 China Health and Nutrition Surveys. Social Science & Medicine (1982), 2009, 68:1305–1314.
19. Yadav K, Krishnan A. Changing patterns of diet, physical activity and obesity among urban, rural and slum populations in north India. Obesity Reviews, 2008, 9:400–408.
20. STEPwise approach to surveillance (STEPS). Geneva, World Health Organization (http://www.WHO.int/chp/steps 2 May 2012).
21. Misra A, Khurana L. Obesity and the metabolic syndrome in developing countries. The Journal of Clinical Endocrinology and Metabolism, 2008, 93 (Suppl. 1):S9–S30.

Islamic Republic of Iran

25Community-Based Initiatives
Islamic Republic of Iran
Introduction
Since the beginning of the 20th century, the proportion of the world’s population living in urban areas has grown from 14% to over 50% (1). This transition is most keenly observed in developing countries. In the Republic of Korea, for example, there has been a fivefold increase in the number of people living in urban areas in the past 30 years (2). These demographic shifts are associated with many other changes, including improved public hygiene; environmental sanitation; greater access to health care; increased individual wealth; changing employment and work force structures; and shifts in dietary and physical activity patterns (3,4). These fundamental changes have clear implications for disease patterns and particularly for the emergence of noncommunicable diseases (5). Between 1990 and 2000, the prevalence of noncommunicable diseases rose from 47% to 56% in developing countries. It is predicted that noncommunicable diseases will account for 69% of all deaths in developing countries by 2020 and that cardiovascular disease will become the leading cause of mortality (6). The burden of this transition in the disease epidemiology will be heavier in the developing world compared with the developed because, in the developing world, the majority of sufferers are expected to be relatively young, be of lower socioeconomic status, and to suffer from a more severe and premature onset of disease (7).
The effect of urbanization on health is two-edged. On the one hand, there are the benefits of ready access to health care, sanitation and secure nutrition, while on the other hand there are the problems of overcrowding, pollution, social deprivation, crime and stress-related illness. Urbanization also may lead to chronic diseases, including hypertension, heart disease, obesity, diabetes and asthma.
The Islamic Republic of Iran, one of the developing countries in the WHO Eastern Mediterranean Region, is moving quickly towards urbanization. About two thirds of its 72 million people live in urban areas, mostly in megacities such as Isfahan, Karaj, Mashhad, Shiraz, Tabriz and Tehran. This study reviews some of the health-related aspects of urbanization and comment on strategies designed to improve urban health in Isfahan province.
The objective of this study was to compare noncommunicable disease risk factors in urban and rural settings across the Islamic Republic of Iran.
Literature reviewOf 868 titles and abstracts identified by the literature search, nine studies remained after
application of the exclusion criteria. Five studies were conducted in a single developing country while the remainder were conducted in two or more countries.
There is a clear divide between the long process of urbanization in industrialized nations and the relatively recent explosive expansion in resource-poor countries. The understanding of the level of urbanization or its scale in developing countries is challenged by differences in the definition of “urban” and in turn, the lack of reliable data. Furthermore, the process of urbanization is far from homogenous across regions and swathes of territories that are wholly different in terms of economic and political structures.

26
Effects of urbanization on incidence of noncommunicable diseases
Similar constraints are faced by numerous nongovernment organizations working at the local level in poor neighbourhoods of cities. Consequently, there is a problem of representation of the local needs in poor urban neighbourhoods, which often have little or no political standing on a city or national level.
Despite this, most studies examining the relationship between urbanization and chronic diseases use a national-level rural/urban dichotomy to summarize urbanization. Vlahov and Galea show that for the 228 countries for which the United Nations collects data, almost half use a basic administrative definition of urban (e.g. living in the capital city), around a quarter define urbanization using population measures (e.g. size and density) and one in eight uses functional characteristics (e.g. economic activity) (8).
Reporting results from the Chinese Health and Nutrition Survey and data from the United Nations Food and Agriculture Organization, Mendez and Popkin show that urbanization and globalization enhance access to non-traditional foods, resulting in less healthy dietary patterns (9). A large risk factor surveillance study conducted in India found that the prevalence of diabetes was two and a half times higher in urban areas when compared with rural areas (10).
The broad measures of urbanization described above have been useful in establishing associations between level of urbanization, chronic disease risk factors and chronic diseases, also known as the urban health penalty (8). Research on the structure of modern urban living and the ways that this can influence health has received some academic attention (8), but the scarcity of research makes it difficult to examine temporal changes in the urban environment and subsequently changes in patterns of disease. A second complication is the disparate academic traditions involved in this type of research: geography, epidemiology, sociology and urban planning (11). Many define urbanization using a simple dichotomy (urban/rural) or even a single continuous variable (population density). This makes it difficult to understand the specific changes within the process of urbanization that lead to changes in risk and disease. Furthermore, the idea of a “threshold” delineating an urban area as opposed to other types of living environments ignores the graduation in disease states between and within geographical areas.
Socioeconomic, cultural, political and environmental factors have a powerful influence on population health-related behaviours and subsequent health outcomes. A number of authors propose a framework for understanding the relationship between the social and physical environments that defines “urban” as being influenced by municipal factors, including government, civil society, and national and global trends (9,10). This framework posits that the physical, social, economic and political elements of the urban environment have some effect on the health of all residents. The social environment describes properties of the urban community such as socioeconomic status, crime and violence, diversity of a population, etc. In practice, elements of interest in the physical environment may include features of the built environment, air and water quality, and noise pollution. For public health and chronic diseases, areas of interest might include access to sanitation, supermarkets, paved roads, etc. An important consideration is the provision of health and social services, which in turn is interrelated with the physical and social environment.
An understanding of the individual elements of “urbanization” and how these lead to the development of noncommunicable disease risk factors is an important first step in identifying potential sites for intervention at a population level. This review is the first step in developing a more detailed picture of the ways in which previous peer-reviewed research has shown how “urbanization” contributes to the burden of chronic diseases in the developing world.
27Community-Based Initiatives
Islamic Republic of Iran
One billion people, or one third of the world's population, are estimated to be living in either slum or squatter settlements (4). The largest proportion of the population living in slums in the world can be found in Asia, which is also urbanizing at the fastest rate. In 2001, Asia had 554 million slum dwellers, or 60% of the world's total. In south Asia, the slum and squatter settlement population constituted 58% of the total south Asian urban population compared with 36.4% of the population in east Asia and 28% of the population in south-east Asia (12).
Using the dichotomous United Nations definition of urbanization (based on country-specific definitions using one or more of the following indicators: population density, population size or administrative division) for more than 100 countries, Godfrey and Julien (1) found that both BMI and blood cholesterol levels rose rapidly with increases in national income and level of urbanization. Work undertaken in Sri Lanka shows a greater increase in BMI and other risk factors for cardiovascular disease among urban dwellers than among their rural counterparts (6).
Nine studies were identified that quantified urbanization in relation to chronic disease or chronic disease risk factors. Most studies relied on secondary demographic and geographic measures of urbanization comparing populations living in urban and rural areas across a range of outcomes. Four studies used either secondary or primary data or combinations of the two at the area and individual levels to develop summary scores from multiple proxy measures of an urban environment.
Area level measures included population size; population density; proportion of the population living in urban areas; health; education; housing quality; economic factors; environment/sanitation; and access to markets, transportation and communications/media.
Individual measures included place of residence, number of years spent in an urban area since leaving school, proportion of lifetime spent in an urban environment, occupation, home, land and livestock ownership, and proximity of family. None of these studies provided an objective validation of these measures of urbanization.
MethodologyThis study was designed based on a hypothesized association of urbanization with major risk
factors for chronic diseases. Urbanization was measured based on population size, density and level of education and categorized into one of two groups: rural or urban. The relationship was examined between urbanization and chronic disease risk factors in Isfahan province, including tobacco use, fruit and vegetable consumption, physical activity, overweight and obesity, high blood pressure and diabetes.
For this purpose, the prevalences of five major common risk factors for noncommunicable disease, including tobacco use, high BMI, low fruit and vegetable consumption, low physical activity and high blood pressure, were estimated and then compared between rural and urban areas. Data were obtained from the fifth national survey of noncommunicable disease risk factors surveillance (SuRFNCD). Rural/urban division was constructed based on government criteria using validated data obtained from the 2006 national census.
Study framework
The fifth national survey of noncommunicable disease risk factors was conducted in May 2009 by the office of noncommunicable disease risk factors surveillance in collaboration with 41 medical universities across the country. The survey comprised 30 000 Iranian adults aged between 15 and 64 years. Each of 30 provinces was taken as a stratum and a one-stage random
28
Effects of urbanization on incidence of noncommunicable diseases
cluster sample of 1000 adults was taken from each province. Every cluster consisted of 10 males and 10 females who were classified into five 10-year age groups (i.e. 15–24 years, 25–34 years, 35–44 years, 45–54 years and 55–64 years). Each cluster comprised two males and two females in each age group. The distribution of clusters in each province was proportional to the size of the rural/urban population.
SuRFNCD information was gathered using a standard questionnaire based on WHO STEPwise guidelines. The participants were visited at their home by interviewers who had been given details of the survey and trained in two separate workshops prior to the commencement of the survey. All participants gave verbal informed consent before taking the interview. The STEPs standard questionnaire included two major sections.
In the first section, general questions were asked about health characteristics and demographic information. The SuRFNCD questionnaire included six characteristics: demographic information, fruit and vegetable consumption, physical activity, tobacco use, history of hypertension, and history of diabetes. Demographic information was collected on age, sex, level of education and occupation of each participant and their residential area (rural/urban).
In the second section, to assess the physical and anthropometrical risk factors, physical measurements were performed to determine weight, height, waist circumference and blood pressure. BMI (kg/m2) was calculated for each participant. The systolic and diastolic blood pressures were measured three times in the right arm of each participant and the mean of three was taken.
Statistical methods
After cleaning the data and excluding incorrect records, 29 888 observations of individuals remained, of which 13 648 were from rural individuals and 16 239 were from individuals living in cities. To generalize the results to the Iranian adult population, the data were weighted for age (10-year strata), sex and residence area (rural/urban) according to the results of the 2006 national census of the Islamic Republic of Iran. Complex survey sample analysis was performed to estimate the prevalence of each risk factor for both rural and urban areas. For continuous exposure outcomes of normal distribution, the Student t-test was used to analyse the relationship between outcome variables from each of the rural/urban areas. The Kruskal-Wallis test was used for continuous exposure data that were not normally distributed. The linear regression method was used in the case of continuous outcome and logistic regression for binary outcome variables to explore differences between the groups, with adjustment for age and sex variables. Finally, crude odds ratio and age-adjusted odds ratio were reported to assess the effect of urbanization on each of risk factors. All statistical analyses were performed using Stata software.
Strengths and weaknesses of the study
The strengths of the approach included the systematic nature of the review. The initial pilot phase made it possible to generate a broad range of search terms before a full search strategy was built. The application of inclusion criteria ensured that only those studies relevant to the research question were included in the review.
The initial pilot study led the authors to believe that the term “urbanization” is misused. The majority of studies reviewed do not consider “urbanization” as a process but rather compare geographical or administrative locations based on urban/rural dichotomies. To overcome this
29Community-Based Initiatives
Islamic Republic of Iran
problem, the terms used to represent urbanization were expanded to include modernization, etc. Identifying the possible misuse of the term “urbanization” proved an invaluable result of the pilot study and should be an important step of any systematic review in an untried area (13).
While most authors agree that urbanization refers to the process of becoming urban, there is little agreement about how these phenomena can be measured or studied in association with population health or other outcomes (14). The majority of studies reviewed relied on pre-existing measures of urbanization using a rural/urban dichotomy, identifying that urban settings adversely affect health but not how or why such settings may affect health (8). A subset of these studies used arbitrary cut-off points to create a third intermediate level of urbanization. These measures may mask variations across populations because of the scale used in classifying population density. Using this crude dichotomy makes it difficult to understand the relationship between urbanization and chronic disease risk.
There are other, more recent, measures that may serve as surrogates for urbanization. At an area level, this list might include the proportion of households living below the poverty line, the human development index, etc. These measures have their own limitations and as with those found in this review have not been validated as measures of the process of “urbanization”.
ResultsThe sex ratio of participants in our sample was 1:1. The average age of the participants
was 32.6 years with a standard deviation of 14.3 years; the age range was from 15 to 64 years for both sexes. At the time the survey was performed, 7.6% and 12.7% of the population were students in the rural and urban groups, respectively. Nearly 9% of respondents were employed in either the governmental or nongovernmental sector. About 29% of the rural population and about 22% of the urban population were self-employed and the overall figure for both groups was 25%. The rate of home employment was 43% and 37.3% for rural and urban groups, respectively. The rate is higher in rural areas as females in these areas are more involved in home activities that produce some income. The rate of unemployment of those able to work was low in both groups (4.8% and 4.1 % in rural and urban areas, respectively). Only 1.7% and 7.9% of participants were retired in rural and urban settings, respectively.
Tobacco use
Daily tobacco use was defined as smoking one or more tobacco products on a daily basis. There was no statistically significant difference in prevalence between urban and rural populations for either men or women (Tables 4 and 5). This trend remained insignificant after adjustment for age (for men: P value = 0.81; for women: P value = 0.66) (Table 2.4).

30
Effects of urbanization on incidence of noncommunicable diseases
Table 4. Noncommunicable diseases risk factor prevalence (%), by urbanization group, in 30 provinces of the Islamic Republic of Iran, 2009
Risk factor
Urbanization group
All Male FemaleNo. % 95%
CINo. % 95%
CINo. % 95%
CI
Daily smoking
Rural 13 640 10.73 9.95–11.56
6800 20.31 19.62–21.02
6840 0.91 0.68–1.22
Urban 16 230 10.88 10.16–11.66
8130 20.45 19.76–21.16
8100 1.09 0.90–1.31
Low physical activity
Rural 13 645 32.28 30.62–34.00
6804 20.75 20.02–21.50
6841 44.10 42.84–45.36
Urban 16 239 42.61 40.25–45.00
8136 32.35 31.06–33.66
8103 53.12 51.72–54.51
Low fruit and vegetable intake
Rural 13648 92.44 91.02–93.66
6804 93.82 93.15–94.43
6844 91.04 90.14–91.86
Urban 16239 85.85 83.47–87.95
8136 87.95 86.62–89.17
8103 83.70 83.47–87.95
High BMI Rural 13271 37.99 36.42–39.58
6697 30.73 28.79–32.74
6574 45.55 43.71–47.39
Urban 15844 47.17 45.90–48.45
8038 43.55 41.57–45.56
7806 50.91 49.12–52.70
High blood pressure
Rural 13643 15.35 14.59–16.13
6803 13.83 13.32–14.35
6840 16.91 16.42–17.40
Urban 16233 16.49 15.56–17.45
8133 17.27 16.53–18.02
8100 15.69 15.20–16.18
BMI, body mass index; CI, confidence interval.
Table 5. Noncommunicable diseases risk factor prevalence (%) by age group, in 30 provinces of the Islamic Republic of Iran, 2009
Risk factor
Age group
All Rural UrbanNo. % 95% CI No. % 95% CI No. % 95% CI
Daily smoking
15–24 6054 3.36 3.13–3.60
2759 2.83 2.51–3.19
3295 3.67 3.39–3.96
25–34 5977 11.92 11.58–12.28
2724 12.62 12.14–13.12
3253 11.55 11.09–12.03
35–44 5991 17.13 16.87–17.39
2731 18.22 17.88–18.56
3260 16.57 16.22–16.93
45–54 5961 18.97 18.79–19.16
2736 17.02 16.81–17.22
3224 20.01 19.74–20.29
55–64 5887 13.92 13.82–14.02
2690 13.43 13.31–13.54
3197 14.18 14.04–14.32
31Community-Based Initiatives
Islamic Republic of Iran
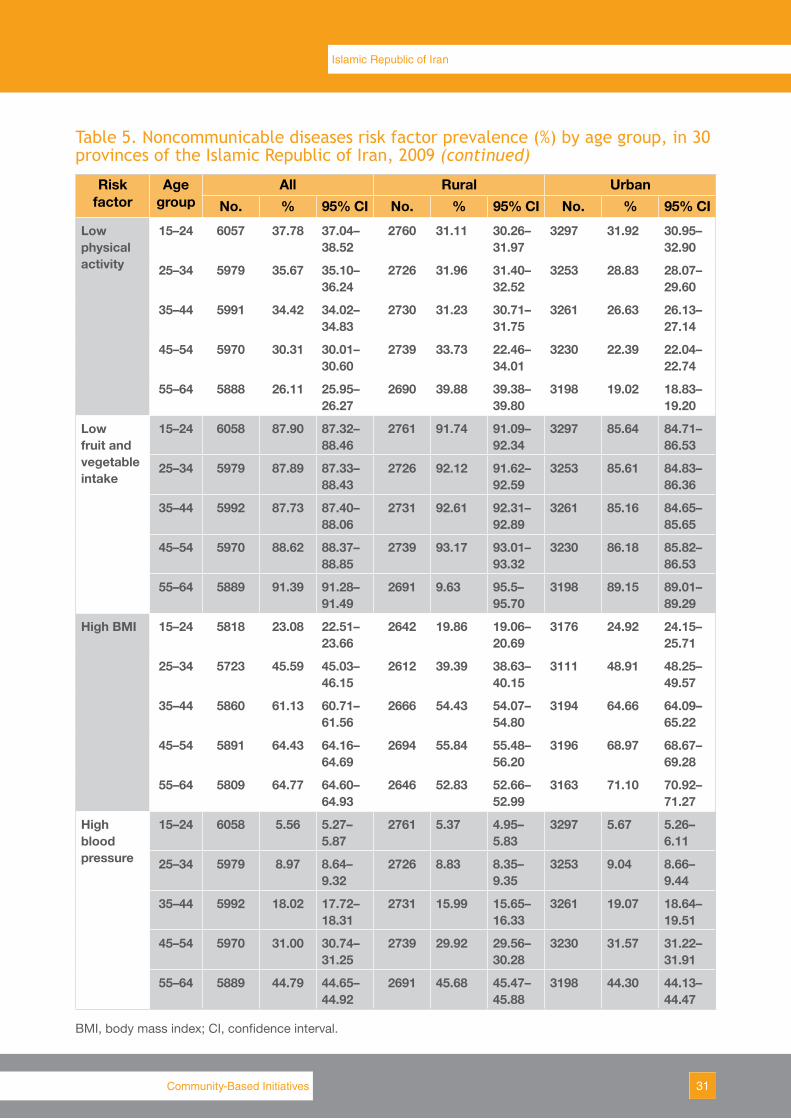
Table 5. Noncommunicable diseases risk factor prevalence (%) by age group, in 30 provinces of the Islamic Republic of Iran, 2009 (continued)
Risk factor
Age group
All Rural UrbanNo. % 95% CI No. % 95% CI No. % 95% CI
Low physical activity
15–24 6057 37.78 37.04–38.52
2760 31.11 30.26–31.97
3297 31.92 30.95–32.90
25–34 5979 35.67 35.10–36.24
2726 31.96 31.40–32.52
3253 28.83 28.07–29.60
35–44 5991 34.42 34.02–34.83
2730 31.23 30.71–31.75
3261 26.63 26.13–27.14
45–54 5970 30.31 30.01–30.60
2739 33.73 22.46–34.01
3230 22.39 22.04–22.74
55–64 5888 26.11 25.95–26.27
2690 39.88 39.38–39.80
3198 19.02 18.83–19.20
Low fruit and vegetable intake
15–24 6058 87.90 87.32–88.46
2761 91.74 91.09–92.34
3297 85.64 84.71–86.53
25–34 5979 87.89 87.33–88.43
2726 92.12 91.62–92.59
3253 85.61 84.83–86.36
35–44 5992 87.73 87.40–88.06
2731 92.61 92.31–92.89
3261 85.16 84.65–85.65
45–54 5970 88.62 88.37–88.85
2739 93.17 93.01–93.32
3230 86.18 85.82–86.53
55–64 5889 91.39 91.28–91.49
2691 9.63 95.5–95.70
3198 89.15 89.01–89.29
High BMI 15–24 5818 23.08 22.51–23.66
2642 19.86 19.06–20.69
3176 24.92 24.15–25.71
25–34 5723 45.59 45.03–46.15
2612 39.39 38.63–40.15
3111 48.91 48.25–49.57
35–44 5860 61.13 60.71–61.56
2666 54.43 54.07–54.80
3194 64.66 64.09–65.22
45–54 5891 64.43 64.16–64.69
2694 55.84 55.48–56.20
3196 68.97 68.67–69.28
55–64 5809 64.77 64.60–64.93
2646 52.83 52.66–52.99
3163 71.10 70.92–71.27
High blood pressure
15–24 6058 5.56 5.27–5.87
2761 5.37 4.95–5.83
3297 5.67 5.26–6.11
25–34 5979 8.97 8.64–9.32
2726 8.83 8.35–9.35
3253 9.04 8.66–9.44
35–44 5992 18.02 17.72–18.31
2731 15.99 15.65–16.33
3261 19.07 18.64–19.51
45–54 5970 31.00 30.74–31.25
2739 29.92 29.56–30.28
3230 31.57 31.22–31.91
55–64 5889 44.79 44.65–44.92
2691 45.68 45.47–45.88
3198 44.30 44.13–44.47
BMI, body mass index; CI, confidence interval.
32
Effects of urbanization on incidence of noncommunicable diseases
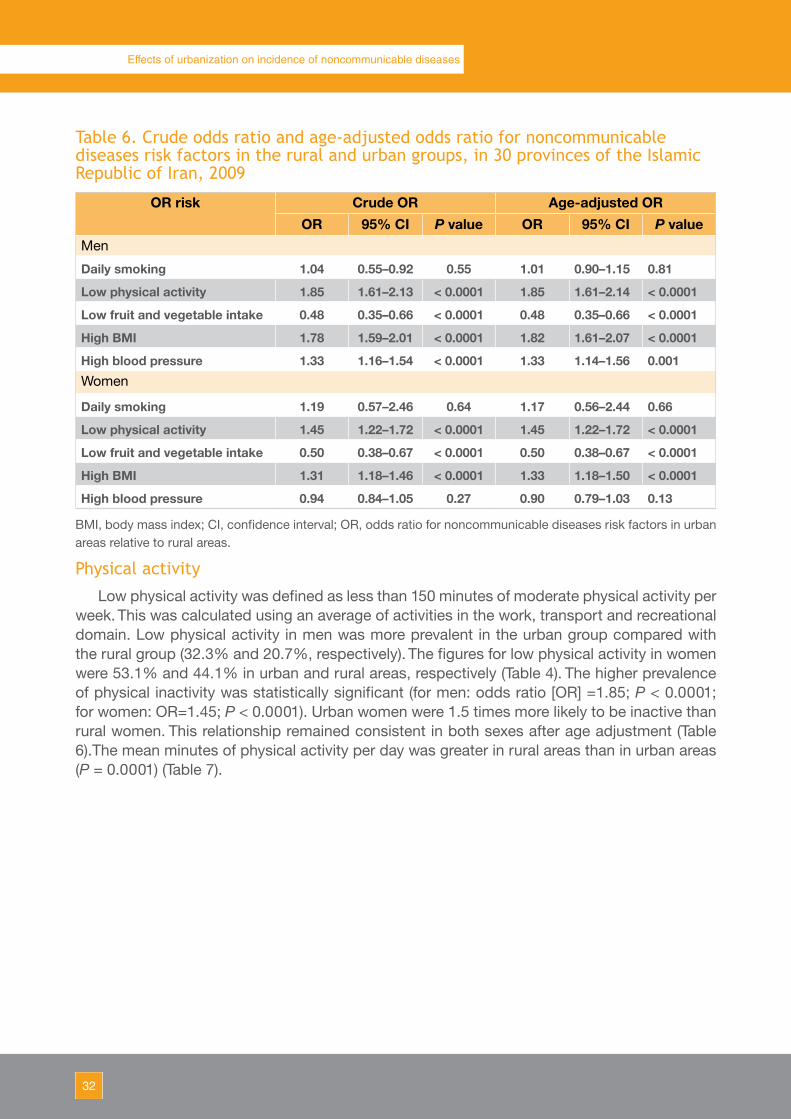
Table 6. Crude odds ratio and age-adjusted odds ratio for noncommunicable diseases risk factors in the rural and urban groups, in 30 provinces of the Islamic Republic of Iran, 2009
OR risk Crude OR Age-adjusted OROR 95% CI P value OR 95% CI P value
Men
Daily smoking 1.04 0.55–0.92 0.55 1.01 0.90–1.15 0.81
Low physical activity 1.85 1.61–2.13 < 0.0001 1.85 1.61–2.14 < 0.0001
Low fruit and vegetable intake 0.48 0.35–0.66 < 0.0001 0.48 0.35–0.66 < 0.0001
High BMI 1.78 1.59–2.01 < 0.0001 1.82 1.61–2.07 < 0.0001
High blood pressure 1.33 1.16–1.54 < 0.0001 1.33 1.14–1.56 0.001Women
Daily smoking 1.19 0.57–2.46 0.64 1.17 0.56–2.44 0.66
Low physical activity 1.45 1.22–1.72 < 0.0001 1.45 1.22–1.72 < 0.0001
Low fruit and vegetable intake 0.50 0.38–0.67 < 0.0001 0.50 0.38–0.67 < 0.0001
High BMI 1.31 1.18–1.46 < 0.0001 1.33 1.18–1.50 < 0.0001
High blood pressure 0.94 0.84–1.05 0.27 0.90 0.79–1.03 0.13
BMI, body mass index; CI, confidence interval; OR, odds ratio for noncommunicable diseases risk factors in urban areas relative to rural areas.
Physical activity
Low physical activity was defined as less than 150 minutes of moderate physical activity per week. This was calculated using an average of activities in the work, transport and recreational domain. Low physical activity in men was more prevalent in the urban group compared with the rural group (32.3% and 20.7%, respectively). The figures for low physical activity in women were 53.1% and 44.1% in urban and rural areas, respectively (Table 4). The higher prevalence of physical inactivity was statistically significant (for men: odds ratio [OR] =1.85; P < 0.0001; for women: OR=1.45; P < 0.0001). Urban women were 1.5 times more likely to be inactive than rural women. This relationship remained consistent in both sexes after age adjustment (Table 6).The mean minutes of physical activity per day was greater in rural areas than in urban areas (P = 0.0001) (Table 7).
33Community-Based Initiatives
Islamic Republic of Iran
Table 7. Values for noncommunicable diseases risk factors, per urbanization group, in 30 provinces of the Islamic Republic of Iran, 2009
Outcome Urban-ization group
Subsample size
Mean SD 95% CI Regression or K-W testa P value
Men
Time spent in physical activity per week (minutes)
Rural 6804 1019.39 34.10 950.99–1087.80
0.0001*
Urban 8136 606.45 23.93 558.37–654.54
No. of servings of fruit and vegetables per day
Rural 6804 2.03 1.75 1.92–2.15 0.0001*
Urban 8136 2.61 2.30 2.41–2.81
BMI Rural 6697 23.45 4.24 23.26–23.63 <0.0001
Urban 8038 24.64 4.45 24.47–24.82
Systolic blood pressure (mmHg)
Rural 6560 121.16 14.93 120.66–121.65
<0.0001
Urban 7702 121.85 14.26 121.31–122.39
Diastolic blood pressure (mmHg)
Rural 6557 75.52 10.39 75.15–75.88 <0.0001
Urban 7699 78.39 10.36 77.90–78.88
Women
Time spent in physical activity per week (minutes)
Rural 6844 624.04 23.20 577.38–670.70
0.0001*
Urban 8103 342.07 16.68 308.58–375.57
No. of servings of fruit and vegetables per day
Rural 6844 2.27 1.81 2.15–2.39 0.0001*
Urban 8103 2.92 2.43 2.73–3.11
BMI Rural 6574 25.09 5.33 24.88–25.30 <0.0001
Urban 7806 25.99 5.59 25.76–26.23
Systolic blood pressure (mmHg)
Rural 6272 116.38 16.47 115.79–116.97
<0.0001
Urban 7323 113.34 15.92 112.72–113.97
Diastolic blood pressure (mmHg)
Rural 6268 76.39 10.39 75.90–76.88 0.48
Urban 7318 76.54 10.58 76.15–76.94
* P value for K-W test.BMI, body mass index; CI, confidence interval; K-W, Kruskal-Wallis; SD, standard deviation. a Means were compared using one-way ANOVA (analysis of variance) or the K-W test when assumptions for ANOVA were not met.
34
Effects of urbanization on incidence of noncommunicable diseases
Low fruit and vegetable consumption
Low fruit and vegetable intake was defined as less than five portions per day. The prevalence rate of low fruit and vegetable intake was high for both sexes (92.4% and 85.8% in rural and urban settings, respectively). The prevalence rate of low vegetable intake for males in rural and urban groups was 93.8% and 87.9%, respectively while for females the rate was 91% and 83.7% in rural and urban groups, respectively (Table 2.2). For both men and women, this difference was statistically significant at P < 0.0001 (Table 2.5).
High BMI
Overweight or obesity was defined by a BMI of 25 or above. BMI was higher in the urban areas than the rural areas. A total of 47.2% of the urban group had a BMI ≥ 25, compared with 38% of the rural population (Table 2.2). Females were more overweight than men in both rural (45.5% and 30.7% of women and men, respectively) and urban areas (50.9% and 43.5% of women and men, respectively) (Table 2.2). The odds of having a high BMI were 1.8 times higher among urban men relative to rural men (P value < 0.0001). This relationship remained for women with an odds ratio of 1.3 (P value < 0.0001). The greater prevalence of high BMI in urban areas was found among all age groups and the odds ratio remained significant in the age-adjusted models (Tables 2.3 and 2.4).
High blood pressure
High blood pressure was defined as systolic blood pressure equal to or greater than 140 mmHg or diastolic blood pressure equal to or greater than 90 mmHg. The overall prevalence rate of high blood pressure was 16.5% among the urban group and 15.3% among the rural group. Males showed a higher prevalence rate in urban settings than in rural settings (17.2% versus 13.8%, respectively), but females show a higher prevalence rate in rural settings than urban settings (16.9% versus 15.7%, respectively) (Table 2.2). In both rural and urban areas, high blood pressure was more prevalent in those aged 45–64 years (Table 2.3). Both the mean systolic and diastolic pressure were significantly higher in men in urban settings than in rural settings (Table 2.5). Although in women diastolic blood pressure was higher in urban than rural settings the difference was not significant. The prevalence of high blood pressure was positively associated with urbanization in men (Table 2.4). Even after age adjustment, there was a significant difference in the results. However, this relationship was not significant for women (P = 0.27).
DiscussionThe term “urbanization” describes the process whereby a society changes from a rural to
an urban way of life. It refers also to the gradual increase in the proportion of people living in urban areas (1).
In this study, urbanization was measured based on population size, density and level of education, and risk factors for noncommunicable diseases (e.g. smoking, low physical activity) and anthropometric data (weight, BMI and blood pressure) were measured in rural and urban populations.
In a study on prevalence of smoking among young people in Papua New Guinea in 1997, a higher rate of smoking was found among males but there was a higher prevalence of noncommunicable diseases among females (15). In 2008, WHO estimated that almost two thirds of all deaths, or 36 million, were caused by noncommunicable diseases and nearly 80%

35Community-Based Initiatives
Islamic Republic of Iran
of these deaths occurred in low- and middle-income countries. Tobacco use is the leading preventable risk factor for noncommunicable diseases and, globally, more than 1 billion people smoke. Tobacco use causes one in six noncommunicable diseases, is a risk factor for six of the world’s eight leading causes of death and causes nearly 6 million deaths per year (16).
This study found no significant association between prevalence of tobacco use and urbanization for either men or women and this trend remained after adjustment for age. However, although the results were not significant at the level of P < 0.05, by increasing the significance level to P < 0.10 some results became significant.
In 2003, a study assessed the relationship between diet, physical activity and BMI among children in Isfahan, Islamic Republic of Iran and found that physical activity was significantly higher among boys than girls and among rural residents than urban residents (17). In Tamil Nadu, India, researchers found that for both men and women, urbanization was negatively associated with physical activity, although physical activity was found to be low even in the least urbanized groups (18).
The study in India also found no significant difference in the prevalence of low fruit and vegetable consumption across urbanization groups, either for men or women. However, they did find a positive association (P < 0.05) between urbanicity and the mean number of portions of fruit and vegetables consumed per day by both men and women (18).
The current study in the Islamic Republic of Iran also found that for men, urbanization was associated with physical inactivity. The odds of physical inactivity in urban men were almost twice that for rural men. Urban women were 1.5 times more likely to be inactive than rural women. This relationship remained consistent in both sexes after age adjustment.
Unlike the Indian study, this study found significant differences in the prevalence of low fruit and vegetable consumption, with people in rural areas consuming fewer fruit and vegetables than the urban population. This relationship remained consistent in both sexes, before and after age-adjusted analyses.
Ezzati et al. found that both BMI and blood cholesterol levels rose rapidly with the increase in national income and level of urbanization (3). A study in Sri Lanka also showed a greater increase in BMI and other risk factors for cardiovascular disease in urban areas than rural areas (6).
In the current study, mean BMI in urban areas was also significantly greater than rural areas for both sexes. The odds of having a high BMI were 1.8 times higher among urban men relative to rural men and this relationship remained for women with an odds ratio of 1.3. The odds ratio remained significant in the age-adjusted models.
Mufunda et al. found that hypertension prevalence, defined as blood pressure over 160/95 mmHg or taking hypertension medication, was higher in urban settings compared with rural settings in most countries (19). In some studies, blood pressure was higher in men than in women, but the opposite was true in other studies. However, using the current WHO definition of hypertension as blood pressure equal to or above 140/90 mmHg, Mufunda et al. found an even greater rural–urban difference. They also found prevalence was lowest in the rural areas and increased with socioeconomic status. Some differences were also noted with different geographic areas.
In this study, the prevalence of high blood pressure was also positively associated with urbanization in men. Even after age adjustment, there was a significant difference in the results. However, this relationship was not significant for women.
36
Effects of urbanization on incidence of noncommunicable diseases
ConclusionThe hypothesis that a relationship exists between urbanization and noncommunicable
disease risk factors has been partially supported by the findings of this study, which found that people living in cities are more likely to be at risk of noncommunicable diseases than people living in rural areas. Systematic review of studies measuring urbanization as a risk factor for chronic disease found few empirical studies. Most studies relied on secondary data and provided population level summaries at an area level. Based on the study conclusions, a number of action points were identified.
• Conduct a more comprehensive study to assess the process of urbanization and its effect on chronic disease risk factors.
• Consider urbanization as a process rather than a static measure and include and analyse individual and area level measures. Area-level measures should not only include traditional measures such as population size and density, but should also include measures such as quality of roads, distances to markets, types of markets available, transport options, types and accessibility of employment, health services, and so on. Other methods of data collection such as geographical information systems should also be considered.
• Construct a comprehensive measure of urbanization using qualitative and quantitative data. The definition of urbanization should be validated where appropriate at an area level, defined by the population studied. Ideally, data informing this process should have temporal and seasonal stability at baseline and follow-up points.
AcknowledgementThe authors thank the Center for Noncommunicable Diseases Control, Ministry of Health
and Medical Education, Tehran for supporting the previous study on noncommunicable disease risk factors and for allowing use of these data in this analysis.
References1. Godfrey R, Julien M. Urbanisation and health. Clinical Medicine (London, England), 2005,
5:137–141. 2. Choi YJ et al. Rapidly increasing diabetes-related mortality with socio-environmental changes
in South Korea during the last two decades. Diabetes Research and Clinical Practice, 2006, 74:295–300.
3. Ezzati M et al. Rethinking the “diseases of affluence” paradigm: global patterns of nutritional risks in relation to economic development. PLoS Medicine, 2005, 2:404–412.
4. Popkin BM. The nutrition transition and its health implications in lower-income countries. Public Health Nutrition, 1998, 1:5–21.
5. The world health report 2007: global public health security in the 21st century – a safer future. Geneva, World Health Organization, 2007.
6. Boutayeb A, Boutayeb S. The burden of non communicable diseases in developing countries. International Journal for Equity in Health, 2005, 4:2.
7. Reddy KS, Yusuf S. Emerging epidemic of cardiovascular disease in developing countries. Circulation, 1998, 97:596–601.
8. Vlahov D, Galea S. Urbanization, urbanicity, and health. Journal of Urban Health: Bulletin of the New York Academy of Medicine, 2002, 79 (Suppl. 1): S1–S12.
37Community-Based Initiatives
Islamic Republic of Iran
9. Mendez MA, Popkin BM. Globalization, urbanization and nutritional change in the developing world. The Electronic Journal of Agricultural and Development Economics, 2004, 1:220–241.
10. Mohan V et al. Urban rural differences in prevalence of self-reported diabetes in India–the WHO-ICMR Indian NCD risk factor surveillance. Diabetes Research and Clinical Practice, 2008, 80:159–168.
11. Galea S, Freudenberg N, Vlahov D. Cities and population health. Social Science & Medicine (1982), 2005, 60:1017–1033.
12. Hill JO, Peters JC. Environmental contributions to the obesity epidemic. Science, 1998, 280:1371–1374.
13. Sobngwi E et al. Exposure over the life course to an urban environment and its relation with obesity, diabetes, and hypertension in rural and urban Cameroon. International Journal of Epidemiology, 2004, 33:769–776.
14. Galea S, Vlahov D. Urban health: evidence, challenges, and directions. Annual Review of Public Health, 2005, 26:341–365.
15. Hiawalyer G. Smoking prevalence among young people in Papua New Guinea. Pacific Health Dialog, 2002, 9:209–213.
16. Global status report on noncommunicable diseases. Geneva, World Health Organization, 2010.
17. Roya Kelishadi et al. Association of physical activity and dietary behaviors in relation to the body mass index in a national sample of Iranian children and adolescents: CASPIAN Study. Bulletin of the World Health Organization, 2007, 85:19–26.
18. Allender S et al. Level of urbanization and non-communicable diseases risk factors in Tamil Nadu, India. Bulletin of the World Health Organization, 2010, 88: 297–304.
19. Mufunda J et al. Emerging non-communicable disease epidemic in Africa. Ethnicity & Disease, 2006, 16:521–526.


Pakistan


41Community-Based Initiatives
Introduction
Urbanization at different levels is seen all over the globe. Unhealthy lifestyles act as precipitating risk factors for some noncommunicable diseases such as hypertension, diabetes mellitus, dyslipidaemia and obesity. The main effect of unhealthy lifestyles will be seen in developing countries, where the majority of sufferers will be of a younger age group, belong to a lower socioeconomic class and experience premature onset of disease (1). The reason for this unhealthy lifestyle change is that high-fibre, healthy and regular food intake has been replaced by refined and unhealthy foods and irregular eating times. Physical activity in the form of walking or using a bicycle to reach the workplace has been replaced by rapid commuting and playgrounds are being replaced by skyscrapers. Tobacco consumption is also on the rise (2).
It is predicted that by the year 2020, over 60% of all deaths in developing countries will be related to noncommunicable diseases and, among these, cardiovascular diseases will be the leading disease. In these countries the prevalence of diabetes mellitus will also double in the next quarter of a century (2). It is reported that BMI and blood cholesterol levels rise rapidly with an increase in a nation’s income and its level of urbanization and that this association is more evident in urban dwellers (3). Early or timely interventions at times when environmental conditions start to shift and risk factors begin to appear is likely to prevent and control these chronic, noncommunicable diseases (4).
The present study was undertaken to study the lifestyle patterns in two urban settings of Karachi, Pakistan, one belonging to a high socioeconomic group and the other to a lower socioeconomic group, to assess the association between urbanization and the known risk factors for chronic, noncommunicable diseases.
MethodologyKarachi is the most populous and urbanized city of Pakistan and has a constant migration
of students, businessmen and labourers from all over the country. The city therefore caters to all socioeconomic strata and has well-defined affluent, high socioeconomic localities neighboured by low- to middle-class socioeconomic dwellings and shanty houses. This study was planned on the hypothesis that urbanization in a given locality is associated with risk factors for chronic disease.
Setting
The study was carried at two urban sites, 5–6 km apart, in Karachi. The population at one site, referred to as the Defence Housing Society, has the most expensive land value and people living there have high socioeconomic status. This housing society is divided into eight phases, with phase 8 being the most newly developed and modern, while phase 1 and 2 were developed 30–40 years ago and are not so modern. Each house is built on 500–1000 m2 and has 4–6 bedrooms with attached bathrooms, plus a lawn, car, servants, and children in private schools. The population at the other site, referred to as the Muslim Colony, is of lower socioeconomic status with usually a rented or self-owned 100–150 m2 house with 1–3 small bedrooms, one communal bathroom, no lawn, no servants and their children study in public-sector schools. This site was used for comparing the effect of socioeconomic status on the risk factors for communicable diseases.
Pakistan
42
Effects of urbanization on incidence of noncommunicable diseases
Questionnaire and measuring urbanization
The measure of urbanization previously used and validated for use in the Philippines by Dahly et al. (5,6) was tailored for local use. A questionnaire was filled for each participant. This requested information related to the individual’s house structure, educational status, access to potable water, mode of transport, use of health services, latrine facilities, eating and sleeping habits and level of physical activity. The questionnaire was translated to the local language of Urdu for applying to participants and was validated by reverse translation. The questionnaire was filled in by an interviewer who underwent two days of training. Pilot testing was carried out before going to the households. An informed signed consent was taken from the head of the household and all participants before beginning the interview and physical examination.
Prevalence of noncommunicable disease risk factors
The data on risk factors for chronic diseases were taken from the National Health Survey carried out by the Pakistan Medical Research Council in collaboration with the statistics division of the Centers for Disease Control and Prevention, United States of America (7). The present survey included information on tobacco use, diet, physical activity, BMI and blood pressure. Data were also collected on the age, gender, level of education and occupation of each participant. The survey also collected addresses and household information from participants and this information was used to link data from the high and low socioeconomic groups to the individual risk factor data (8).
Study population groups
The study was carried out in an urban setting with two different socioeconomic populations. One sample of 400 individuals was taken from a high socioeconomic group and another sample of 400 individuals was taken from a lower socioeconomic group, making a total of 800 individuals.
The Defence Society has eight phases or sectors and two of these, phases 4 and 5, were chosen for the study. The streets within the phases were randomly picked and a house-to-house survey was conducted in each selected street until the sample of 400 participants was achieved. The same strategy was applied for the lower income population, except that no division of streets or areas was made and the sample houses were selected at random from all over the total area. For inclusion in the study, the persons should have been living in the same locality or house for at least 6 months and be between the ages of 15 and 64 years.
A consent form was filled out by each head of household. If there were more than two eligible individuals within one house, only two were selected to participate. It was preferred to select individuals at either extreme of the age spectrum within the same house rather than the same age, to get diversity in the sample. If a selected house did not have an eligible individual, or the individual did not give consent for the study, the next house was chosen and visited.
Participants were stratified by gender, and age was divided into 10-year age groups in both groups. Data were collected over two consecutive weeks, including Sundays and vacations.
Variables surveyed
Biological and anthropological risk factors were assessed by measuring the height, weight, blood pressure, BMI, physical activity, intake of fruit and vegetables and tobacco use for each participant. The BMI (kg/m2) was calculated from the height and weight of each participant. A BMI of 25 or above was taken as overweight.
43Community-Based Initiatives
Pakistan
Blood pressure was recorded in the right arm, in a sitting position, to the nearest 1 mmHg, using a mercury blood pressure monitor. Two readings were taken five minutes apart and the mean of the two was taken as the blood pressure. A systolic blood pressure of 140 mmHg or above and/or a diastolic of 90 mmHg or above were taken as hypertension.
The physical activity of the population during work was calculated following the WHO STEPwise module (9) and classified as inactive, moderately active and vigorously active.
The STEPwise nutritional module was used for the calculation of portions of fruit and vegetables (9). For calculation of vegetables, the number of servings taken per day was calculated by adding total vegetables taken per week multiplied by the number of vegetables in a serving and then dividing by 7. The same was done for fruit.
Tobacco use was defined as a current daily smoker of more than five cigarettes per day or tobacco chewing during the past 6 months.
Outcome variables
The risk factor prevalence for each outcome within the two study populations was calculated. In addition, the average intake of fruit and vegetables per week, days spent in physical activity per week, mean BMI, mean systolic blood pressure and mean diastolic blood pressure were calculated for the overall population and for the two separate study populations and for both genders.
Statistical analysis
The computer package SPSS (Statistical Packages of Social Sciences) version 11.0 was used for data feeding and analysis. Clinical characteristics were summarized in terms of frequencies and percentages for qualitative variables (i.e. sex, house structure, age group, educational, occupation status, etc.) and the mean and standard deviation for quantitative/continuous variables (age, height, weight, BMI, blood pressure, etc.). Statistical comparison was performed by the Chi-square test (χ2) and Fisher’s exact test for qualitative variables and by the Student t-test/analysis of variance (ANOVA) for quantitative/continuous variables among urban high versus lower socioeconomic groups. A P value of less than 0.05 was taken as statistically significant.
ResultsA total of 800 individuals between the ages of 15 and 64 years were interviewed, with
400 belonging to upper socioeconomic group and 400 to lower socioeconomic group. The parameters used to assess socioeconomic status of the population included ownership of a house, the structure of the house, the materials used for its construction, furnishings, and the availability of water and a flush latrine within the house. Possession of amenities such as a car, fridge and servants was also used to assess socioeconomic status.
In the high socioeconomic group, 88.8% of the houses were well furnished and cemented while only 8.8% were well furnished in the lower socioeconomic group. This difference was significant (P < 0.001). Although piped water was available at both sites, the residents of the upper socioeconomic group at most sites complained that they had to rely on tanker water supply as the supply of municipal water was insufficient and irregular. These concerns were marked on the pro forma. The lower socioeconomic group had no such issue (Table 8).
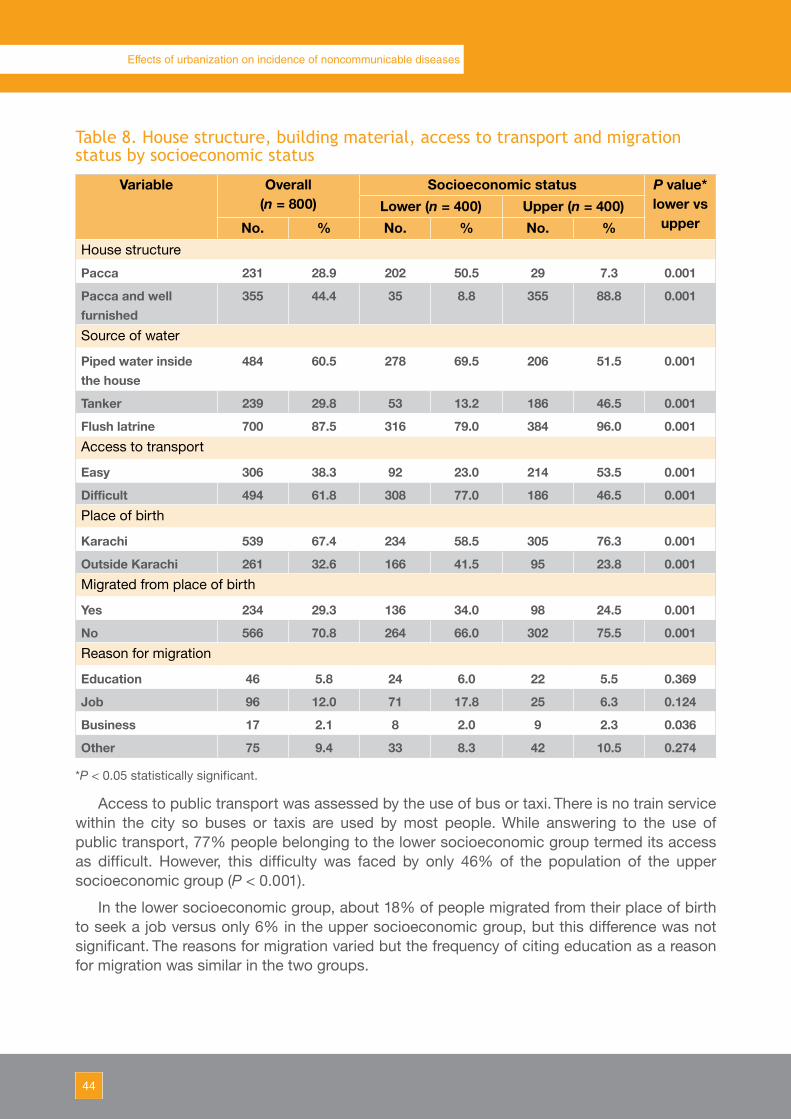
44
Effects of urbanization on incidence of noncommunicable diseases
Table 8. House structure, building material, access to transport and migration status by socioeconomic status
Variable Overall(n = 800)
Socioeconomic status P value* lower vs
upperLower (n = 400) Upper (n = 400)
No. % No. % No. %House structure
Pacca 231 28.9 202 50.5 29 7.3 0.001
Pacca and well furnished
355 44.4 35 8.8 355 88.8 0.001
Source of water
Piped water inside the house
484 60.5 278 69.5 206 51.5 0.001
Tanker 239 29.8 53 13.2 186 46.5 0.001
Flush latrine 700 87.5 316 79.0 384 96.0 0.001Access to transport
Easy 306 38.3 92 23.0 214 53.5 0.001
Difficult 494 61.8 308 77.0 186 46.5 0.001Place of birth
Karachi 539 67.4 234 58.5 305 76.3 0.001
Outside Karachi 261 32.6 166 41.5 95 23.8 0.001Migrated from place of birth
Yes 234 29.3 136 34.0 98 24.5 0.001
No 566 70.8 264 66.0 302 75.5 0.001Reason for migration
Education 46 5.8 24 6.0 22 5.5 0.369
Job 96 12.0 71 17.8 25 6.3 0.124
Business 17 2.1 8 2.0 9 2.3 0.036
Other 75 9.4 33 8.3 42 10.5 0.274
*P < 0.05 statistically significant.
Access to public transport was assessed by the use of bus or taxi. There is no train service within the city so buses or taxis are used by most people. While answering to the use of public transport, 77% people belonging to the lower socioeconomic group termed its access as difficult. However, this difficulty was faced by only 46% of the population of the upper socioeconomic group (P < 0.001).
In the lower socioeconomic group, about 18% of people migrated from their place of birth to seek a job versus only 6% in the upper socioeconomic group, but this difference was not significant. The reasons for migration varied but the frequency of citing education as a reason for migration was similar in the two groups.
45Community-Based Initiatives
Pakistan
In the lower socioeconomic group, most (37%) women worked within their own house as housewives, followed by private service (22.8%) and students (14%). In the higher socioeconomic group, the majority of women worked in private service (29.5%) followed by housewives (26%) and students (20%).
Demographic characteristics
The gender distribution in the overall population showed a slight preponderance of females (53%) and this persisted in both socioeconomic group.
Age distribution at the two sites showed more people 55 years or above in the upper socioeconomic group.
The majority of participants in the upper socioeconomic group were educated; 60% had graduate degrees and 30% were matriculate, having passed class 10 or above. Only 1.5% were illiterate. In the lower socioeconomic group, 22% participants had passed primary school, 25% were matriculate, while 21% were illiterate. Higher education was significantly more common in the upper socioeconomic group (P < 0.001).
Urbanization and risk factors
Smoking and tobacco chewing
About 12–13% of the population in each of the groups smoked more than five cigarettes a day and 3.2–9.5% were tobacco chewers (Table 9). Daily smoking was found in 28% of the males belonging to the lower socioeconomic group versus 23% of males in the upper socioeconomic group. Smoking was higher (2.8%) in females belonging to the upper socioeconomic group compared with females belonging to the lower socioeconomic group (0.5%). Tobacco chewing with paan (beetle leaf with lime, catechu and beetle nut) was significantly higher in the lower socioeconomic group compared with the upper socioeconomic group and between genders it was higher in men than women (Tables 9 and 10).
Physical activity
Exercise as a part of health awareness and a healthy lifestyle was evaluated for both groups. Inactive lifestyle or low physical activity was found in 32% of the upper socioeconomic group compared with 17% of the lower socioeconomic group and this difference was significant (P < 0.001) (Tables 9 and 10).
Fruit and vegetable consumption
Fruit and vegetable consumption was calculated by portions consumed per day (Table 11). One serving of vegetables per day was consumed by 28% of the population in the lower socioeconomic group and 24% in the upper socioeconomic group but this difference was not significant. Consumption of more than two servings was significantly more in the upper socioeconomic group and this trend persisted in both sexes. One serving of fruit per day was consumed by 76% of the lower socioeconomic group compared with 26% of the upper socioeconomic group, while more than two servings were consumed by 59% of the upper socioeconomic group compared with 7.8% of the lower socioeconomic group and these differences were significant. More fruit was consumed by both sexes in the upper socioeconomic group.
Information was also collected on the consumption of fat, oil, sugar and processed food and on food cravings to obtain in-depth information about overall diet. Both populations were seen to be consuming fat-rich, oily and sugary food frequently.

46
Effects of urbanization on incidence of noncommunicable diseases
Table 9. Noncommunicable disease risk factor prevalence (%) in lower (n = 400) and upper (n = 400) socioeconomic groups
Risk factor Socioeconomic group
All Male Female% 95% CI % 95% CI % 95% CI
Daily smoking Lower 13.2 9.8–16.5 28.0 23.6–32.4 0.5 0.1–1.2
Upper 12.2 8.9–15.4 22.9 18.7–27.0 2.8 1.1–4.4
Paan with tobacco
Lower 9.5** 6.6–12.4 17.7** 12.2–23.2 2.3 0.3–4.4
Upper 3.2 1.5–4.9 5.3 2.1–8.5 1.4 0.1–3.0
Low physical activity
Lower 17.0 13.3–20.6 21.5 17.4–25.5 13.1 9.7–16.4
Upper 32.0** 27.4–36.5 36.2** 31.4–40.9 28.3** 23.8–32.7
Low fruit Lower 92.0** 89.3–94.6 94.6** 91.3–97.8 89.7** 85.4–94.0
Upper 40.5 35.6–45.3 38.3 31.7–44.8 42.4 35.7–49.0
Low vegetables
Lower 54.7** 49.8–59.6 62.4** 55.4–69.4 48.1** 40.9–55.2
Upper 33.0 28.3–37.6 34.0 27.6–40.3 32.0 25.7–38.3
High BMI Lower 48.7 43.8–53.5 44.6 39.7–49.4 52.4* 47.5–57.3
Upper 42.3 37.4–47.1 43.3 38.4–48.2 41.5 36.6–46.3
High blood pressure
Lower 25.2 21.0–29.5 26.5 22.1–30.8 24.1 19.9–28.2
Upper 32.3* 27.7–36.8 30.9 26.3–35.4 33.5* 28.8–38.1
BMI, body mass index; CI, confidence interval; *P < 0.05 statistically significant; **P < 0.01 statistically significant.
Table 10. Odds ratios for noncommunicable disease risk factors in upper and lower socioeconomic groups
Risk factor Socioeconomic group
Male FemaleOR 95% CI OR 95% CI
Daily smoking Lower 1.0 – 1.0 –
Upper 0.76 0.4–1.2 6.20 0.7–49.8
Paan with tobacco Lower 1.0 – 1.0 –
Upper 0.26** 0.1–0.6 0.60 01–2.9
Low physical activity
Lower 1.0 – 1.0 –
Upper 2.07** 1.2–3.3 2.62** 1.5–4.4
Low fruit Lower 1.0 – 1.0 –
Upper 0.04** 0.0–0.1 0.08** 0.1–0.2
Low vegetables Lower 1.0 – 1.0 –
Upper 0.31** 0.2–0.4 0.51** 0.3–0.7
High BMI Lower 1.0 – 1.0 –
Upper 0.95 0.6–1.4 0.64* 0.4–0.9
High blood pressure
Lower 1.0 – 1.0 –
Upper 1.24 0.7–2.0 1.59 0.9–2.5
BMI, body mass index; CI, confidence interval; OR, odds ratio; *P < 0.05 statistically significant; **P < 0.01 statistically significant.
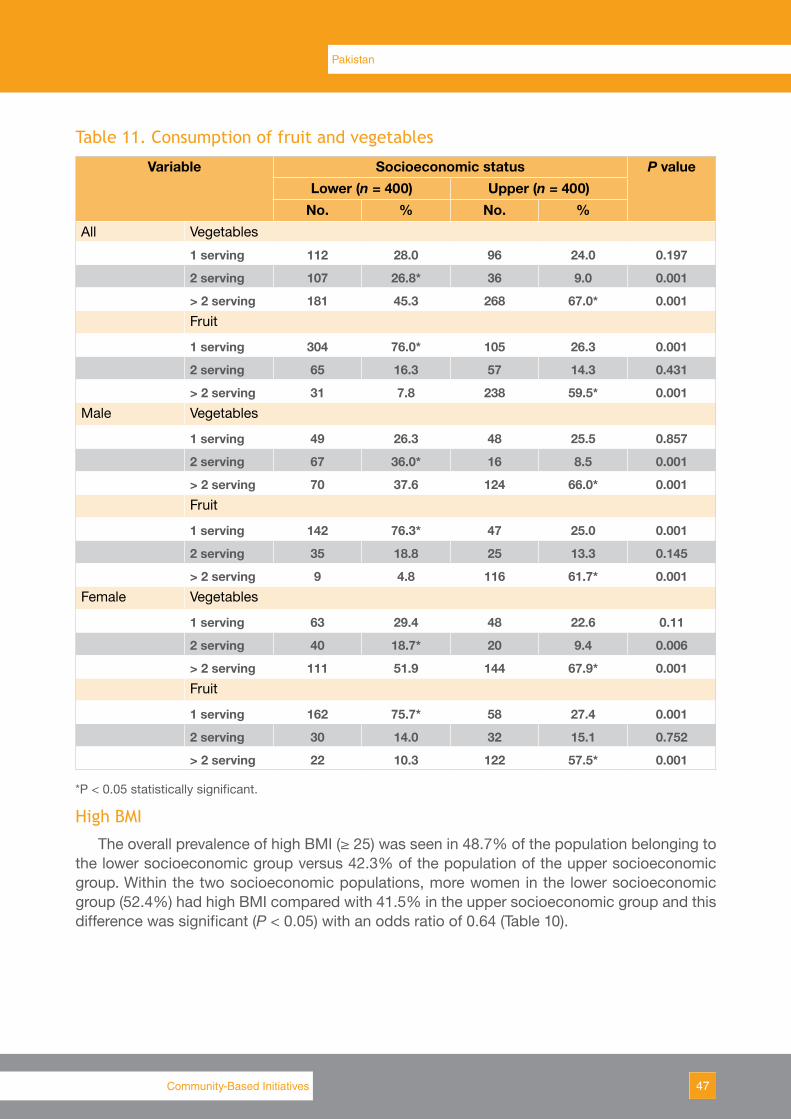
47Community-Based Initiatives
Pakistan
Table 11. Consumption of fruit and vegetables
Variable Socioeconomic status P valueLower (n = 400) Upper (n = 400)
No. % No. %All Vegetables
1 serving 112 28.0 96 24.0 0.197
2 serving 107 26.8* 36 9.0 0.001
> 2 serving 181 45.3 268 67.0* 0.001Fruit
1 serving 304 76.0* 105 26.3 0.001
2 serving 65 16.3 57 14.3 0.431
> 2 serving 31 7.8 238 59.5* 0.001Male Vegetables
1 serving 49 26.3 48 25.5 0.857
2 serving 67 36.0* 16 8.5 0.001
> 2 serving 70 37.6 124 66.0* 0.001Fruit
1 serving 142 76.3* 47 25.0 0.001
2 serving 35 18.8 25 13.3 0.145
> 2 serving 9 4.8 116 61.7* 0.001Female Vegetables
1 serving 63 29.4 48 22.6 0.11
2 serving 40 18.7* 20 9.4 0.006
> 2 serving 111 51.9 144 67.9* 0.001Fruit
1 serving 162 75.7* 58 27.4 0.001
2 serving 30 14.0 32 15.1 0.752
> 2 serving 22 10.3 122 57.5* 0.001
*P < 0.05 statistically significant.
High BMI
The overall prevalence of high BMI (≥ 25) was seen in 48.7% of the population belonging to the lower socioeconomic group versus 42.3% of the population of the upper socioeconomic group. Within the two socioeconomic populations, more women in the lower socioeconomic group (52.4%) had high BMI compared with 41.5% in the upper socioeconomic group and this difference was significant (P < 0.05) with an odds ratio of 0.64 (Table 10).

48
Effects of urbanization on incidence of noncommunicable diseases
Table 12. General health information
General health information Socioeconomic status P valueLower (n = 400) Upper (n = 400)
No. % No. %
Arthritis No 367 91.8 376 94.0 0.216
Yes 33 8.3 24 6.0
Asthma No 388 97.0 382 95.5 0.264
Yes 12 3.0 18 4.5
Diabetes No 377 94.3 375 93.8 0.766
Yes 23 5.8 25 6.3
Hypertension No 360 90.0 359 89.8 0.907
Yes 40 10.0 41 10.3
Tuberculosis No 398 99.5 399 99.8 0.563
Yes 2 0.5 1 0.3
Heart disease No 399 99.8 399 99.8 1.000
Yes 1 0.3 1 0.3
Pneumonia No 399 99.8 384 96.0 0.001
Yes 1 0.3 16 4.0*
*P < 0.05 statistically significant.
High blood pressure
The prevalence of high blood pressure was greater (32.3%) in the upper socioeconomic group compared with the lower socioeconomic group (25.2%) and this difference was significant (P < 0.05). This trend persisted in women belonging to the upper socioeconomic group (33.5%) compared with women in the lower socioeconomic group (24.1%) but the odds ratio of 1.59 was not significant. There was no difference in men (Tables 9 and 10).
Associated diseases
Of the common noncommunicable diseases, heart disease was significantly more common in the population belonging to the upper socioeconomic group (P < 0.001) while diabetes was equally frequent in both groups (Table 12).
DiscussionThe effect of urbanization on the risk factors for noncommunicable disease was studied
in two different socioeconomic populations. The study showed some direct and indirect relationships between urbanization and noncommunicable diseases risk factors.
The key noncommunicable disease risk factors related to lifestyle were tobacco use, fruit and vegetable intake and physical activity, while biological risk factors included diabetes, high blood pressure, hypercholesterolaemia and obesity. A report on health indicators of Pakistan (10) showed that noncommunicable diseases and injuries are the top 10 causes of mortality and morbidity in Pakistan (11), accounting for 54.9% of total deaths (12).
49Community-Based Initiatives
Pakistan
The Pakistan Medical Research Council conducted a National Health Survey in 1994 (10); the data showed tobacco use in 54% of men and 22% of women. Another study carried out in 2005 in Islamabad showed a 41% and 7% prevalence of smoking in men and women, respectively (9). The diet and physical activity data collected in Islamabad in 2005 showed that 65% and 79% of the urban and rural population, respectively, took less than one serving of fruit per day and over 90% of the population consumed less than two servings of vegetables per day (10). The present study also showed a lower consumption of fruit and vegetables by the lower socioeconomic group and thus showed them to be vulnerable to noncommunicable disease risk factors.
The regional study carried out on the healthy lifestyles of the Pakistani population looked at the physical activity of the population and classified the physical activity into three domains: during leisure, at work and during transport. In the transport domain, 88% of the population of both rural and urban areas was active while in the leisure domain more than 90% of the population was inactive (10). In the present study, it was seen that the upper socioeconomic population had less physical activity in both genders but this sedentary lifestyle was more evident in females belonging to the upper socioeconomic group.
Overweight and obesity are associated risk factors for noncommunicable diseases. According to WHO, a BMI of 25 and above is classified as overweight and a BMI of 30 and above is classified as obese (1).The National Health Survey of Pakistan (1990–94) (10) used the WHO criteria for defining obesity. Lower cut-off points have been recommended for Asians following many reports on increased comorbidities seen for Asians having lower BMI. Therefore, it was suggested that a BMI > 23 be used for overweight and a BMI > 25 for obesity in Asians (1). The National Action Plan for Non Communicable Diseases First Round Surveillance (9) study reported that 45.8% and 31.2% of the urban population and rural population, respectively, were above the normal weight. When the Asian BMI classification was applied to this study population these figures showed that 62.6% and 48.6% of the urban and rural population, respectively, were overweight. In the present study, the older WHO definition was used to classify BMI and accordingly 42% and 48.7% of the upper socioeconomic and lower socioeconomic group, respectively, had a BMI > 25 and were thus labelled as being overweight. It is possible that by using a higher cut-off we might have underreported the number of overweight and obese individuals.
The data showed that 17.9% of the population over the age of 15 years and 33% of the population over the age of 45 years had hypertension (7). Among the hypertensive group, 58% men and 65% women were obese. The National Health Survey also reported a 10% prevalence of diabetes. A similar prevalence of hypertension (15% in those over the age of 18 years and 36% in those over 45 years) has been reported from northern Pakistan (13). As hypertension, diabetes and obesity are risk factors for developing noncommunicable diseases it can be assumed that this hypertensive, diabetic and obese population is at a high risk of developing noncommunicable diseases.
The National Health Survey of Pakistan (1990–94) collected biometric and anthropometric data to obtain an authentic and objective measure of noncommunicable disease risk. The present study also used the same anthropometric tools and found that high blood pressure (32.3%) and low physical activity (32%) were seen in the high socioeconomic group. With a

50
Effects of urbanization on incidence of noncommunicable diseases
10% prevalence of diabetes mellitus in the Pakistani population, sedentary lifestyle, obesity and consumption of fatty and sugary food by both socioeconomic groups makes them vulnerable to many of the noncommunicable diseases. There is an urgent need to change the lifestyle of our population using the media and education.
Data from other countries have shown differences in health in urban and rural areas (3,14–17). Studies from south Asia have shown a higher prevalence of noncommunicable disease risk factors in urban areas compared with rural areas (18–22) and one epidemiological study showed a lower prevalence of coronary heart disease in rural adults than in urban adults (23). Further studies are required to study the association of risk factors for noncommunicable disease within urban versus rural setting and within the different socioeconomic groups.
AcknowledgementsThe authors thank WHO and the Pakistan Medical Research Council for supporting this
study. The efforts of the team supervisor Mr Mahmood Ahmed, his data collection teams and those who entered the data are greatly acknowledged.
References1. Reddy KS, Yusuf S. Emerging epidemic of cardiovascular disease in developing countries.
Circulation, 1998, 97:596–601. 2. Nisthar S. Health indicators of Pakistan. Gateway paper II. Islamabad, Heartfile, 2007.3. Arambepola C et al. Urban living and obesity: is it independent of its population and lifestyle
characteristics? Tropical Medicine & International Health, 2008, 13:448–457. 4. Allender S et al. Level of urbanization and non communicable disease risk factors in Tamil
Nadu, India. Bulletin of the World Health Organization, 2010, 88:297–304. 5. Dahly DL, Adair LS. Quantifying the urban environment: a scale measure of urbanicity
outperforms the urban–rural dichotomy. Social Science & Medicine (1982), 2007, 64:1407–1419.
6. Mendez MA, Popkin BM. Globalization, urbanization and nutritional change in the developing world. Electronic Journal of Agricultural and Development Economics, 2004, 1:220–241.
7. National health survey of Pakistan 1990–94. Islamabad, Pakistan Medical Research Council, Network Publication Services, 1998.
8. Pakistan integrated household survey 2005–06. Federal Bureau of Statistics, Government of Pakistan, Islamabad 2005–2006 (http://www.statpak.gov.pk/depts/fbs/statistics/hies05_06/complete.pdf, accessed xx month year).
9. STEPS instruments for noncommunicable disease risk factors (version 1.4). Geneva, World Health Organization, 2003 (http://www.who.int/ncd_surveillance/en, accessed 10 January 2011).
10. Nishtar S. Population-based surveillance of non-communicable diseases: 1st round, 2005. Islamabad, Ministry of Health, Heartfile, and Geneva, World Health Organization, 2006.
11. Hyder AA, Morrow RH. Applying burden of disease methods in developing countries: a case study from Pakistan. American Journal of Public Health, 2000, 90:1235–1240.
12. Nishtar S et al. Process, rationale, and interventions of Pakistan’s National Action Plan on Chronic Diseases. Preventing Chronic Disease 2006, 3:A14. Epub 2005 Dec 15.
13. Shah SM et al. Hypertension and its determinants among adults in high mountain villages of the northern areas of Pakistan. Journal of Human Hypertension, 2001, 15:107–112.
51Community-Based Initiatives
Pakistan
14. Misch KA. Ischaemic heart disease in urbanized Papua New Guinea. An autopsy study. Cardiology, 1988, 75:71–75.
15. Vorster HH et al. The nutrition and health transition in the North West Province of South Africa: a review of the THUSA (Transition and Health during Urbanisation of South Africans) study. Public Health Nutrition, 2005, 8:480–490.
16. Lin HC et al. Urbanization and stroke prevalence in Taiwan: analysis of a nationwide survey. Journal of Urban Health: Bulletin of the New York Academy of Medicine, 2007, 84:604–614.
17. Murray CJL, Lopez AD. Mortality by cause for eight regions of the world: Global Burden of Disease Study. Lancet, 1997, 349:1269–1276.
18. Chadha SL, Gopinath N, Shekhawat S. Urban–rural differences in the prevalence of coronary heart disease and its risk factors in Delhi. Bulletin of the World Health Organization, 1997, 75:31–38. PMID:9141748
19. Shetty PS. Nutrition transition in India. Public Health Nutrition, 2002, 5:175–182.20. Lubree HG et al. Body fat and cardiovascular risk factors in Indian men in three geographical
locations. Food and Nutrition Bulletin, 2002, 23 (Suppl.):146–149.21. Ramachandran A. Epidemiology of non-insulin-dependent diabetes mellitus in India. In:
Shetty PS, Gopalan C, eds. Diet, nutrition and chronic disease: an Asian perspective. London, Smith Gordon, 1998:38–41.
22. Gopalan C. Diet related non-communicable diseases in South and South East Asia. In: Shetty PS, McPherson K, eds. Diet, nutrition and chronic disease: lessons from contrasting worlds. London, Wiley, 1997:10–23.
23. Gupta R. Burden of coronary heart disease in India. Indian Heart Journal, 2005, 57:632–638.
Investing in health, particularly that of the poor, is central to the achievement of the Millennium Development Goals. In support of this strategy WHO's Regional Office for the Eastern Mediterranean is actively promoting in countries of the Region community-based initiatives like Basic Development Needs, Healthy Cities, Healthy Villages and Women in Health and Development. These approaches are based on the principle that good health status – an important goal in its own right – is central to creating and sustaining capabilities of poor people to meet their basic needs and to escape from poverty. The Community-Based Initiatives Series is aimed at facilitating the management of such initiatives. Users of the series may include government authorities, community representatives, WHO and other international agencies and nongovernmental organizations.
For further information contact: Community-Based Initiatives World Health Organization Regional Office for the Eastern Mediterranean PO Box 7608 Nasr City Cairo 11371, Egypt Tel.: +2(02) 2670 2535/2276 5029 Fax.: +2(02) 2670 2492/4 E-mail: [email protected]


