Recent Trends in Civil Engineering and Built Environment Vol. 2 No. 1 (2021) 350-361
© Universiti Tun Hussein Onn Malaysia Publisher’s Office
RTCEBE
Homepage: http://publisher.uthm.edu.my/periodicals/index.php/rtcebe
e-ISSN :2773-5184
*Corresponding author: [email protected] 2021 UTHM Publisher. All rights reserved. publisher.uthm.edu.my/periodicals/index.php/rtcebe
Effects of Vertical Irregularity at Upper Level
of 5-Storey Laboratory Steel Tower Using
Modal Analysis
Nurshahirah Rosle1, Ahmad Fahmy Kamarudin1,* 1Faculty of Civil Engineering and Built Environment,
Universiti Tun Hussein Onn Malaysia, Batu Pahat, Johor, 86400, MALAYSIA
* Corresponding Author Designation
DOI: https://doi.org/10.30880/rtcebe.2021.02.01.038
Received 30 January 2021; Accepted 28 April 2021; Available online 30 June 2021
Abstract: Buildings with vertical irregularity at upper level often amaze people with
its esthetical design and unique appearance. The increment of population and
urbanization force the engineers to come out with safe and unique building designs
occupied with its multi-functional spaces uses. However, irregular building design
build up from complex dynamic behavior compared to regular buildings design.
Therefore, a study was conducted to determine the effects of vertical irregularity at
upper level of 5-storey laboratory steel tower using modal analysis via STAAD.Pro
software. The dynamic characteristics of steel tower was investigated in terms of
predominant frequencies and mode shape. The results of bare frame (control tower)
were compared to previous laboratory testing for verification purpose before
implement the four cases of irregularity on the steel tower. The first three predominant
frequencies of bare frame and irregular cases were arranged according to their modes.
The frequencies of bare frame were f1 and f2 = 5.55Hz, and f3 = 7.21Hz with
percentage difference less than 10% from previous study. There were 3 type of mode
shapes experienced by the steel tower which were translational for mode 1 and 2, and
torsional for mode 3. Hence, vertical irregularities could be considered a risk for a
building compared to regular building design.
Keywords: Vertical Irregular, Modal Analysis, Staad.Pro, Dynamic Characteristics
1. Introduction
Irregular structure design has either mass, stiffness, or geometric regularity which is not uniform all
over the structure. Modern infrastructures often designed in different types of vertical irregularities. In
developed countries and metropolitan cities, these structures are more important as they enhance the
aesthetic nature and improve living conditions. These structures have become more complex from an
architectural point of view, with irregular shapes, geometry, mass, stiffness, and vertical irregularities,
etc.
Soft storey can be defined as an irregular building structure that was constructed according to
architectural decisions for a certain function requirement. It is also known as weak storey [1]. The
Rosle et al., Recent Trends in Civil Engineering and Built Environment Vol. 2 No. 1 (2021) p. 350-361
351
location of soft storey in a building could be various depends on the function such as leisure use, parking
or merchant use. The soft first and last story are the examples of building irregularity.
Irregular structures translated like an inverted pendulum under substantial ground shaking for
example footsteps, machineries, and wind that demand for ductility concentrated on the soft floor. As a
consequence, these structures tend to have inadequate stability and are prone to damage. As gravity
takes over, columns that experienced full axial gravity force drift without extra support which could
result to the collapse of the building if the safety in designing been ignored [2].
Nowadays, vertical irregularity is a common design build for modern type of buildings. Many
buildings were built with irregular configurations, and low stiffness structure in line as it functions such
as office, apartment, hospital and factory. During an earthquake, irregular structures with vertical
irregularities tends to experienced severe damage resulting from discontinuity in geometry, mass and
stiffness. The ground motion could bring more damage to the building with irregular geometry.
Behaviour of tall building was an important component to ensure efficient and secure building design
[3]. Therefore, it was undeniable that study of dynamic characteristic of a building was very important
in order to understand building behaviour under irregular structure arrangement. Modal analysis has
become a common method for detecting the vibration modes for a machine or structure because each
structure vibrates at its resonant frequency with high vibration amplitude. In order to improve its
strength and reliability at the design stage, it was essential to study the modal analysis, such as frequency
and mode shape characteristics of the structure in different operational circumstances [4]. Therefore, a
modal analysis was conducted to study the dynamic characteristics of the irregular beam arrangements
at upper level of a 5—storey steel tower using STAAD.Pro software. Four irregular arrangements on
the steel frame were modelled for their predominant frequencies and mode shapes.
The objectives were to determine the dynamic characteristics of steel tower under multiple cases of
vertical irregularity using modal analysis and to investigate the relationships between vertical
irregularity and the parameters of dynamic characteristics such as frequency and mode shape.
The significances were to design the irregular steel tower using modal analysis for an alternative
analysis method on the relationship between multiple cases of irregular steel tower and its dynamic
characteristics. Besides that, it also could assess the dynamic characteristics of irregular steel tower at
upper level based on their relationship on predominant frequency and mode shape.
2. Literature review
Previous study was conducted on a 10-storey building with two different irregularity by using an
equivalent static method from IS 1893-part 1: 2002 [3]. Another research using CSI-ETABS program
to study the damages resulted from different plan irregularities, during seismic actions of different
scales in Mexico [5]. The researches were tabulated in Table 1.
Some of the elements in dynamic characteristics of buildings consist of frequency and mode shape.
The dynamic characteristics can be used to determine the structure appearances by computing the
analytical models to interpret the performance of the structure [6]. In addition, the reactions of building
toward ambient excitations during drawing plan or re-evaluation period can be estimate by their
frequency and mode shape patterns of the building [7]. Moreover, there was a study stated that
frequency could gave impact in structural health monitoring techniques, which it could be used to
identify the physical harms on buildings [8].
Each building has its own natural or also known as predominant frequencies. A single-story
building have the natural periods at about 0.1 seconds, thus, if the building shake at 1 reciprocal, it is
equivalent to 0.1 seconds = 10 Hertz, or 10 complete cycles [8]. Meanwhile, a building with four floors
will contribute about 0.5 seconds time interval [9]. Table 2 shows previous studies on the predominant
frequency of building by some researchers.
Rosle et al., Recent Trends in Civil Engineering and Built Environment Vol. 2 No. 1 (2021) p. 350-361
352
Table 1: Findings for the past studies of irregular building arrangements
Author Methodology Remarks
[3] The analysis was analysed using the program CSI-
ETABS. To study the effects of irregularities on the
frames, the five frames were analysed and their lateral
storey deflection, storey drifts and base shears were
computed.
Irregularities considered two types:
Vertical irregularities (Stiffness, mass, geometry,
discontinuity)
Plan irregularities (torsion, re-entrant corners,
diaphragm discontinuity, out of plane offsets, non-
parallel systems)
Frame carry heavy loading
tends to suffer maximum
deflection signifies it is the
weakest and vulnerable
[5] Different geometric building shapes in Mexico were
modelled in SAP2000, taking one, two and four levels
into account to determine the effect of the geometric
shape on the seismic behaviour of elastic analysis
structures.
Irregular models of rectangular,
T, L and U plans were subjected
to a ten characteristics
accelerograms to get their
elastic deflection. From this
study, the more irregular the
building, constructions became
more vulnerable.
Table 2: Findings for the past studies of predominant frequency
Author Methodology Remarks
[10] An eighteen-storey building with
200 mm thickness of shear wall
was investigated to resist a
tendency to fracture arising from
lateral pressure. FDD methods
were used in order to acquire
singular values of the output
response PSD matrix with
frequency at a between 0 Hz until
10 Hz. The peak picking
techniques utilized to determine
frequency until the sixth order of
frequency.
The natural frequency of the building was tabulated in
table below.
Mode Natural frequency (Hz)
1st 1.07
2nd 1.27
3rd 2.44
4th 4.98
5th 5.47
6th 8.30
[11] The full scale of two-floor levels
reinforced concrete structure was
used throughout the test with 5.3
m length on East-West
orientation and 4.3 m length on
North-South orientation.
Validation of frequency between ambient vibration
test and force vibration test of the building were
tabulated in table below.
Mode Fv (Hz) Fa (Hz)
1st BM (EW) 1.83 1.88
1st BM (NS) 2.20 2.15
1st TM 3.18 3.17
2nd BM (EW) 5.67 6.05
2nd BM (NS) 6.50 6.67
2nd TM 9.49 9.95
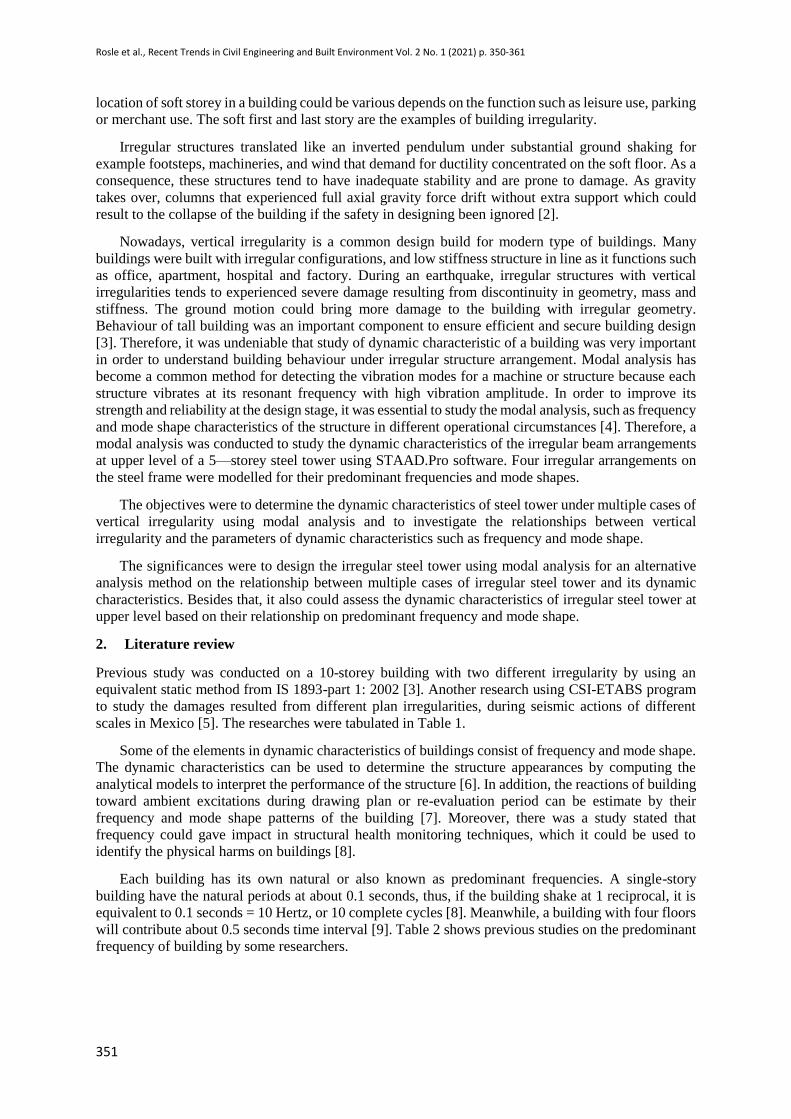
Mode shapes were formed under certain frequency that was applied on the building. Mode shape
of building known as the distortion of shape of building when it oscillates according to their
Rosle et al., Recent Trends in Civil Engineering and Built Environment Vol. 2 No. 1 (2021) p. 350-361
353
predominant frequency. There are three types of mode shapes in every 3D building which are the
motions of structure in X orientation, Y orientation and Z orientation known as torsion, as shown in
Figure 1.
Figure 1: Mode shapes patterns: motions in X orientation, Y orientation and torsion [12].
3. Methodology
3.1 Phase 1: Steel tower detailing
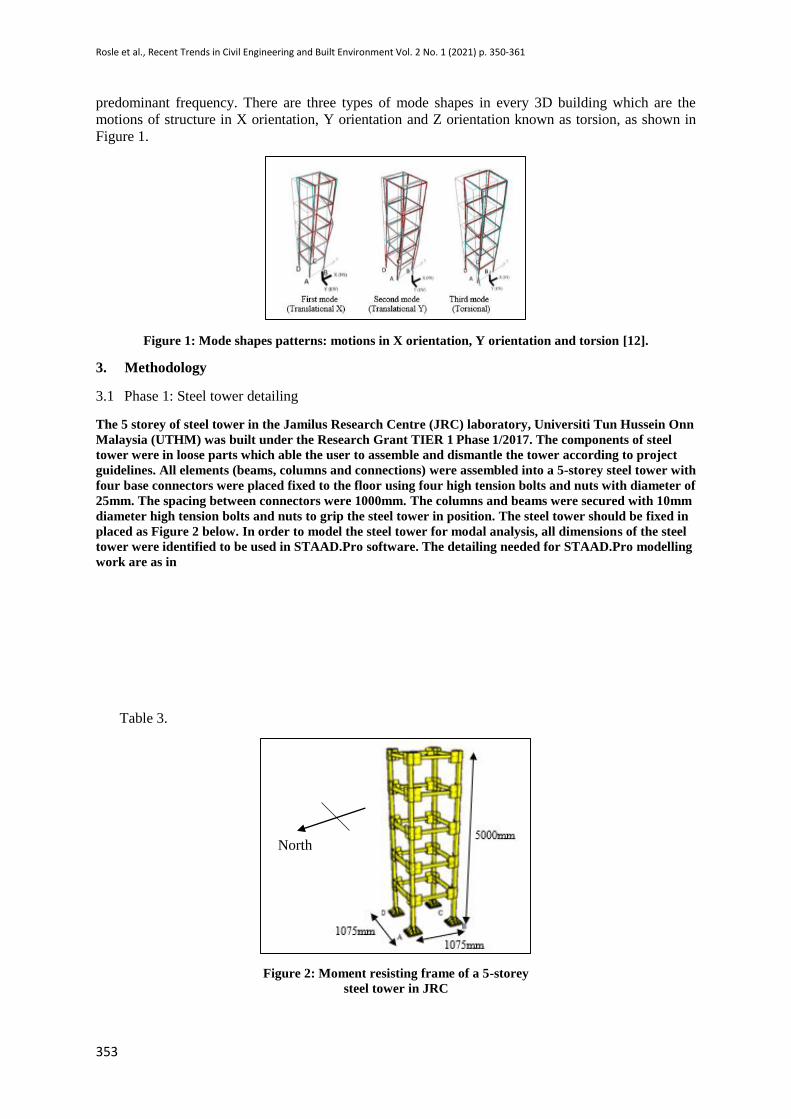
The 5 storey of steel tower in the Jamilus Research Centre (JRC) laboratory, Universiti Tun Hussein Onn
Malaysia (UTHM) was built under the Research Grant TIER 1 Phase 1/2017. The components of steel
tower were in loose parts which able the user to assemble and dismantle the tower according to project
guidelines. All elements (beams, columns and connections) were assembled into a 5-storey steel tower with
four base connectors were placed fixed to the floor using four high tension bolts and nuts with diameter of
25mm. The spacing between connectors were 1000mm. The columns and beams were secured with 10mm
diameter high tension bolts and nuts to grip the steel tower in position. The steel tower should be fixed in
placed as Figure 2 below. In order to model the steel tower for modal analysis, all dimensions of the steel
tower were identified to be used in STAAD.Pro software. The detailing needed for STAAD.Pro modelling
work are as in
Table 3.
Figure 2: Moment resisting frame of a 5-storey
steel tower in JRC
North
Rosle et al., Recent Trends in Civil Engineering and Built Environment Vol. 2 No. 1 (2021) p. 350-361
354
Table 3: Detailing needed for modal analysis [13]
No. Element
1 Standard BS EN 1993-1-8:2005
fy: 275 × 10-3 kN/mm2
λ: 300 × 10-3
E: 205kN/mm2
2 Beam and column Square hollow sections (SHS)
Steel grade S275
Length = 1000 mm
B x H = 77 mm×77mm
Thickness 3 mm
3 Connection Steel grade S275
High tension bolt grade 8.8 with diameter 10mm and 25mm
4 Support Fixed at base floor
5 Loading Self weight
3.2 Phase 2: Modal analysis
The steel tower was designed in 3D view using STAAD.Pro software. Some try and errors were
done until the output frequency reached the range of previous studies. By implementing this method, it
is shown that the high percentage of moment release applied produced low percentage reduction in
bending moment of beam. Thus, the percentage of moment release applied to the columns needed to be
lower than the percentage apply to the beams. The percentage of moment release that applied in the
steel tower was 80% for beam members and 28% for column members. The intermediate and top
connectors were assigned with partial moment release to indicate semi-rigid condition at the start and
end of every member.
To analyse the dynamic characteristics of steel tower model, the frequency results of bare steel
tower model that was constructed in STAAD.Pro software was compared with frequency results from
previous laboratory results that were conducted using accelerometer sensors and EFDD analysis. The
output frequency results that was used for verification was from bare frame with regular design.
Result verification with previous laboratory testing using ambient vibration test method is essential
to avoid errors during selection of predominant frequency of the steel tower. The previous laboratory
testing was done by using a real bare frame steel tower located at JRC Laboratory and obtained
frequency of the bare frame at f1 = 5.24Hz, f2 = 5.49Hz and f3 = 7.23Hz. This verification was done by
comparing predominant frequency value obtained from bare frame of STAAD.Pro modal analysis and
previous laboratory tests [14-15] using accelerometer sensors.
The existing bare frame model was modified into four types of vertical irregularities at upper level.
The results of frequency and mode shapes of bare frame was set as the reference value for initial design.
Another four designs were the irregular beam arrangements at upper level on the five-storey steel tower
as shown in Figure 3. The beams were removed one by one accordingly to create the irregular building
configuration along with soft storey effect.
Rosle et al., Recent Trends in Civil Engineering and Built Environment Vol. 2 No. 1 (2021) p. 350-361
355
Irregular 1 Irregular 2 Irregular 3 Irregular 4
Figure 3: Four types of irregular steel tower conditions at upper level
3.3 Phase 3: Relationship between vertical irregularity and the parameters of dynamic characteristics
A 5-storey steel tower model in STAAD.Pro was analysed to simulate the soft storey effect with
irregular beam arrangements at upper level. The model was used for determination of predominant
frequency and mode shapes of the steel frame under multiple cases of vertical irregularity.
Predominant frequencies of irregular beam arrangements at upper level of steel tower can be
determined from the frequencies of first three modes from each types of irregular steel tower. The
predominant frequencies graphs were arranged according to type of trendline used for the best fit
trendline. The relationship between irregularities cases and predominant frequencies of the steel tower
were established using the percentage difference of frequency for bare frame and irregular cases that
were calculated by using Equation 1 and Equation 2 below.
𝑃𝑒𝑟𝑐𝑒𝑛𝑡𝑎𝑔𝑒 𝑑𝑖𝑓𝑓𝑒𝑟𝑒𝑛𝑐𝑒 𝑓𝑜𝑟 𝑓𝑟𝑒𝑞𝑢𝑒𝑛𝑐𝑦 𝑜𝑓 𝑏𝑎𝑟𝑒 𝑓𝑟𝑎𝑚𝑒 (%)
=𝑓𝑚𝑜𝑑𝑎𝑙 𝑎𝑛𝑎𝑙𝑦𝑠𝑖𝑠 − 𝑓𝑙𝑎𝑏𝑜𝑟𝑎𝑡𝑜𝑟𝑦 𝑡𝑒𝑠𝑡𝑖𝑛𝑔
𝑓𝑙𝑎𝑏𝑜𝑟𝑎𝑡𝑜𝑟𝑦 𝑡𝑒𝑠𝑡𝑖𝑛𝑔
× 100% Eq. 1
𝑃𝑒𝑟𝑐𝑒𝑛𝑡𝑎𝑔𝑒 𝑑𝑖𝑓𝑓𝑒𝑟𝑒𝑛𝑐𝑒 𝑓𝑜𝑟 𝑓𝑟𝑒𝑞𝑢𝑒𝑛𝑐𝑦 𝑜𝑓 𝑖𝑟𝑟𝑒𝑔𝑢𝑙𝑎𝑟 𝑐𝑎𝑠𝑒𝑠 (%)
=𝑓𝑖𝑟𝑟𝑒𝑔𝑢𝑙𝑎𝑟 𝑐𝑎𝑠𝑒𝑠 − 𝑓𝑏𝑎𝑟𝑒 𝑓𝑟𝑎𝑚𝑒
𝑓𝑏𝑎𝑟𝑒 𝑓𝑟𝑎𝑚𝑒
× 100% Eq. 2
STAAD.Pro software could perform 2D and 3D mode shapes in which according to deflection plane
that was produced and find the specific trend or pattern between the variation on the bare frame and the
vertical irregularities at upper level. There were three predominant mode shapes for irregular steel tower
were generated from STAAD.Pro software where mode 1 and 2 experienced torsional mode while mode
3 experienced rotational mode.
4. Results and Discussion
The output results were obtained from modal analysis of 5 storey steel tower in JRC Laboratory, UTHM
in term of its predominant frequency and mode shapes under multiple cases of vertical irregularity. The
application of irregular cases in steel tower configurations able to change the predominant mode of
frequencies. The relationship of irregular cases versus predominant frequency and relationship of
irregular cases versus tower mode shapes were also discussed detail.
Rosle et al., Recent Trends in Civil Engineering and Built Environment Vol. 2 No. 1 (2021) p. 350-361
356
4.1 Predominant frequencies of bare frame and result verification
Result verification of predominant frequency from modal analysis method is vital to ensure the
accuracy of data for the dynamic characteristics of the steel frame. This data verification was conducted
by comparing predominant frequency value from modal analysis method and previous laboratory
testing. The results of predominant frequencies were obtained from modal analysis by using
STAAD.Pro software. The software produced three main modes where each mode had their own
predominant frequency of the bare frame. The first three modes of predominant frequencies of steel
bare tower were 5.55 Hz, 5.55 Hz, and 7.21 Hz. Two previous laboratory tests were selected to verify
the predominant frequencies from modal analysis method. From previous studies, the frequencies data
for control tower were the same where the first three predominant frequencies of bare frame (control
tower) were at 5.24 Hz, 5.49 Hz and 7.23 Hz as tabulated in Table 4. These predominant frequencies
were identified by placing accelerometer sensors at selected location on the steel tower and analysed by
using ARTeMIS software.
The percentage difference of predominant frequencies from each type of mode were calculated for
frequency data from modal analysis method and previous laboratory tests. The first, second and third
percentage difference according to their mode were 5.6%, 1.1% and 0.3% respectively. For the first and
second mode, the frequency values in modal analysis method were higher compared to previous
laboratory tests which made the percentage difference increased. Meanwhile, the percentage difference
for third mode was decreased due to lower value of frequency in modal analysis method compared to
previous laboratory tests. Overall, the frequency data was acceptable since the percentage difference
was less than 10% [16]
Table 4: Percentage difference for frequency data
Mode 1 2 3
Modal analysis method frequency (Hz) 5.55 5.55 7.21
Previous laboratory frequency (Hz) [14-15] 5.24 5.49 7.23
Percentage difference (%) 5.6 1.1 0.3
4.2 Predominant frequencies of multiple cases of vertical irregularity
The steel tower modelling was modelled with multiple cases of vertical irregularities. There were
four types of vertical irregular cases conducted at upper level of the steel tower. By using modal analysis
method, the predominant frequencies for each vertical irregular case were organised in Table 5 below.
Table 5: Predominant frequencies for vertical irregular cases
Mode Bare frame Irregular 1 Irregular 2 Irregular 3 Irregular 4
1 5.55 Hz 5.47 Hz 5.60 Hz 5.48 Hz 5.63 Hz
2 5.55 Hz 5.68 Hz 5.61 Hz 5.74 Hz 5.63 Hz
3 7.21 Hz 7.31 Hz 7.41 Hz 7.52 Hz 7.64 Hz
The frequencies were categorised according to their modes. Trendline was applied in the scattered
plot data as the best fit line to predict future values based on current data [17]. Mode 1 and 2 shows the
fluctuation in frequencies data for irregular cases. These fluctuations were caused by the removal of
North
D C D C D C D C D C
A B A B A B A B A B
Rosle et al., Recent Trends in Civil Engineering and Built Environment Vol. 2 No. 1 (2021) p. 350-361
357
beam members at upper level. Meanwhile, an increasing scattered data can be seen for mode 3. The
consistent increasing pattern was resulted from the constant rotational moving patterns for irregular
mode 3.
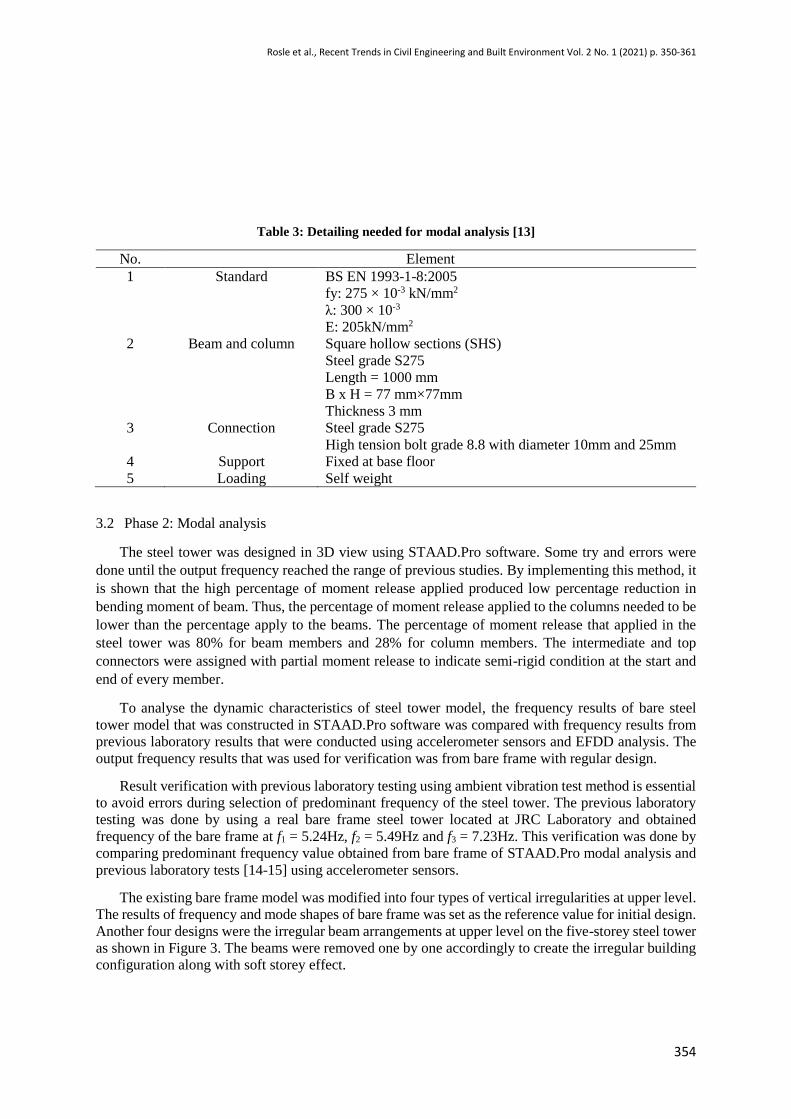
The R2 value indicates how well the information fits a trendline based on a statistical model,
whether in line or curve shape. The determination coefficient of R2 was an assortment of values from 0
≤ R2 ≤ 1.0 [18]. R2 value closed to 1.0 shows the regression line was a linear tabulation while if R2
nearest to 0 indicate that the line is a non-linear. The R2 value was obtained based on the best trend line
that fits the deflection curve perfectly [12]. Four types of trendlines were applied to identify the best fit
line for all mode. Based on the range of R2 value in Table 6, the strength of linear relationship of
predominant frequency of irregular cases and mode shape in mode 1, 2 and 3 can be determined. The
justification of the trendlines were tabulated in Table 7.
Table 6: The strength of trendline relationship based on R2 value [18]
R2 value Indication
1.00 - 0.8 Very strong
0.79 - 0.6 Strong
0.59 - 0.4 Medium
0.39 - 0.2 Weak
0.19 - 0.00 Very weak
Table 7: R2 value justification
Type of trendline Mode Justification Remarks
Linear 1 0.144 Very weak
2 0.216 Weak
3 0.998 Very strong
Exponential 1 0.142 Very weak
2 0.218 Weak
3 0.999 Very strong
Polynomial 2nd order 1 0.300 Weak
2 0.501 Medium
3 0.999 Very strong
Polynomial 3rd order 1 0.318 Weak
2 0.511 Medium
3 1.0 Very strong
Polynomial 4th order 1, 2, 3 1.0. Very strong
From the justification table, it can clearly understand that all trendlines fit for mode 3 for every
irregular case. This was cause by the steady increasing scattered data plotted for mode 3. Meanwhile,
the best fit trendlines for all modes was polynomial 4th order which means the modes were non-linear
trend. All scattered data lies on the trendline thus resulted to perfect R2 value (1.0).
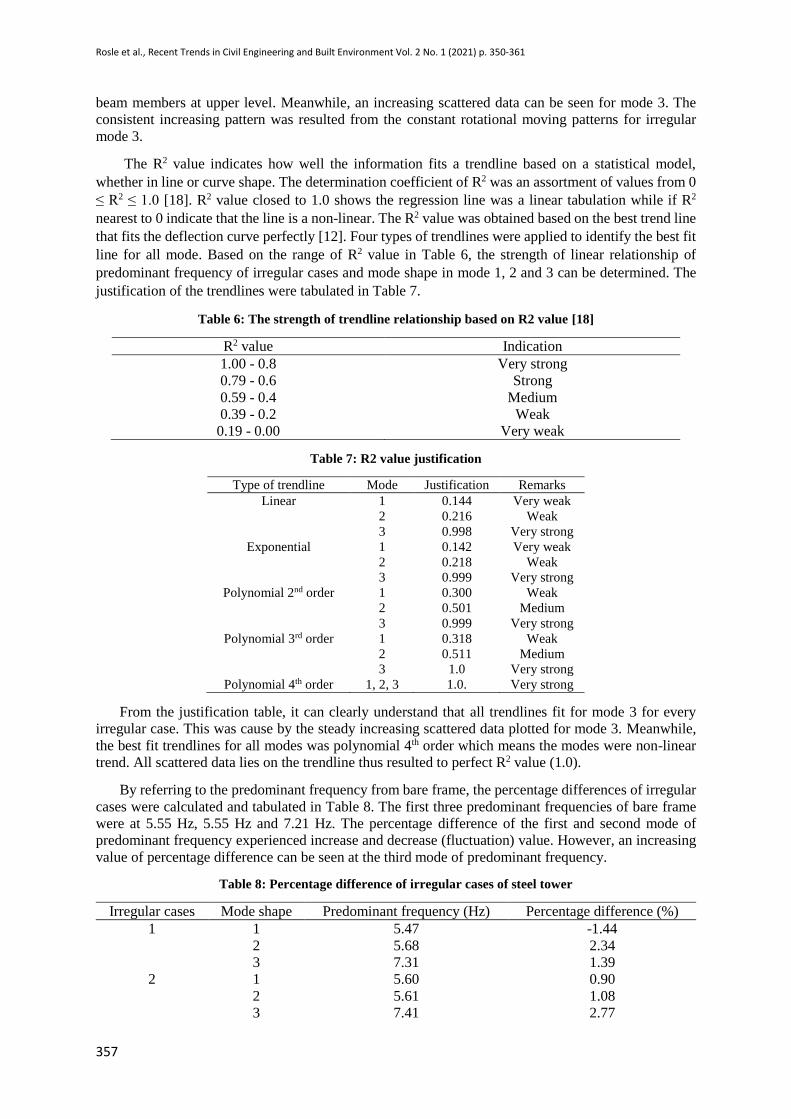
By referring to the predominant frequency from bare frame, the percentage differences of irregular
cases were calculated and tabulated in Table 8. The first three predominant frequencies of bare frame
were at 5.55 Hz, 5.55 Hz and 7.21 Hz. The percentage difference of the first and second mode of
predominant frequency experienced increase and decrease (fluctuation) value. However, an increasing
value of percentage difference can be seen at the third mode of predominant frequency.
Table 8: Percentage difference of irregular cases of steel tower
Irregular cases Mode shape Predominant frequency (Hz) Percentage difference (%)
1 1 5.47 -1.44
2 5.68 2.34
3 7.31 1.39
2 1 5.60 0.90
2 5.61 1.08
3 7.41 2.77
Rosle et al., Recent Trends in Civil Engineering and Built Environment Vol. 2 No. 1 (2021) p. 350-361
358
3 1 5.48 -1.26
2 5.74 3.42
3 7.52 4.30
4 1 5.63 1.44
2 5.63 1.44
3 7.64 5.96
It is found that, by using modal analysis method, there were only small significant change in
predominant frequency of the 5 storey steel tower from the bare frame configuration. The structure was
built with the same elements for beam and column, thus created a strong and rigid steel tower.
Unfortunately, the removal of beams at upper level showed an insignificant variation in predominant
frequencies.
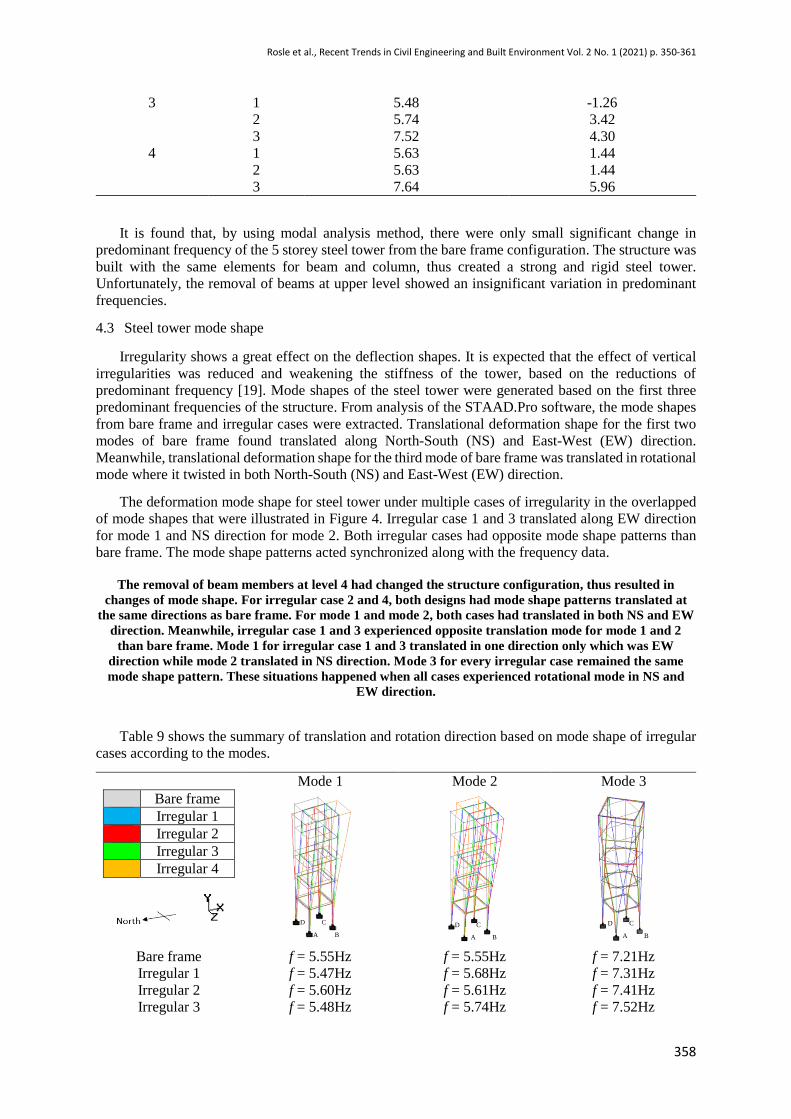
4.3 Steel tower mode shape
Irregularity shows a great effect on the deflection shapes. It is expected that the effect of vertical
irregularities was reduced and weakening the stiffness of the tower, based on the reductions of
predominant frequency [19]. Mode shapes of the steel tower were generated based on the first three
predominant frequencies of the structure. From analysis of the STAAD.Pro software, the mode shapes
from bare frame and irregular cases were extracted. Translational deformation shape for the first two
modes of bare frame found translated along North-South (NS) and East-West (EW) direction.
Meanwhile, translational deformation shape for the third mode of bare frame was translated in rotational
mode where it twisted in both North-South (NS) and East-West (EW) direction.
The deformation mode shape for steel tower under multiple cases of irregularity in the overlapped
of mode shapes that were illustrated in Figure 4. Irregular case 1 and 3 translated along EW direction
for mode 1 and NS direction for mode 2. Both irregular cases had opposite mode shape patterns than
bare frame. The mode shape patterns acted synchronized along with the frequency data.
The removal of beam members at level 4 had changed the structure configuration, thus resulted in
changes of mode shape. For irregular case 2 and 4, both designs had mode shape patterns translated at
the same directions as bare frame. For mode 1 and mode 2, both cases had translated in both NS and EW
direction. Meanwhile, irregular case 1 and 3 experienced opposite translation mode for mode 1 and 2
than bare frame. Mode 1 for irregular case 1 and 3 translated in one direction only which was EW
direction while mode 2 translated in NS direction. Mode 3 for every irregular case remained the same
mode shape pattern. These situations happened when all cases experienced rotational mode in NS and
EW direction.
Table 9 shows the summary of translation and rotation direction based on mode shape of irregular
cases according to the modes.
Bare frame
Irregular 1
Irregular 2
Irregular 3
Irregular 4
Mode 1 Mode 2 Mode 3
Bare frame f = 5.55Hz f = 5.55Hz f = 7.21Hz
Irregular 1 f = 5.47Hz f = 5.68Hz f = 7.31Hz
Irregular 2 f = 5.60Hz f = 5.61Hz f = 7.41Hz
Irregular 3 f = 5.48Hz f = 5.74Hz f = 7.52Hz
A B A B A B
D C D C D C
Rosle et al., Recent Trends in Civil Engineering and Built Environment Vol. 2 No. 1 (2021) p. 350-361
359
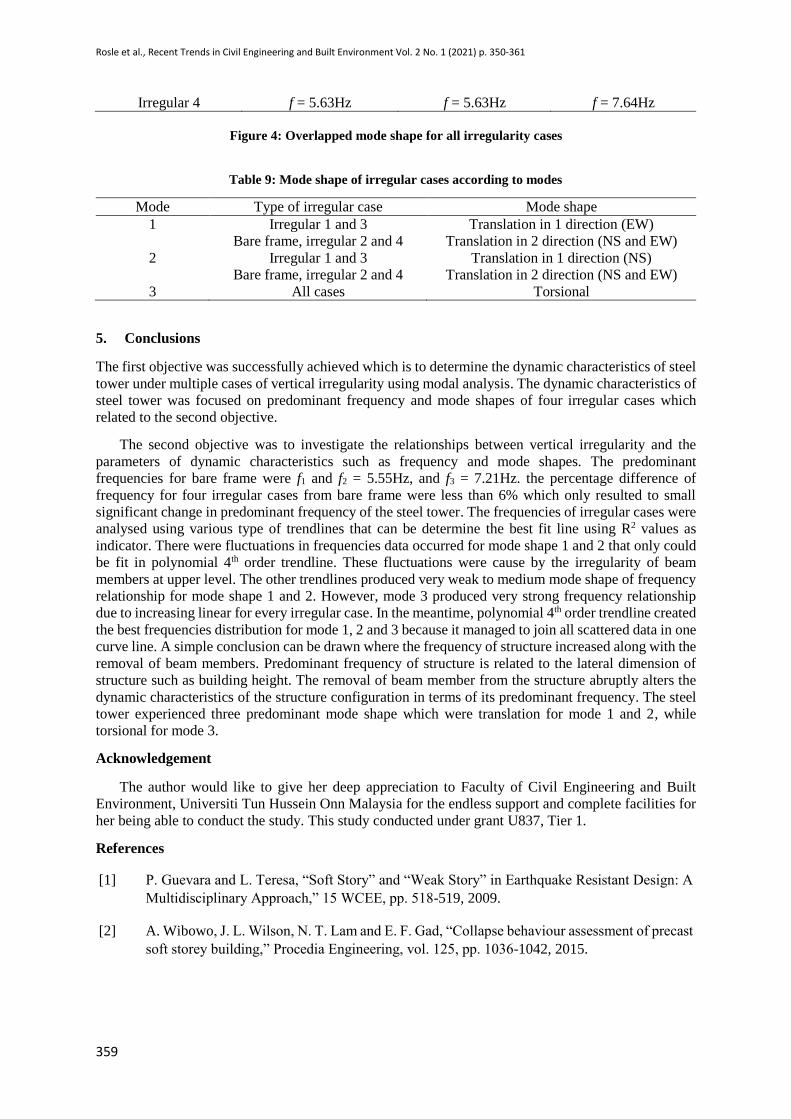
Irregular 4 f = 5.63Hz f = 5.63Hz f = 7.64Hz
Figure 4: Overlapped mode shape for all irregularity cases
Table 9: Mode shape of irregular cases according to modes
Mode Type of irregular case Mode shape
1 Irregular 1 and 3 Translation in 1 direction (EW)
Bare frame, irregular 2 and 4 Translation in 2 direction (NS and EW)
2 Irregular 1 and 3 Translation in 1 direction (NS)
Bare frame, irregular 2 and 4 Translation in 2 direction (NS and EW)
3 All cases Torsional
5. Conclusions
The first objective was successfully achieved which is to determine the dynamic characteristics of steel
tower under multiple cases of vertical irregularity using modal analysis. The dynamic characteristics of
steel tower was focused on predominant frequency and mode shapes of four irregular cases which
related to the second objective.
The second objective was to investigate the relationships between vertical irregularity and the
parameters of dynamic characteristics such as frequency and mode shapes. The predominant
frequencies for bare frame were f1 and f2 = 5.55Hz, and f3 = 7.21Hz. the percentage difference of
frequency for four irregular cases from bare frame were less than 6% which only resulted to small
significant change in predominant frequency of the steel tower. The frequencies of irregular cases were
analysed using various type of trendlines that can be determine the best fit line using R2 values as
indicator. There were fluctuations in frequencies data occurred for mode shape 1 and 2 that only could
be fit in polynomial 4th order trendline. These fluctuations were cause by the irregularity of beam
members at upper level. The other trendlines produced very weak to medium mode shape of frequency
relationship for mode shape 1 and 2. However, mode 3 produced very strong frequency relationship
due to increasing linear for every irregular case. In the meantime, polynomial 4th order trendline created
the best frequencies distribution for mode 1, 2 and 3 because it managed to join all scattered data in one
curve line. A simple conclusion can be drawn where the frequency of structure increased along with the
removal of beam members. Predominant frequency of structure is related to the lateral dimension of
structure such as building height. The removal of beam member from the structure abruptly alters the
dynamic characteristics of the structure configuration in terms of its predominant frequency. The steel
tower experienced three predominant mode shape which were translation for mode 1 and 2, while
torsional for mode 3.
Acknowledgement
The author would like to give her deep appreciation to Faculty of Civil Engineering and Built
Environment, Universiti Tun Hussein Onn Malaysia for the endless support and complete facilities for
her being able to conduct the study. This study conducted under grant U837, Tier 1.
References
[1] P. Guevara and L. Teresa, “Soft Story” and “Weak Story” in Earthquake Resistant Design: A
Multidisciplinary Approach,” 15 WCEE, pp. 518-519, 2009.
[2] A. Wibowo, J. L. Wilson, N. T. Lam and E. F. Gad, “Collapse behaviour assessment of precast
soft storey building,” Procedia Engineering, vol. 125, pp. 1036-1042, 2015.
Rosle et al., Recent Trends in Civil Engineering and Built Environment Vol. 2 No. 1 (2021) p. 350-361
360
[3] . A. G. Soni, D. G. Agrawal and A. M. Pande, “Effect of Irregularities in Buildings and their
Consequences,” International Journal of Modern Trends in Engineering and Research, pp. 14-
21, 2015.
[4] M. L. Chandravanshi and A. K. Mukhopadhyay, Modal Analysis of Structural Vibration, in
Proceedings of the International Mechanical Engineering Congress & Exposition, San Diego,
2015.
[5] R. G. Herrera and C. G. Soberon, Influenece of Plan Irregularity of Buildings, 14 World
Conference on Earthquake Engineering, vol. 1, 2008.
[6] A. Costa, Strengthening and repairing earthquake damaged structures in Oliveira C S, Roca A
and Goula, Assessing and Managing Earthquake Risk. Geotechnical, Geological And
Earthquake Engineering, vol 2, pp. 287-308, 2006.
[7] N. S. Idris, B. K. Boon, A. F. Kamarudin and S. Z. Sooria, Ambient Vibration Test on
Reinforced Concrete Bridges, MATEC Web of Conference, vol. 47, no. 02012, 2016.
[8] T. Mimura and A. Mita, Automatic estimation of natural frequencies and damping ratios of
building structures,6th Asia Pacific Workshop on Structural Health Monitoring, pp. 163-169,
2017.
[9] FEMA, Designing for Earthquakes: A manual for architects, Earthquake Engineering
Research Institute, Callifornia, 2006.
[10] J. Ma and G. Jie, “Ambient Vibration Test of a 18-Story Reinforced Concrete Building,” in
E3S Web of Conferences, vol. 53, no. 03077 2018.
[11] C. P. Lamarche, P. Paultre, J. Proulx and Moussea, “Assessment of the Frequency Domain
Decomposition Technique by Force-Vibration Test of a Full-Scale Structure,” Earthquake
Engineering and Structural Dynamics, pp. 487- 494, 2008.
[12] M. H. Zainal Abidin, S. Rosli, A. Fauziah, D. C. Wijeyesekera, M. I. Mohd Ashraf, T. B. M.
Faizal, A. F. Kamarudin, Y. Rais, M. F. Md Dan, A. T. S. Azhar and Z. M. Hafiz,
Determination of Soil Moisture Content using Laboratory Experimental and Field Electrical
Resistivity Values, IOP Conference Series: Journal of Physics, vol. 995, no. 012074, 2018.
[13] A. F. Kamarudin, M. K. Musa, S. N. Mokhatar, T. N. Tuan Chik, S. S. Mohd Zuki, A. Abu
Bakar, J. Hadipramana and H. H. Ahmad Johari, Mechanical Properties of Single Shear Plane
of Bolted Steel Connection, in The 2nd Global Congress on Construction, Material and
Structural Engineering, 2020.
[14] M. F. Khairul and A. F. Kamarudin, “Investigation on the effects of alternating mass
configuration on dynamic characteristics of moment resisting steel bare frame.,”
Undergraduate Project, Faculty of Civil Engineering and Buit Environment, Universiti Tun
Hussein Onn Malaysia, 2019.
[15] J. Z. Goh and A. F. Kamarudin, “Investigation on the effects of alternating mass configuration
on dynamic characteristics of moment resisting steel bare frame.,” Undergraduate Project,
Faculty of Civil Engineering and Buit Environmet, Universiti Tun Hussein Onn Malaysia,
2019.
Rosle et al., Recent Trends in Civil Engineering and Built Environment Vol. 2 No. 1 (2021) p. 350-361
361
[16] A. Baldassarre, J. Ocampo, M. Martinez and C. Rans, “Accuracy of Strain Measurement
Systems on A Non-Isotropic Material and Its Uncertainty on Finite Element Analysis,” The
Journal of Strain Analysis for Engineering Design, vol. 56, no. 2, pp. 1-20, 15 April 2020.
[17] T. Mehta, “Trendline Coefficients and Regression Analysis,” December 27, 2012. [Online].
Available: http://tushar-mehta.com/publish_train/data_analysis/16.htm. [Accessed Dicember
27, 2012].
[18] A. S. Yahaya, A. Ahmed, D. Gabda and C. S. Na, Problem and Solution in Statistics for
Engineers and Scientist, Selangor: Prentice Hall, 2008.
[19] S. K. Abid Sharief, M. S. R. Krishna and S. V. Surendh, “A Case Study on Seismic Analysis
of an Irregular Structure,” International Journal of Innovative Technology and Exploring
Engineering (IJITEE), vol. 08, no. 06, pp. 1856-1860, April 2019.