Efficacy of Odor Scavengers in Reducing Odor Compounds in Water, Milk, and Soymilk Jenny L. Norton Thesis submitted to the Faculty of the Virginia Polytechnic Institute and State University in partial fulfillment of the requirements for the degree of Master of Science in Food Science and Technology Approved: ________________________________ Dr. Joseph E. Marcy, Chairman _____________________________ ____________________________ Dr. Susan E. Duncan Dr. Sean F. OKeefe Date of Defense: September 11, 2003 Blacksburg, Virginia Keywords: Active Packaging, Aroma, Cyclodextrin, Hexanal, Milk, Odors, Off- flavors, Oxidation, Thresholds, Scavengers, Soymilk Copyright 2003, Jenny L. Norton
Transcript
Efficacy of Odor Scavengers in Reducing Odor Compounds
in Water, Milk, and Soymilk
Jenny L. Norton
Thesis submitted to the Faculty of the Virginia Polytechnic Institute and State University
in partial fulfillment of the requirements for the degree of
Bellefonte, PA) was exposed to the static headspace about 1 cm above the surface of the samples
for 20 minutes at 45ºC (± 1ºC). Hexanal, 2-heptenal, 2-pentanone, and 2,4-nonadienal were
adsorbed onto the exposed SPME fiber and then withdrawn from the septum and inserted into
the injection port of the gas chromatograph. The injector temperature was 250ºC. The fiber was
left exposed in the injection port for 15 minutes before removing to minimize the possibility of
carryover.
Hexanal, 2-heptenal, 2-pentanone, and 2,4-nonadienal were thermally desorbed in the injection
port of a Hewlett Packard gas chromatograph (Model 5890A, Hewlett Packard, Avondale, PA)
equipped with a HP 5895A ChemStation and a flame ionization detector. Separation was
27
completed on a HP-5 capillary column (25 m x 0.32 mm, 1.05 µm) (Supelco, Inc. Bellefonte,
PA) with helium as the gas flow at 1.0 ml/min. The temperature program began at 50ºC for 0.5
min, then raised at 15ºC/min. to a temperature of 180ºC for 0.5 min. The temperature then was
raised 20ºC/min. to a final temperature of 240ºC. All injections were made in the splitless mode.
Hexanal, 2-heptenal, 2-pentanone, and 2,4-nonadienal identification and quantification were
based on retention time and peak area results for the standard solutions using the method of an
external standard (McNair and Miller 1998).
(iv) Sensory Aroma Threshold Testing
Sensory testing was completed on the three media and volatile compounds (hexanal, 2-heptenal,
2-pentanone, and 2,4-nonadienal) for a total of 12 odor detection threshold tests. Each odor
detection threshold test consisted of a three-sample alternate forced choice test series that was
used with a panel of 12 people at a sample temperature of 4ºC. The study was repeated twice to
verify that the thresholds were within 20% of each other (Lawless and Heymann 1998).
A panel of 12 people was randomly selected for each of the 12 aroma detection threshold tests.
Panelists were seated in individual sensory booths. Panelists were presented with a warm up
sample that was spiked at supra-threshold level of the odor in question (hexanal, 2-heptenal, 2-
pentanone, and 2,4-nonadienal). This was done to familiarize the panelists with the expected
odor discrimination. The panelists were asked to fill out a human subjects consent form while
waiting for the first tray of samples.
The panelists were presented with 10 three sample sets of triangle tests. Triangle sets were
presented on three trays, with three, three, and four sample sets respectively. The samples were
presented in rows of three with ascending concentrations starting at zero in the first row. The
samples were randomized within rows and each numbered sample with randomly selected three-
digit numbers. Each three-sample set included either two samples of un-spiked media and one
spiked sample of one of the odors (hexanal, 2-heptenal, 2-pentanone, and 2,4-nonadienal) or one
un-spiked sample and two spiked samples, depending on the randomized order that was selected
28
on the Sample Preparation Guide. The panelists were informed to smell the samples and choose
the sample that smelled �different� within each row of three samples.
The panelists were instructed to remove the lid and swirl the sample, then place the bottle under
the nose and smell. The panelists were also instructed to rest their nose for a couple of minutes
when getting fatigued. Panelists were not informed of the ascending concentration
characteristics of the samples, although they might have acquired the knowledge by participating
in several sensory panels (Lawless and Heymann 1998). However since 12 different
combinations of different mediums and volatiles were used, the ascending order characteristics
would be difficult to follow.
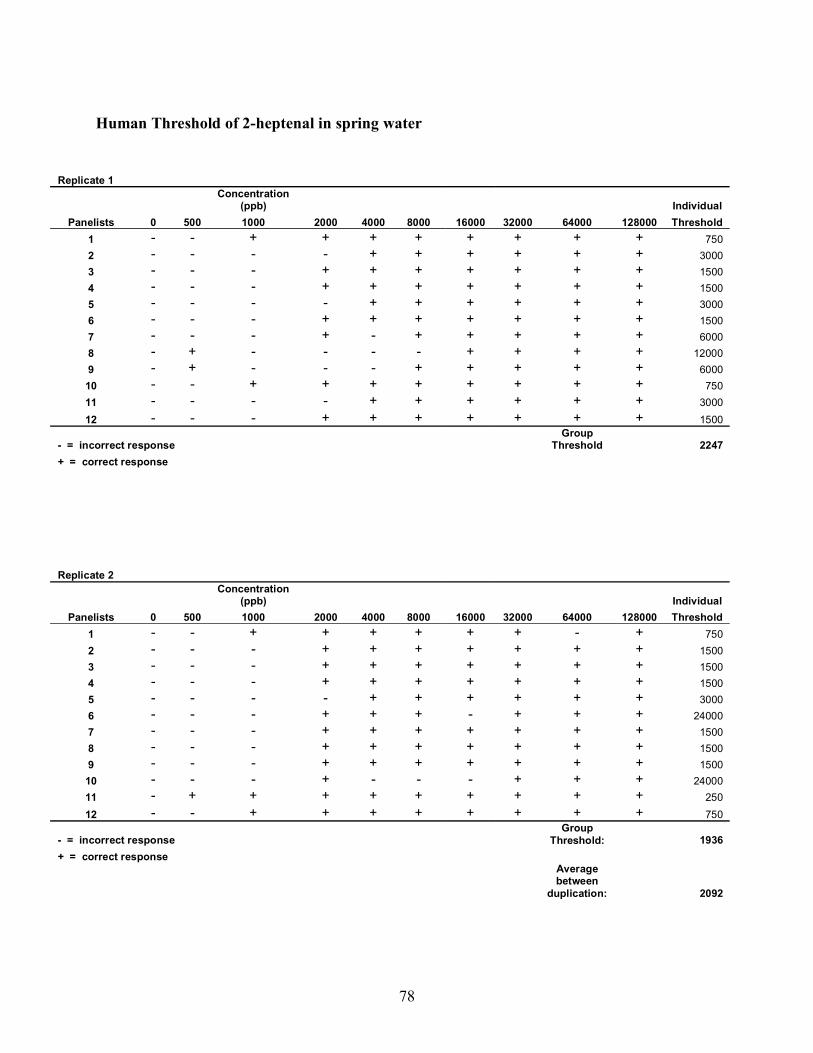
(v) Data evaluation
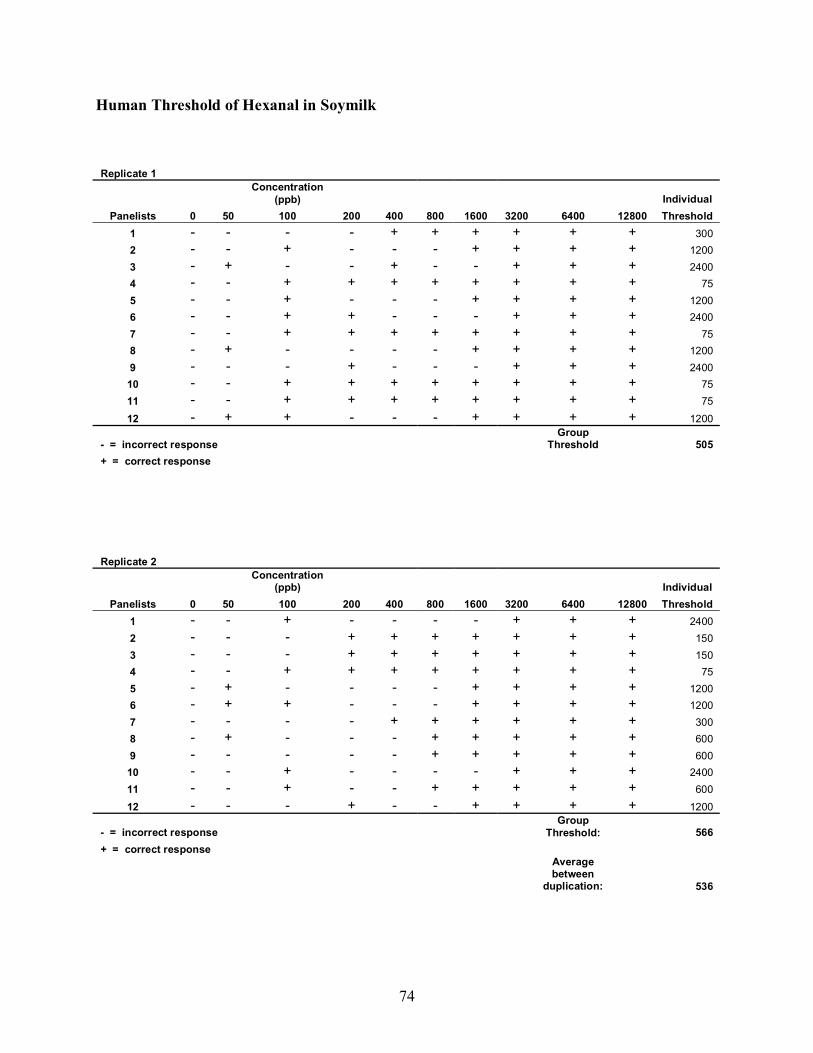
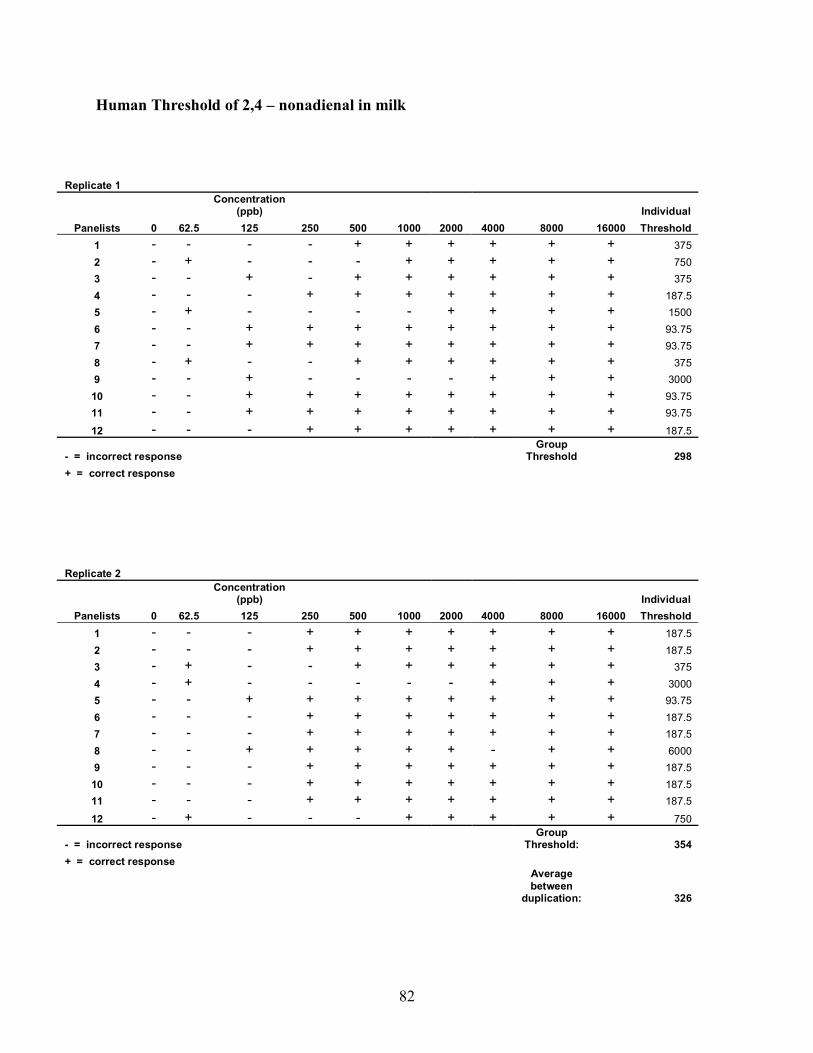
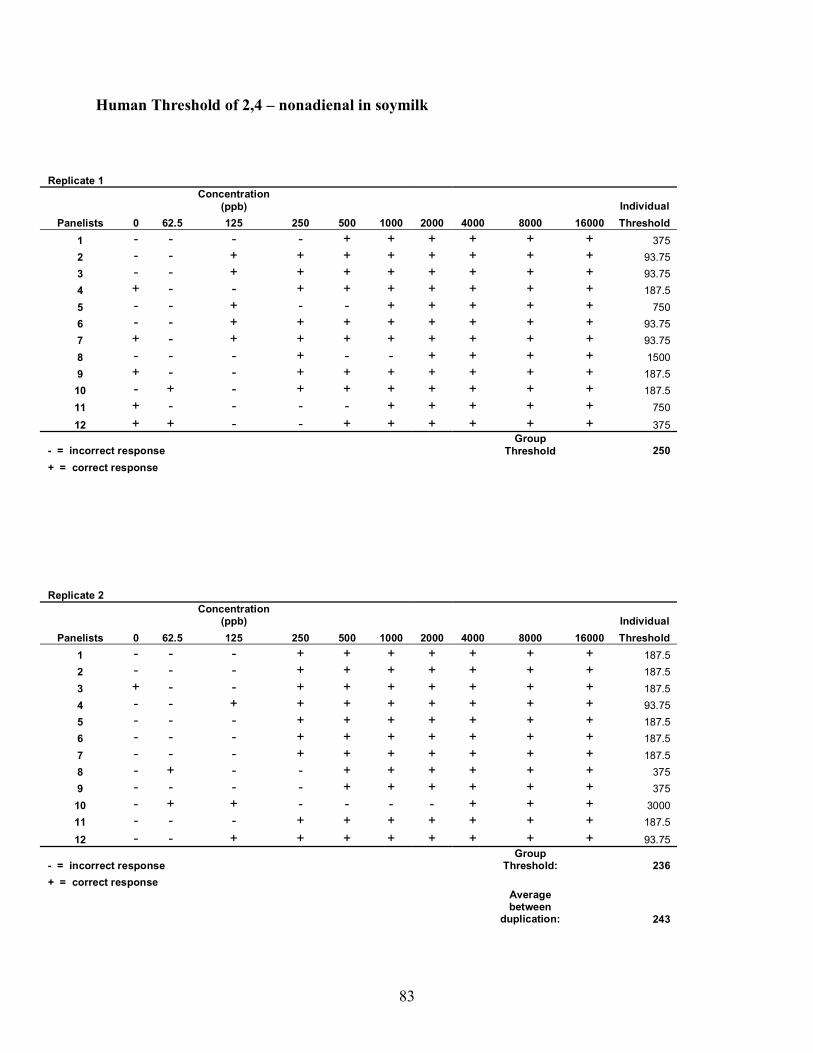
The aroma detection thresholds were interpreted in two ways, geometric mean threshold and
logistic regression. The thresholds of the individual panelists were determined by taking the last
incorrect concentration and the first correct concentrations (when at least three subsequent
choices were correct) and calculating the geometric mean (Lawless and Heymann 1998). The
geometric mean is the antilog of the last incorrect concentration and the first correct
concentration�s mean. The group threshold was calculated by taking the log of the mean of all
the individual geometric means combined. Each of the sensory panels was duplicated. The
group aroma detection thresholds were then compared to ensure that they were within 20% of
each other as specified by Lawless and Heymann (1998). The panel responses for the
determination of the 12 aroma detection thresholds were recorded as <-> which indicates the
lack of detection in the spiked sample by the panelists, and <+> which indicates the detection of
the given volatile in the spiked sample.
Logistic regression is a technique for predicting the probability of �success� as a function of
some predictor variable. In this aroma detection threshold determination the concentration of the
given volatile (hexanal, 2-heptenal, 2-pentanone, and 2,4-nonadienal) in the specific medium
(milk, soy milk, spring water) is the predictor variable and a correct identification of a spiked
sample is a success.
29
Let x = the concentration of the volatile in the medium and let p(x) = the probability that a
panelist correctly identified a sample that contained one of the given volatiles. The logistic
regression model is:
P(x) = 1 / [1 + exp (-α-βx)]
where α and β are parameters that are estimated from the data. Data was analyzed using SAS
(2002).
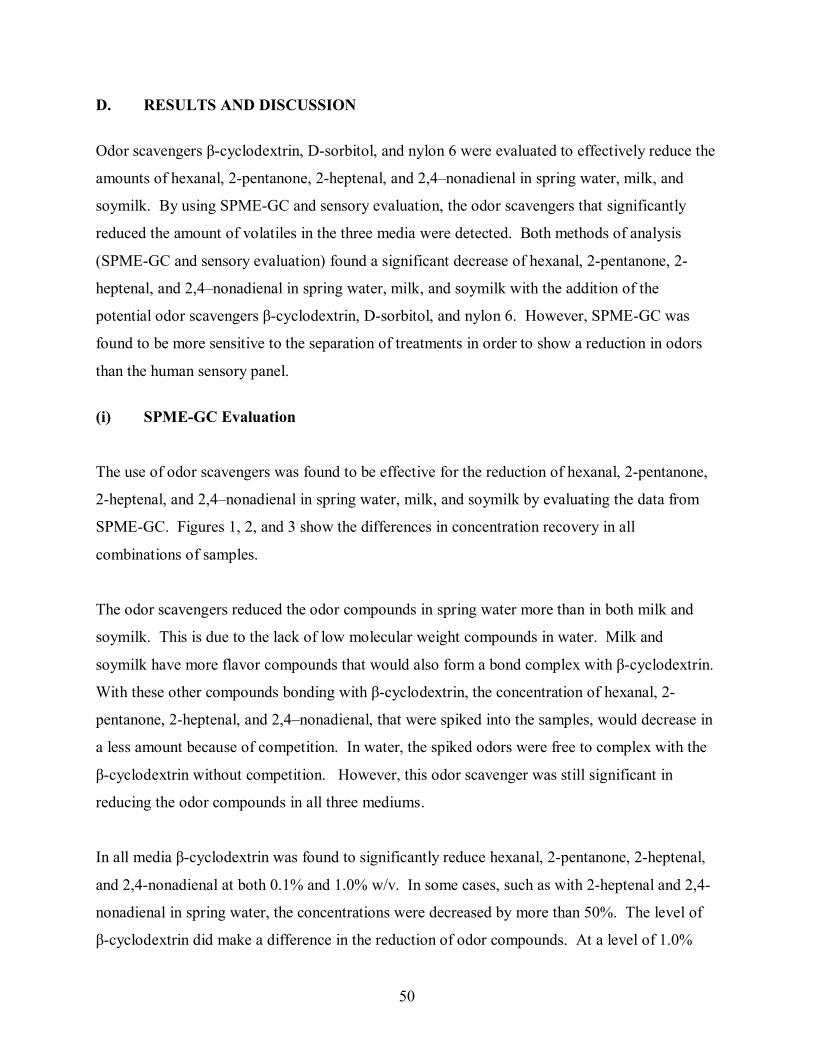
D. RESULTS AND DISCUSSION
Hexanal, 2-heptenal, 2-pentanone, and 2,4-nonadienal odor thresholds were measured in two
different ways. By using logistic regression, the probability of �success� � the probability that
the volatile-spiked samples will be identified correctly � as a function of volatile concentration in
the medium can be predicted. By using the geometric mean approach, the concentration of
volatile, below which the subject lack the sensitivity to detect the volatile in a sample, can be
determined.
(i) Geometric Mean Approach
Individual aroma thresholds were calculated in each sensory test and, from this, the group
threshold was estimated. Table 1 reports the group threshold of hexanal, 2-heptenal, 2-
pentanone, and 2,4-nonadienal in the different media. The sensitivity of individual panelists
varied shown by the minimum and maximum thresholds found in each group of samples. For
example the minimum and maximum thresholds found for hexanal in water were 75 and 4,800
ppb respectively. This is considered normal due to the different sensitivities of panelists. There
are many factors that can affect the detection of an odor. Age, sex, medications, and many other
factors have been noted (Lawless and Klein 1991; Meilgaard and others 1999).
30
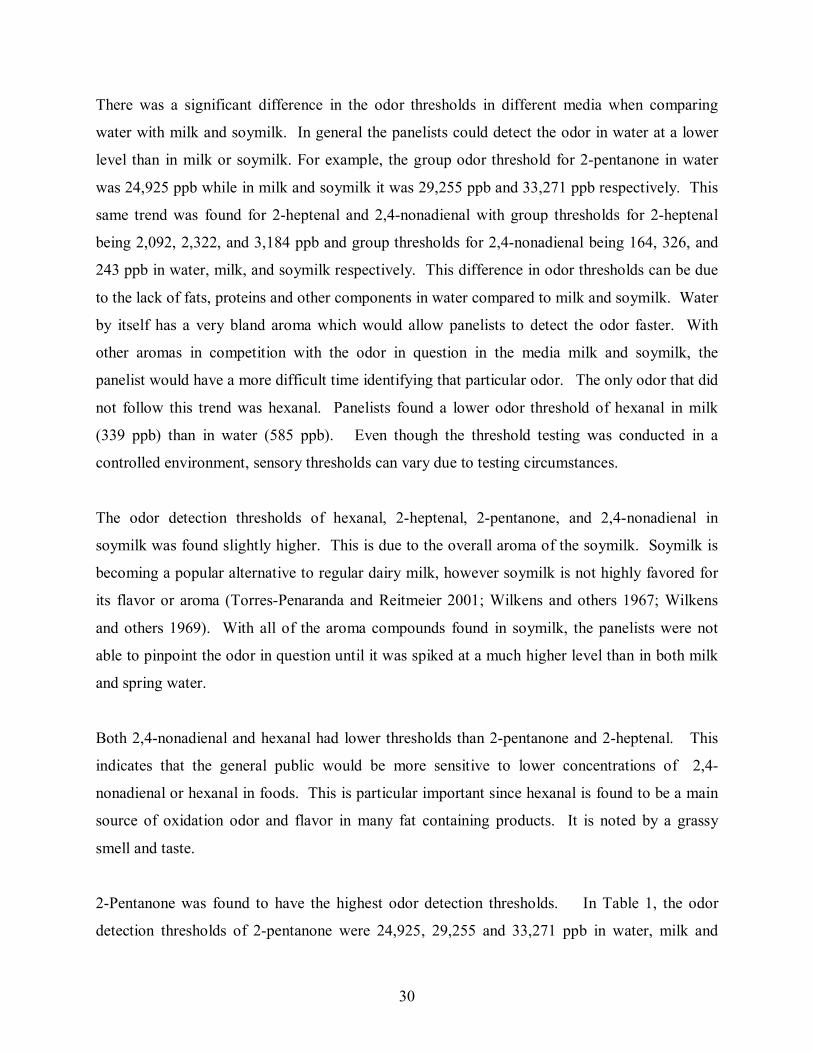
There was a significant difference in the odor thresholds in different media when comparing
water with milk and soymilk. In general the panelists could detect the odor in water at a lower
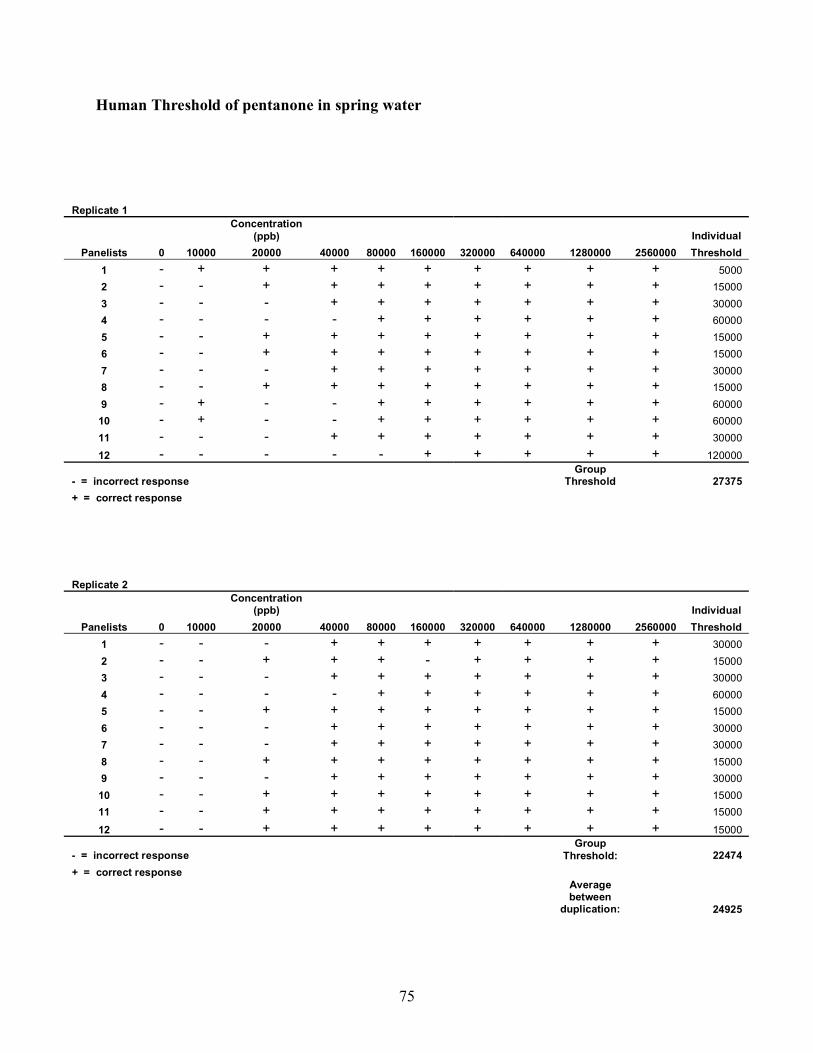
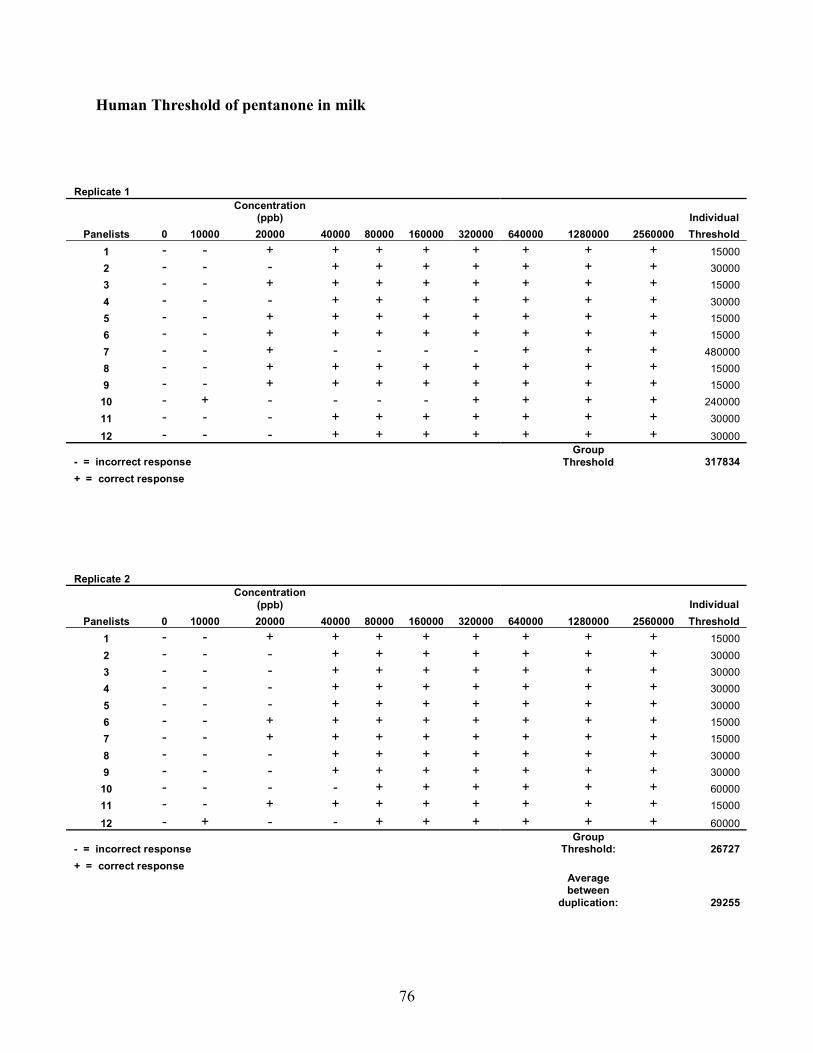
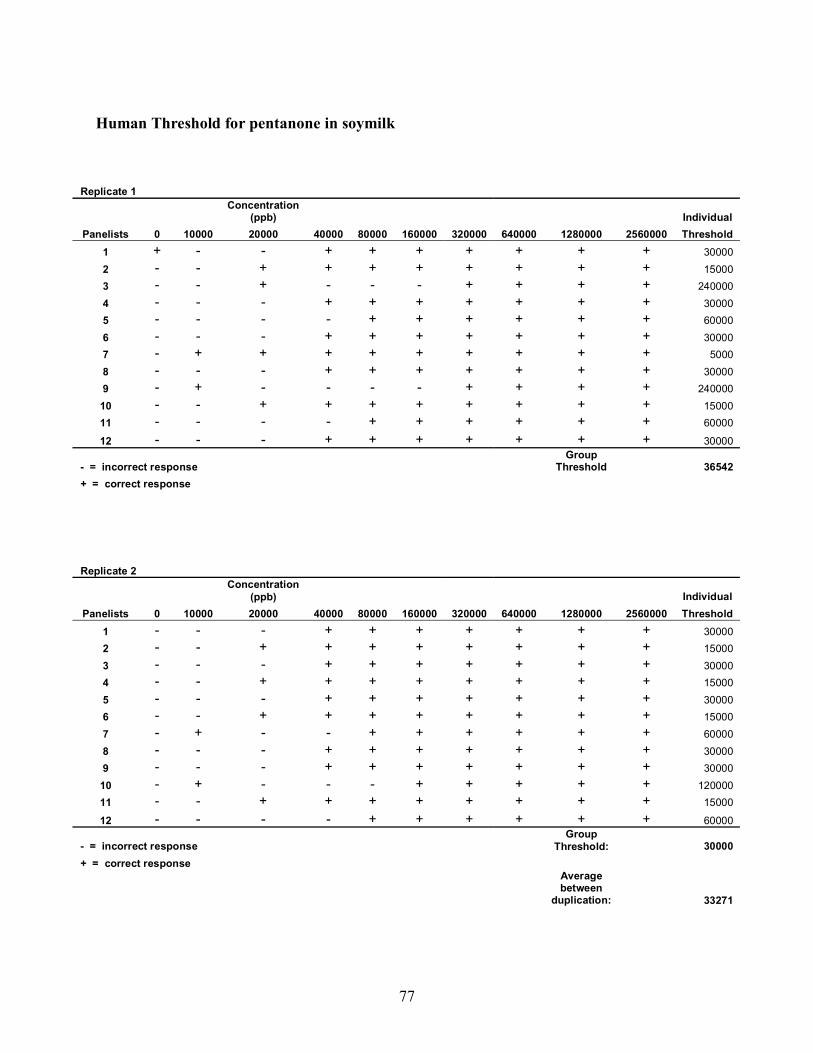
level than in milk or soymilk. For example, the group odor threshold for 2-pentanone in water
was 24,925 ppb while in milk and soymilk it was 29,255 ppb and 33,271 ppb respectively. This
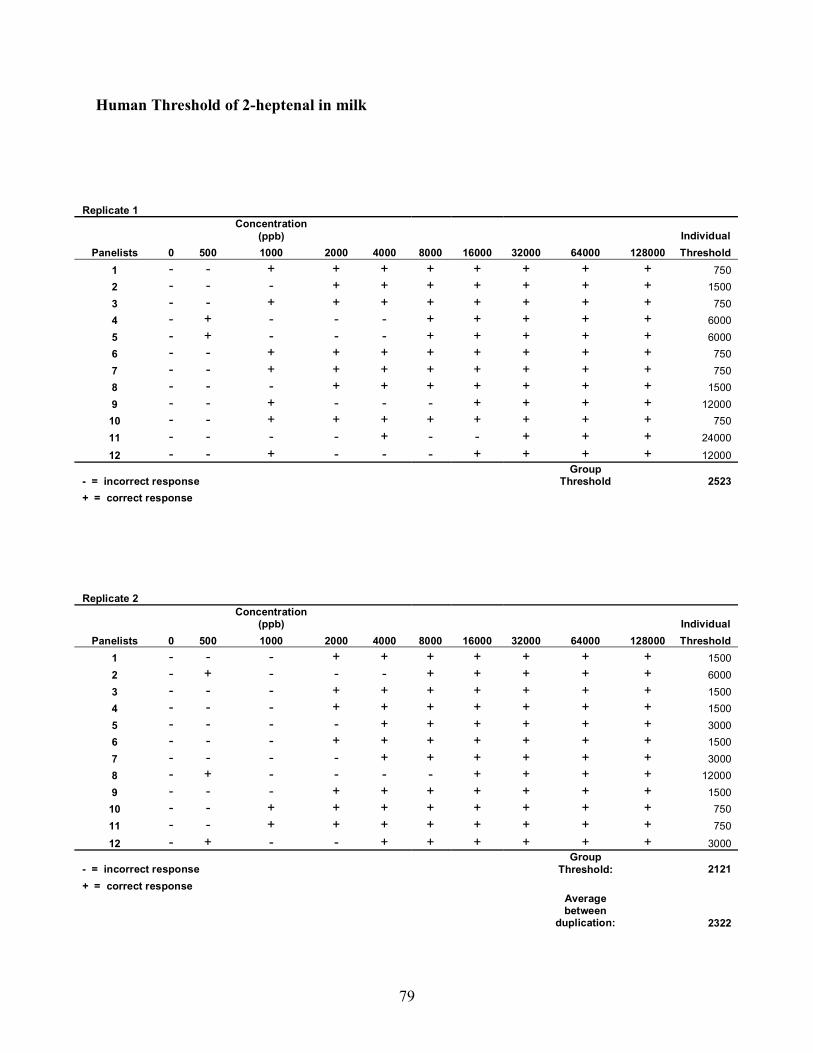
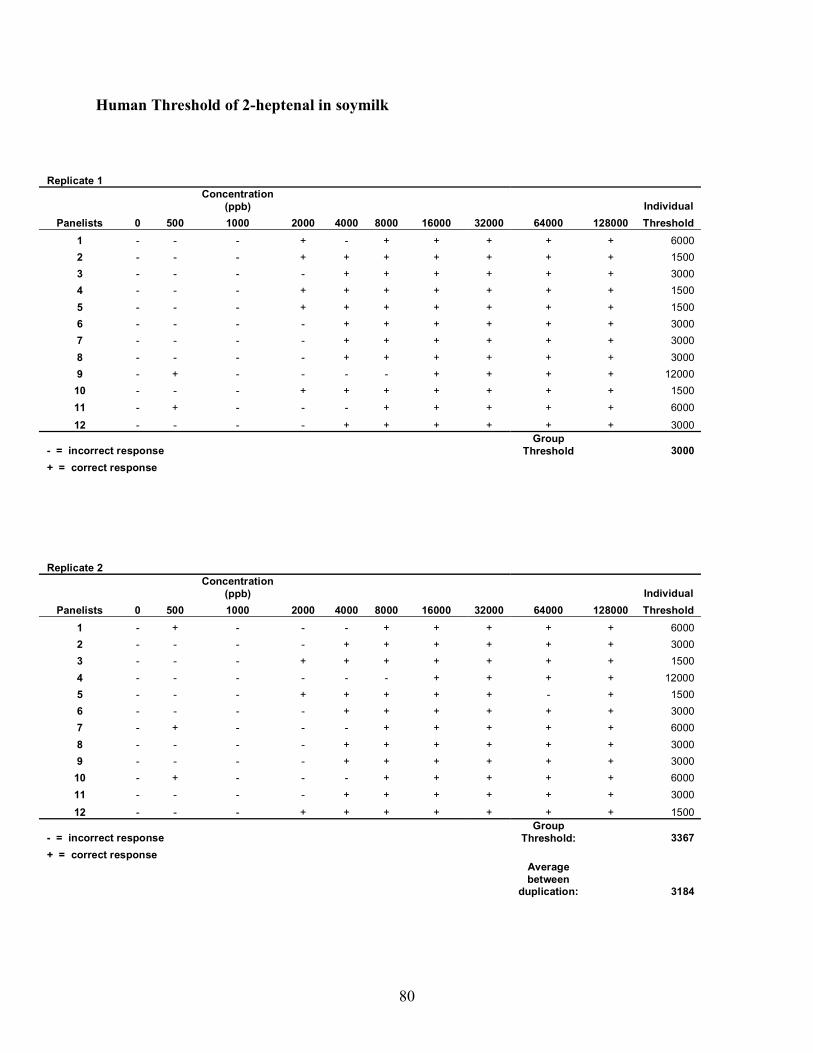
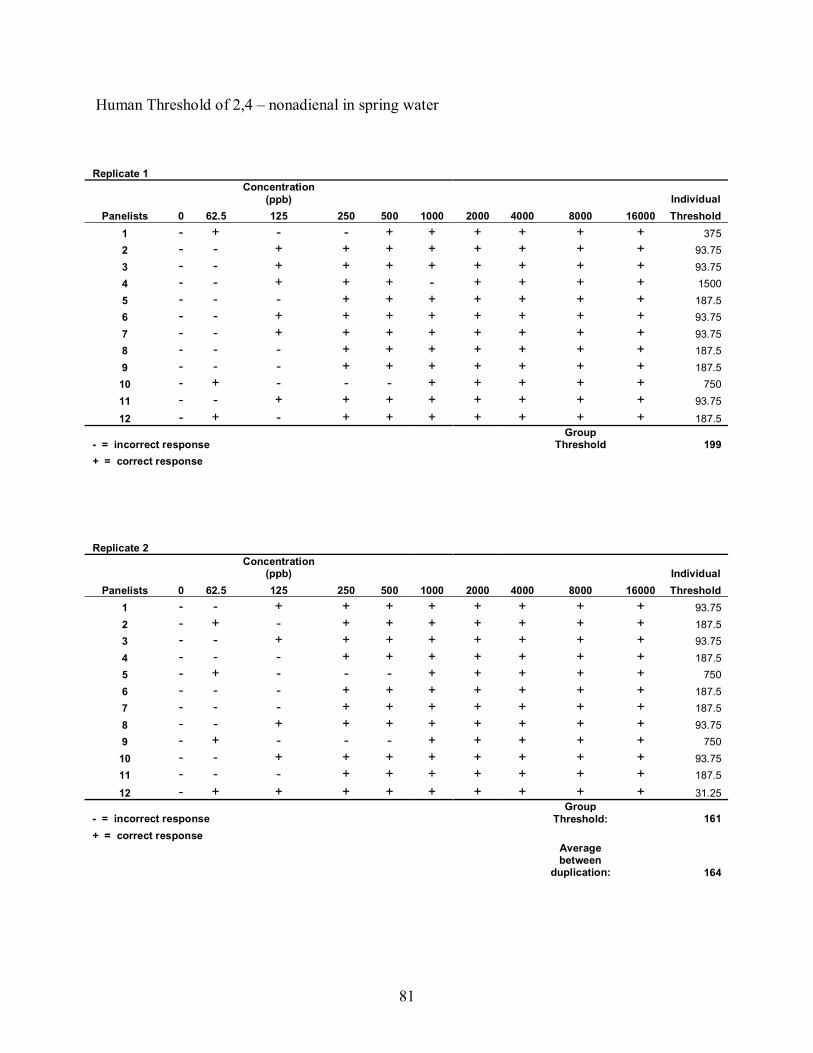
same trend was found for 2-heptenal and 2,4-nonadienal with group thresholds for 2-heptenal
being 2,092, 2,322, and 3,184 ppb and group thresholds for 2,4-nonadienal being 164, 326, and
243 ppb in water, milk, and soymilk respectively. This difference in odor thresholds can be due
to the lack of fats, proteins and other components in water compared to milk and soymilk. Water
by itself has a very bland aroma which would allow panelists to detect the odor faster. With
other aromas in competition with the odor in question in the media milk and soymilk, the
panelist would have a more difficult time identifying that particular odor. The only odor that did
not follow this trend was hexanal. Panelists found a lower odor threshold of hexanal in milk
(339 ppb) than in water (585 ppb). Even though the threshold testing was conducted in a
controlled environment, sensory thresholds can vary due to testing circumstances.
The odor detection thresholds of hexanal, 2-heptenal, 2-pentanone, and 2,4-nonadienal in
soymilk was found slightly higher. This is due to the overall aroma of the soymilk. Soymilk is
becoming a popular alternative to regular dairy milk, however soymilk is not highly favored for
its flavor or aroma (Torres-Penaranda and Reitmeier 2001; Wilkens and others 1967; Wilkens
and others 1969). With all of the aroma compounds found in soymilk, the panelists were not
able to pinpoint the odor in question until it was spiked at a much higher level than in both milk
and spring water.
Both 2,4-nonadienal and hexanal had lower thresholds than 2-pentanone and 2-heptenal. This
indicates that the general public would be more sensitive to lower concentrations of 2,4-
nonadienal or hexanal in foods. This is particular important since hexanal is found to be a main
source of oxidation odor and flavor in many fat containing products. It is noted by a grassy
smell and taste.
2-Pentanone was found to have the highest odor detection thresholds. In Table 1, the odor
detection thresholds of 2-pentanone were 24,925, 29,255 and 33,271 ppb in water, milk and
31
soymilk respectively. 2-pentanone has an alcohol-like smell that is not very overpowering in a
medium as noted by the group thresholds. Therefore the concern of odors caused by 2-
pentanone, which is a product of lipid oxidation, is not as high as the concern for hexanal which
was detected at a much lower concentration by the panelists.
Table 1. Odor detection thresholds for hexanal, 2-pentanone, 2-heptenal, and 2,4-nonadienal in water, milk, and soymilk as determined by the geometric mean approach
Medium/Volatile Group Threshold1 Min/Max % Variation between Combination (ppb) Individual Thresholds Replications
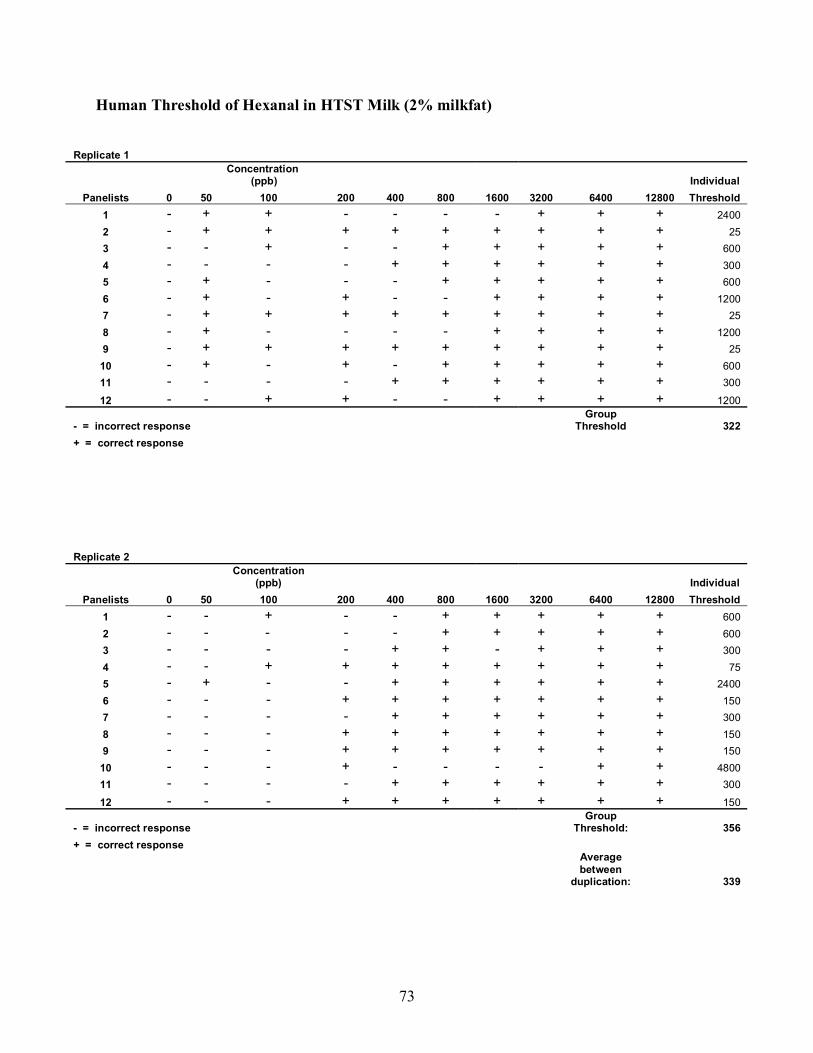
Hexanal in Water 585 75 / 4800 15.5 Hexanal in 2% Milk 339 25 / 4800 10.5 Hexanal in Soy Milk 536 75 / 2400 12.1
2-Pentanone in Water 24925 5000 / 120000 17.9 2-Pentanone in 2% Milk 29255 15000 / 480000 15.8 2-Pentanone in Soy Milk 33271 5000 / 240000 17.9
2-Heptenal in Water 2092 500 / 24000 13.9 2-Heptenal in 2% Milk 2322 750 / 48000 15.9 2-Heptenal in Soy Milk 3184 1500 / 12000 12.2
2,4-Nonadienal in Water 164 31 / 188 18.6 2,4-Nonadienal in Milk 326 94 / 3000 18.7 2,4-Nonadienal in Soy Milk 243 94 / 3000 5.6 112 different panelists for each of two replications
Table 1 also shows variability in individual thresholds of panelists. Lawless and Heymann
(1998) confirm that individuals have very different abilities to detect flavor compounds. Some
panelist may not even be sensitive enough to detect the odor compounds at all. It is important,
however, to still include these individuals in a group threshold test, since they are part of the
general public and will also consume the product.
Since individual thresholds vary substantially, it can influence a group threshold a great deal.
Therefore, valid threshold measurements require group threshold values with <20% variability
between two replications (Lawless and Heymann 1998). The variability between the replicated
odor detection threshold tests in this study can be found in Table 1. There was a noticeable
32
variability among the replicates in each of the threshold tests but all were less than 20%. This
illustrates as Lawless and Heymann (1998) noted that individuals have very different abilities to
detect odor compounds. All of the replications had varibilites below 20% so the odor detection
thresholds were within the normal range of variability. Even though water had the lowest odor
thresholds out of the three media, it did not exhibit a lower variability. This shows that panelists
will have variability no matter what the odor or media may be.
(ii) Logistic Regression
Logistic regression and the geometric mean approach are both measuring detection threshold in
two different ways. The geometric mean approach looks directly at the thresholds of each
individual and uses those specific numbers to calculate the group thresholds. Logistic
regression, however, predicts where a certain percentage of the panelists will correctly identify
the four odors in each medium.
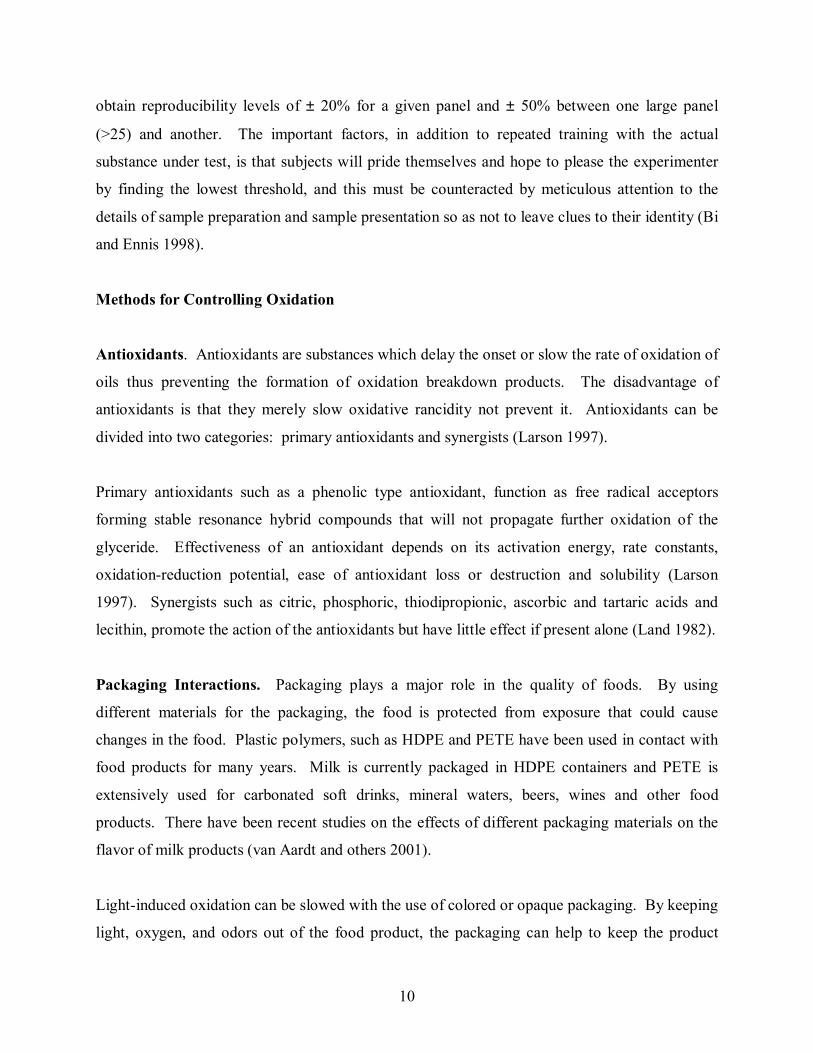
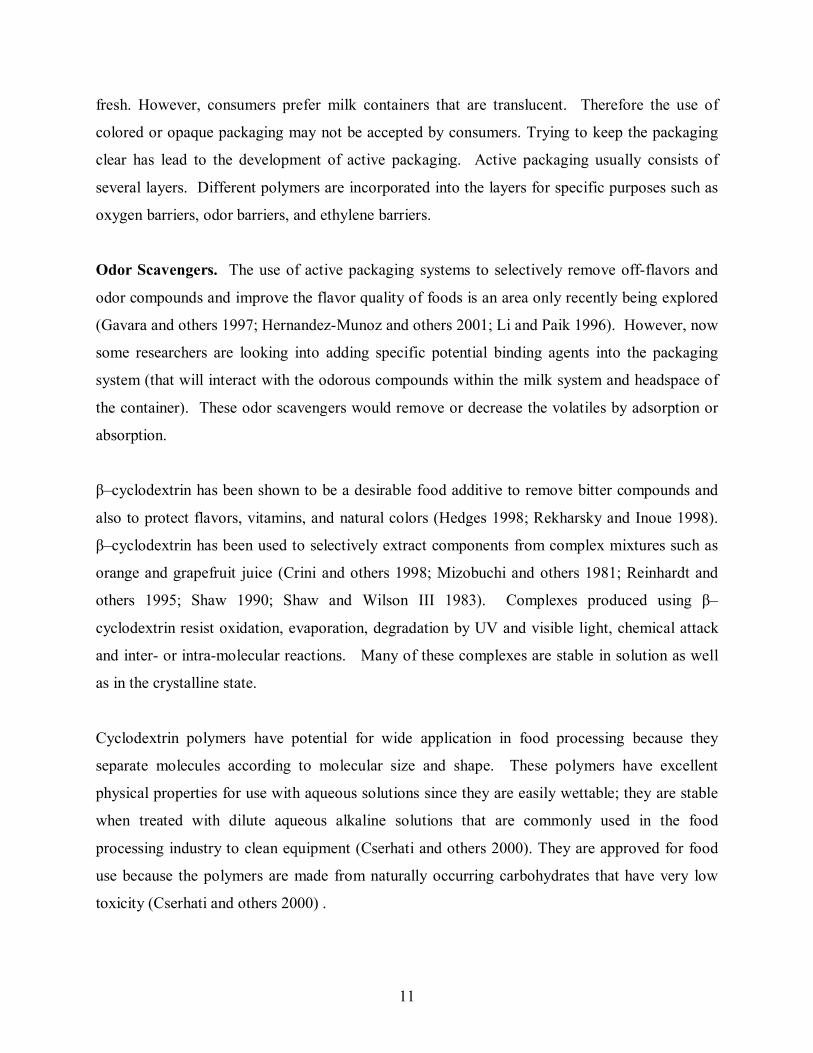
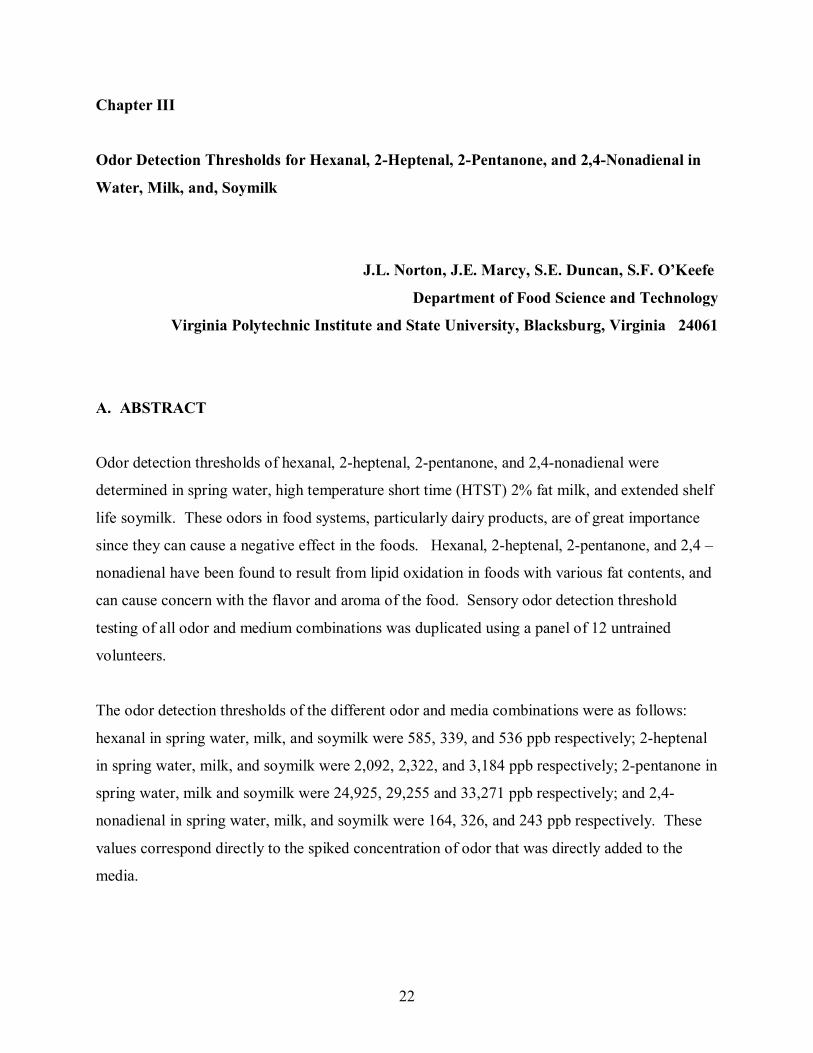
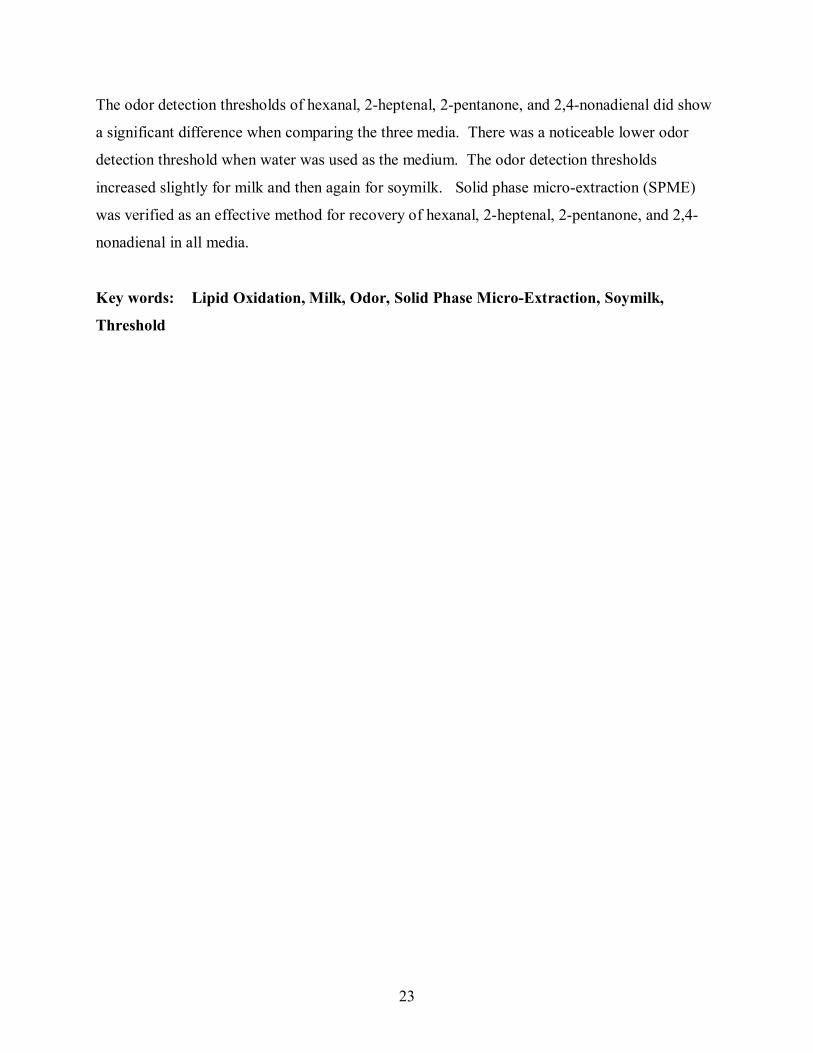
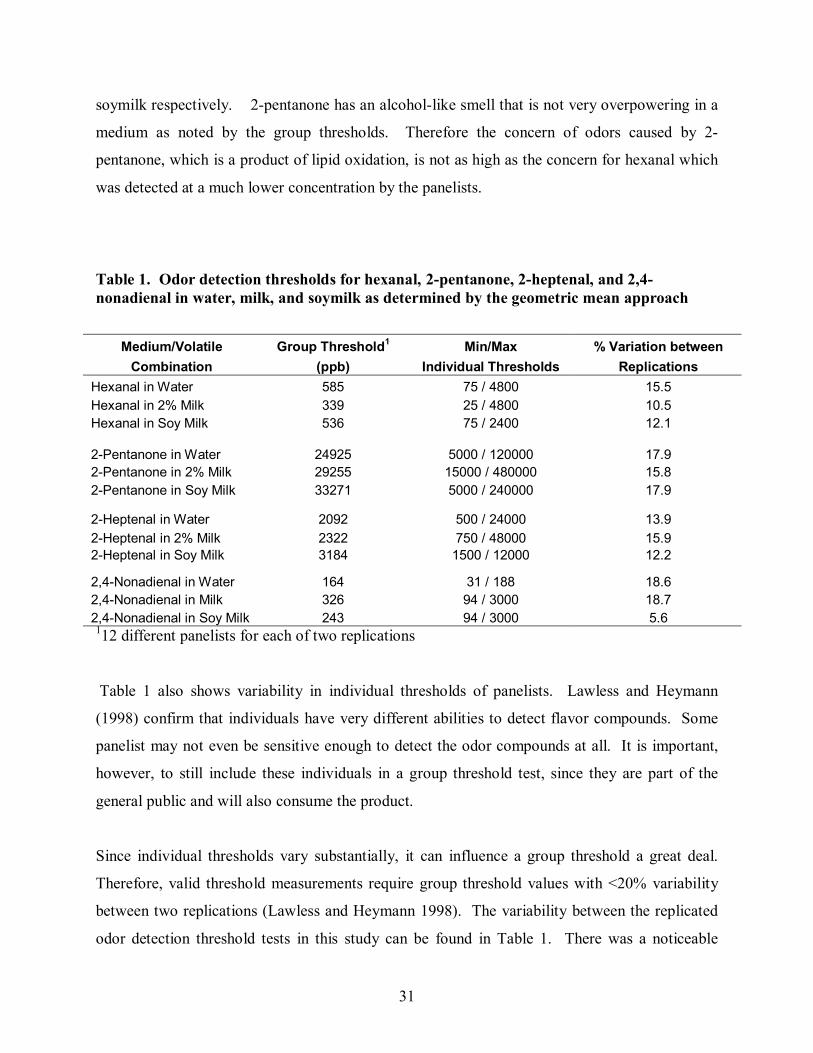
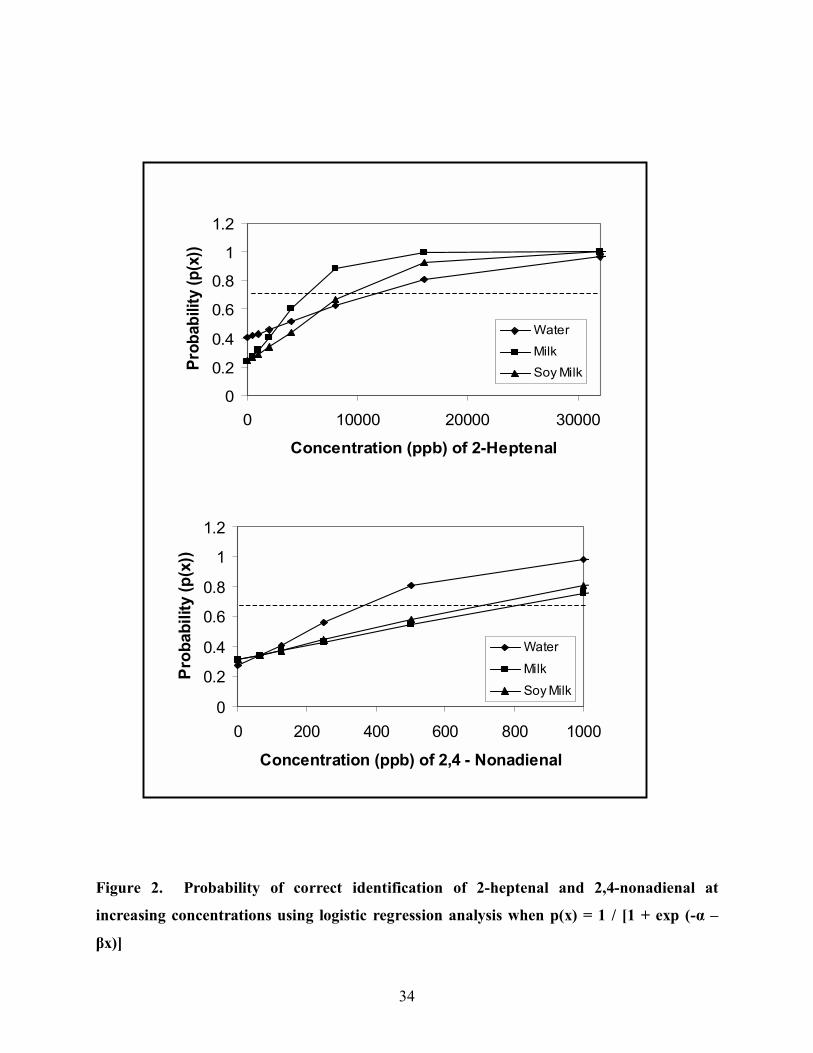
Figures 1 and 2 show the probability of correct identification of each odor (hexanal, 2-heptenal,
2-pentanone, and 2,4-nonadienal) in all media. Lawless and Heymann (1998) suggests an
arbitrary level of 50% above chance guessing for determining threshold when an alternative
approach, such as logistic regression is used. This level is calculated by making use of Abbott�s
The 50% above chance guessing for the triangle test thus requires 66.7% correct identification.
For example, in soy mik, the logistic regression predicts that at a concentration of 1,021 ppb of
hexanal, 66.7% of the panelists should be able to identify the soymilk that is spiked with
hexanal.
The probability of correct identification of odor-spiked samples in all media at the threshold
concentrations found when using the geometric mean approach is shown in Table 2. This means
33
that at the threshold level for hexanal in soymilk (536 ppb) 53.4% of the panelists used would be
able to correctly identify a hexanal-spiked sample. Thresholds calculated using logistic
regression were found to be higher than the geometric mean calculation for all the odors in
question.
0
0.2
0.4
0.6
0.8
1
1.2
0 1000 2000 3000 4000 5000
Concentration (ppb) of Hexanal
Prob
abili
ty (p
(x))
WaterMilkSoy Milk
0
0.2
0.4
0.6
0.8
1
1.2
0 50000 100000 150000
Concentration (ppb) of Pentanone
Pro
babi
lity
(p(x
))
WaterMilkSoy Milk
Figure 1. Probability of correct identification of hexanal and 2-pentanone at increasing
concentrations using logistic regression analysis when p(x) = 1 / [1 + exp (-α � βx)]
34
0
0.2
0.4
0.6
0.8
1
1.2
0 10000 20000 30000
Concentration (ppb) of 2-Heptenal
Prob
abili
ty (p
(x))
WaterMilkSoy Milk
0
0.2
0.4
0.6
0.8
1
1.2
0 200 400 600 800 1000
Concentration (ppb) of 2,4 - Nonadienal
Prob
abili
ty (p
(x))
WaterMilkSoy Milk
Figure 2. Probability of correct identification of 2-heptenal and 2,4-nonadienal at
increasing concentrations using logistic regression analysis when p(x) = 1 / [1 + exp (-α �
βx)]
35
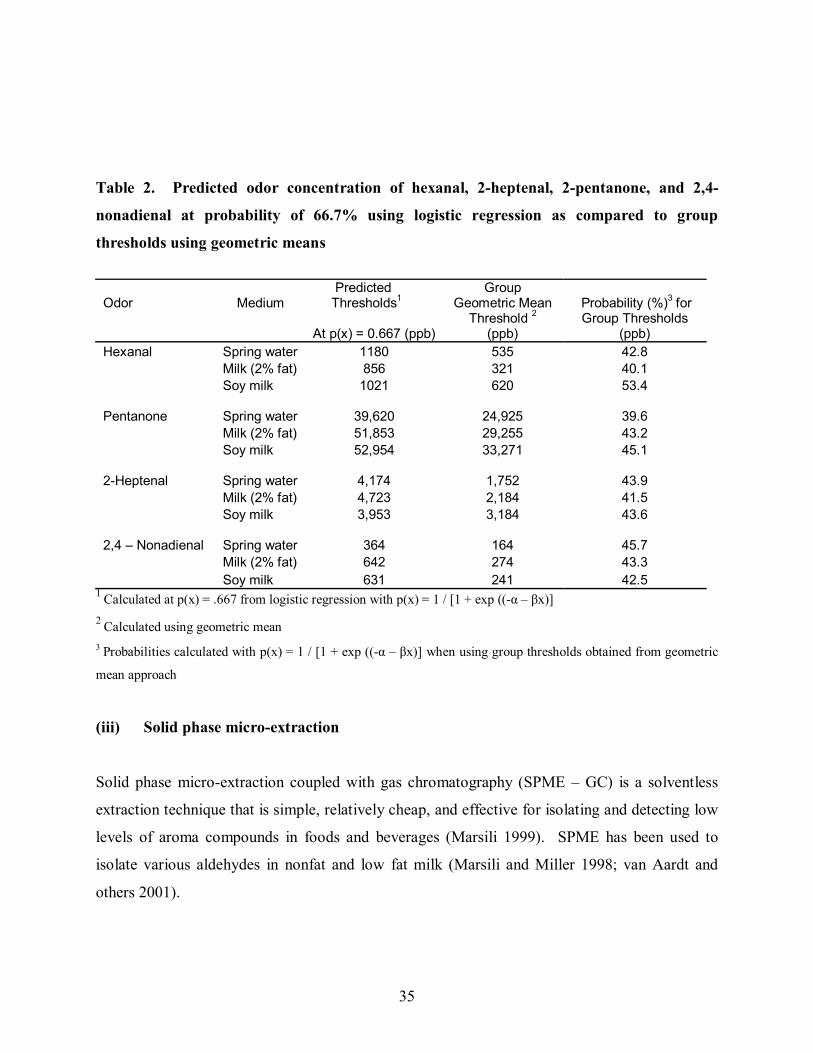
Table 2. Predicted odor concentration of hexanal, 2-heptenal, 2-pentanone, and 2,4-
nonadienal at probability of 66.7% using logistic regression as compared to group
thresholds using geometric means
Odor Medium Predicted Thresholds1
Group Geometric Mean Probability (%)3 for
At p(x) = 0.667 (ppb) Threshold 2
(ppb) Group Thresholds
(ppb) Hexanal Spring water 1180 535 42.8 Milk (2% fat) 856 321 40.1 Soy milk 1021 620 53.4 Pentanone Spring water 39,620 24,925 39.6 Milk (2% fat) 51,853 29,255 43.2 Soy milk 52,954 33,271 45.1 2-Heptenal Spring water 4,174 1,752 43.9 Milk (2% fat) 4,723 2,184 41.5 Soy milk 3,953 3,184 43.6 2,4 � Nonadienal Spring water 364 164 45.7 Milk (2% fat) 642 274 43.3 Soy milk 631 241 42.5
1 Calculated at p(x) = .667 from logistic regression with p(x) = 1 / [1 + exp ((-α � βx)] 2 Calculated using geometric mean 3 Probabilities calculated with p(x) = 1 / [1 + exp ((-α � βx)] when using group thresholds obtained from geometric
mean approach
(iii) Solid phase micro-extraction
Solid phase micro-extraction coupled with gas chromatography (SPME � GC) is a solventless
extraction technique that is simple, relatively cheap, and effective for isolating and detecting low
levels of aroma compounds in foods and beverages (Marsili 1999). SPME has been used to
isolate various aldehydes in nonfat and low fat milk (Marsili and Miller 1998; van Aardt and
others 2001).
36
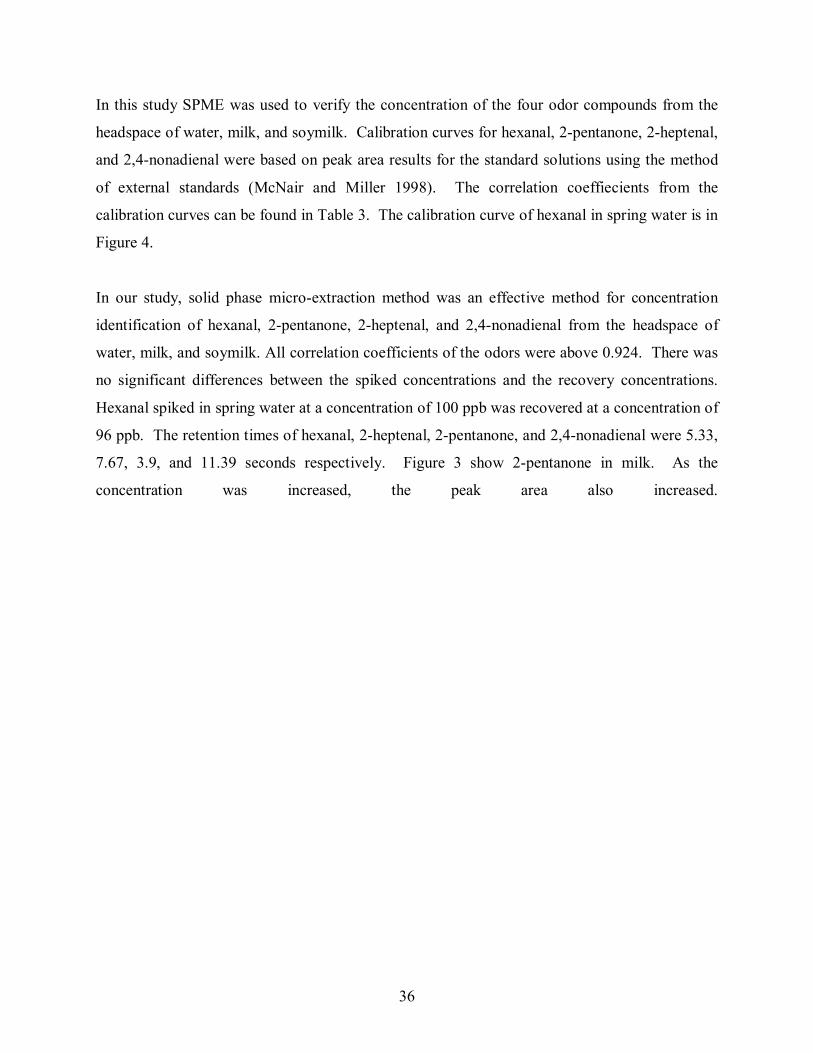
In this study SPME was used to verify the concentration of the four odor compounds from the
headspace of water, milk, and soymilk. Calibration curves for hexanal, 2-pentanone, 2-heptenal,
and 2,4-nonadienal were based on peak area results for the standard solutions using the method
of external standards (McNair and Miller 1998). The correlation coeffiecients from the
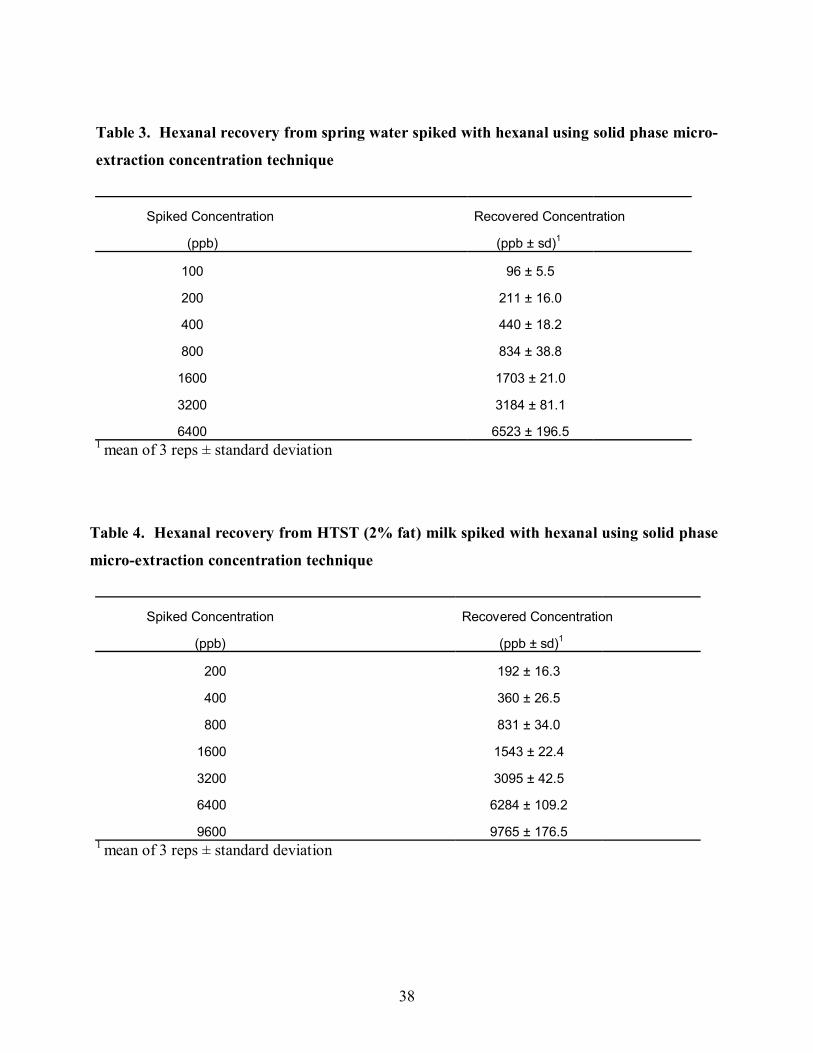
calibration curves can be found in Table 3. The calibration curve of hexanal in spring water is in
Figure 4.
In our study, solid phase micro-extraction method was an effective method for concentration
identification of hexanal, 2-pentanone, 2-heptenal, and 2,4-nonadienal from the headspace of
water, milk, and soymilk. All correlation coefficients of the odors were above 0.924. There was
no significant differences between the spiked concentrations and the recovery concentrations.
Hexanal spiked in spring water at a concentration of 100 ppb was recovered at a concentration of
96 ppb. The retention times of hexanal, 2-heptenal, 2-pentanone, and 2,4-nonadienal were 5.33,
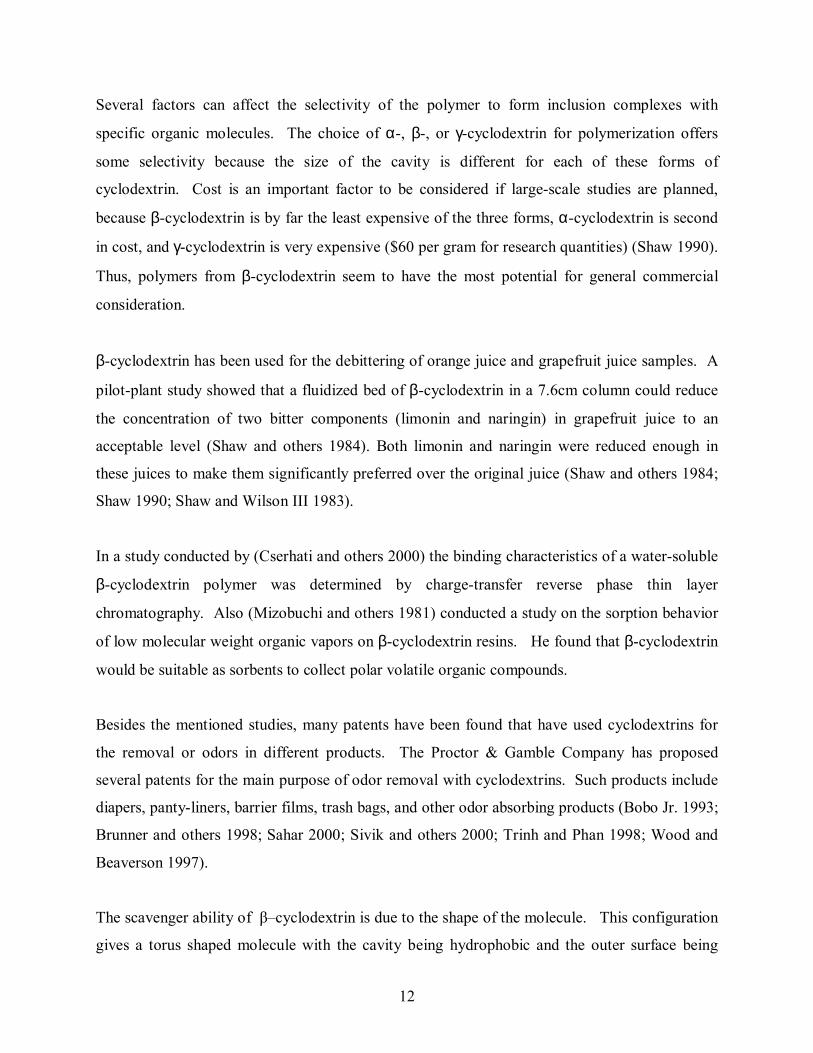
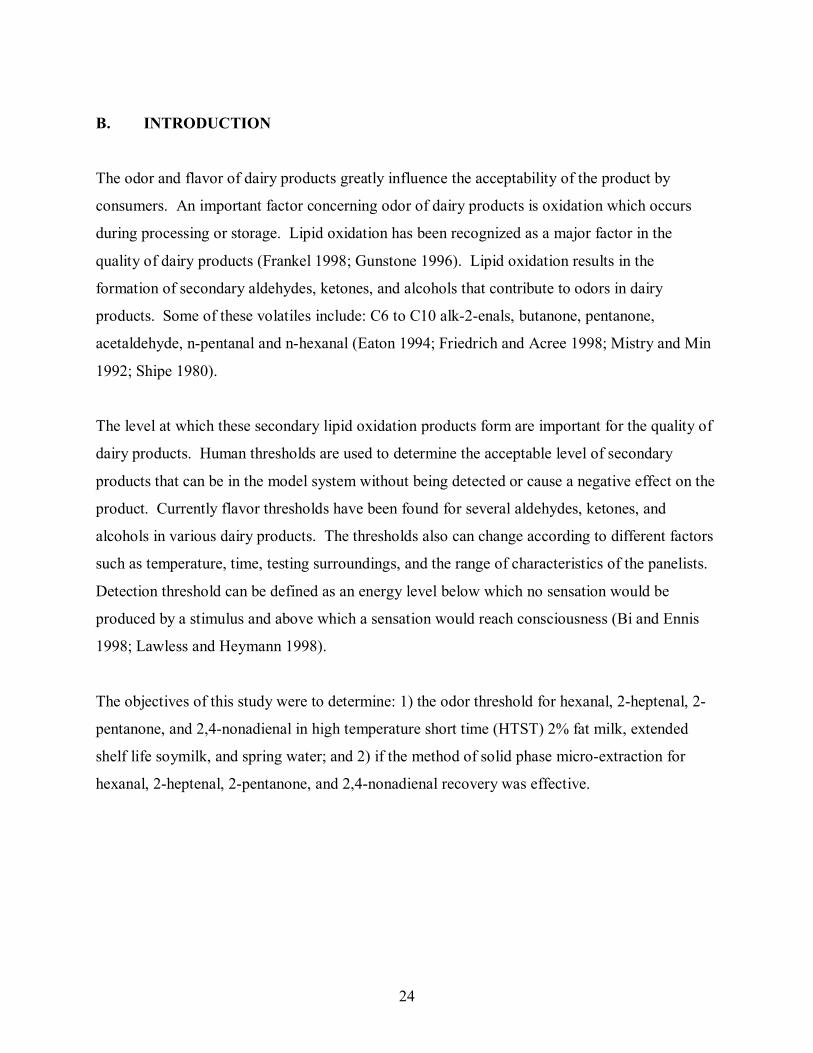
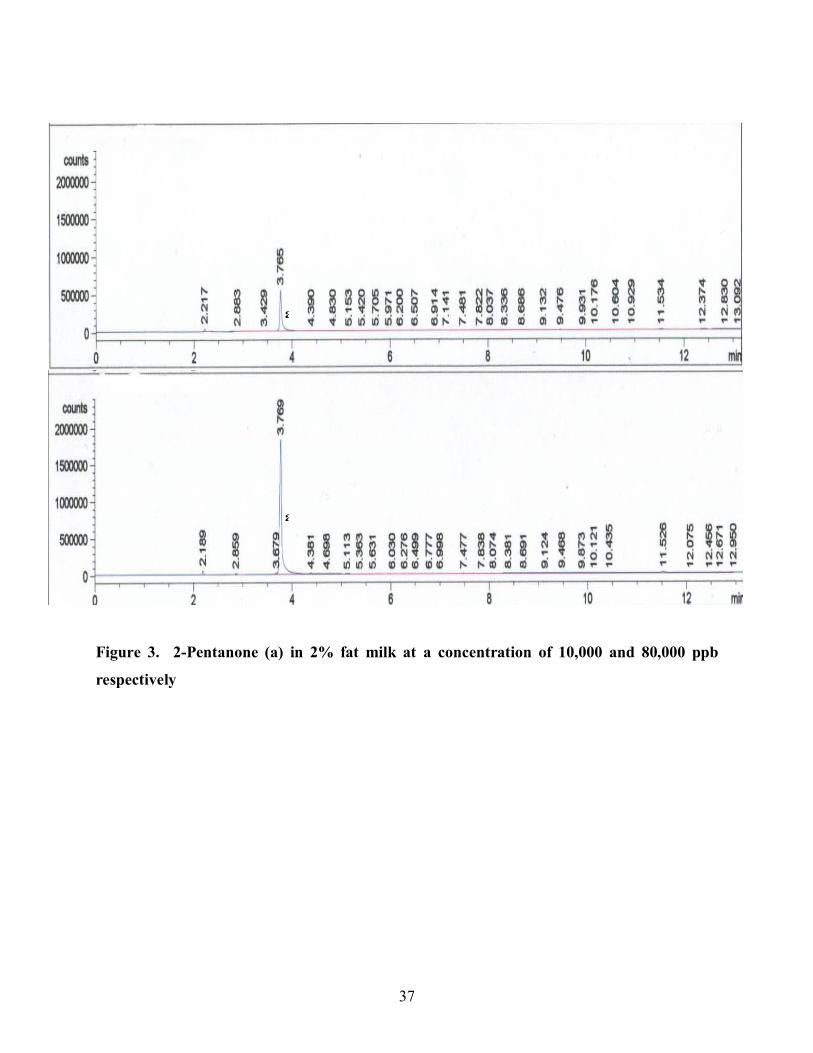
7.67, 3.9, and 11.39 seconds respectively. Figure 3 show 2-pentanone in milk. As the
concentration was increased, the peak area also increased.
37
Figure 3. 2-Pentanone (a) in 2% fat milk at a concentration of 10,000 and 80,000 ppb
respectively
a
a
38
Table 3. Hexanal recovery from spring water spiked with hexanal using solid phase micro-
extraction concentration technique
Spiked Concentration Recovered Concentration
(ppb) (ppb ± sd)1
100 96 ± 5.5
200 211 ± 16.0
400 440 ± 18.2
800 834 ± 38.8
1600 1703 ± 21.0
3200 3184 ± 81.1
6400 6523 ± 196.5 1 mean of 3 reps ± standard deviation
Table 4. Hexanal recovery from HTST (2% fat) milk spiked with hexanal using solid phase
micro-extraction concentration technique
Spiked Concentration Recovered Concentration
(ppb) (ppb ± sd)1
200 192 ± 16.3
400 360 ± 26.5
800 831 ± 34.0
1600 1543 ± 22.4
3200 3095 ± 42.5
6400 6284 ± 109.2
9600 9765 ± 176.5 1 mean of 3 reps ± standard deviation
39
E. CONCLUSION
Hexanal, 2-pentanone, 2-heptenal, and 2,4-nonadienal had different odor threshold levels.
Although soymilk had the highest threshold values for all of the odors, these were not
significantly different from milk, but was significantly different from spring water. This could
be due to the complex aromas in soymilk that resulted in the panelists having a harder time
detecting the given odor. Spring water had overall lower threshold values for all of the odors.
Water is usually very bland and normally does not exhibit a particular taste or odor. Therefore
the panelist could more easily identify the odor at lower concentrations.
Both hexanal and 2,4-nonadienal had lower thresholds than 2-heptenal and 2-pentanone in all of
the media. This would indicate that at lower concentrations, hexanal and 2,4-nonadienal could
alter the aroma of water, milk or soymilk. 2-Pentanone had a very high group odor threshold in
all three media. At a concentration of 29,255 ppb, 2-pentanone was detected in milk by
panelists. However, this concentration is very high, and would probably not be found in water,
milk, or soymilk. Therefore the reduction of 2-pentanone is not as much of a concern as the
other odors.
Solid phase micro-extraction is an effective method for detecting low levels of odor compounds.
It was an effective method for the recovery of hexanal, 2-pentanone, 2-heptenal, and 2,4-
nonadienal in spring water, milk, and soymilk in this study. The recovery of all odors was not
significantly different from the known concentration.
40
F. ACKNOWLEDGEMENT
I would like to thank Center for Advanced Processing and Packaging Studies for the financial
support of this project.
I would also like to thank Kim Waterman for her unending help with the threshold sensory panel.
Without her help I would have never made it through all those days of sensory testing. The
willing panelists that contributed to the sensory analysis of this project should also be thanked.
I would also like to thank my graduate committee, Dr. J.E. Marcy, Dr. S.E. Duncan, and Dr. S.
O�Keefe for their guidance and patience with me throughout this project.
41
G. REFERENCES Bi J, Ennis D. 1998. Sensory thresholds: concepts and methods. J Sensory Studies 13:133-48.
Eaton D. 1994. Dairy flavors. In: Gabelman A, editor. Bioprocess Production of Flavor,
Fragrance, and Color Ingredients. New York: John Wiley & Sons, Inc. p 169-199.
Finney DJ. 1971. Probit Analysis. 3rd. London: Cambridge University Press.
Frankel E. 1998. Lipid Oxidation. Dundee: The Oily Press LTD.
Friedrich J, Acree TE. 1998. Gas chromatography olfactory (GC/O) of dairy products. Int Dairy
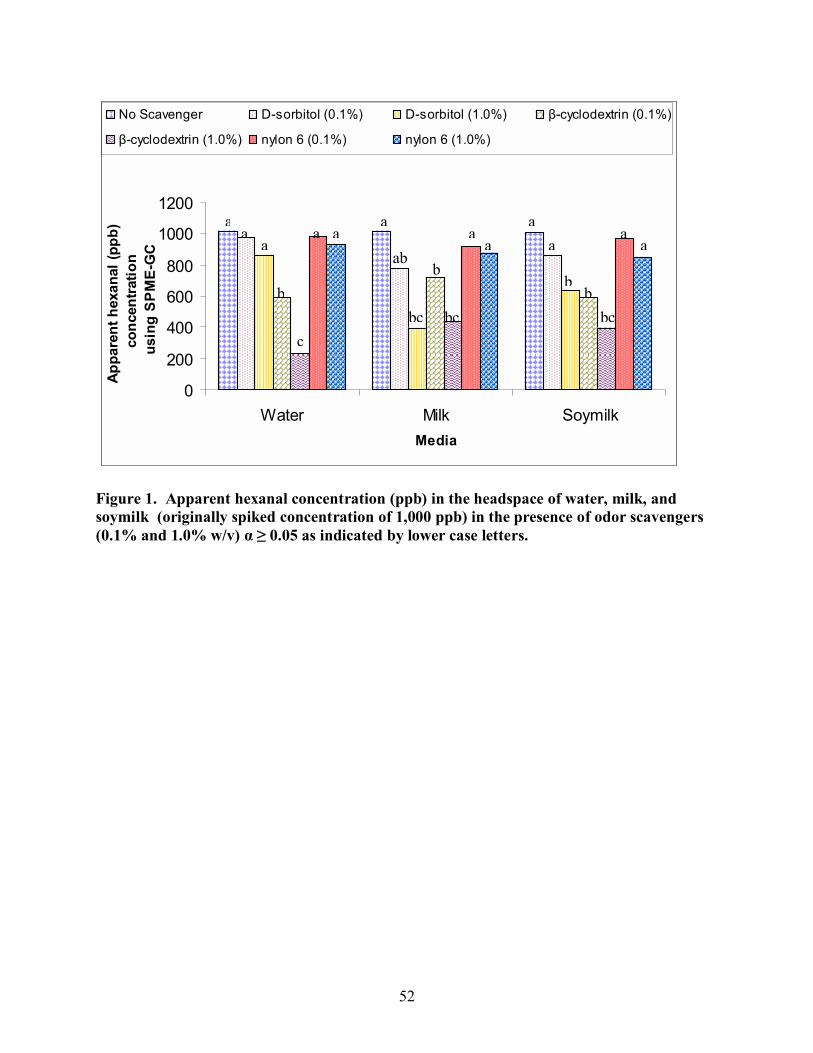
Figure 1. Apparent hexanal concentration (ppb) in the headspace of water, milk, and soymilk (originally spiked concentration of 1,000 ppb) in the presence of odor scavengers (0.1% and 1.0% w/v) α ≥ 0.05 as indicated by lower case letters.
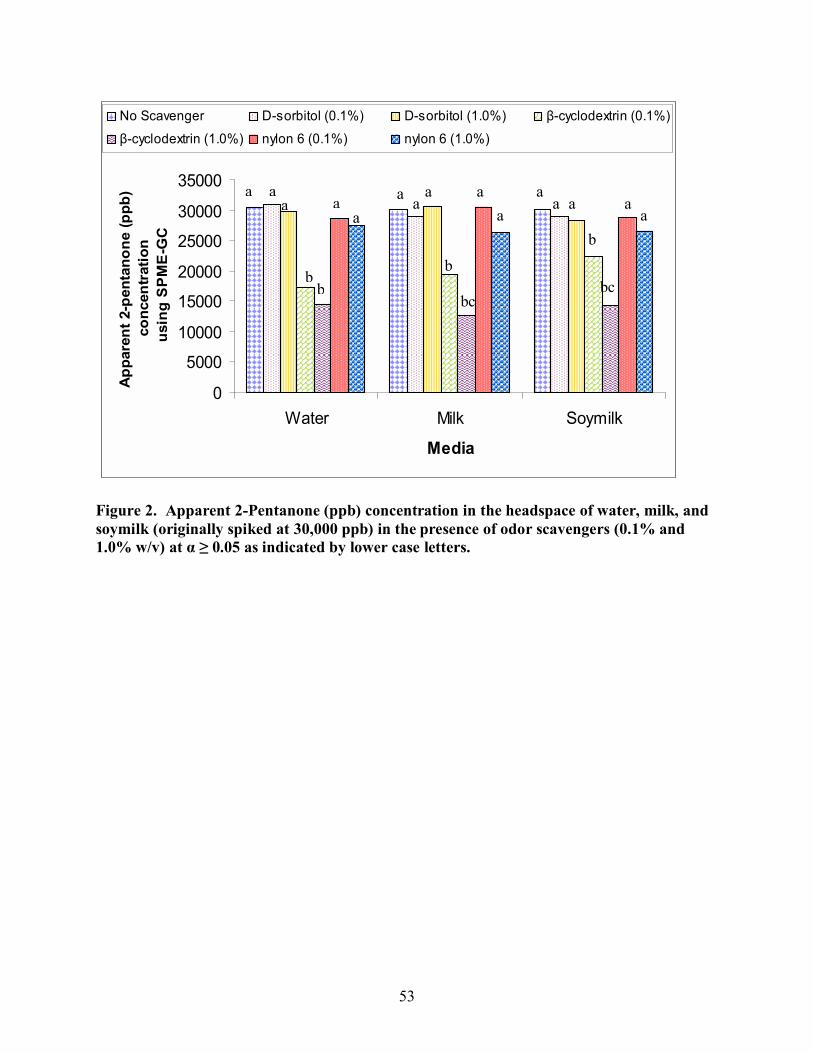
Figure 2. Apparent 2-Pentanone (ppb) concentration in the headspace of water, milk, and soymilk (originally spiked at 30,000 ppb) in the presence of odor scavengers (0.1% and 1.0% w/v) at α ≥ 0.05 as indicated by lower case letters.
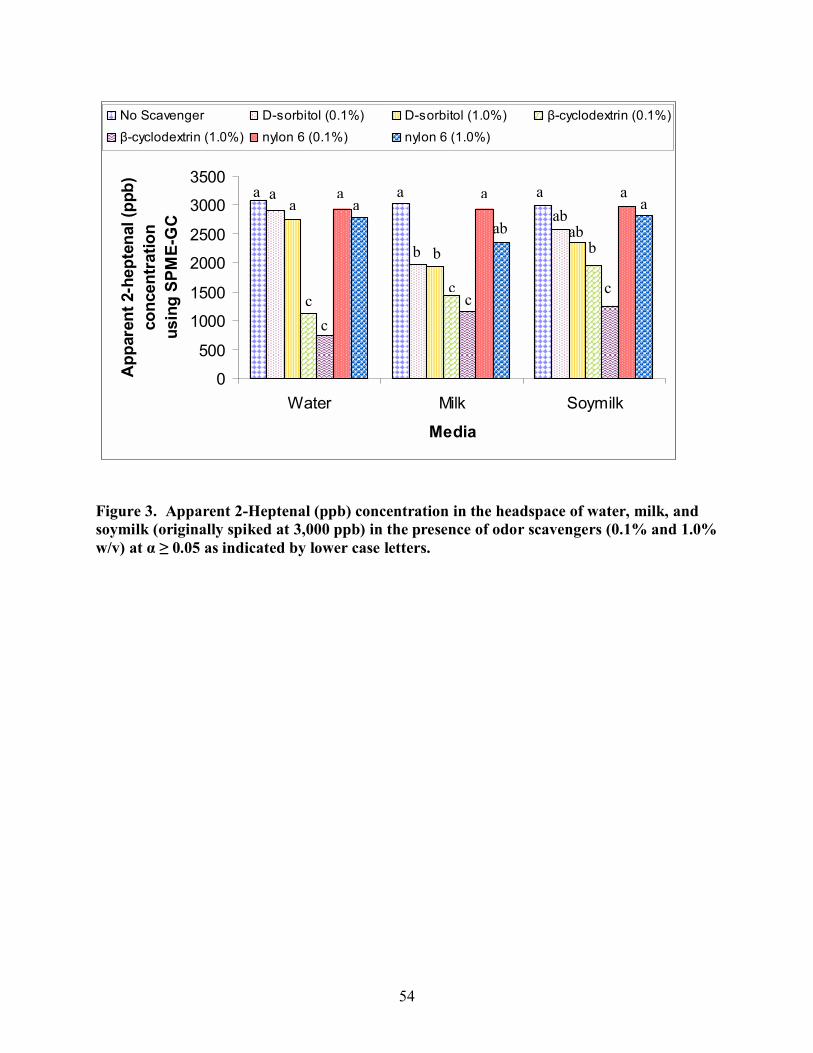
Figure 3. Apparent 2-Heptenal (ppb) concentration in the headspace of water, milk, and soymilk (originally spiked at 3,000 ppb) in the presence of odor scavengers (0.1% and 1.0% w/v) at α ≥ 0.05 as indicated by lower case letters.
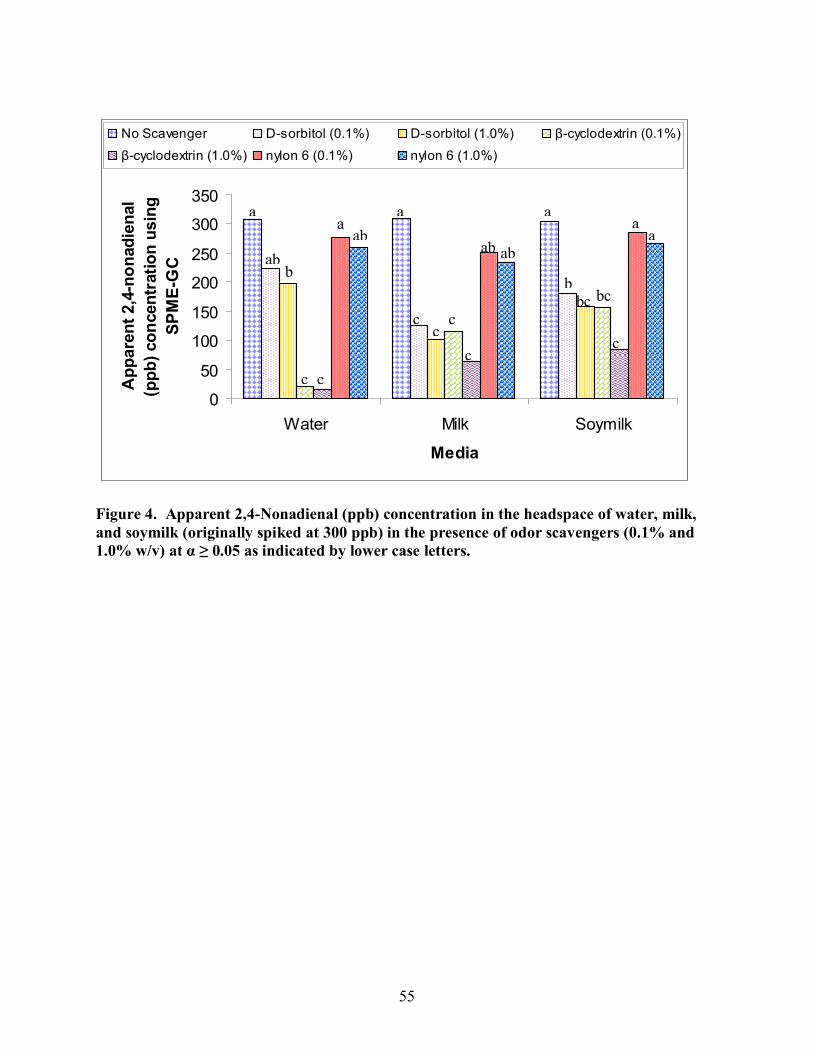
Figure 4. Apparent 2,4-Nonadienal (ppb) concentration in the headspace of water, milk, and soymilk (originally spiked at 300 ppb) in the presence of odor scavengers (0.1% and 1.0% w/v) at α ≥ 0.05 as indicated by lower case letters.
a a
ab
a
b
a
c c
ab
c c
c
c
ab ab
a
c
b bc
a
bc
56
(ii) Recovery of Odors
With the three media used in this study, there were no significant differences with the three
media used for recovery of odors. Figure 1 shows the apparent concentration (ppb) of hexanal in
spring water, 2% fat HTST milk, and soymilk in the presence of the odor scavengers. The
concentration of hexanal in the controls (no scavenger present) was 1029 ppb in water, 1009 ppb
in milk, and 1012 ppb in soymilk. Salt was added to both milk and soymilk to help the
partitioning of the odors into the headspace of the bottles. This addition of salt could have lead
to no significant differences found in between water, milk, and soymilk.
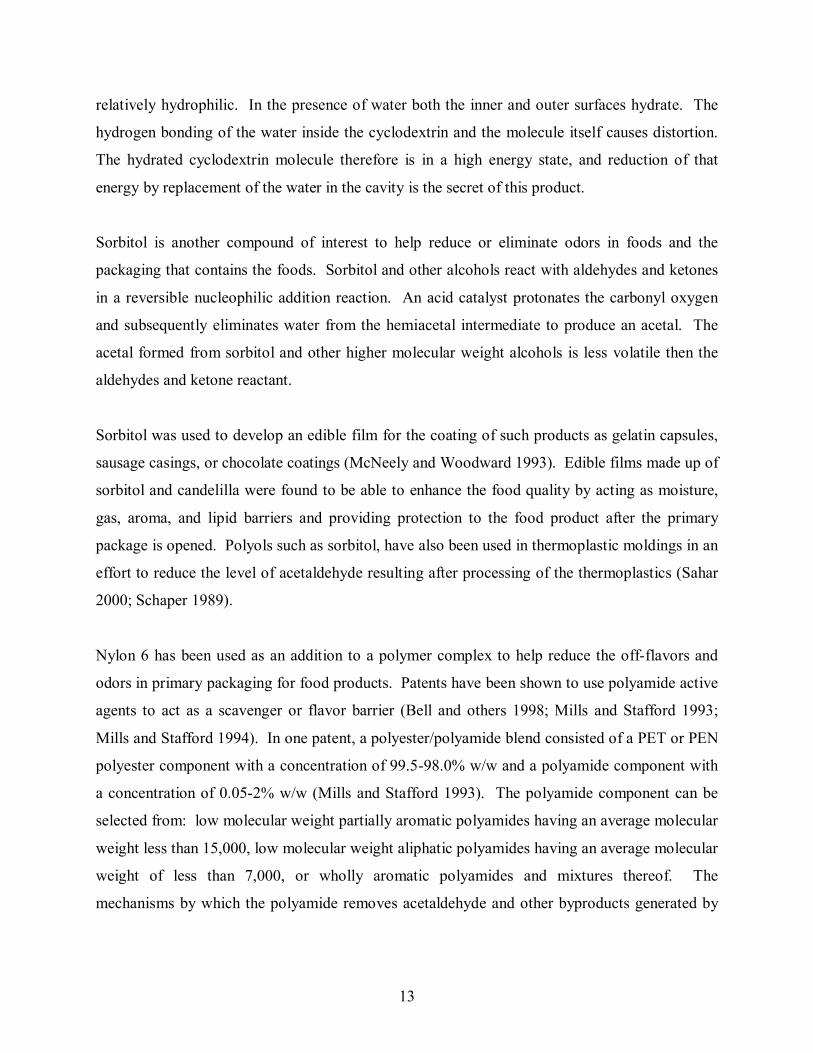
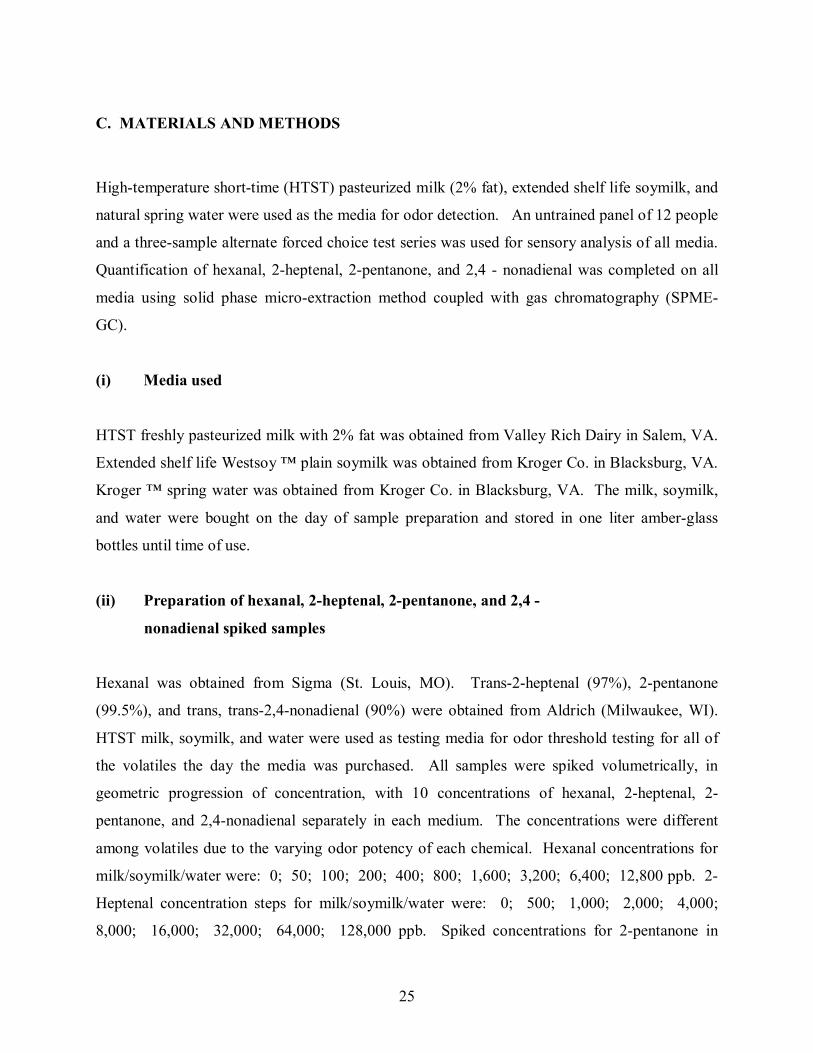
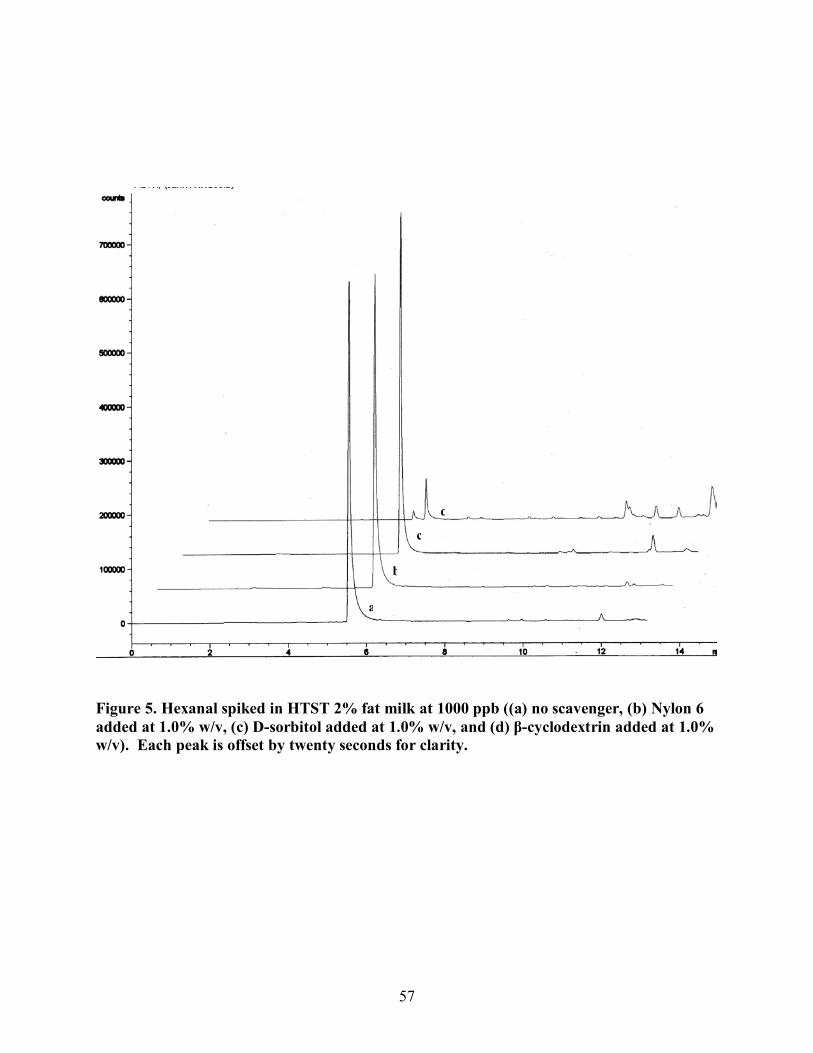
The concentration of hexanal spiked in 2% fat HTST milk at 1,000 ppb in the presence of 1.0%
w/v odor scavengers can be found in Figure 5. In this combination, β-cyclodextrin was the most
effective scavenger for hexanal. In water the apparent hexanal concentration was reduced from
1029 ppb to 594 ppb with 0.1% w/v β-cyclodextrin and 263 ppb with 1.0% w/v β-cyclodextrin.
This can be noted by the large reduction in the peak of hexanal in the figure. D-sorbitol also
showed a decrease in the concentration of hexanal, however the difference is harder to see in the
chromatograph shown in Figure 5.
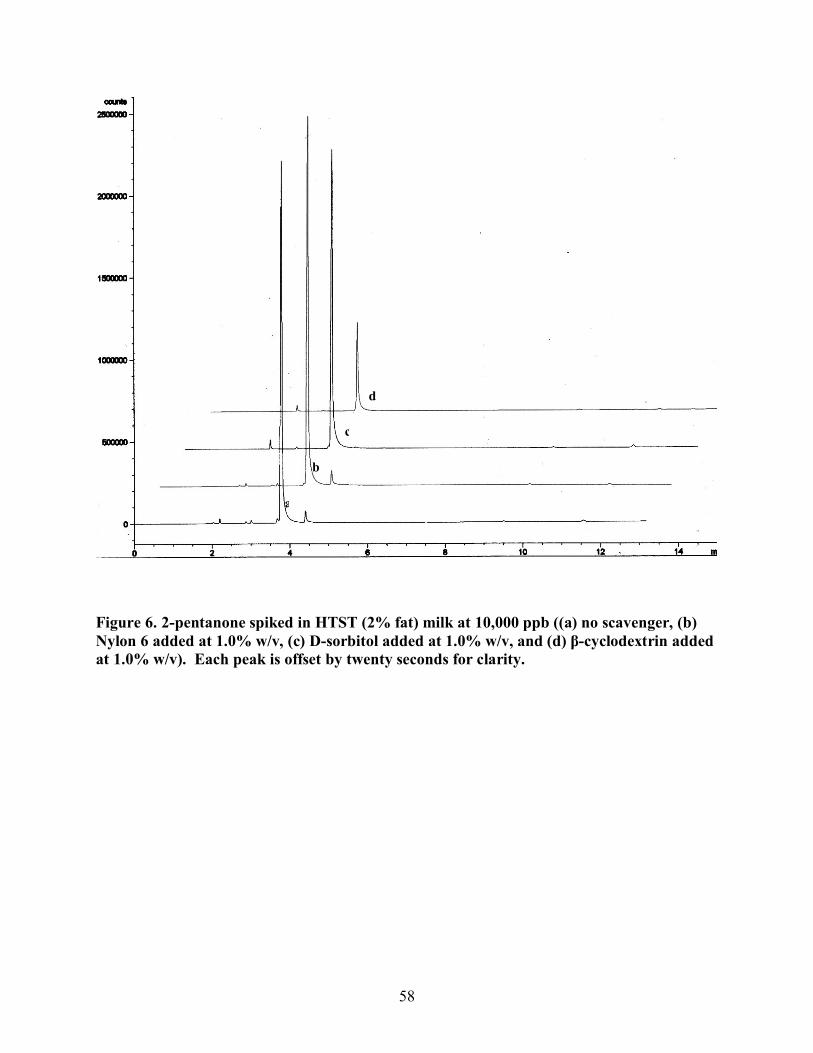
The effects of odor scavengers can also be seen in Figures 2, 3, and 4. Figure 6 shows the
apparent concentrations of 2-pentanone in 2% fat HTST milk in the presence of 1.0% w/v odor
scavengers. The odor scavengers had similar effects as seen in both Figures 5 and 6.
β-cyclodextrin again, was found have a significant difference on the concentration of 2-
pentanone in milk.
57
Figure 5. Hexanal spiked in HTST 2% fat milk at 1000 ppb ((a) no scavenger, (b) Nylon 6 added at 1.0% w/v, (c) D-sorbitol added at 1.0% w/v, and (d) β-cyclodextrin added at 1.0% w/v). Each peak is offset by twenty seconds for clarity.
a
b
c
d
58
Figure 6. 2-pentanone spiked in HTST (2% fat) milk at 10,000 ppb ((a) no scavenger, (b) Nylon 6 added at 1.0% w/v, (c) D-sorbitol added at 1.0% w/v, and (d) β-cyclodextrin added at 1.0% w/v). Each peak is offset by twenty seconds for clarity.
a
b
c
d
59
(iii) Sensory Evaluation Overall difference triangle tests were conducted on all the combinations of
odor/medium/scavenger that were found to be significantly different by means of SMPE-GC.
Nineteen triangle tests were completed and the results can be found in Table 1.
β-cyclodextrin was found significantly different in 10 out of the 19 combinations. In spring
water, milk, and soymilk, β-cyclodextrin significantly reduced the concentration of hexanal, 2-
pentanone, and 2-heptenal to an extent that was detectably different from the control. A small
reduction of 2,4-nonadienal in all of these media was found, however it was not significant.
D-sorbitol was not as effective as β-cyclodextrin, however some significant differences were
found. D-sorbitol was found to significantly reduce the concentration of hexanal, 2-pentanone,
and 2-heptenal in milk. 2,4-nonadienal was reduced significantly in both spring water and
soymilk.
There were noticeable differences in a few of the combinations involving nylon 6 as the
scavenger. However nylon 6 did not significantly reduce any of the odors in spring water, milk,
or soymilk. Due to this reason, nylon 6 was not used in the sensory evaluation of the scavenger
efficacy.
The people that participated in the panel consisted mainly of members that participated in the
threshold study of hexanal, 2-pentanone, 2-heptenal, and 2,4-nonadienal. Therefore they were
familiar with the odors in this overall difference test. The panelists showed that they did not
have the same sensitivity as SPME-GC when detecting differences in samples. Out of the 19
sensory triangle tests, five were found to be significantly different by the panelists. Panelists
found that the addition of β-cyclodextrin in both hexanal spiked spring water and milk made a
significant difference in the odor. They also found a significant difference in 2-pentanone spiked
milk with the addition of both β-cyclodextrin and D-sorbitol. The final difference was found in
2-heptenal spiked soymilk with the addition of D-sorbitol. The use of a trained sensory panel
could have found more significant differences between samples with scavengers. However,
60
since the overall goal of this study was to determine if the difference would be evident to the
general public, a general panel was used.
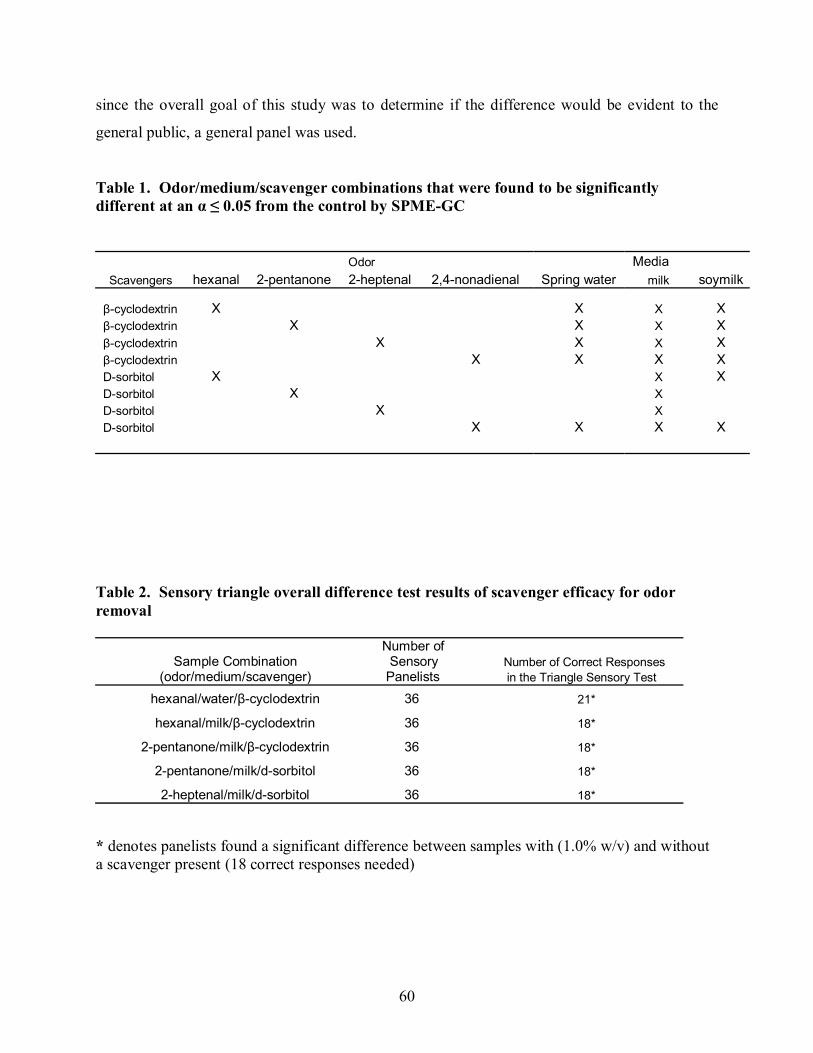
Table 1. Odor/medium/scavenger combinations that were found to be significantly different at an α ≤ 0.05 from the control by SPME-GC Odor Media Scavengers hexanal 2-pentanone 2-heptenal 2,4-nonadienal Spring water milk soymilk
β-cyclodextrin X X X X β-cyclodextrin X X X X β-cyclodextrin X X X X β-cyclodextrin X X X X D-sorbitol X X X D-sorbitol X X D-sorbitol X X D-sorbitol X X X X
Table 2. Sensory triangle overall difference test results of scavenger efficacy for odor removal
Sample Combination Number of Sensory Number of Correct Responses
(odor/medium/scavenger) Panelists in the Triangle Sensory Test
hexanal/water/β-cyclodextrin 36 21*
hexanal/milk/β-cyclodextrin 36 18*
2-pentanone/milk/β-cyclodextrin 36 18*
2-pentanone/milk/d-sorbitol 36 18*
2-heptenal/milk/d-sorbitol 36 18*
* denotes panelists found a significant difference between samples with (1.0% w/v) and without a scavenger present (18 correct responses needed)
61
E. CONCLUSIONS
Using SPME-GC a significant difference in the concentration of hexanal in both spring water
and 2% fat HTST milk was found in the presence of β-cyclodextrin. A significant decrease in 2-
pentanone in 2% fat HTST milk with the addition of both β-cyclodextrin and D-sorbitol was also
found. The final significant decrease was found in 2-heptenal in soymilk with the addition of D-
sorbitol. All of these combinations were also found to have an overall difference in odor
between the samples with and without the odor scavengers by a sensory panel. This shows that
β-cyclodextrin would be a good additive to the packaging system that contains milk or soymilk
to decrease the odors caused by lipid oxidation. However, since β-cyclodextrin is very reactive
with low molecular weight compounds, there is a possibility that desirable aromas could also be
scavenged by β-cyclodextrin. This reactivity could lead to further research involving β-
cyclodextrin as a pontential scavenger in food packaging.
In general, nylon 6 was not effective as an odor scavenger in this study. Nylon 6 did show a
slight decrease in odors, however was not found significant enough for use. Even though nylon
6 was not found effective in this study, it is still currently being used for its scavenger abilities of
other compounds in packaging systems and should not be left out of the potential scavengers for
odor removal.
β-cyclodextrin and D-sorbitol were found to be effective odor scavengers in this study by both
SMPE-GC and sensory evaluation. There were 19 total odor/scavenger/media combinations that
resulted in significantly lower concentrations of the odor than the controls (without scavengers)
when interpreting the data from SPME-GC. However, only 5 of these combinations proved to be
detected as a significant difference by a sensory panel that represented the general public. It is
possible that if the sensory panel was trained in identifying these odors, the overall differences
found by the sensory panel could have been larger.
62
F. ACKNOWLEDGEMENTS
I would like to thank the Center for Advanced Processing and Packaging Studies for the funding
of this project.
I would also like to thank Kim Waterman for her help with the sensory evaluation and all the
students, faculty, and staff that participated in the sensory panels. Without them I would not
have been able to complete my research.
Finally I would like to thank my committee members Dr. J. E. Marcy, Dr. S. E. Duncan, and Dr.
S. F. O�Keefe for their help and encouragement in this project.
63
G. REFERENCES Brunner GF, Trinh T, Inglin TA, inventors; The Proctor & Gamble Company, assignee. 1998
March 31. Absorbent articles for odor control with positive scent signal. US Patent
5,733,272.
Eaton D. 1994. Dairy flavors. In: Gabelman A, editor. Bioprocess Production of Flavor,
Fragrance, and Color Ingredients. New York: John Wiley & Sons, Inc. p 169-199.
Frankel E. 1998. Lipid Oxidation. Dundee: The Oily Press LTD. p 45-77.
Friedrich J, Acree TE. 1998. Gas chromatography olfactory (GC/O) of dairy products. Int Dairy
J 8:235-41.
Gavara R, Catala R, Hernandez-Munoz P. 1997. Study of aroma scalping through thermosealable
polymers used in food packaging by inverse gas chromatography. Food Add Cont 14(6-
Virginia Polytechnic Institute and State University
Informed Consent for Participation in Sensory Evaluation
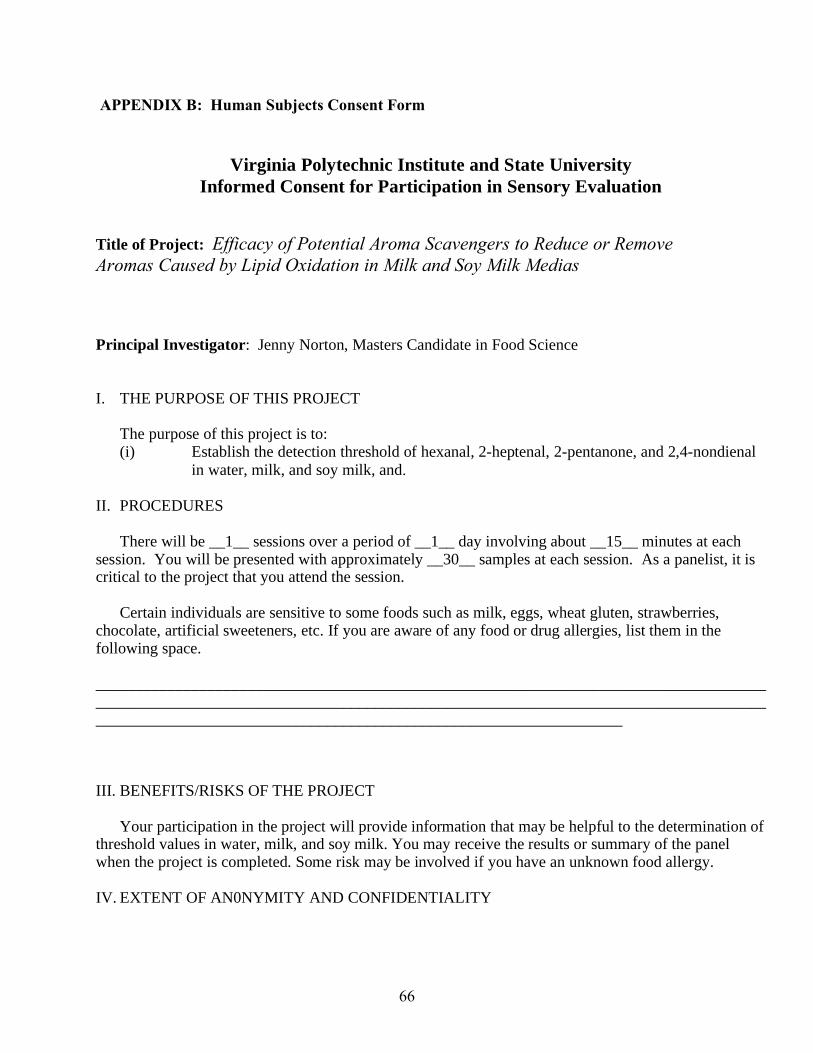
Title of Project: Efficacy of Potential Aroma Scavengers to Reduce or Remove Aromas Caused by Lipid Oxidation in Milk and Soy Milk Medias
Principal Investigator: Jenny Norton, Masters Candidate in Food Science I. THE PURPOSE OF THIS PROJECT The purpose of this project is to:
(i) Establish the detection threshold of hexanal, 2-heptenal, 2-pentanone, and 2,4-nondienal in water, milk, and soy milk, and.
II. PROCEDURES There will be __1__ sessions over a period of __1__ day involving about __15__ minutes at each session. You will be presented with approximately __30__ samples at each session. As a panelist, it is critical to the project that you attend the session. Certain individuals are sensitive to some foods such as milk, eggs, wheat gluten, strawberries, chocolate, artificial sweeteners, etc. If you are aware of any food or drug allergies, list them in the following space. __________________________________________________________________________________________________________________________________________________________________________________________________________________________________________ III. BENEFITS/RISKS OF THE PROJECT Your participation in the project will provide information that may be helpful to the determination of threshold values in water, milk, and soy milk. You may receive the results or summary of the panel when the project is completed. Some risk may be involved if you have an unknown food allergy. IV. EXTENT OF AN0NYMITY AND CONFIDENTIALITY
67
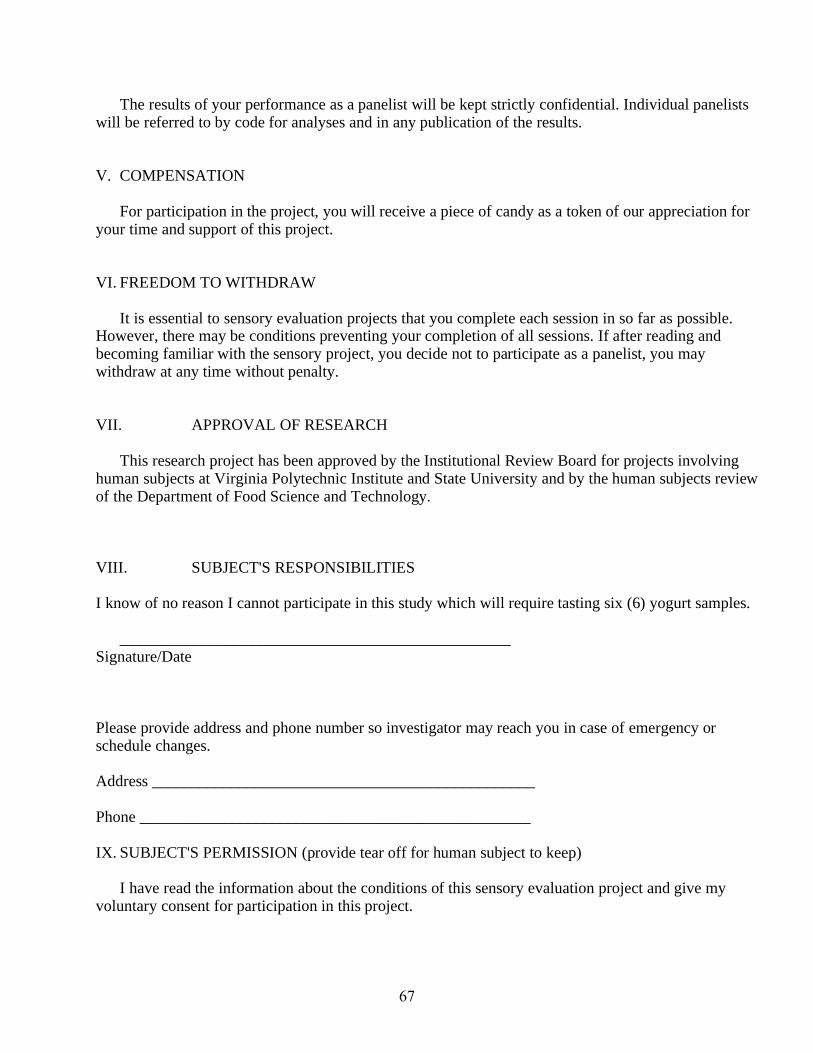
The results of your performance as a panelist will be kept strictly confidential. Individual panelists will be referred to by code for analyses and in any publication of the results. V. COMPENSATION For participation in the project, you will receive a piece of candy as a token of our appreciation for your time and support of this project. VI. FREEDOM TO WITHDRAW It is essential to sensory evaluation projects that you complete each session in so far as possible. However, there may be conditions preventing your completion of all sessions. If after reading and becoming familiar with the sensory project, you decide not to participate as a panelist, you may withdraw at any time without penalty. VII. APPROVAL OF RESEARCH This research project has been approved by the Institutional Review Board for projects involving human subjects at Virginia Polytechnic Institute and State University and by the human subjects review of the Department of Food Science and Technology. VIII. SUBJECT'S RESPONSIBILITIES I know of no reason I cannot participate in this study which will require tasting six (6) yogurt samples. _________________________________________________ Signature/Date Please provide address and phone number so investigator may reach you in case of emergency or schedule changes. Address ________________________________________________ Phone _________________________________________________ IX. SUBJECT'S PERMISSION (provide tear off for human subject to keep) I have read the information about the conditions of this sensory evaluation project and give my voluntary consent for participation in this project.
68
I know of no reason I cannot participate in this study which will require: (list sessions to be attended or other requirements.) ___________________________________________________________________ Signature Should I have any questions about this research or its conduct, I should contact: Jenny Norton (540) 231-8675 Investigator/Phone Dr. Susan E. Duncan (540)231-8675 Investigator/Phone Food Science & Technology (540)231-6806 Faculty/Phone
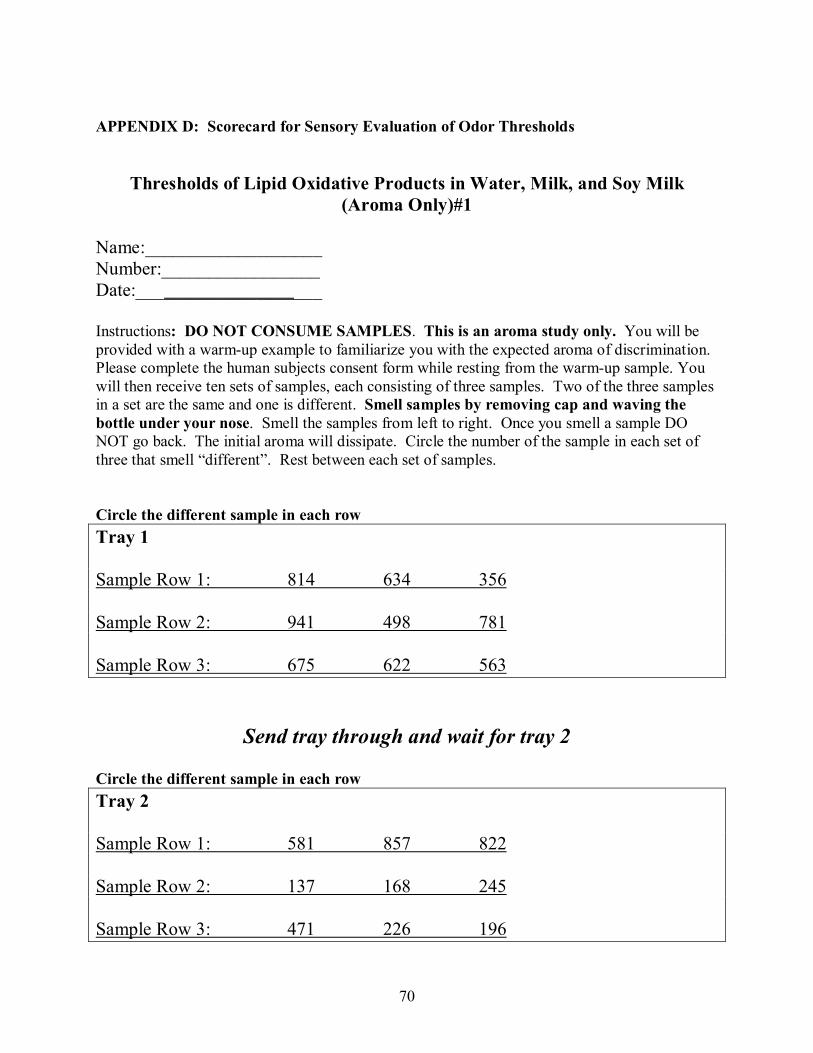
APPENDIX D: Scorecard for Sensory Evaluation of Odor Thresholds
Thresholds of Lipid Oxidative Products in Water, Milk, and Soy Milk (Aroma Only)#1
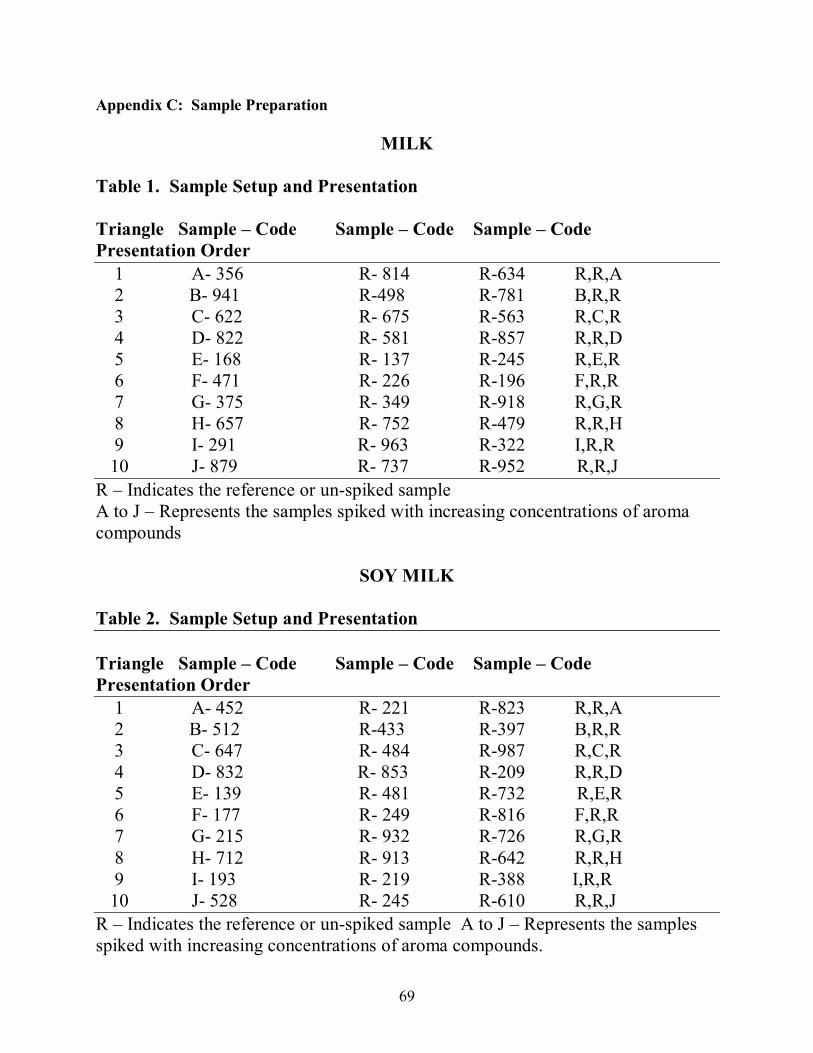
Name:___________________ Number:_________________ Date:____________________ Instructions: DO NOT CONSUME SAMPLES. This is an aroma study only. You will be provided with a warm-up example to familiarize you with the expected aroma of discrimination. Please complete the human subjects consent form while resting from the warm-up sample. You will then receive ten sets of samples, each consisting of three samples. Two of the three samples in a set are the same and one is different. Smell samples by removing cap and waving the bottle under your nose. Smell the samples from left to right. Once you smell a sample DO NOT go back. The initial aroma will dissipate. Circle the number of the sample in each set of three that smell �different�. Rest between each set of samples. Circle the different sample in each row Tray 1 Sample Row 1: 814 634 356 Sample Row 2: 941 498 781 Sample Row 3: 675 622 563
Send tray through and wait for tray 2
Circle the different sample in each row Tray 2 Sample Row 1: 581 857 822 Sample Row 2: 137 168 245 Sample Row 3: 471 226 196
71
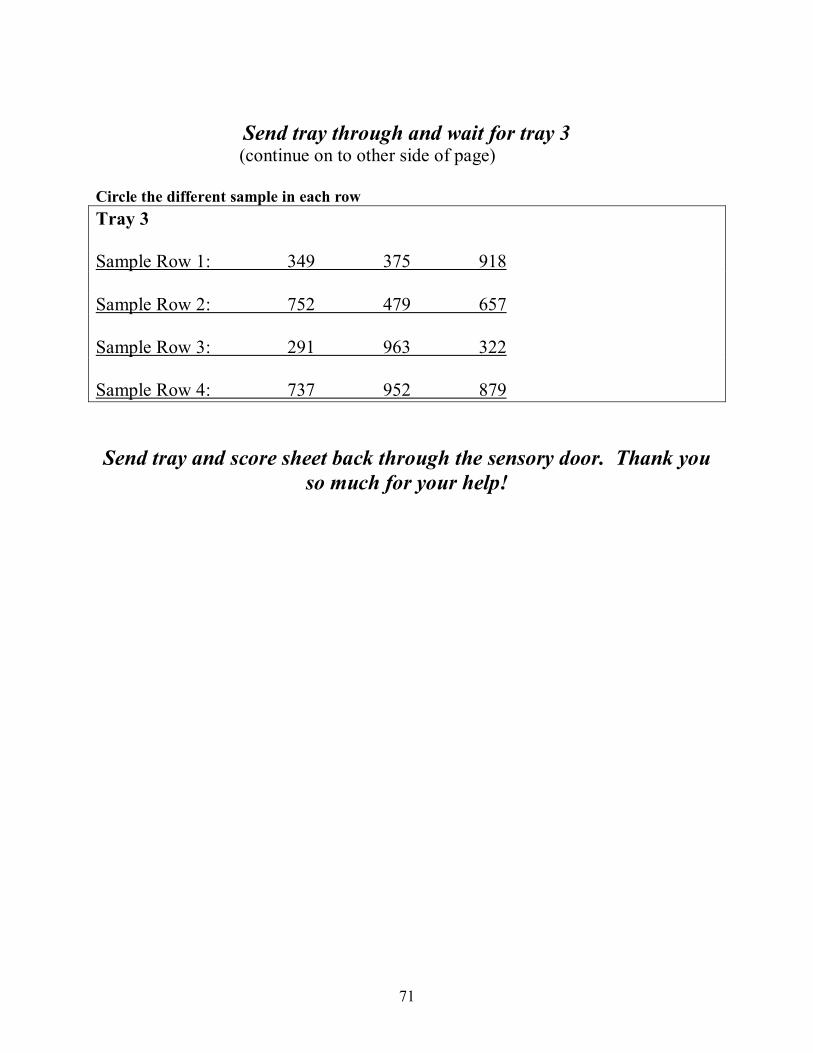
Send tray through and wait for tray 3
(continue on to other side of page) Circle the different sample in each row Tray 3 Sample Row 1: 349 375 918 Sample Row 2: 752 479 657 Sample Row 3: 291 963 322 Sample Row 4: 737 952 879 Send tray and score sheet back through the sensory door. Thank you
so much for your help!
72
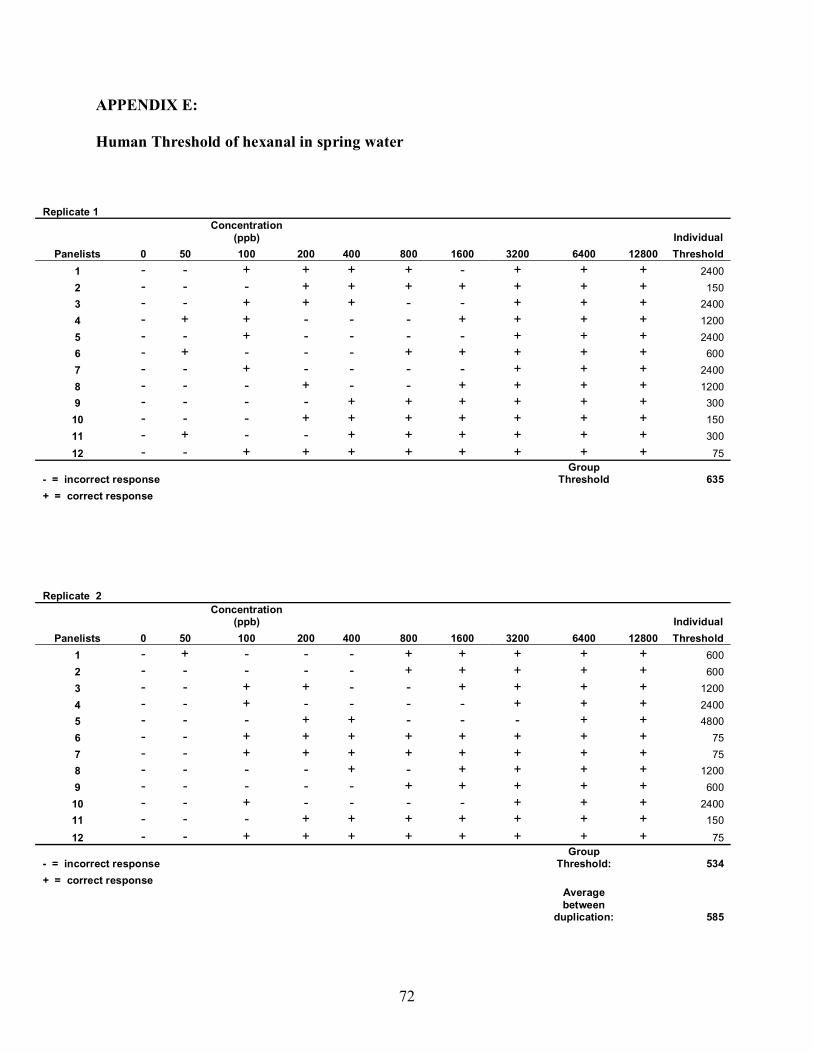
APPENDIX E: Human Threshold of hexanal in spring water
APPENDIX F: Human Consent Forms to Triangle Test for Scavenger Efficiency
Virginia Polytechnic Institute and State University Informed Consent for Participation in Sensory Evaluation
Title of Project: Efficacy of Aroma Scavengers in Reducing or Eliminating Odor Compounds Caused by Lipid Oxidation in Milk and Soy Milk
Principal Investigator: Jenny Norton, Masters Candidate in Food Science I. THE PURPOSE OF THIS PROJECT The purpose of this project is to:
(ii) Determine the efficacy of D-sorbitol, β-cyclodextrin, and nylon 6 as aroma scavengers in reducing the amount of hexanal, 2-heptenal, 2-pentanone, and 2,4-nonadienal in milk and soy milk samples.
II. PROCEDURES There will be_4_ sessions over a period of _4_ day involving about __10__ minutes at each session. You will be presented with approximately _9__ samples at each session. As a panelist, it is critical to the project that you attend the session. Certain individuals are sensitive to some foods such as milk, eggs, wheat gluten, strawberries, chocolate, artificial sweeteners, etc. If you are aware of any food or drug allergies, list them in the following space. __________________________________________________________________________________________________________________________________________________________________________________________________________________________________________ III. BENEFITS/RISKS OF THE PROJECT Your participation in the project will provide information that will show whether the aroma scavengers listed above are affective in reducing the odor caused by lipid oxidation in milk and soy milk. You may receive the results or summary of the panel when the project is completed. Some risk may be involved if you have an unknown food allergy. However, this is an aroma test so risks are minimal.
85
IV. EXTENT OF AN0NYMITY AND CONFIDENTIALITY The results of your performance as a panelist will be kept strictly confidential. Individual panelists will be referred to by code for analyses and in any publication of the results. V. COMPENSATION For participation in the project, you will receive a piece of candy as a token of our appreciation for your time and support of this project. VI. FREEDOM TO WITHDRAW It is essential to sensory evaluation projects that you complete each session in soon as possible. However, there may be conditions preventing your completion of all sessions. If after reading and becoming familiar with the sensory project, you decide not to participate as a panelist, you may withdraw at any time without penalty. VII. APPROVAL OF RESEARCH This research project has been approved by the Institutional Review Board for projects involving human subjects at Virginia Polytechnic Institute and State University and by the human subjects review of the Department of Food Science and Technology. VIII. SUBJECT'S RESPONSIBILITIES I know of no reason I cannot participate in this study which will require tasting six (6) yogurt samples. _________________________________________________ Signature/Date Please provide address and phone number so investigator may reach you in case of emergency or schedule changes. Address ________________________________________________ Phone _________________________________________________ -------------------------------------------------------(tear off)------------------------------------------------- IX. SUBJECT'S PERMISSION (provide tear off for human subject to keep)
86
I have read the information about the conditions of this sensory evaluation project and give my voluntary consent for participation in this project. I know of no reason I cannot participate in this study which will require: (list sessions to be attended or other requirements.) ___________________________________________________________________ Signature Should I have any questions about this research or its conduct, I should contact: Jenny Norton (540) 231-8675 Investigator/Phone Dr. Susan E. Duncan (540)231-8675 Investigator/Phone Food Science & Technology (540)231-6806 Faculty/Phone
87
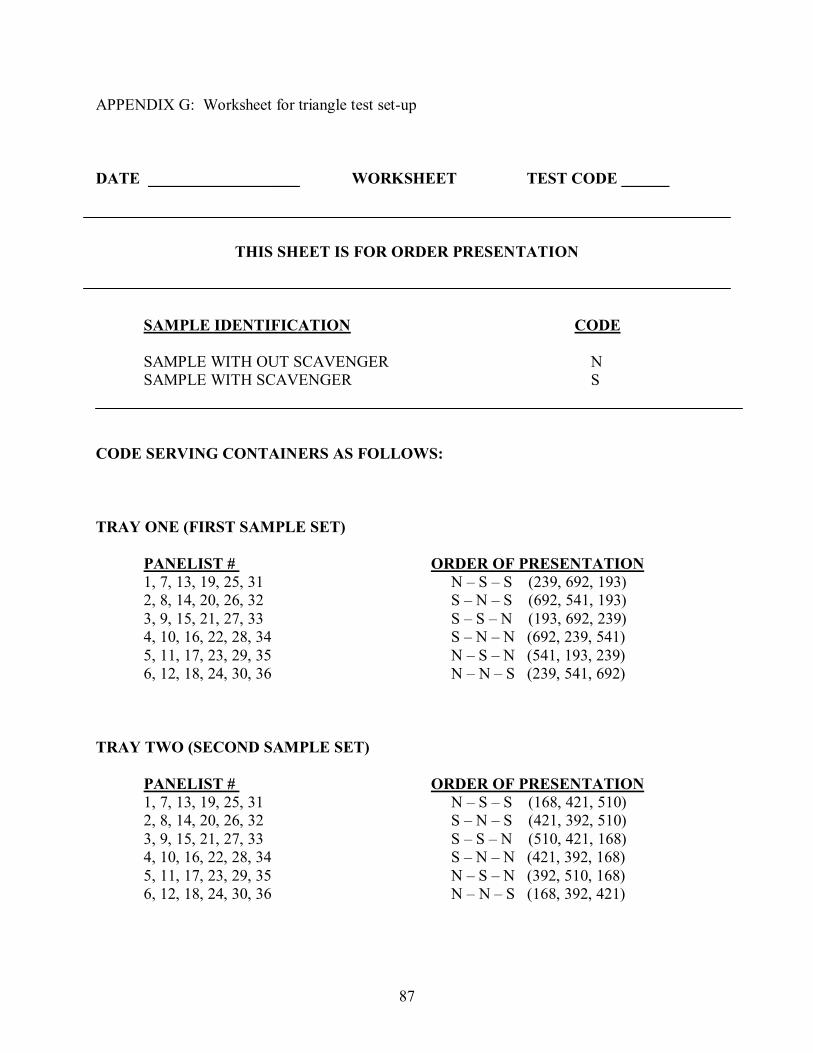
APPENDIX G: Worksheet for triangle test set-up DATE ___________________ WORKSHEET TEST CODE ______
THIS SHEET IS FOR ORDER PRESENTATION
SAMPLE IDENTIFICATION CODE
SAMPLE WITH OUT SCAVENGER N SAMPLE WITH SCAVENGER S CODE SERVING CONTAINERS AS FOLLOWS: TRAY ONE (FIRST SAMPLE SET) PANELIST # ORDER OF PRESENTATION 1, 7, 13, 19, 25, 31 N � S � S (239, 692, 193) 2, 8, 14, 20, 26, 32 S � N � S (692, 541, 193) 3, 9, 15, 21, 27, 33 S � S � N (193, 692, 239) 4, 10, 16, 22, 28, 34 S � N � N (692, 239, 541) 5, 11, 17, 23, 29, 35 N � S � N (541, 193, 239) 6, 12, 18, 24, 30, 36 N � N � S (239, 541, 692) TRAY TWO (SECOND SAMPLE SET) PANELIST # ORDER OF PRESENTATION 1, 7, 13, 19, 25, 31 N � S � S (168, 421, 510) 2, 8, 14, 20, 26, 32 S � N � S (421, 392, 510) 3, 9, 15, 21, 27, 33 S � S � N (510, 421, 168) 4, 10, 16, 22, 28, 34 S � N � N (421, 392, 168) 5, 11, 17, 23, 29, 35 N � S � N (392, 510, 168) 6, 12, 18, 24, 30, 36 N � N � S (168, 392, 421)
88
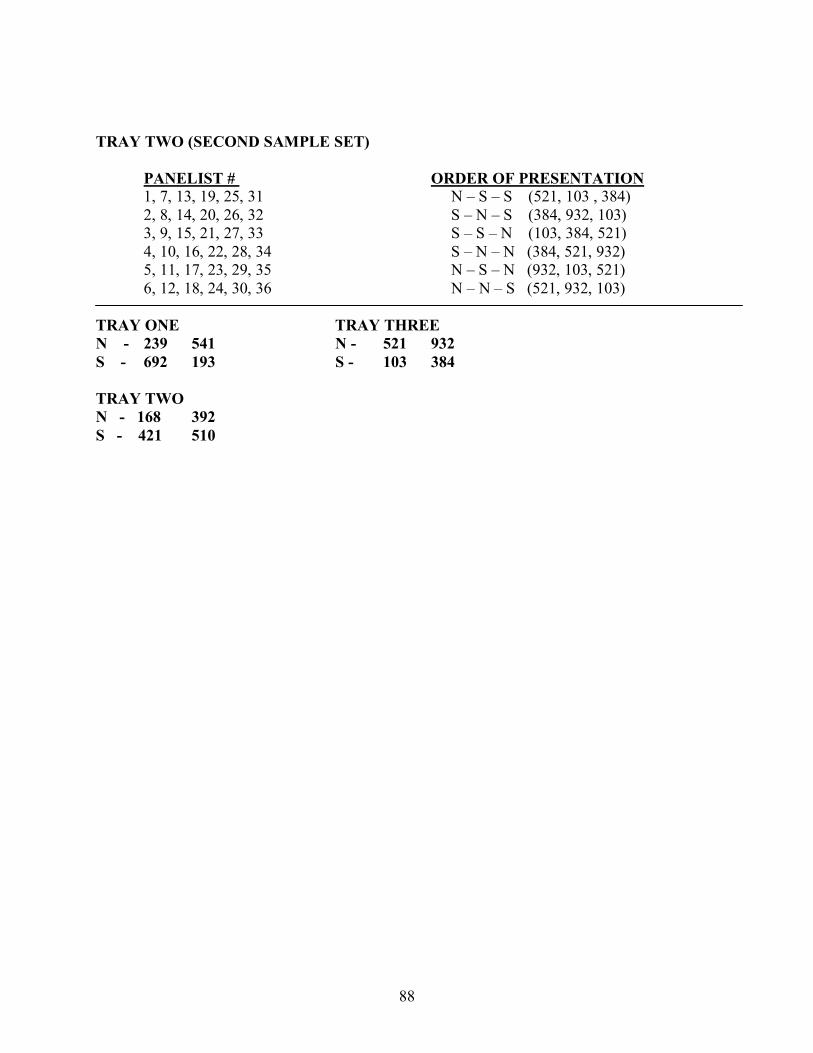
TRAY TWO (SECOND SAMPLE SET) PANELIST # ORDER OF PRESENTATION 1, 7, 13, 19, 25, 31 N � S � S (521, 103 , 384) 2, 8, 14, 20, 26, 32 S � N � S (384, 932, 103) 3, 9, 15, 21, 27, 33 S � S � N (103, 384, 521) 4, 10, 16, 22, 28, 34 S � N � N (384, 521, 932) 5, 11, 17, 23, 29, 35 N � S � N (932, 103, 521) 6, 12, 18, 24, 30, 36 N � N � S (521, 932, 103) TRAY ONE TRAY THREE N - 239 541 N - 521 932 S - 692 193 S - 103 384 TRAY TWO N - 168 392 S - 421 510
89
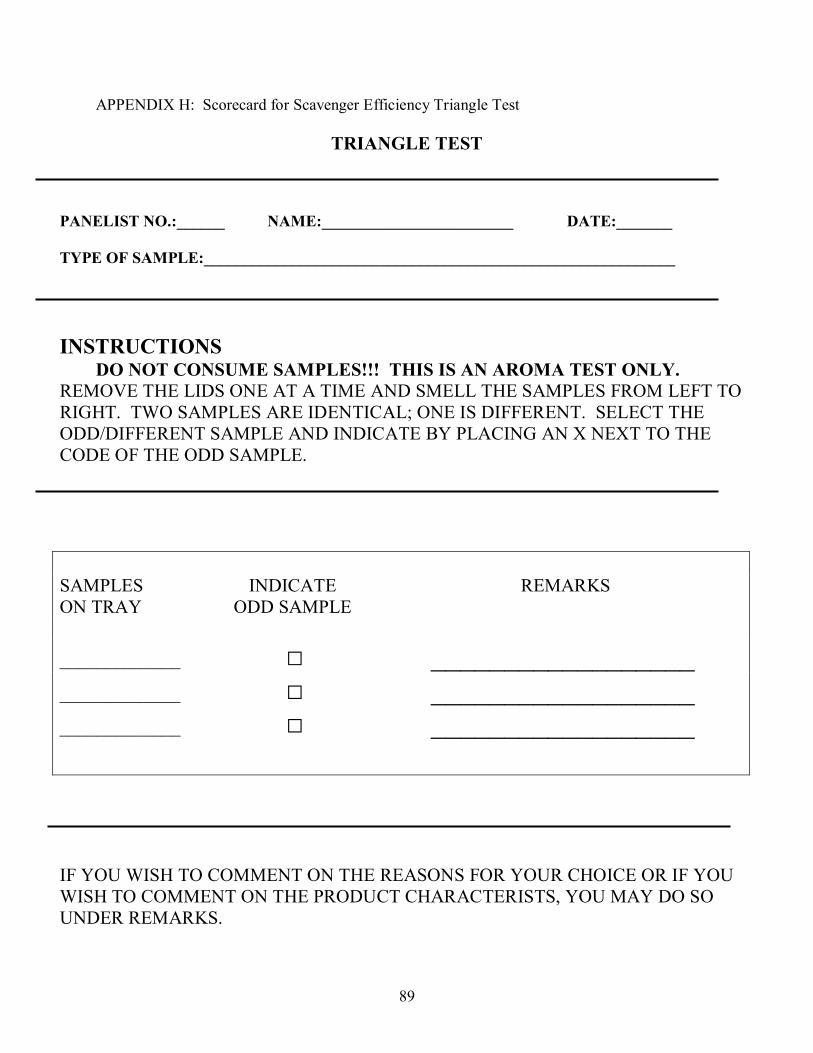
APPENDIX H: Scorecard for Scavenger Efficiency Triangle Test
TRIANGLE TEST
PANELIST NO.:______ NAME:________________________ DATE:_______ TYPE OF SAMPLE:___________________________________________________________ INSTRUCTIONS DO NOT CONSUME SAMPLES!!! THIS IS AN AROMA TEST ONLY. REMOVE THE LIDS ONE AT A TIME AND SMELL THE SAMPLES FROM LEFT TO RIGHT. TWO SAMPLES ARE IDENTICAL; ONE IS DIFFERENT. SELECT THE ODD/DIFFERENT SAMPLE AND INDICATE BY PLACING AN X NEXT TO THE CODE OF THE ODD SAMPLE.
SAMPLES INDICATE REMARKS ON TRAY ODD SAMPLE
_____________ □ __________________ _____________ □ __________________ _____________ □ __________________ IF YOU WISH TO COMMENT ON THE REASONS FOR YOUR CHOICE OR IF YOU WISH TO COMMENT ON THE PRODUCT CHARACTERISTS, YOU MAY DO SO UNDER REMARKS.
90
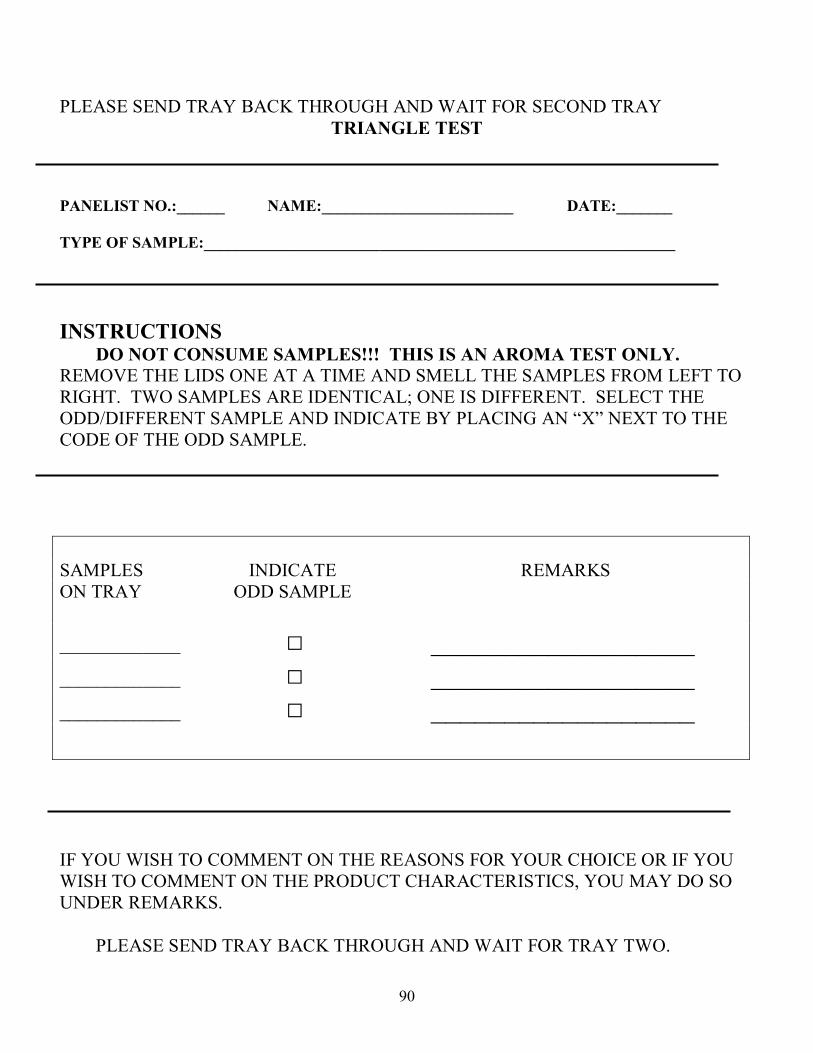
PLEASE SEND TRAY BACK THROUGH AND WAIT FOR SECOND TRAY TRIANGLE TEST
PANELIST NO.:______ NAME:________________________ DATE:_______ TYPE OF SAMPLE:___________________________________________________________ INSTRUCTIONS DO NOT CONSUME SAMPLES!!! THIS IS AN AROMA TEST ONLY. REMOVE THE LIDS ONE AT A TIME AND SMELL THE SAMPLES FROM LEFT TO RIGHT. TWO SAMPLES ARE IDENTICAL; ONE IS DIFFERENT. SELECT THE ODD/DIFFERENT SAMPLE AND INDICATE BY PLACING AN �X� NEXT TO THE CODE OF THE ODD SAMPLE.
SAMPLES INDICATE REMARKS ON TRAY ODD SAMPLE
_____________ □ __________________ _____________ □ __________________ _____________ □ __________________ IF YOU WISH TO COMMENT ON THE REASONS FOR YOUR CHOICE OR IF YOU WISH TO COMMENT ON THE PRODUCT CHARACTERISTICS, YOU MAY DO SO UNDER REMARKS.
PLEASE SEND TRAY BACK THROUGH AND WAIT FOR TRAY TWO.
91
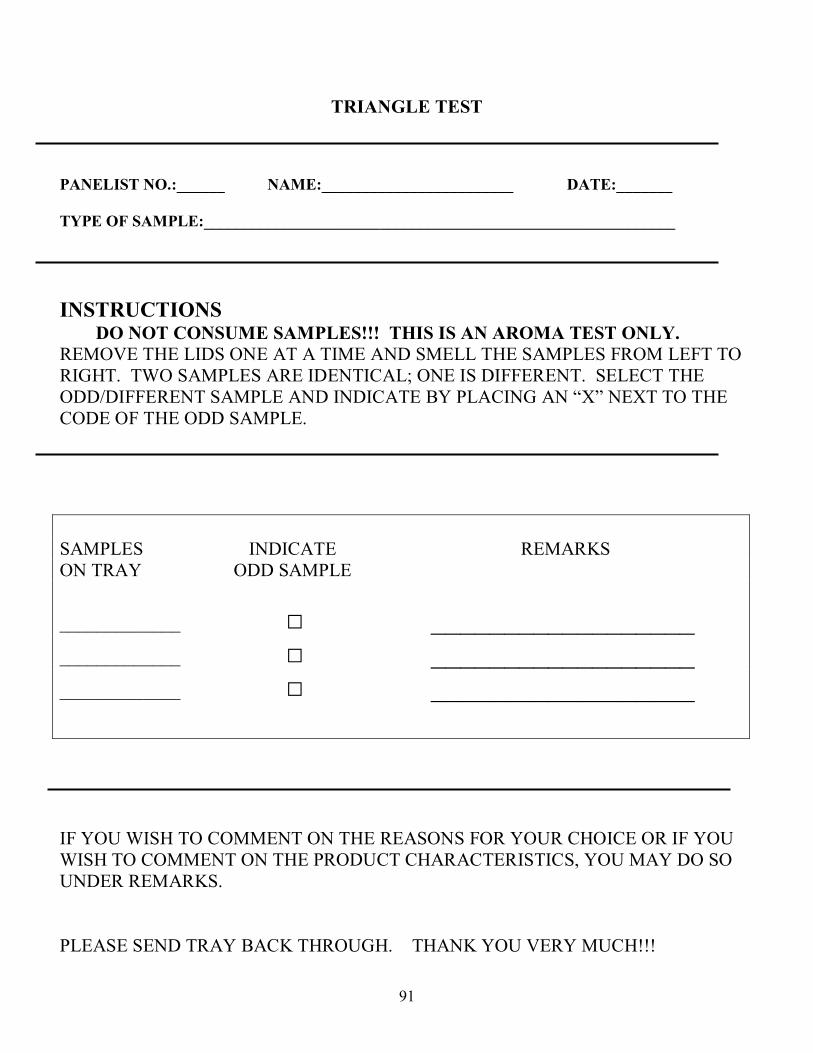
TRIANGLE TEST
PANELIST NO.:______ NAME:________________________ DATE:_______ TYPE OF SAMPLE:___________________________________________________________ INSTRUCTIONS DO NOT CONSUME SAMPLES!!! THIS IS AN AROMA TEST ONLY. REMOVE THE LIDS ONE AT A TIME AND SMELL THE SAMPLES FROM LEFT TO RIGHT. TWO SAMPLES ARE IDENTICAL; ONE IS DIFFERENT. SELECT THE ODD/DIFFERENT SAMPLE AND INDICATE BY PLACING AN �X� NEXT TO THE CODE OF THE ODD SAMPLE.
SAMPLES INDICATE REMARKS ON TRAY ODD SAMPLE
_____________ □ __________________ _____________ □ __________________ _____________ □ __________________ IF YOU WISH TO COMMENT ON THE REASONS FOR YOUR CHOICE OR IF YOU WISH TO COMMENT ON THE PRODUCT CHARACTERISTICS, YOU MAY DO SO UNDER REMARKS. PLEASE SEND TRAY BACK THROUGH. THANK YOU VERY MUCH!!!
92
Vita
Jenny was born on December 20, 1977 in Bentonville, Arkansas to Randy and Susan Norton. She
was raised in Centerton, Arkansas along with her brother, Jake, and her sister, Amber. Jenny attended
public school in Bentonville, Arkansas. After high school, she decided to pursue her undergraduate
degree at the University of Arkansas in Fayetteville in Food Science. While at the U of A, Jenny received
several local and national scholarships to help pay her way through her undergraduate degree. She also
spent a summer in Scotland for an internship. Jenny received her Bacholers of Science Degree in Food
Science in December 2000. She then moved to Blacksburg, Virginia where she was offered a full
assistantship in the Food Science and Technology Department at Virginia Tech to pursue her Masters of
Science Degree. While at Virginia Tech, Jenny worked on aroma and packaging issues associated with
food products and also received the Graduate Student of the Year Award in 2002. Jenny completed her
Masters of Science Degree in Food Science and Technology in September 2003. She accepted a full
assistantship at Virginia Tech and is currently pursuing a Doctoral Degree in Food Science and