Theoretical and Experimental Studies on Oil Injected Twin Screw Air Compressor When Compressing Different Light and Heavy Gases N.Seshaiah * ., R.K. Sahoo 1 ., S.K. Sarangi 2 * Research Associate, Mechanical Engineering Department,Naional Institute of Technology,Rourkela India 1 Professor, Mechanical Engineering Department, National Institute of Technology, Rourkela 2 Director, National Institute of Technology, Rourkela Abstract Oil injected twin-screw compressors are widely used for medium pressure applications in many industries. Low cost air compressors can be adopted for compression of helium and other gases, leading to significant cost saving. The efficiency, delivery rate of the compressors (medium and small size) has been analyzed and presented in the study. The heat transfer coefficient required to generate the theoretical efficiencies has been determined experimentally. To generate machine independent experimental data, two similar compressors with different capacities have been built to test the performance of air compressors when applied to compress nitrogen, argon and helium gases apart from air. Also this paper addresses the gas delivery rate and heat of compression (temperature) on volumetric and power efficiency. (Key words :( screw compressor, gas delivery rate, oil injection temperature, working gas, volumetric efficiency, and adiabatic efficiency) Nomenclature C p Specific heat of gas at constant pressure (J/kg.K) k Ratio of specific heats (dimensionless) M 1 Mass of fresh gas admitted into the suction cavities during suction process (kg) M t1 Mass of gas in a pair of male and female cavities at the end of suction process at (P s , T 1 ) (kg) M ts Theoretical gas mass in a pair of male and female cavities at suction condition (P s , T s ) (kg) M il Interlobe leakage gas mass leaked into the suction chamber during previous compression process at (P s ,T 1 ) (kg) *Corresponding author: Tel: 91-9440203350; Fax: 91-8571-280433 E- Mail address: [email protected]
Transcript
Theoretical and Experimental Studies on Oil Injected Twin Screw Air Compressor When Compressing Different Light and Heavy Gases
N.Seshaiah*., R.K. Sahoo1., S.K. Sarangi2
* Research Associate, Mechanical Engineering Department,Naional Institute of Technology,Rourkela India
1Professor, Mechanical Engineering Department, National Institute of Technology, Rourkela 2Director, National Institute of Technology, Rourkela
Abstract Oil injected twin-screw compressors are widely used for medium pressure applications in many industries. Low cost air compressors can be adopted for compression of helium and other gases, leading to significant cost saving. The efficiency, delivery rate of the compressors (medium and small size) has been analyzed and presented in the study. The heat transfer coefficient required to generate the theoretical efficiencies has been determined experimentally. To generate machine independent experimental data, two similar compressors with different capacities have been built to test the performance of air compressors when applied to compress nitrogen, argon and helium gases apart from air. Also this paper addresses the gas delivery rate and heat of compression (temperature) on volumetric and power efficiency. (Key words :( screw compressor, gas delivery rate, oil injection temperature, working gas, volumetric efficiency, and adiabatic efficiency) Nomenclature Cp Specific heat of gas at constant pressure (J/kg.K)
k Ratio of specific heats (dimensionless)
M1 Mass of fresh gas admitted into the suction cavities during suction process (kg)
Mt1 Mass of gas in a pair of male and female cavities at the end of suction
process at (Ps , T1) (kg)
Mts Theoretical gas mass in a pair of male and female cavities at suction
condition (Ps , Ts) (kg)
Mil Interlobe leakage gas mass leaked into the suction chamber during previous
The twin-screw compressor is a positive displacement machine that uses a pair of
intermeshing rotors housed in a suitable casing to produce compression. These are capable of
high-speed operation over a wide range of operating pressures. In screw machines, oil is
deliberately injected into the compression chambers to provide sealing, lubrication, corrosion
resistance and cooling effect. Screw compressor performance is influenced both by the
refrigerant and by the type of lubricant used. Thermodynamic efficiency of the compression
process also depends greatly on the heat exchange between gas and the oil.
A mathematical model has been developed by the authors [1-2] on the basis of the laws
of perfect gas and standard thermodynamic relations for calculating the compressor performance.
Fujiwara et al. [3] determined the heat transfer coefficient experimentally and used in numerical
simulation. Stosic et al. [4-6] have developed mathematical modelling and experimental
investigation on oil injection and its influence on thermodynamic process in twin-screw
compressors. Peng et al. [7] investigated the oil injection phenomenon to get a better
understanding of compressor performance experimentally. Hammerl et al. [8] examined several
variants of the oil injection technique into the suction port of the compressor. Sangfors [9]
studied the effect of oil injection parameters on compressor performance. Recently, Depaepe et
al. [10] have built a test rig to asses the performance of different types of atomizers for oil
atomization in twin-screw compressor.
2. Measurement of Volumetric And Adiabatic Efficiencies Screw compressor performance is governed by the interactive effects of thermodynamics,
heat transfer and machine geometry. This can be calculated reliably only by their simultaneous
consideration. The performance index of a compressor is characterized by its volume or mass
handling capacity and specific power consumption. The theoretical volumetric and adiabatic
efficiencies of twin-screw compressor are estimated after computing the leakage flow rates of
gas and oil [1]. The efficiency definitions are taken from standard thermodynamic textbooks and
from reference [11].
Volumetric Efficiency
The volumetric efficiency can be defined either in terms of volume flow rate or in mass
flow rate terms to yield the same value. Using the ideal gas equation of state, the total amount of
gas mass, including leakage gas occupying the suction volume at (Ps ,Ts) calculated by the
expression:
s
tsts RT
VPM 1= (1)
The actual gas mass contained in the suction volume at the end of suction process at (Ps ,T1) can
be estimated by the relation:
1
1 TT
MM stst = (2)
The theoretical gas flow rate at temperature T1 over a suction duration (ts) is:
s
tt t
Mm 1=& (3)
But the total gas mass at condition (Ps ,T1) in the suction cavities at the end of suction process is
the sum of fresh charge inducted and the leaked gas during previous compression. Thus:
il11t MMM += (4)
The gas leakage into the suction cavities over the suction duration is estimated by the relation[1]:
sglil tmM ×= & (5)
The leakage gas mass rate is given as [1]:
gogigl mmm &&& −= (6)
The theoretical discharged gas flow rate is estimated by the relation:
gltdt mmm &&& −= (7)
Hence, the theoretical volumetric efficiency in terms of mass flow rate is calculated by using the
relation:
ts
dttv m
m&&
=η (8)
In general, the experimental gas flow rate is less than the theoretical inducted mass rate
due to imperfect nature of ports, wall friction and other frictional losses apart from leakage loses.
Experimental volumetric efficiency is calculated after measuring the actual gas flow rate as
shown below:
ts
eev m
m&&
=η (9)
The actual gas volume flow rate is measured with a rotameter, which has been calibrated
for volume flow rate at reference condition (Pr , Tr). The gas flow rate of compressor at condition
(Ps , T1) is obtained by using the formula [12 ] :
sr
rsmse TP
TPVm
××
ρ=& (10)
where ρ s is the density of gas at (Ps , T1) and Vm is the volume flow rate of the gas. The gas
density has been taken from standard thermodynamic tables [13].
Adiabatic Efficiency
The actual power input to the compressor for only gas compression will be calculated
from the area of the indicator diagram. The area of the indicator diagram is the actual power
for compression work, which is obtained from an experimentally measured p-v curve. This
curve may be obtained through difficult and expensive process of conducting compressor
tests with pressure transducers located with in the pair of cavities. To overcome this
difficulty, the efficiency is defined in terms of system power, which can be measured
reasonably accurately by an energy meter. The system power is the power required for an
entire compression system and it is some of the shaft power and several additional power
requirements due to the presence of controllers and other peripheral systems.
The overall theoretical adiabatic efficiency is defined as:
e,sys
tata W
W&
&=η (11)
The theoretical adiabatic compression work is given by the expression:
⎥⎥⎥
⎦
⎤
⎢⎢⎢
⎣
⎡−⎟⎟
⎠
⎞⎜⎜⎝
⎛=
−
1
1k
k
s
dspdtta P
PTcmW && (12)
The power consumed by the compression system is measured with energy meter. The
actual power consumed by the compressor is inclusive of that consumed by cooling fan of the
compressor, transmission and electric motor losses, as well as mechanical losses. The power
consumed by the compression system is calculated by the relation:
ee
ee,sys tN
nW
××
=3600& (13)
where Ne is the energy meter constant, and te is the time taken for ne revolutions of energy meter
disc.
The experimental adiabatic power can be interpreted as the power required to compress
the gas adiabatically that produces the actual discharged gas flow at a given pressure ratio. The
experimental adiabatic efficiency is defined as:
e,sys
eaea W
W&
&=η (14)
The experimental adiabatic compression work is given by the expression:
⎥⎥⎥
⎦
⎤
⎢⎢⎢
⎣
⎡−⎟⎟
⎠
⎞⎜⎜⎝
⎛=
−
1
1k
k
s
dspeea P
PTcmW && (15)
3. Experimental Studies
Before the compressor put into a refrigerator or liquefier system, it needs to be tested
independently for the energy conversion efficiency during compression process. The
experimental study has also been aimed at to study the influence of machine capacity on
efficiency. Study of specific power per unit delivery of gas of the compressor at different
pressure ratios is also essential, when the compressor designed for air is applied to compress
different low molecular weight and higher molecular weight gases. The Photograph of 5.5kW
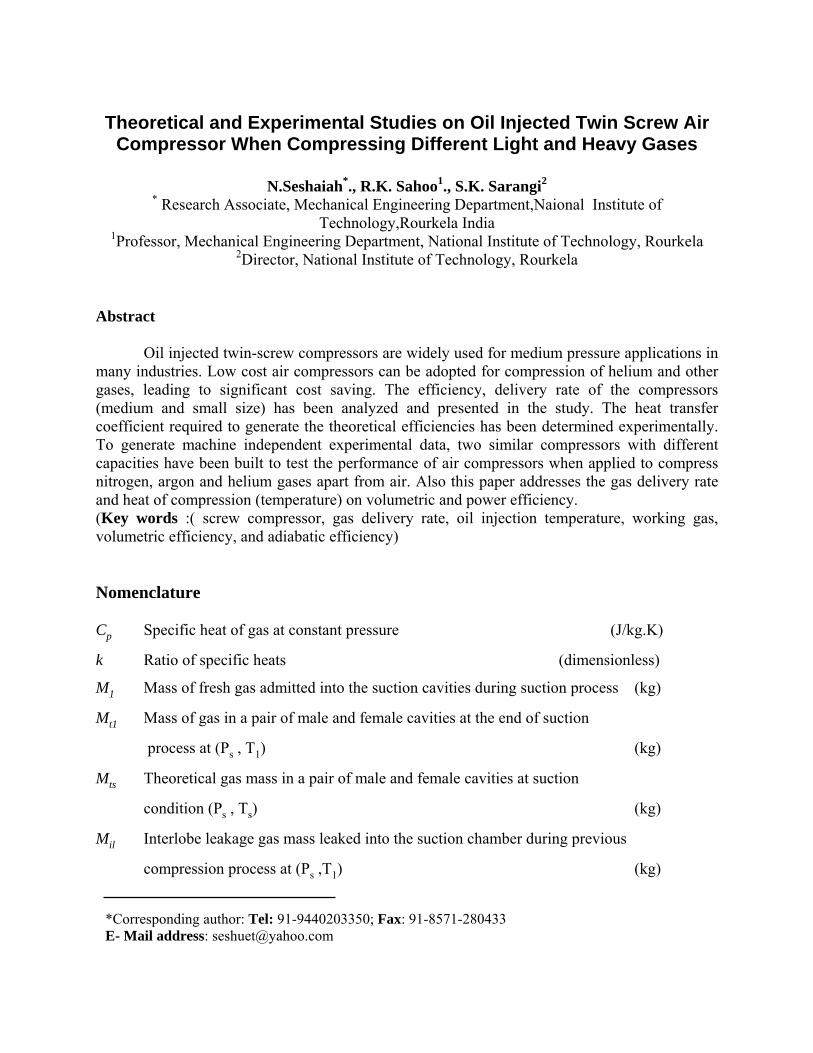
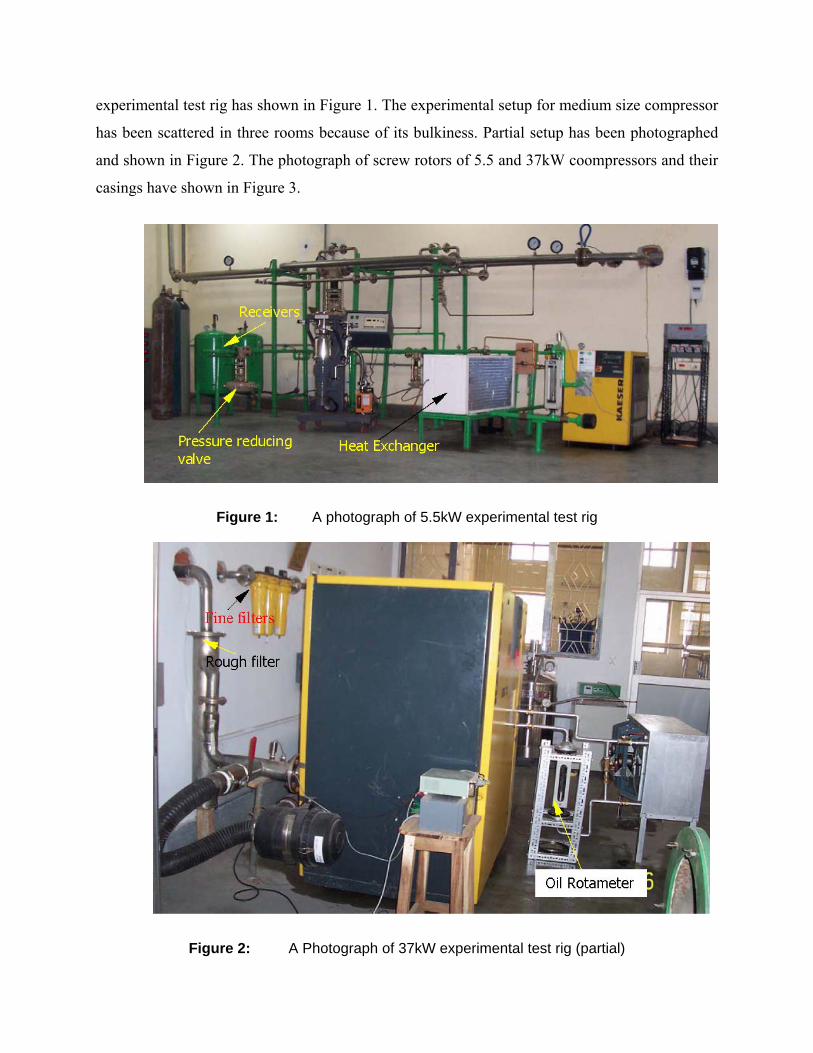
experimental test rig has shown in Figure 1. The experimental setup for medium size compressor
has been scattered in three rooms because of its bulkiness. Partial setup has been photographed
and shown in Figure 2. The photograph of screw rotors of 5.5 and 37kW coompressors and their
casings have shown in Figure 3.
Figure 1: A photograph of 5.5kW experimental test rig
Figure 2: A Photograph of 37kW experimental test rig (partial)
5.5kW rotors and casing 37kW rotors and casing
Figure 3: Photograph of 5.5 kW and 37 kW compressor rotors and their casings.
The main motive of the present test is to study the performance of the oil injected twin-
screw air compressor when compressing different gases such as helium, argon and nitrogen gases
apart from air. Two test benches have been installed in the laboratory, which are identical in all
aspects except the compressor capacities. The specifications of small and medium size
compressors have been shown in Table 1 and 2.
Table 1: Rotor specifications of 5.5 kW and 37kW prototype compressors
Name of constant 5.5kW compressor
37kW compressor
Units
Number of lobes on the male rotor 5 5 none Number of lobes on the female rotor 6 6 none Male wrap angle 300 300 degree Diameter of male rotor 72 152 mm Diameter of female rotor 54 118 mm Length of the rotor 90 235 mm Cross sectional area of male rotor groove 210 1075 mm
2
Cross sectional area of female rotor groove 170 1020 mm2
Lobe tip width of male rotor 0.5 0.9 mm Lobe tip width of female rotor 1.8 2.6 mm Rotational speed of male rotor 4350 2950 rpm
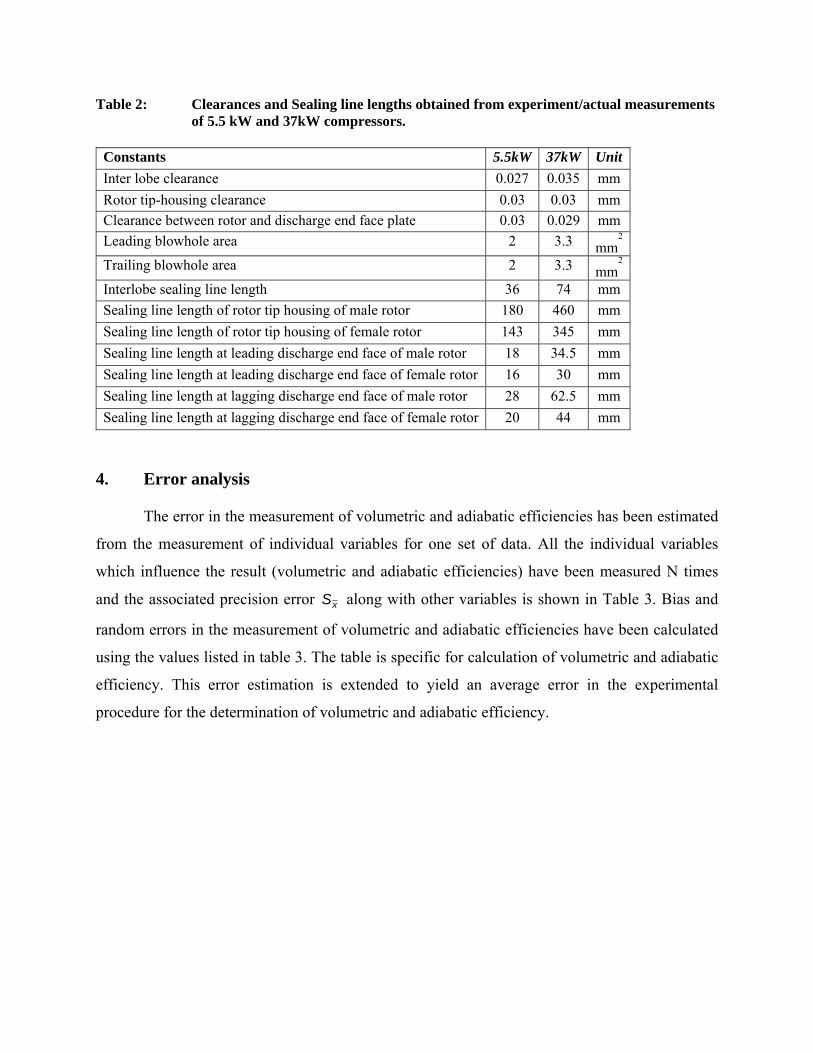
Table 2: Clearances and Sealing line lengths obtained from experiment/actual measurements of 5.5 kW and 37kW compressors.
Constants 5.5kW 37kW Unit Inter lobe clearance 0.027 0.035 mm Rotor tip-housing clearance 0.03 0.03 mm Clearance between rotor and discharge end face plate 0.03 0.029 mm Leading blowhole area 2 3.3 mm
2
Trailing blowhole area 2 3.3 mm2
Interlobe sealing line length 36 74 mm Sealing line length of rotor tip housing of male rotor 180 460 mm Sealing line length of rotor tip housing of female rotor 143 345 mm Sealing line length at leading discharge end face of male rotor 18 34.5 mm Sealing line length at leading discharge end face of female rotor 16 30 mm Sealing line length at lagging discharge end face of male rotor 28 62.5 mm Sealing line length at lagging discharge end face of female rotor 20 44 mm
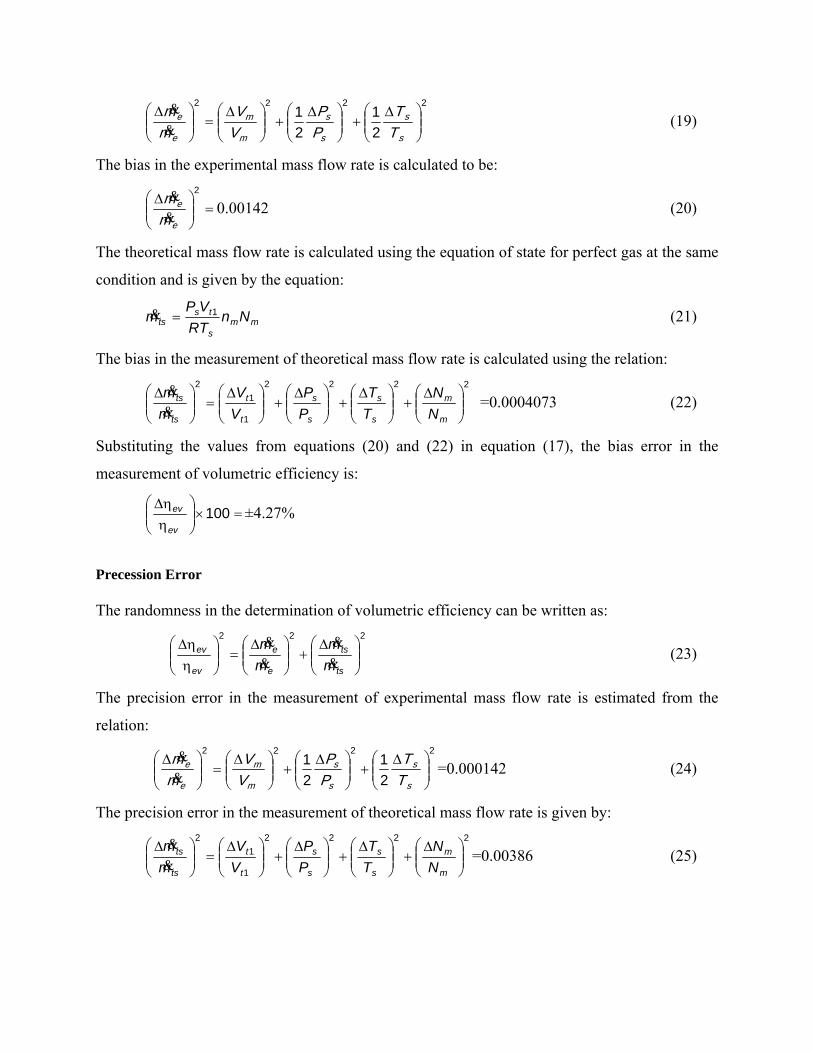
4. Error analysis
The error in the measurement of volumetric and adiabatic efficiencies has been estimated
from the measurement of individual variables for one set of data. All the individual variables
which influence the result (volumetric and adiabatic efficiencies) have been measured N times
and the associated precision error xS along with other variables is shown in Table 3. Bias and
random errors in the measurement of volumetric and adiabatic efficiencies have been calculated
using the values listed in table 3. The table is specific for calculation of volumetric and adiabatic
efficiency. This error estimation is extended to yield an average error in the experimental
procedure for the determination of volumetric and adiabatic efficiency.
Table 3: Average values and their error values for N samples.
Parameter Average value ( )
Bias error (Br)
Precision error
(X
xS )
Sample Size (N)
Suction pressure (Ps) bar
Suction Temperature(Ts) 0C
Discharge pressure(Pd) bar Speed of male rotor(Nm) rpm Volume flow rate of gas(Vm) L/min
Volume of a pair cavities(Vt1) cm3
No.of revolutions of energy meter(ne) Time for ne rotations of energy meter disc (te) sec Experimental mass flow rate(me) kg/s Theoretical mass flow rate(mt) kg/s Experimental adiabatic power(Wea) kW Experimental system power(Wsys) kW
1.113 308 9.65 4350 675 342
5
38 0.0139 0.0156 3.642 6.3
0.015 0.005 0.015
15 25 0.5
0.05
0.1 - - -
0.023 0.3
0.25 20 12 1
0.2
0.5 - - -
6 6 6 6 6 6
6
6 - - -
4.1. Uncertainty in Determination of Volumetric Efficiency
Bias Error: Gas flow rate has been measured with rotameter, which has been calibrated for air. The
gas density and gas characteristic constants have been taken from standard thermodynamic tables
[13]. The detailed error analysis has been explained in [14]. The volumetric efficiency equation
is rewritten as:
ts
eev m
m&&
=η (16)
The bias in the measurement of volumetric efficiency can be estimated by using the relation: 222
⎟⎟⎠
⎞⎜⎜⎝
⎛ ∆+⎟⎟
⎠
⎞⎜⎜⎝
⎛ ∆=⎟⎟
⎠
⎞⎜⎜⎝
⎛ηη∆
ts
ts
e
e
ev
ev
mm
mm
&&
&&
(17)
The mass flow rate of the compressor at suction condition can be obtained by using the formula:
sr
rsmse TP
TPVm
××
ρ=& (18)
The bias in the measurement of mass flow rate is estimated by using the above formula:
2222
21
21
⎟⎟⎠
⎞⎜⎜⎝
⎛ ∆+⎟⎟
⎠
⎞⎜⎜⎝
⎛ ∆+⎟⎟
⎠
⎞⎜⎜⎝
⎛ ∆=⎟⎟
⎠
⎞⎜⎜⎝
⎛ ∆
s
s
s
s
m
m
e
e
TT
PP
VV
mm&&
(19)
The bias in the experimental mass flow rate is calculated to be:
=⎟⎟⎠
⎞⎜⎜⎝
⎛ ∆2
e
e
mm&&
0.00142 (20)
The theoretical mass flow rate is calculated using the equation of state for perfect gas at the same
condition and is given by the equation:
mms
tsts Nn
RTVP
m 1=& (21)
The bias in the measurement of theoretical mass flow rate is calculated using the relation: 2222
1
12
⎟⎟⎠
⎞⎜⎜⎝
⎛ ∆+⎟⎟
⎠
⎞⎜⎜⎝
⎛ ∆+⎟⎟
⎠
⎞⎜⎜⎝
⎛ ∆+⎟⎟
⎠
⎞⎜⎜⎝
⎛ ∆=⎟⎟
⎠
⎞⎜⎜⎝
⎛ ∆
m
m
s
s
s
s
t
t
ts
ts
NN
TT
PP
VV
mm&&
=0.0004073 (22)
Substituting the values from equations (20) and (22) in equation (17), the bias error in the
measurement of volumetric efficiency is:
=×⎟⎟⎠
⎞⎜⎜⎝
⎛ηη∆
100ev
ev ±4.27%
Precession Error The randomness in the determination of volumetric efficiency can be written as:
222
⎟⎟⎠
⎞⎜⎜⎝
⎛ ∆+⎟⎟
⎠
⎞⎜⎜⎝
⎛ ∆=⎟⎟
⎠
⎞⎜⎜⎝
⎛ηη∆
ts
ts
e
e
ev
ev
mm
mm
&&
&&
(23)
The precision error in the measurement of experimental mass flow rate is estimated from the
relation:
2222
21
21
⎟⎟⎠
⎞⎜⎜⎝
⎛ ∆+⎟⎟
⎠
⎞⎜⎜⎝
⎛ ∆+⎟⎟
⎠
⎞⎜⎜⎝
⎛ ∆=⎟⎟
⎠
⎞⎜⎜⎝
⎛ ∆
s
s
s
s
m
m
e
e
TT
PP
VV
mm&&
=0.000142 (24)
The precision error in the measurement of theoretical mass flow rate is given by: 2222
1
12
⎟⎟⎠
⎞⎜⎜⎝
⎛ ∆+⎟⎟
⎠
⎞⎜⎜⎝
⎛ ∆+⎟⎟
⎠
⎞⎜⎜⎝
⎛ ∆+⎟⎟
⎠
⎞⎜⎜⎝
⎛ ∆=⎟⎟
⎠
⎞⎜⎜⎝
⎛ ∆
m
m
s
s
s
s
t
t
ts
ts
NN
TT
PP
VV
mm&&
=0.00386 (25)
Substituting the values of ⎟⎟⎠
⎞⎜⎜⎝
⎛ ∆
e
e
mm&&
and ⎟⎟⎠
⎞⎜⎜⎝
⎛ ∆
ts
ts
mm&&
from equations (24) and (25) in equation (23),
the precision error in volumetric efficiency measurement is given as shown below:
=⎟⎟⎠
⎞⎜⎜⎝
⎛ηη∆
2
ev
ev ±6.33%
The number of degrees of freedom υr associated with combined precision Pr is found by using
the Welch-Satterthwaite formula [15].
[ ] [ ]∑∑
∑
==
= =⎥⎦
⎤⎢⎣
⎡
=J
iiii
rJ
iiii
J
iii
r
P
P
P
P
1
4
4
1
4
2
1
2
/)(/)(
)(
υθυθ
θυ =3.98 ≈ 4
From t-distribution table [15] for the degree of freedom 4, the t-value at 95% confidence
level is 2.776. The combined uncertainty in the measurement of volumetric efficiency is
estimated by using the equation [15] given below:
( )[ ]2122rrRSS PtBU ×+= (26)
21
22 3367762274 ])..().[(URSS ×+= =18.08%
Therefore, the overall uncertainty in the measurement of volumetric efficiency is:
=⎟⎟⎠
⎞⎜⎜⎝
⎛ηη∆
ev
ev ±18.08%
4.2 Uncertainty in Determination of Adiabatic Efficiency
Bias Error:
The bias in the measurement of adiabatic efficiency has also been computed in the similar
fashion as that of volumetric efficiency. The experimental adiabatic efficiency is rewritten as:
e,sys
eaea W
W&
&=η (27)
The bias in adiabatic efficiency determination can be written as:
222
⎟⎟
⎠
⎞
⎜⎜
⎝
⎛ ∆+⎟
⎟⎠
⎞⎜⎜⎝
⎛ ∆=⎟⎟
⎠
⎞⎜⎜⎝
⎛ηη∆
e,sys
e,sys
ea
ea
ea
ea
W
W
WW
&
&
&
& (28)
The experimental adiabatic efficiency is:
⎥⎥⎥
⎦
⎤
⎢⎢⎢
⎣
⎡−⎟⎟
⎠
⎞⎜⎜⎝
⎛=
−
1
1k
k
s
dspeae P
PTcmW && (29)
The bias in the measurement of experimental adiabatic power is obtained by the relation: 22222
11⎟⎟⎠
⎞⎜⎜⎝
⎛ ∆×
−+⎟⎟
⎠
⎞⎜⎜⎝
⎛ ∆×
−+⎟⎟
⎠
⎞⎜⎜⎝
⎛ ∆+⎟⎟
⎠
⎞⎜⎜⎝
⎛ ∆=⎟
⎟⎠
⎞⎜⎜⎝
⎛ ∆
s
s
d
d
s
s
e
e
ea
ea
PP
k)k(
PP
k)k(
TT
mm
WW
&&
&
&=0.001694 (30)
The power consumed by the compressor system is rewritten as:
ee
ee,sys tN
nW
××
=3600& (31)
The bias associated with measurement of the system power is: 222
⎟⎟⎠
⎞⎜⎜⎝
⎛ ∆+⎟⎟
⎠
⎞⎜⎜⎝
⎛ ∆=
⎟⎟
⎠
⎞
⎜⎜
⎝
⎛ ∆
e
e
e
e
e,sys
e,sys
tt
nn
W
W&
&=0.000107 (32)
Substituting the values from equations (30) and (32) in equation (28), the bias in adiabatic
efficiency measurement is shown below:
=×⎟⎟⎠
⎞⎜⎜⎝
⎛ηη∆
100ea
ea ± 4.24%
Precession Error
The randomness in the measurement of adiabatic efficiency can also be computed
following the above procedure. The precision error in the measurement of adiabatic efficiency is:
222
⎟⎟
⎠
⎞
⎜⎜
⎝
⎛ ∆+⎟
⎟⎠
⎞⎜⎜⎝
⎛ ∆=⎟⎟
⎠
⎞⎜⎜⎝
⎛ηη∆
e,sys
e,sys
ea
ea
ea
ea
W
W
WW
&
&
&
& (33)
where 22222
11⎟⎟⎠
⎞⎜⎜⎝
⎛ ∆×
−+⎟⎟
⎠
⎞⎜⎜⎝
⎛ ∆×
−+⎟⎟
⎠
⎞⎜⎜⎝
⎛ ∆+⎟⎟
⎠
⎞⎜⎜⎝
⎛ ∆=⎟
⎟⎠
⎞⎜⎜⎝
⎛ ∆
s
s
d
d
s
s
e
e
ea
ea
PP
k)k(
PP
k)k(
TT
mm
WW
&&
&
&=0.000232 (34)
The precision error associated with measurement of the system power is:
222
⎟⎟⎠
⎞⎜⎜⎝
⎛ ∆+⎟⎟
⎠
⎞⎜⎜⎝
⎛ ∆=
⎟⎟
⎠
⎞
⎜⎜
⎝
⎛ ∆
e
e
e
e
e,sys
e,sys
tt
nn
W
W&
&=0.00177 (35)
Substituting the values of ⎟⎟⎠
⎞⎜⎜⎝
⎛ ∆
ea
ea
WW&
& and
⎟⎟
⎠
⎞
⎜⎜
⎝
⎛ ∆
e,sys
e,sys
W
W&
& from equations (34) and (35) in equation (33),
the precision error in measuring adiabatic efficiency is:
=×⎟⎟⎠
⎞⎜⎜⎝
⎛ηη∆
100ea
ea 4.5%
The number of degrees of freedom υr associated with combined precision Pr is also found by
using the below equation:
[ ] [ ]∑∑
∑
==
= =⎥⎦
⎤⎢⎣
⎡
=J
iiii
rJ
iiii
J
iii
r
P
P
P
P
1
4
4
1
4
2
1
2
/)(/)(
)(
υθυθ
θυ =13.98 ≈ 14
From t-distribution table using degrees of freedom value14, the t-value at 95% confidence level
is 2.145 [15]. The combined uncertainty in the measurement of adiabatic efficiency using
equation is:
( )[ ]2122rrRSS PtBU ×+=
21
22 541452244 ])..().[(URSS ×+= =10.54%
Hence, the overall uncertainty in the measurement of adiabatic efficiency is:
=⎟⎟⎠
⎞⎜⎜⎝
⎛ηη∆
ev
ev ±10.54%
5. Discussion
Theoretical and experimental analysis has been conducted on commercially available
twin-screw air compressors of two different capacities using air, nitrogen, argon and helium as
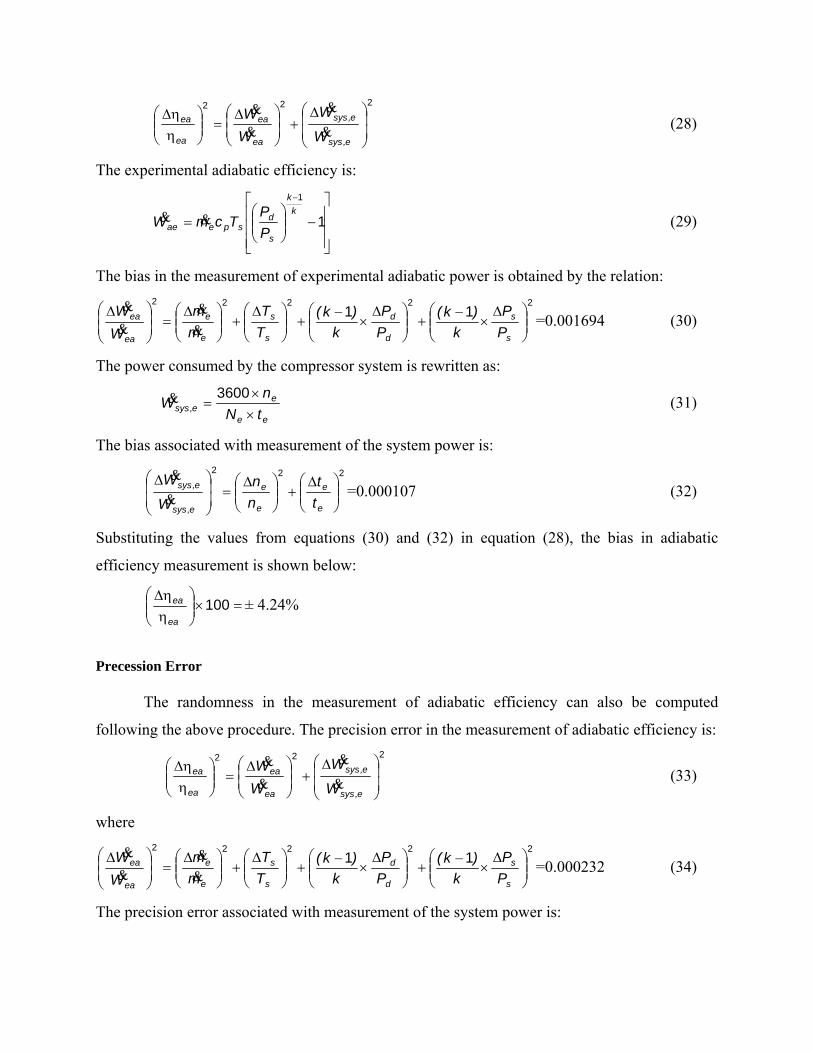
working gases. Figure 4 gives the influence of inducted gas temperature on volumetric efficiency
with different working gases at a fixed pressure ratio and injected oil temperature in the 5.5 kW
compressor. It is observed that the volumetric efficiency increases with inlet temperature. This
effect is attributed to the fact that the temperature rise of fresh gas mass at higher induction gas
temperature during suction process is less. This led to the minimum disturbance in suction
cavities during suction process and hence increases in volumetric efficiency.
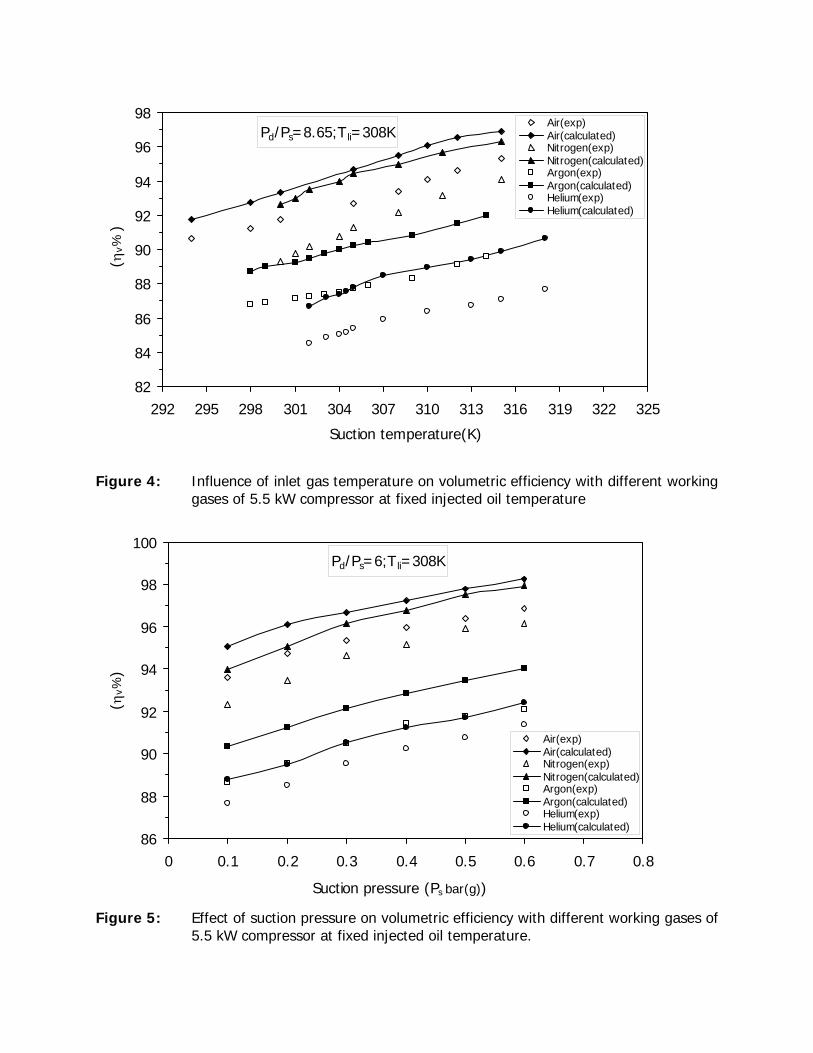
Figure 5 gives the variation of volumetric efficiency with suction gas pressure at a fixed
pressure ratio in the 5.5kW compressor. The increase in volumetric efficiency with increase in
suction pressure may be assigned to the increase in volume flow rate of gas without
proportionate increase in oil flow rate. Most of the leakage during compression process is
through interloped clearance. The amount of leakage gas mass depends on pressure difference
between suction cavity and discharge end. If the suction cavity pressure increases, the pressure
difference decreases and hence the volumetric efficiency increases. The comparison of
volumetric efficiency under similar conditions has shown in Figure 6. It has been observed that
the volumetric efficiency of small compressor is slightly more than the big compressor for
almost all the gases. This is attributed to be the manufacturing deviations of the machine rotors.
The variation of volumetric efficiency with pressure ratio is shown in Figure 7. This
variation is due to the fact that increase in pressure ratio (i.e discharge pressure) enhances the
leakage and thus degrades the efficiency. For the same pressure ratio and the same oil injection
temperature, volumetric efficiency is the lowest for helium followed by argon, nitrogen and air.
This may be due to the fact that helium being a light gas and leaks more easily. On the other
hand, monatomic gas generates higher heat of compression leading to decrease in oil viscosity
and consequently higher leakage rate. This is the case with argon.
The theoretical and experimental gas delivery rate of the 5.5kW compressor for different
working gases is shown in Figure 8. Experiments have been conducted at two different injected
oil temperatures on 5.5 kW compressor, keeping the inlet gas pressure constant. The gas delivery
rates have been compared at two different oil injection temperatures and presented the results in
Figure 9. It is observed that the gas volume delivery rate decreases with increase in pressure
ratio and with increase of oil injection temperature. The causes are the increase of leakage rate at
higher pressures and reduction of inducted volume at higher temperature. These figures also
show the relative variation of volume flow rates of different working gases. The lowest gas
delivery rate is with helium followed by argon, nitrogen and air.
Influence of inducted gas temperature on adiabatic efficiency with different working
gases is shown in Figures 10. The nature of variation with inducted gas temperature is similar for
all the working gases. The increase of adiabatic efficiency for a particular gas species is due to
the increase in volumetric efficiency which decreases the actual amount of work consumed per
unit mass of gas. Adiabatic efficiency is highest for argon followed by air, helium and nitrogen.
The variation of adiabatic efficiency with suction pressure is shown in Figures 11. The adiabatic
efficiency is increasing with increase in suction pressure. This is due to the reduction in
interloped leakage rate because of reduction in pressure difference.
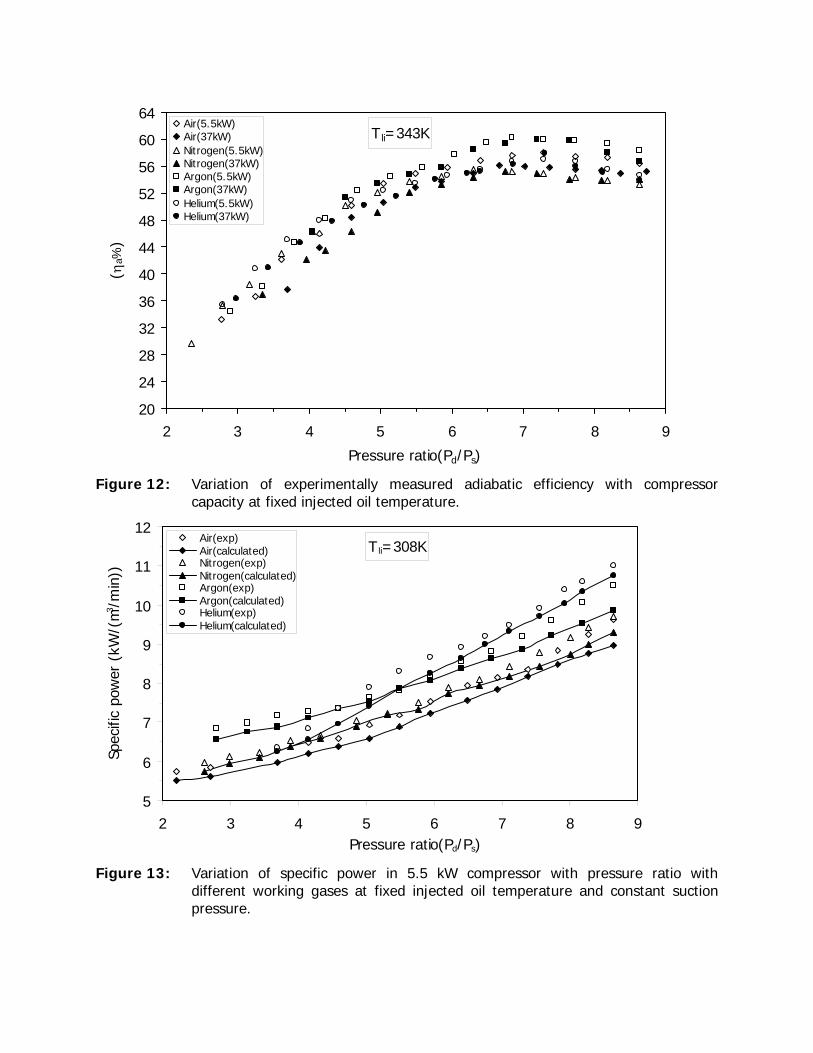
The relation between adiabatic efficiency and pressure ratio for all the working gases at a
fixed injected oil temperature on both the compressors has been shown in Figures 12. It has been
observed from the results that the nature of variation is similar for all the working gases. It may
be observed from the figures that adiabatic efficiency curves show maximum values at different
pressure ratios for different working gases. This is due to the fact that adiabatic efficiency
increases with pressure ratio and volumetric efficiency decreases with pressure ratio. At higher
pressure ratios, there is decrease in mass flow due to fall in volumetric efficiency, which in turn
lowers the adiabatic efficiency. The specific power consumption of the compressors against
pressure ratio is shown in Figures 13 to 15. It may be observed that the power consumption is
highest with helium followed by argon, nitrogen and air. Helium has the highest specific power
consumption in mass terms due to higher work of compression for a lower volume flow rate, as
Figure 15: Variation of specific power with pressure ratio in two different compressors at
fixed injected oil temperature and constant suction pressure.
6. Conclusions
Inlet temperature of working gas, suction pressure and pressure ratio have been taken as
operating parameters to present the variation of volumetric and adiabatic efficiencies in 5.5 kW
and 37 kW air compressors. Apart from air as a working gas, the effect of using other heavy and
low dense working gases such as nitrogen, argon and helium are studied experimentally and
numerically. The volumetric and adiabatic efficiencies compared and presented the results. It has
been observed that the volumetric and adiabatic efficiencies are better at lower injected oil
temperature. This result shows that lowering of oil inlet temperature is more effective. This may
be due to the fact that at lesser temperature of the oil, the amount of fresh inducted gas mass is
better and leakage losses are less due to good viscous properties of the oil.
Helium shows the lowest volumetric efficiency followed by argon, nitrogen and air. This
is because helium being both light and monatomic in nature has highest leakage rate and attains
highest temperature on discharge. This is followed by argon, which is also a monatomic gas
although it has a high molecular weight. The higher values of volumetric efficiency with
nitrogen and air are due to their higher molecular weight and relatively low heat of compression.
Variation of adiabatic efficiency with suction temperature, suction pressure, injected oil
temperature, and pressure ratio has been carried out. In comparison, argon shows the highest
efficiency followed that of air, helium and nitrogen in the descending order. It is because argon
is a monatomic gas and has high molecular weight. Analysis of uncertainty in experimental
measurement shows that the associated uncertainty in the measurement of volumetric efficiency
is around 18%, where as the uncertainty in the adiabatic efficiency is around 11%.
Acknowledgements The authors are grateful to the Board of Research in Nuclear Sciences (Department Atomic
Energy) for sponsoring this work. The technical inputs from Mr.Trilok Singh, Head Cryogenics
Division, Baba Atomic Research Centre are also gratefully acknowledged. The authors are
thankful to the Mechanical Engineering Department, NIT, Rourkela, for providing all testing
facilities and guidance.
References [1] Seshaiah, N., Ghosh S. K., Sahoo, R.K., Sarangi, S. K. Mathematical Modelling of the
Working Cycle of Oil Injected Rotary Twin Screw Compressor, Applied Thermal Engineering, Vol.27, (2007), 145-155.
[2] Seshaiah, N., Ghosh S. K., Sahoo, R.K., Sarangi, S. K. Performance Analysis of Oil
Injected Twin Screw Compressor, 18 th National and 7th
ISHMT-ASME Heat and Mass Transfer Conference, India, C-177 (2006), 1261-1268.
[3] Fujiwara, M., Osada, Y. Performance Analysis of Oil Injected Screw Compressor and
its Application, International Journal of Refrigeration, Vol.18, (1995), (4) 220-227 [4] Stosic, N., Kovacevic, A., Hanjalic, K., And Milutinovic, L. Mathematical Modelling
of the Oil Influence upon the Working Cycle of Screw Compressors, Proceedings of the Purdue Compressor Technology Conference, Purdue, USA (1988), 354-361
[5] Stosic, N., Milutinovic, L., Hanjalic, K., And, Kovacevic, A. Investigation of the
Influence of the Oil Injection upon the Screw Compressor Working Process, International Journal of Refrigeration, 15, No. 4, (1992), 205-219
[6] Stosic, N., Milutinovic, L., Hanjalic, K., and, Kovacevic, A. Experimental
Investigation of the Influence of Oil Injection on the Screw Compressor Working Process, Proceedings of the Purdue Compressor Technology Conference, Purdue, USA (1990), 34-43.
[7] Peng, X., Xing, Z., Zang, X., Cui, T., and Shu, P. Experimental Study of Oil Injection
and its effect on Performance of Twin Screw Compressors, International Compressor Engineering Conference, Purdue, USA (2000), 1003-1010
[8] Hammerl, K., Tinder, L., Frank, M. K. Modification in the Design of the Oil Injection
System for Screw Compressors, International Compressor Engineering Conference, Purdue, USA (2000), 987-994
[9] Sangfors, B. Computer Simulation of Effects from Injection of Different Liquids in
Screw Compressors, International Compressor Engineering Conference, Purdue, USA (1998), Vol.I, 595-600
[10] Depaepe, M., Bogaert, W., Mertens, D. Cooling of Oil-Infected Compressors by Oil