International Academic Journal of Economics and Finance | Volume 3, Issue 6, pp. 32-46
32 | P a g e
EFFICIENCY IN PROVISION OF PUBLIC GOODS AND
SERVICES BY DEVOLVED SECTORS OF THARAKA
NITHI COUNTY GOVERNMENT IN KENYA
Purity Kanja Kamiru
Master of Economics, Kenyatta University, Kenya
Dr. Shadrack Mwilaria
Department of Economic Theory, Kenyatta University, Kenya
©2020
International Academic Journal of Economics and Finance (IAJEF) | ISSN 2518-2366
Received: 4th August 2020
Published: 17th August 2020
Full Length Research
Available Online at: http://www.iajournals.org/articles/iajef_v3_i6_32_46.pdf
Citation: Kamiru, P. K. & Mwilaria, S. (2020). Efficiency in provision of public goods and
services by devolved sectors of Tharaka Nithi county government in Kenya. International
Academic Journal of Economics and Finance, 3(6), 32-46
International Academic Journal of Economics and Finance | Volume 3, Issue 6, pp. 32-46
33 | P a g e
ABSTRACT
A government of any country has a major role
of making available public goods for its
burgesses. There are however emerging
Concerns about whether governments are
really efficient as they carry out the task of
providing public services to citizens.
Investigating efficiency levels for a
government is vital as it enables one to obtain
useful information that can enable policy
makers reduce possible inefficiencies.
Different ways of reducing public
expenditure include reducing the quantity of
the goods supplied and by looking for other
revenue sources. Countries also can try to
lower public spending by minimizing
inefficiencies. This study aimed at estimating
the technical efficiency levels in provision of
public goods and services by Tharaka Nithi
County Government using stochastic frontier
analysis. The study concentrated on four
devolved sectors of Tharaka Nithi County;
Agriculture, Health, Transport and Pre-
primary education. These sectors are the most
devolved and the major drivers of the
county’s economy. Data was collected from
a sample of 86 sub locations. This sample
was picked from 134 sub locations within the
county by means of multi- stage sampling
technique. In addition, the study compared
efficiency levels across different devolved
sectors of Tharaka Nithi County. Different
studies related to efficiency of governments,
both central and local, were reviewed. The
study findings were that efficiency scores of
the four sectors were very low, with none of
them reaching 50%. Education sector was the
most efficient with an efficiency score of
37.68%, followed by the transport sector with
an efficiency score of 30.60%. Agricultural
sector had an efficiency score of 27.83%
while the health sector was the least efficient
with a score of 18.52%. Different approaches
of measuring efficiency are also looked at.
The research methodology used was
descriptive survey design where schedules
were administered to the target population.
This study faced the limitation of inadequate
local empirical literature since not much has
been done regarding efficiency of county
governments in Kenya since devolution. This
present study is cross-sectional in nature.
Longitudinal studies can be done later so as
to examine how efficiency changes with
time.
Key Words: public goods and services,
devolved sectors, Tharaka Nithi, Kenya
INTRODUCTION
Public goods and services are said to be non-excludable and non-rival in consumption. This means
that once they are provided, it is not possible to prevent those that do not pay for the goods or
services from consuming them, and that one consumer’s use of the good does not diminish it for
other users. They include roads, water, electricity, public health care, and street lights. It is the
responsibility of governments to provide public utilities to citizens, since their characteristics of
non-rival in consumption and non-excludability offer no incentive to private investors to produce
International Academic Journal of Economics and Finance | Volume 3, Issue 6, pp. 32-46
34 | P a g e
them. (Ghatak, 1998) observes that development of a country depends on efficiency of her
government at a greater extent.
Government sectors operating at low levels of efficiency provide greater quantity and quality of
public goods than those operating at high efficiency levels. A sector operating at high efficiency
levels uses its means more efficiently. Governments, however, especially the centralized
government systems have greatly failed in regard to operating efficiently. These governments have
ended up providing low levels of public goods at very high costs. (Kaul, 2013) argues that the
current long strip of worldwide difficulties indicate that public utilities are not sufficiently availed.
(Kaul, 2013) argues that planners ought to make policies that are sensitive of the destitute members
of the society. The welfare of the poor is highly influenced by the actions of the government. High
income- earning households can always look for alternative ways of surviving in case of a fall in
the level of public goods and services provided by the government, unlike the poor. The rich can
substitute public goods for private goods as they can afford to purchase the private goods. For
example, they can construct their own roads leading to their homes where public roads are missing,
or private swimming pools where temperatures are high. The low- income individuals cannot
afford to substitute public goods for private goods (Kaul, 2013). Unavailability of public goods
worsens the situation for the already poor.
It was as a result of these failures that the 2010 Kenyan constitution provided for decentralization.
Promotion of efficiency in producing public goods was among the arguments for devolution in
Kenya. By decentralized provision of public goods, it was believed that people’s needs could be
met more easily since county governments can identify people’s needs with ease. (Ghai, 2008)
observes that proponents of centralization may argue that a centralized system is more efficient
than a devolved system as it promotes equitable distribution and even development by collecting
and distributing revenue without middle levels of government, but the idea is not applicable in
Kenya where prior to devolution, there was discrimination against ethnic lines.
According to Kimenyi and Mwangi (2005), unlike with centralization where money for
development purposes would diffuse from the national government through more hierarchies of
administration, money under decentralization go straight to grass roots. According to (Ghai, 2008)
Decentralization would build on pressure on the government to look at the welfare of people at the
grass roots. (World Bank, 2011) found out that unfairness in distribution of opportunities is high
in Kenya, signaling complete inability of the Kenyan government to carry out re-distribution of
resources appropriately. (Njuguna, 2016) found out that devolution influences community
development as it improved living standards by improving accessibility to services such as schools,
clean water and health care. According to the 2010 Kenyan Constitution Fourth Schedule, the most
devolved sectors are Agriculture, Health, County Transport and Pre-primary education. This study
will focus on these most devolved sectors that are also the main drivers of any economy.
International Academic Journal of Economics and Finance | Volume 3, Issue 6, pp. 32-46
35 | P a g e
STATEMENT OF THE PROBLEM
A government that operates at an efficient level while creating public goods and services is a good
government, since this efficiency is essential in minimizing costs to citizens as well as ensuring
maximum welfare gains to the residents of a country. In Kenya however, a key challenge to the
government remains that of ensuring efficiency. This is evident by huge stocks of external debts
as well as uneven development within the country. Devolution was believed to improve efficiency
in service delivery due to local knowledge. Before the new constitution that was passed in 2010,
Kenya was characterized by uneven development and marginalization of some regions within the
country. The efforts to reform Kenyan constitution were triggered by the necessity to correct the
deficiencies with the central governance in the country. The defective governance framework in
Kenya was altered by the Constitution of Kenya, 2010, through reforms that led to devolution of
power through creation of two levels of government as outlined in Chapter eleven. This
constitution led to creation of 47 county governments. The most decentralized sectors are
Agriculture, Health, Transport and Education. Functions were also distributed between these two
levels of governments as outlined by the Fourth Schedule of Kenya Constitution, 2010 (Muriu, et
al. 2013). In Kenya, however, county governments are still grappling with challenges of provision
of public goods and services even after decentralization, which was aimed at making delivery of
services to citizens efficient. Recently, there are developing interest under devolution, about
whether counties are efficiently utilizing financial resources (Kimenyi and Mwangi, 2005).
Reports by Kenya Institute for Public Policy Research and Analysis illuminate various areas of the
economy that have not yet streamlined themselves and are still experiencing difficulties in their
performance. The report in 2013 for example, indicates that in the health sector, there was an
increase in maternal mortality from 414 in 2003 to 488 deaths per 100,000 live births in 2009. The
report of 2017 indicates that in the agricultural sector, the deficit for cereals in 2016 was 61,200
tons higher than that of 2012. A research by Transparency International (2013) observed that 41%
of Kenyan citizens were dissatisfied with the way county governments were delivering services.
A report by Omondi and Chege (2019) observed that in Tharaka Nithi County, with the agricultural
sector, households’ food stocks diminished in June 2018 forcing families to rely on markets for
food, which resulted to increased food prices. The proportion of children under five years at risk
of malnutrition increased to 2.6 percent in January, 2019 from 1.5 percent in December, 2018.
This study therefore aims at determining the of technical efficiency score in provision of various
public goods and services by Tharaka Nithi County Government.
GENERAL OBJECTIVE
The general objective of this study is to determine the levels of economic efficiency in provision
of public goods and services, and to compare efficiency levels across different devolved sectors of
Tharaka Nithi County.
International Academic Journal of Economics and Finance | Volume 3, Issue 6, pp. 32-46
36 | P a g e
EMPIRICAL LITERATURE
Deller et al. (1988) investigated efficiency in construction of roads in America. They estimated
cost functions by assuming their input to be financial expenditure and output was measured by size
of the road constructed. The study find out that there were high levels of inefficiencies in the
construction of roads in the rural areas. While this study concentrated on production of rural roads
alone, the current study will look at different outputs produced by transport sector which will
include roads produced and maintained as well as production of streetlights.
Deller et al. (1992) were concerned with finding out whether there existed technical efficiency
during maintenance of roads in the United States. The study applied Stochastic Frontier Analysis
to come up with the findings that road maintenance costs are very high, and the increase in the
costs is accelerated by inefficiencies. The current study will also apply Stochastic Frontier
Analysis, but will instead examine efficiency of the whole transport sector of a devolved unit. Chu
et al. (1992) investigated efficiency of bus companies in the United States and found out that the
agencies operated at very high inefficiency levels. The study had employed the means of Data
Envelopment Analysis. The current study will however apply stochastic frontier analysis and
examine whether such inefficiencies still exist.
A study by Hjalmarsson and Odeck (1996) investigated efficiency of tractors that construct roads
in Norway by application of Data Envelopment Analysis. The study used driver’s wage and fuel
as input indicators and total transport distance and time as output indicators. The findings were
that efficiency levels were between 0.80 and 0.90. The study also found out that efficiency is
neither influenced brand nor age of trucks. The current study deviates from this one, as it will only
consider financial expenditure as input by the transport sector.
The study of Perelman and Pestieau (1988) concentrated on determinants of efficiency on the
railway transport. It found out that when external factors are included in the model, the rank of
levels of efficiency changed. With the current study, railway transport is not available in the study
area, but instead efficiency in road transport will be investigated. A study by Afonso and St. Aubyn
(2005, 2006) was interested in comparing efficiency of education sectors of different countries.
By use of non-parametric approaches, they came up with the findings that different countries had
different levels of efficiency. The current study will however use stochastic frontier analysis and
will be concerned with efficiency of county government in provision of pre-primary education.
Deller and Rudnicki (1992) and Cooper and Cohn (1997) did a study on technical efficiency of
schools and determinants of efficiency in Maine and South Carolina. They used stochastic frontier
analysis to determine technical efficiency levels. They found out that the levels of efficiency varied
with the characteristics of schools. These studies were done in a developed country which
embraced devolution earlier, unlike the current study that looks at efficiency of a county
government in Kenya, which has just embraced devolution recently.
International Academic Journal of Economics and Finance | Volume 3, Issue 6, pp. 32-46
37 | P a g e
Ray (1991), Ray and Mukeherjee (1988), Dumcombe et al. (1977) and Ruggiero (1996) were
concerned with investigation of the factors determining technical efficiency for schools in
Connecticut. The findings of these studies were that efficiency changed with changes in the
economic and environmental traits of states. The current study will not look at determinants of
efficiency, but will measure efficiency levels of the Tharaka Nithi County government in provision
of pre-primary education.
Besent et al. (1982) found out that educational institutions in Houston had substantial inefficiencies
while Fare et al (1989) found that above 50 per cent of the institutions were operating efficiently
in Missouri. Both studies used non-parametric approaches of analysis. Banker et al. (2004)
investigated efficiency of schools in Texas. They used expenditure as an input and the number of
learners as output indicator. They found out that technical inefficiency raised across years while
allocative inefficiency remained relatively stable. While the current study will also use expenditure
as input or cost, it will apply stochastic frontier method of analysis.
Grosskopt et al. (2006) investigated efficiency of health sectors, and found out that first world
countries had high inefficiency levels compared to the second and third world countries. The
current study will deviate from this one because it will apply stochastic frontier analysis, and unlike
this study that compared efficiency across countries, the current study will compare efficiency
across counties of the same country. Kooreman (1994) uses Data Envelopment Analysis to show
that quality is negatively related to efficiency. This is explained by the fact that high quality
requires more resource use. More resource use means high cost and therefore translates to
inefficiency. The current study will apply stochastic frontier method of analysis.
Toren (1994) argued that efficiency is not dependent on level of profit that firms make. The current
study will as well apply stochastic method of analysis, but will not examine effects of profits on
efficiency. Woodbury and Dollery (2004) and Haug (2008) analyzed the efficiency of water supply
utilities together with determinants of efficiency in Australia and Germany respectively.
Woodbury and Dollery (2004) used total cost for water supply as input and annual water
consumption, quality index and number of assessments as output. The current study will examine
overall efficiency of a county health sector and not of a single activity, like water supply. These
two studies employed a second-stage regression and found that external factors have do not affect
efficiency.
RESEARCH METHODOLOGY
Research Design
Research design shows the structure of research and shows how different areas will work together
in addressing the research problem as well as communicating the key features. This study assumes
a descriptive research design. Stochastic Frontier Analysis was used to measure efficiency scores
of the four selected devolved sectors in provision of public goods and services.
International Academic Journal of Economics and Finance | Volume 3, Issue 6, pp. 32-46
38 | P a g e
Theoretical Model
The one stage approach proposed by Coelli (1995) and Belotti et al (2012) was used to estimate
the inefficiency parameter and the stochastic parameter of the models in stata package. This
estimation method has previously been used by Ezeh et al (2012), Rahman et al (2012) and Tijjani
(2006). To achieve both the objectives of determining efficiency levels of different devolved
sectors and comparing efficiency levels across sectors, the Cobb-Douglas function was applied as
it is simple and easy to estimate and interpret. The four devolved sectors that were investigated are
agriculture, pre-primary education, health and transport. For each sector, input comprised of the
amount of money utilized, while outputs varied across sectors. The general stochastic cost frontier
was presented as:
𝑦 = 𝛽′𝑥 + 𝑣 + 𝑢…………………………………………………………………...……...1
Where: y = noticed outcome; β’x + v = ideal outcome, in this case it represents minimum cost;
β’x is the deterministic part of the frontier and v- N(0, ɗ2V) is the stochastic part.
In this case, u is the inefficiency.
Presented in the Cobb-Douglas trans log form, the stochastic frontier becomes:
𝐿𝑛 𝑞𝑖 = 𝑥𝑖’𝛽 + Є𝑖 ………………………………………………………………..……..2
Where: 𝑞𝑖 is output or cost of a decision-making unit, i, xi‘s are logs of output for a cost model;
The error term Єi comprises two components which are the positive inefficiency
component µi .≥ 0 and the random error term u that is normally distributed N (0, ɗv2).
The Cobb-Douglas stochastic frontier takes the form:
𝐿𝑛 𝑞𝑖 = 𝛽0 + 𝛽𝑖 𝑙𝑛 𝑥𝑖 + 𝑣𝑖 + 𝑢𝑖………………………………………………...…….3
The equation is then estimated using Maximum Likelihood Estimation, to get efficiency scores.
The model for agricultural sector was specified as follows, and addressed the first objective:
𝑙𝑛𝑌𝑎 = 𝛼0 + 𝛼1𝑙𝑛𝑥1𝑎 + 𝛼2𝑙𝑛𝑥2𝑎 + 𝛼3𝑙𝑛𝑥3𝑎 + 𝑣𝑎 + 𝑢𝑎…………………………...…….4
Where: Ya is expenditure by the agricultural sector; α0 is the slope coefficient; X1a is the number
of irrigation projects; X2a is the number of livestock sale yards; X3a is the number of
agricultural extension officers; Va is the technical inefficiency component; Ua is the random
error term
International Academic Journal of Economics and Finance | Volume 3, Issue 6, pp. 32-46
39 | P a g e
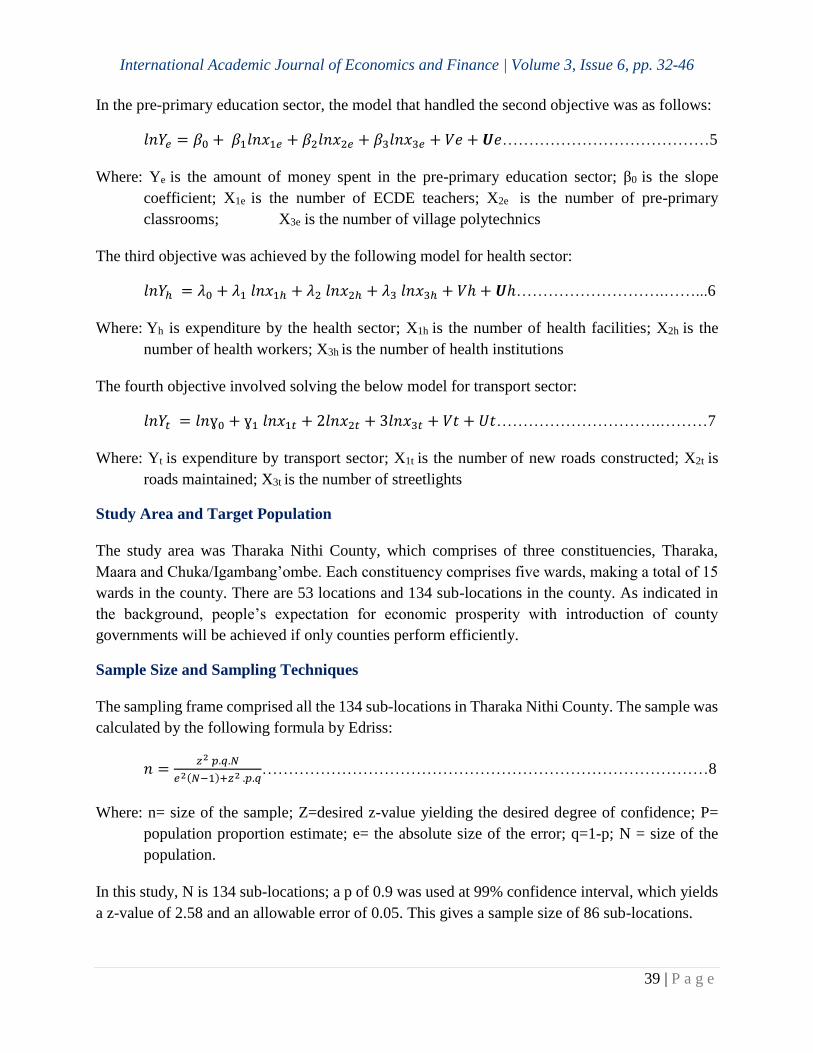
In the pre-primary education sector, the model that handled the second objective was as follows:
𝑙𝑛𝑌𝑒 = 𝛽0 + 𝛽1𝑙𝑛𝑥1𝑒 + 𝛽2𝑙𝑛𝑥2𝑒 + 𝛽3𝑙𝑛𝑥3𝑒 + 𝑉𝑒 + 𝑼𝑒…………………………………5
Where: Ye is the amount of money spent in the pre-primary education sector; β0 is the slope
coefficient; X1e is the number of ECDE teachers; X2e is the number of pre-primary
classrooms; X3e is the number of village polytechnics
The third objective was achieved by the following model for health sector:
𝑙𝑛𝑌ℎ = 𝜆0 + 𝜆1 𝑙𝑛𝑥1ℎ + 𝜆2 𝑙𝑛𝑥2ℎ + 𝜆3 𝑙𝑛𝑥3ℎ + 𝑉ℎ + 𝑼ℎ……………………….……...6
Where: Yh is expenditure by the health sector; X1h is the number of health facilities; X2h is the
number of health workers; X3h is the number of health institutions
The fourth objective involved solving the below model for transport sector:
𝑙𝑛𝑌𝑡 = 𝑙𝑛ɣ0 + ɣ1 𝑙𝑛𝑥1𝑡 + 2𝑙𝑛𝑥2𝑡 + 3𝑙𝑛𝑥3𝑡 + 𝑉𝑡 + 𝑈𝑡………………………….………7
Where: Yt is expenditure by transport sector; X1t is the number of new roads constructed; X2t is
roads maintained; X3t is the number of streetlights
Study Area and Target Population
The study area was Tharaka Nithi County, which comprises of three constituencies, Tharaka,
Maara and Chuka/Igambang’ombe. Each constituency comprises five wards, making a total of 15
wards in the county. There are 53 locations and 134 sub-locations in the county. As indicated in
the background, people’s expectation for economic prosperity with introduction of county
governments will be achieved if only counties perform efficiently.
Sample Size and Sampling Techniques
The sampling frame comprised all the 134 sub-locations in Tharaka Nithi County. The sample was
calculated by the following formula by Edriss:
𝑛 =𝑧2 𝑝.𝑞.𝑁
𝑒2(𝑁−1)+𝑧2 .𝑝.𝑞…………………………………………………………………………8
Where: n= size of the sample; Z=desired z-value yielding the desired degree of confidence; P=
population proportion estimate; e= the absolute size of the error; q=1-p; N = size of the
population.
In this study, N is 134 sub-locations; a p of 0.9 was used at 99% confidence interval, which yields
a z-value of 2.58 and an allowable error of 0.05. This gives a sample size of 86 sub-locations.
International Academic Journal of Economics and Finance | Volume 3, Issue 6, pp. 32-46
40 | P a g e
Multi-stage sampling technique was used in selecting a sample of 86 sub-locations for this study.
All the 3 constituencies were considered and wards within these constituencies were enlisted. A
random sample of 10 wards was selected. All the locations within the selected ten wards were
enlisted and a random sample of 40 locations was selected. All the sub-locations within the 40
selected locations were enlisted and a random sample of 86 sub-locations was selected. This
constituted the sample. The four County Executive Officers in charge of health, agriculture,
education and transport comprised the key informants, who were contacted to give information
that sub-location heads may have difficulty finding such as concerning expenditures.
Data Type, Sources and Collection
Primary data was used for this study. The information was provided by assistant chiefs, who are
the sub-locations heads. Schedules were administered to the respondents. The justification for
choice of schedules is that it ensures a good response rate and that clarification can be sought from
the researcher in case a respondent doesn’t understand a question.
Data Analysis
The collected data was first entered and cleaned in Microsoft Access. Data was imported to Stata
and analyzed by Maximum Likelihood Estimation. The unknown parameters of the stochastic
frontier provision and the efficiency scores were estimated simultaneously.
RESEARCH RESULTS
Public sector across the world, faces numerous challenges in its attempts to operate with efficiency.
Kenya has as well faced these challenges regardless of the several steps it has taken to address
efficiency. The public sector has a great task of addressing these challenges sufficiently, so as to
ensure that public funds are being utilized efficiently to provide public goods and services to
citizens. In the efforts to improve efficiency in provision of public goods and services to all citizens
even at the grassroots, Kenya embraced devolution in the year 2010.Spending at the counties was
believed would address the real needs of the local citizens efficiently. These steps, however, have
operated with their own challenges. These challenges have hence made efficient operation at the
counties difficult. These challenges include procurement practices that are unfair, lack of
transparency and accountability, lack of capacity and skills, resource optimization issues and lack
of internal financial controls.
This study analyzed the performance of 4 devolved sectors of Tharaka Nithi County, which are
agriculture, health, pre-primary education and transport. The sectors considered are the most
devolved and the main drivers of any economy. Efficiency scores of the sectors were estimated
and comparisons made. The study estimated stochastic cost frontier functions of Cobb-Douglas
type, one for each sector. Financial expenditure was taken to be the cost, while outputs varied
across the sectors since the sectors perform different development activities within the county. A
sample of 86 out of 134 sub locations was selected.
International Academic Journal of Economics and Finance | Volume 3, Issue 6, pp. 32-46
41 | P a g e
The study found out that the mean technical efficiency of the four sectors was 28.66%, where
education sector was the most efficient with an efficiency score of 37.68%, followed by the
transport sector with an efficiency score of 30.60%. Agricultural sector had an efficiency score of
27.83% while the health sector was the least efficient with a score of 18.52%.
INFERENTIAL STATISTICS
Table 1: Estimation results for agricultural sector
Agriculture Expenditure Coefficient Std. Err Z P>Z
Market place -0.1758476 0.904092* -1.92 0.052
Irrigation project 1.21604 0.1550757*** 7.82 0.000
Extension officer -1.020244 0.1302521*** -7.83 0.000
Constant 30.0310267 14.20345*** 0.00 0.000
lnsig2v
-10.46393 902.282 -0.01 0.991
lnsig2u 26.551 0.4447153 59.70 0.998
Number of observations=86; Log likelihood = -1209.446
***significant at 1%; **significant at 5% and *significant at 10%.
Table 1 shows the estimation results for a cost frontier of the Agricultural sector. Cross sectional
data was used and Maximum Likelihood Estimation assumed half normal distribution of the
inefficiency term. The log likelihood function for the model is 1209.446.The frontier is not devoid
of technical inefficiency as the calculated likelihood ratio test statistic was found to be
314.8369.This value exceeds the critical value of 3.8415 at 5% significance level. This enables
this study to reject the null hypothesis that inefficiency effects are absent in the frontier.
While all the output variables of the stochastic cost frontier model are statistically significant, it is
only irrigation project that has a positive relationship with the sector’s expenditure level. The
coefficients of the market place and extension officer are negative. The result implies that there is
a positive relationship between the total expenditure for the agricultural sector and outputs of the
sector in terms of construction of boreholes for irrigation purposes. This result shows that by
increasing expenditure for the agricultural sector, the county will not be interested in employing
more extension officers but would instead dig more bores. This can be attributed to the fact that
the county has not yet appreciated the contribution of extension services in promoting agriculture.
Table 2: Efficiency scores for the four sectors
Sector Efficiency score Rank
Agriculture 27.83% 3
Health 18.52% 4
Education 37.68% 1
Transport 30.60% 2
International Academic Journal of Economics and Finance | Volume 3, Issue 6, pp. 32-46
42 | P a g e
Table 2 presents efficiency scores for the four sectors considered, which are agriculture, health,
education and transport. According to Jondrow et al. (1982) and Bauer (1987) it is easy to
determine the inefficiency term from the composed error term, when the conditional distribution
of ui given Єi is cleared stated. Therefore, this information will help in generating point estimates
of the efficiency term for each sector, while the mean of this distribution will serve as a point
estimator for ui. For a half-normal distribution of the inefficiency term, the conditional
distributions are given by:
𝐸 (𝑢𝑖/ Є𝑖) = ɗ ∗ [ɸ (Є𝑖𝜆/ɗ) / 1 − Ф (−Є𝑖𝜆/ɗ) + (Є𝑖𝜆/ɗ)]
Hence, with the point estimates ui, technical inefficiency estimates for each sector were obtained
via the equation 𝑇𝐸𝑖 = 𝑒𝑥𝑝 (−𝑢𝑖). To get the efficiency estimate therefore, the inefficiency score
as a percentage is subtracted from 100%. From table 2 above, Education sector was ranked the
most efficient with an efficiency score of 37.67%, followed by the transport sector with an
efficiency score of 30.60%. Agricultural sector had an efficiency score of 27.83% while the health
sector was the least efficient with a score of 18.52%. All the four sectors had efficiency scores
below 50%, which indicates that all the sectors of Tharaka Nithi County have got ample spaces to
improve on their performance. It means that spending at the county does not match the output in
terms of public goods and services provision.
When the constitution of Kenya, 2010 brought about reforms in the public sector, it was believed
that by formation of counties, efficiency in service delivery to citizens would be improved. The
results here, however, suggest that the County governments have so far not made much effort in
addressing service provision at the grass roots. A concern thus emerges that devolution reforms
may not yet have started impacting positively on service delivery. The anticipated positive results
on the general public may not be forthcoming if public sector management is obsessed with
prioritizing the interests of the government regardless of whether or not the interests of the
government are in contrary with those of the citizens (Ghobadian et al., 2009).
Performance of Tharaka Nithi County Government is felt in some parts of the county. Citizens that
had never seen any road constructed or any health facility before emergence of county
governments can now access these services easily, thanks to devolution. The low levels of
efficiency, however, for example with the health sector, suggest that a lot has to be done especially
on expenditure management. In order to improve efficiency, it should be possible to complete a
project with the least possible amount of spending.
The low efficiency scores can be explained by a variety issues such as procurement processes that
are not competitive, deficiencies with the internal control systems on management of expenditure,
lack of transparency and accountability, failure to optimize resource utilization and compliance
issues. When Personnel are appointed to perform tasks for which they lack the professionalism or
have limited experience, wastage of public funds will ensue. About compliance issues, when there
are no consequences to be faced by anyone who contravenes the set regulations are, constant non-
International Academic Journal of Economics and Finance | Volume 3, Issue 6, pp. 32-46
43 | P a g e
compliance will occur leading to wastage of public resources. Corruption and embezzlement of
funds may also be a cause of the low efficiency scores.
CONCLUSION
This study concludes that inefficiency in provision of public goods and services is a great challenge
with the county governments in Kenya. While provision of these goods and services at the county
level enables reaching the citizens at the grassroots, expenditure management needs to be looked
at because a lot of financial resources are being used to complete a few or no projects. This suggests
that public funds are not being managed in an efficient manner. Most of the funds are used to pay
staff salaries and allowances, alongside other recurrent expenditures. This limits the number of
long-term projects such as irrigation schemes and health facilities.
Efficiency is one of the components of a vibrant economy that cannot be overlooked. In its
conclusion, this study observes that policies should be put in place to minimize inefficiency in
operation of county governments so as to ensure that the funds are utilized in a way that is
beneficial to the citizens.
RECOMMENDATIONS
County governments have been revealed to have inefficiencies in their operations. This is depicted
by the huge amounts of money spent to complete a single project, resulting to very low efficiency
scores as shown in table 4.7. Public funds are not being optimally utilized, and thus leads to
understatement of the output. This study recommends that all sectors of a county government look
for avenues to facilitate utilization of the available funds optimally such as by increasing
monitoring and evaluation of projects and subjecting employees to performance contracting. This
will compel the staff to improve their performance in providing services to the county residents.
The study also recommends that personnel who are academically and professionally qualified be
placed in charge of expenditure management .This will ensure that expenditure plans are being
performed from an experienced point of view, unlike when politicians are assigned this role.
This study further recommends that there be clear regulations on county financial management
and that those that contravene the regulations be made to face stern consequences. This will
discourage selfish employees from failing to comply with the regulations, and thus avoid wastage
of the public funds.
REFERENCES
Afonso, A. and M. St. Aubyn (2005): “Non-Parametric Approaches to Education and Health
Efficiency in OECD Countries,” Journal of Applied Economics, 8, 227–246
Aigner D J.Lovell C.A K and Schmidt P. (1977). Formulation and Estimation of Stochastic
Production function models. “Journal of Econometrics 6:21-37, 10, 47–62.
Banker, R., S. Janakiraman, and R. Natarajan (2004): “Analysis of Trends in Technical and
Allocative Efficiency: An Application to Texas Public School Districts,” European
International Academic Journal of Economics and Finance | Volume 3, Issue 6, pp. 32-46
44 | P a g e
Journal of Operational Research, 154, 477–491.
Besley, Timothy and Stephen Coate.(2003) "Centralized Versus Decentralized Provision Of Local
Public Goods: A Political Economy Approach," Journal of Public Economics,
2003, v87(12,Dec), 2611-2637.
Bessent, A., W. Bessent, J. Kennington, and B. Reagan (1982): “An Application of Mathematical
Programming to Assess Productivity in the Houston Independent School District,”
Management Science, 28, 1355–1367.
Brown, H. (2003): “Managed Care and Technical Efficiency,” Health Economics, 12, 149-158.
Chicoine, D., S. Deller, and N. Walzer (1989): “The Size Efficiency of Rural Governments:The
Case of Low-Volume Rural Roads,” Publius: The Journal of Federalism 19, 19,
127–138.
Chu, X., G. Fielding, and B. Lamar (1992): “Measuring Transit Performance Using Data
Envelopment Analysis,” Transportation Research Part A: Policy and Practice, 26,
Coelli, T. J. (1995). Recent development in frontier modeling and efficiency measurement
Cooper, S. and E. Cohn (1997): “Estimation of a Frontier Production Function for the South
Carolina Educational Process,” Economics of Education Review, 16, 313–327.
Debreu, E. (1951). The coefficient of resource utilization. Econometrica, 19, 273-292.
Deller, S., C. Nelson, and N. Walzer (1992): “Measuring Managerial Efficiency in Rural
Government,” Public Productivity and Management Review, 15, 355–370
Deller, S. and C. Nelson (1991): “Measuring the Economic Efficiency of Producing Rural Road
Services,” American Journal of Agricultural Economics, 72, 194–201.
Deller, S. and E. Rudnicki (1992): “Managerial Efficiency in Local Government: Implications on
Jurisdictional Consolidation,” Public Choice, 74, 221–231
Deller, S. and J. Halstead (1994): “Efficiency in the Production of Rural Road Services: The Case
of New England Towns,” Land Economics, 70, 247–25
Deller, S. (1992): “Production Efficiency in Local Government: A Parametric Approach,” Public
Finance, 47, 32–44.
Deller, S., D. Chicoine, and N. Walzer (1988): “Economies of Size and Scope in Rural Low-
Volume Roads,” Review of Economics and Statistics, 70, 459–465.
Deily, M. and N. McKay (2006): “Cost Inefficiency and Mortality Rates in Florida Hospitals,”
Health Economics, 15, 419 –431
Duncombe, W., J. Miner, and J. Ruggiero (1997): “Empirical Evaluation of Bureaucratic Models
of Inefficiency,” Public Choice, 93, 1–18.
Fare, R., S. Grosskopf, and W. Weber (1989b): “Measuring School District Performance,” Public
Finance Quarterly, 17, 409–428
Farrell, M. J. (1957). The measurement of productivity efficiency. Journal of Royal Statistical
Society Series, 120, 253-290.
Fried, H., Lovell, K & Schmidt, S.(2008).The measurements of productive efficiency and
Productivity growth .New York: Oxford University press
Ghai, Y. (2008). Devolution Restructuring the Kenyan State Journal of Eastern African Studies
Vol 2, No 2. Nairobi: Government of kenya.
Ghatak, M. (1998). Who Should Provide Public Goods ? A Perspective from the Theory of
Organizations . 1, (December).
Ghatak, M. (1998). Who Should Provide Public Goods ? A Perspective from the Theory of
Organizations . 1, (December).
International Academic Journal of Economics and Finance | Volume 3, Issue 6, pp. 32-46
45 | P a g e
Grosskopf, S., S. Self, and O. Zaim (2006): “Estimating the Efficiency of the Systemof Healthcare
Financing in Achieving Better Health,” Applied Economics, 38, 1477–1488
Haug, P. (2008): “Effects of “Democratic Control” on the Efficiency of Local Public Enterprises:
Empirical Evidence for Water Suppliers in Eastern Germany,” Public Finance and
Management, 8, 1–35.
Hal, R. Varian (1992) Microeconomic Analysis, Third Edition: London.
Hirsch, W. (1965): “Cost Functions of an Urban Government Service: Refuse Collection,” Review
of Economics and Statistics, 47, 87–92.
Hjalmarsson, L. and J. Odeck (1996): “Efficiency of Trucks in Road Construction and
Maintenance: An Evaluation with Data Envelopment Analysis,” Computers and
Operation Research, 23,
Kaul, I. (2013) Accelerating poverty reduction 3(13), 131–140 Kimenyi, Mwangi S.(2005)
"Efficiency and Efficacy of Kenya's Constituency Development Fund: Theory and
Evidence" Working Papers. 200542.
Kooreman, P. (1994): “Nursing Home Care in The Netherlands: A Nonparametric Efficiency
Analysis,” Journal of Health Economics, 13, 301–316.
Kreiner, C. T. and V. N. (2009). Optimal Provision of Public Goods : A Synthesis ∗ (No. 2538).
Transportation. Denmark.
KIPPRA (2017) Kenya Economic Report 2017, Sustaining Kenya’s Economic Development by
Deepening and Expanding Integration in the region.
KIPPRA (2013) Kenya Economic Report 2013, Creating an Enabling Environment for Stimulating
Investment for Competitive and Sustainable Counties.
Mugambi K. and Theuri F. (2014) The Challenges Encountered by County Governments in Kenya
During Budget Preparation: Jomo Kenyatta University of Agriculture and
Technology
Muriu A. M (2012) Decentralization, Citizen Participation and local public service delivery.
Master’s Thesis.
Njuguna, C. (2016). Devolution And Its Effect On The Community: A Cross Sectional Study Of
Githunguri Constituency In Kiambu County. University of Nairobi.
Omondi H. and Chege J. (2019) A Joint Report by the Kenya Food Security Steering Group and
Tharaka Nithi County County Steering Group: Government Printer.
Perelman, S. and P. Pestieau (1988): “Technical Performance in Public Enterprises: A
Comparative Study of Railways and Postal Services,” European Economic Review,
32, 432–441.
Ray, S. (1991): “Resource-Use Efficiency in Public Schools: A Study of Connecticut Data,”
Management Science, 37, 1620–1628.
Ray, S. and K. Mukherjee (1998): “Quantity, Quality, and Efficiency for a PartiallySuper-Additive
Cost Function: Connecticut Public Schools Revisited,” Journal of Productivity
Republic of Kenya (2018) Tharaka Nithi County Integrated Development Plan: 2018-2022,
Nairobi: Government Printer.
Republic of Kenya (2009) Population and Housing Census, Nairobi: Government Printer.
Republic of Kenya (2010) The Constitution of Kenya 2010, Nairobi: National Council for Law
Reporting.
Republic of Kenya (2012) Tharaka Nithi County Strategic Plan 2012-2017: Government Printer
Ruggiero, J. (1996): “On the Measurement of Technical Efficiency in the Public Sector,”
European Journal of Operational Research, 90, 553–565.
International Academic Journal of Economics and Finance | Volume 3, Issue 6, pp. 32-46
46 | P a g e
Stiglitz, J. E. (1977). The Theory of Local Public Goods. The Economics of Public Services, 274–
333. https://doi.org/10.1007/978-1-349-02917-4_12
Thiam, A., Bravo-Ureta, B. E., & Rivas, T. E. (2001).Technical efficiency in developing country
Agriculture: A meta-analysis. Agricultural Economics, 25(2-3), pp.235-243.
Tiebout, C. M. (1956). A Pure Theory of Local Expenditures. Journal of Political Economy (Vol.
64). https://doi.org/10.1086/257839
Timothy, B., & Coate, S. (2000). Centralized versus Decentralized Provision of Local Public
goods: A political economy analysis. Political economy. London.
Transparency International (2013) Global Corruption Barometer Report.
Wamae, J.W (2014). Role of Procurement Function in enhancing performance in Government: A
case of Machakos County. 223–230.
Woodbury, K. and B. Dollery (2004): “Efficiency Measurement in Australian Local Government:
The Case of New South Wales Municipal Water Services,” Review of Policy
Research, 21, 615–636
World Bank. (2011). Special Focus: Kenya’s Momentous Devolution. Kenya Economic Update,
18–54.
Wright, D. (1974). Fiscal Federalism. By Wallace E. Oates. (New York: Harcourt, Brace,
Jovanovich, 1972. Pp. 256. $7.95.). American Political Science Review, 68(4),
1777-1778. doi:10.2307/1959998