Efficiency Measures for Child Protection and Support Pathways Reforms in Government Service Provision Steering Committee for the Review of Commonwealth/ State Service Provision Commonwealth of Australia 2003
Transcript
Efficiency Measuresfor Child Protection
and Support Pathways
Reforms inGovernmentService Provision
Steering Committee for theReview of Commonwealth/State Service Provision
Commonwealth of Australia 2003
Commonwealth of Australia 2003
ISBN 1 74037 117 8
This paper is copyright. It has been produced by the Steering Committee for the Review ofCommonwealth/State Service Provision (SCRCSSP). Apart from any use as permittedunder the Copyright Act 1968, the work may be reproduced in whole or in part for study ortraining purposes, subject to the inclusion of an acknowledgment of the source.Reproduction for commercial use or sale requires prior written permission from theDepartment of Communications, IT and the Arts. Requests and inquiries concerningreproduction and rights should be addressed to the Commonwealth CopyrightAdministration, Intellectual Property Branch, Department of Communications, IT and theArts, GPO Box 2154, Canberra ACT 2601.
The Productivity Commission acts as the Secretariat for the Steering Committee.
This publication is available in hard copy or PDF format from the ProductivityCommission website at www.pc.gov.au. If you require part or all of this publication in adifferent format, please contact the Secretariat (see below).
SecretariatSteering Committee for the Review of Commonwealth/State Service ProvisionProductivity CommissionLB 2 Collins Street East Post OfficeMelbourne VIC 8003
Suggestions:The Steering Committee welcomes suggestions on the information contained in this Report.Please direct your suggestions to the above address.
An appropriate citation for this publication is:
SCRCSSP (Steering Committee for the Review of Commonwealth/State ServiceProvision) 2003, Efficiency Measures for Child Protection and Support Pathways,Reforms in Government Service Provision, AusInfo, Canberra.
FOREWORD III
Foreword
In 1993, the Council of Australian Governments established the Review ofCommonwealth/State Service Provision to promote the efficient and effectivedelivery of government services. The Review does this mainly by developingcomparable performance data for selected government services which are publishedannually in the Report on Government Services.
This report provides the basis for a major advance in the way child protectionperformance is assessed, reflecting fundamental shifts in notions of both servicedelivery and government financial accountability. There has always been arealisation among service providers that the best use of scarce resources and the bestoutcomes for clients are achieved by tailoring services to individual needs. At thesame time, reforms in government financial management were linkingaccountability and effective resource use with a performance culture focused onoutputs and outcomes.
The method presented in this report brings these two ideas together. The nationalpathways developed as part of the model provide a linkage to service outcomes,while the activity based costing method provides a linkage to resource managementand accountability. This study should be of interest to a wide audience and providean example for others to build on.
Gary BanksChairmanSteering Committee for the Review ofCommonwealth Service Provision
Petrice JudgeConvenorProtection and SupportWorking Group
IV FOREWORD
CONTENTS V
Contents
Contents V
Acknowledgments VII
Abbreviations IX
Glossary X
Executive summary XIII
PART A INTRODUCTION
1 Background to the project 1
1.1 Report on Government Services 1
1.2 Reporting on protection and support services 3
3 State/Territory child protection and support systems 21
3.1 Service delivery arrangements 21
3.2 Trends in current service delivery 24
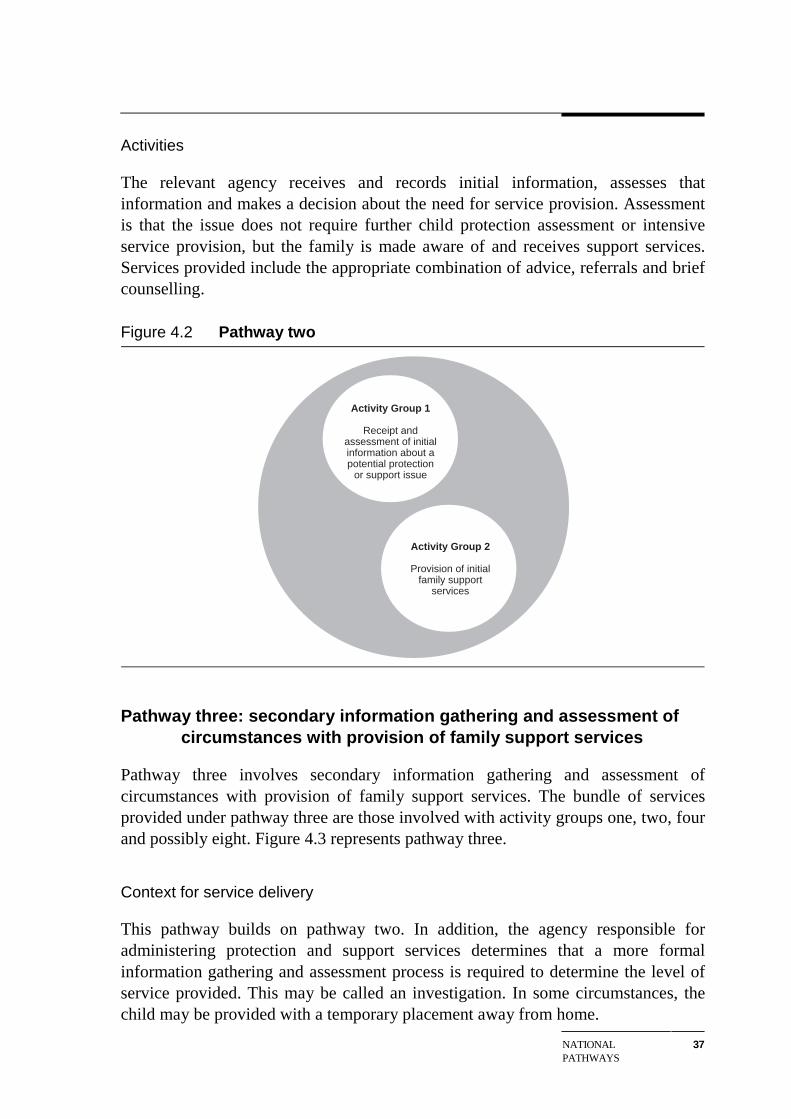
4 National child protection and support pathways 27
4.1 Determining the national pathways 27
4.2 Activities in the national pathways 29
4.3 Agreed national pathways 34
4.4 Summary of national pathways 47
VI CONTENTS
PART C NATIONAL REPORTING METHOD
5 National reporting method 495.1 Financial information 50
5.2 Service delivery measures information 54
5.3 Deriving pathway efficiency measures 56
6 Data availability, comparability and interpretation 596.1 Availability 59
6.2 Comparability 63
6.3 Interpretation 68
PART D IMPLEMENTATION ISSUES
7 Testing the model 717.1 Trial data issues 71
7.2 Ability to report 72
7.3 Activity group expenditure analysis 76
8 Future directions 798.1 Reforms, projects and anticipated changes 79
8.2 Issues for further review and development 80
8.3 Aligning national data collections 83
PART E APPENDICES
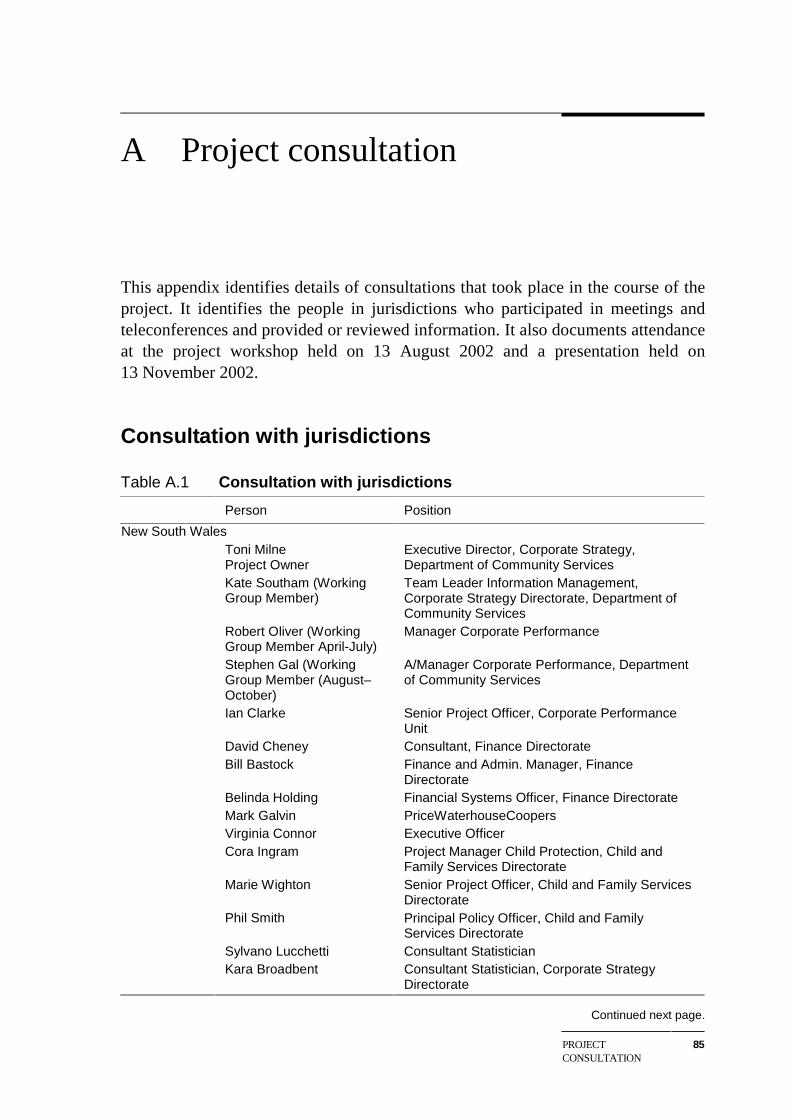
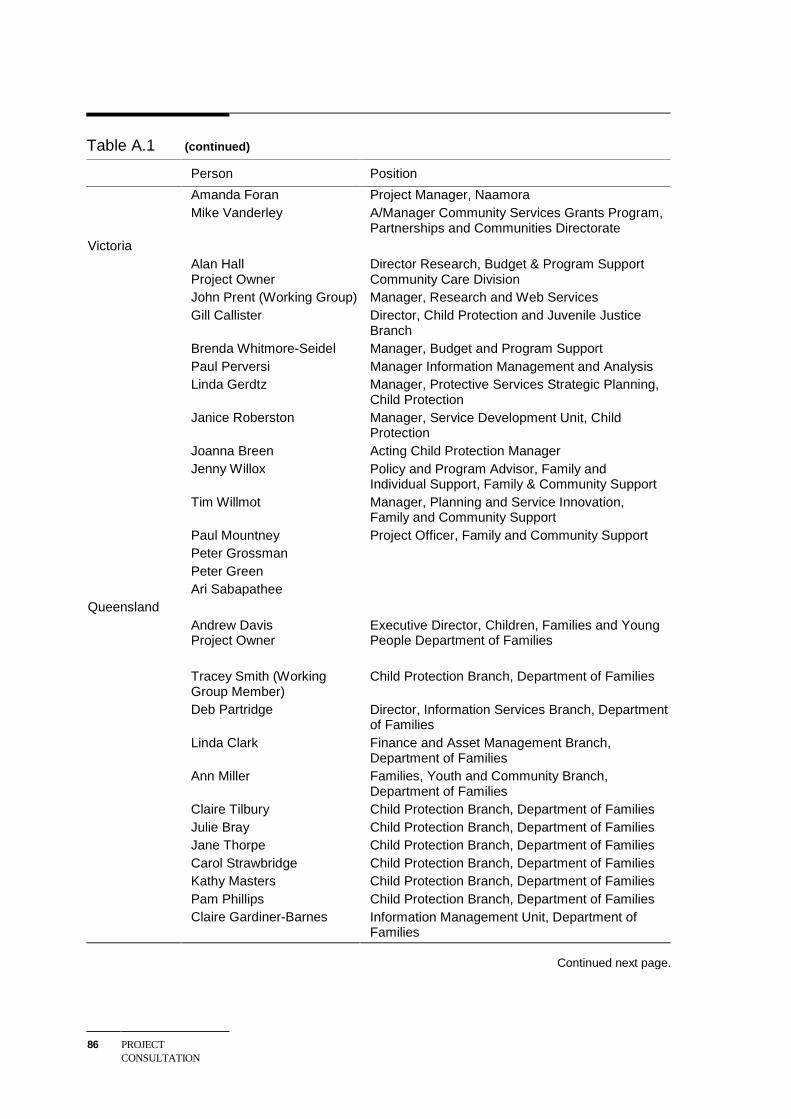
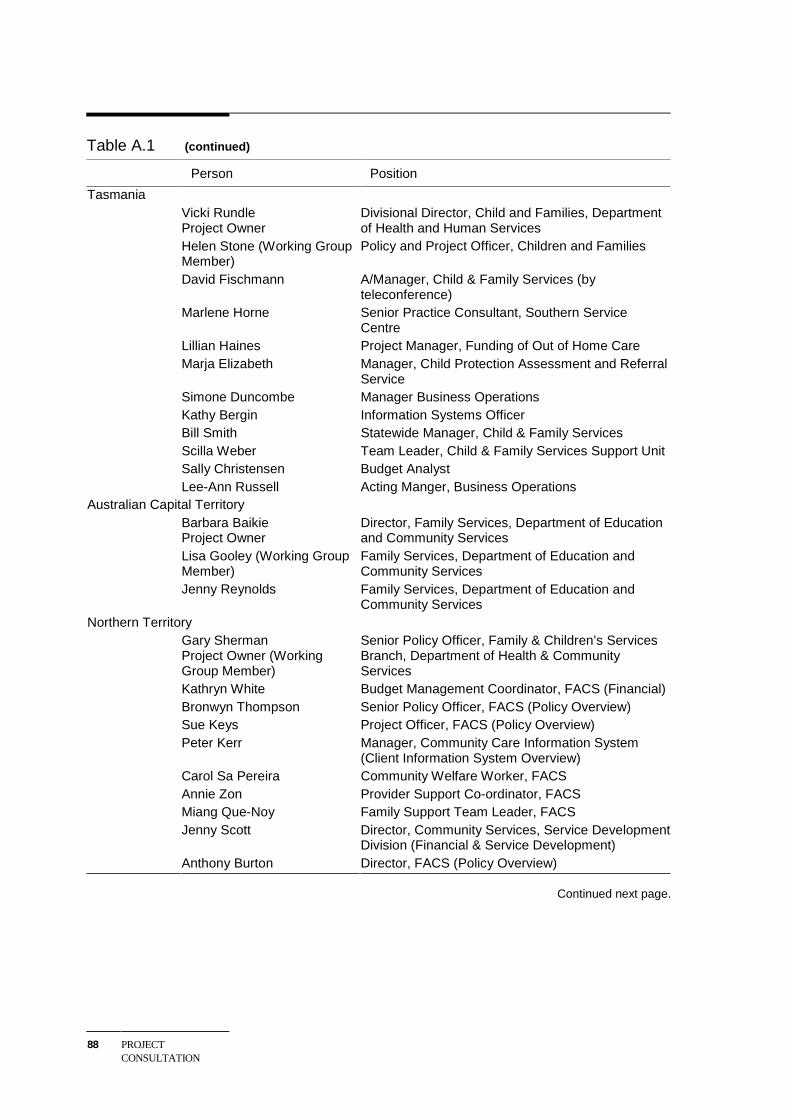
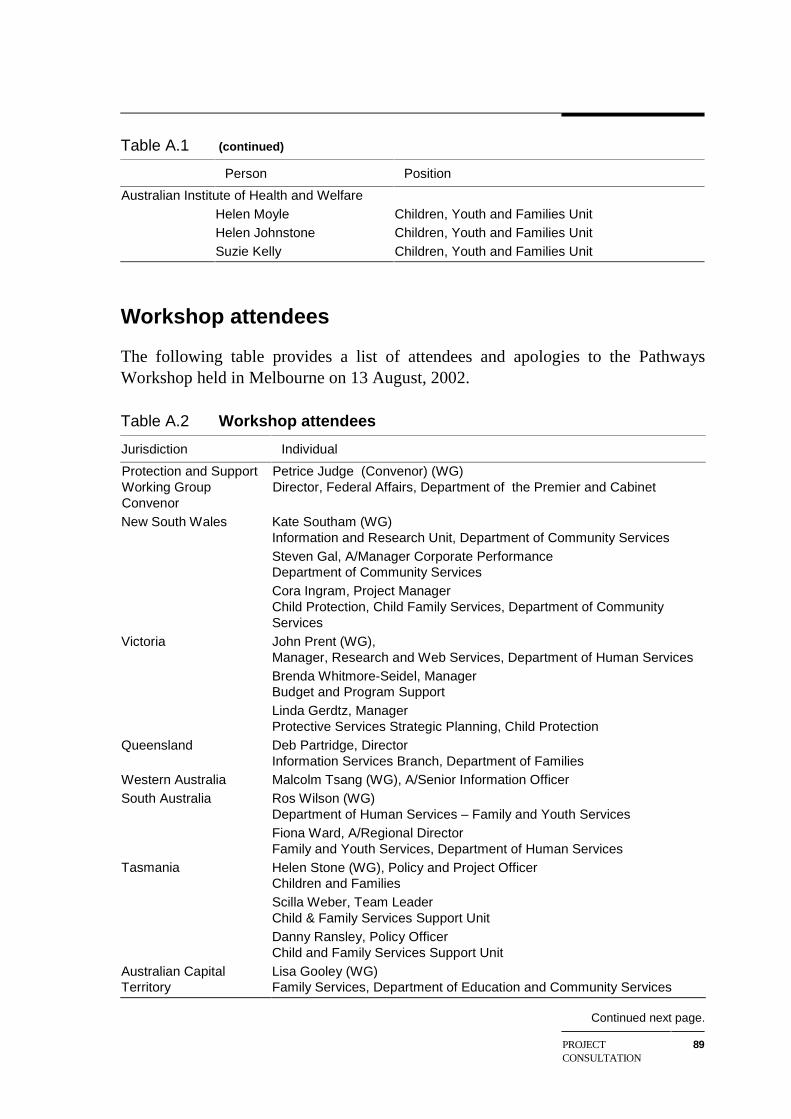
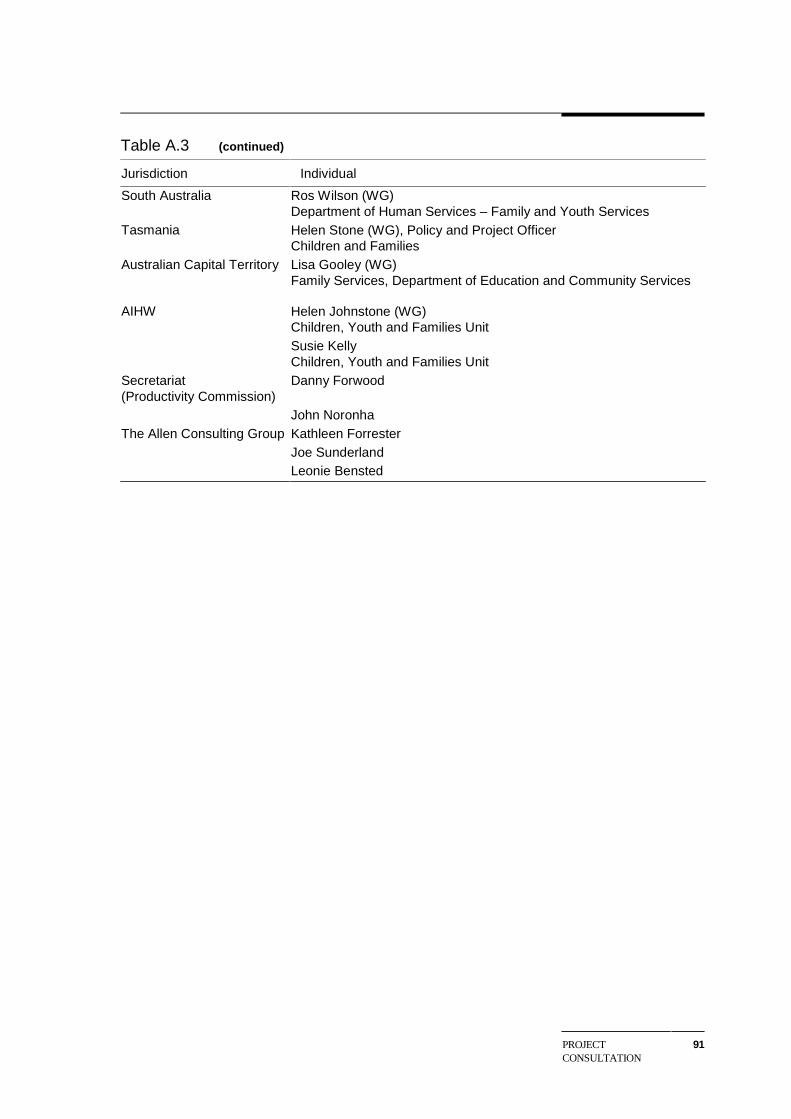
A Project consultation 85
B Detailed description of national reporting method 93
REFERENCES 103
ACKNOWLEDGMENTS VII
Acknowledgments
This report reflects the generous input of many people involved in various aspectsof protection and support services in each jurisdiction in Australia. The SteeringCommittee would like to thank those people involved in the meetings aboutjurisdiction pathways, the stage one workshop where the pathways were endorsed,and the stage two meetings and teleconferences where detailed discussions tookplace on financial and client information. Particular thanks are due to the:
• Allen Consulting Group team — Mary Ann O’Loughlin, Kathleen Forrester, JoeSunderland and Leonie Bensted — on whose work this report is largely based.
• Protection and Support Services Working Group (appendix A) who wereresponsible for setting up and attending meetings and teleconferences in theirrespective jurisdictions and for coordinating the process of moving from draft tofinal documents;
• Australian Institute of Health and Welfare — Helen Moyle, Helen Johnstone andSuzie Kelly — for their valuable support and feedback on technical issues; and
• project steering group — Danny Forwood (Productivity Commission), JohnPrent (Victorian Department of Human Services), Ros Wilson (South AustralianDepartment of Human Services), and John Noronha (Productivity Commission)— for their on-going support and guidance throughout the project.
A final word of thanks goes to the project owners in each jurisdiction (appendix A)whose commitment to this project has demonstrated the benefits of interjurisdictioncooperation.
VIII ACKNOWLEDGMENTS
ABBREVIATIONS IX
Abbreviations
ABC Activity Based Costing
ACG Allen Consulting Group
AIHW Australian Institute of Health and Welfare
COAG Council of Australian Governments
DHS Victorian Department of Human Services
NGO Non-Government Organisation
SCRCSSP Steering Committee for the Review of Commonwealth/StateService provision
X GLOSSARY
Glossary
Activity group An activity group represents a particular bundle of servicesdelivered by jurisdictions. Stage one of the project hasdeveloped eight specific activity groups.
Child A person aged 0–17 years.
Cost drivers Cost drivers are the factors that have the greatest impact on theoverall cost of delivering a service.
Direct costs Direct costs are those costs that can directly and unequivocallybe attributed to a specific activity. They include labour(including on-costs) and materials used to produce a singlegood or service.
Facility basedcare
Care provided to a child in a residential building whosepurpose is to provide placements for children and where thereare paid staff — includes placements in ‘family group home’.
Family supportservices
Services that seek to benefit families by improving theircapacity to care for children and/or strengthening familyrelationships.
Foster care Care provided to a child who is living apart from their naturalor adoptive parent(s) by one or more adults in a privatehousehold. The substitute parents, generally called ‘fosterparents’, are paid a regular allowance for the child's support bya government authority or non-government organisation.‘Foster parents’ are chosen from a list of persons registered,licensed or approved as foster parents by an authoriseddepartment or non-government organisation. The authoriseddepartment or non-government organisation providescontinuing supervision or support while the child remains inthe care of ‘foster parents’.
Indirect costs Indirect costs are those costs which are not directly attributableto an activity.
GLOSSARY XI
Kinship/relativecare
Care provided to a child in the home of family members (otherthan parents) or a person well known to the child and/or family(based on a pre–existing relationship) who is reimbursed by theState/Territory for the care of the child.
National pathway A set of nationally agreed protection and support services thathave been defined and grouped for the purposes of creating abase from which to calculate a pathway efficiency measure.
Non-operationalcosts
The costs associated with undertaking non-operational tasks.
Non-operationaltasks
Non-operational tasks are essential to deliver services but notnecessarily evident to the child.
Operational costs The costs associated with undertaking operational tasks.
Operational tasks Operational tasks involve direct service delivery to a child orchildren.
Out-of-home care Care for children aged 0–17 years, where the State makes afinancial payment. This includes placements with relatives,other than parents, where the State makes a financial payment(regardless of which agency makes a decision on placement). Itdoes not include placements made in disability services,psychiatric services and juvenile justice facilities, or inovernight child care services.
Out-of-home care includes children in legal and voluntaryplacements (that is, children on a legal order and children noton a legal order). Out-of-home care excludes children in SAAPplacements.
Pathway Combination of activity groups developed during stage one ofthe project.
Protective issues A protective concern refers to situations where a child has beenor is being abused, neglected or otherwise harmed or whereparents cannot provide (or are unwilling to provide) adequatecare and protection for their child or children.
Review, the Review of Commonwealth/State Service provision.
XII GLOSSARY
SteeringCommittee, the
Steering Committee for the Review of Commonwealth/StateService provision.
Working Group,the
Protection and Support Services Working Group
EXECUTIVESUMMARY
XIII
Executive summary
The pathways project developed and tested a method to allow States and Territoriesto calculate more meaningful, comparable and robust efficiency measures for theprotection and support services they deliver. Implementation of the model has thepotential to significantly improve the quality of national reporting of protection andsupport efficiency measures. The model should also provide information to Statesand Territories that will assist their on-going efforts to improve the protection andsupport services they provide to some of the most vulnerable members of ourcommunity.
Background to the project
This project was designed to support the work of the Review ofCommonwealth/State Service provision (the Review). An important role of theReview is the ongoing development of comparable performance measures presentedin the annual Report on Government Services. Prior to this project, information toenable meaningful comparisons across jurisdictions of the cost of deliveringprotection and support services was limited. This has constrained the ability of theReview to report meaningful and comparable protection and support efficiencymeasures.
The Review’s Protection and Support Services Working Group (the WorkingGroup) identified the need to develop protection and support efficiency measuresthat better reflect current service delivery models and practice and improve thecomparability and robustness of the reported measures (see chapter 1).
In April 2002, the Review commissioned The Allen Consulting Group to develop a‘pathways efficiency model’; that is, a method to calculate comparable efficiencymeasures for protection and support services. The project was jointly funded by theStates and Territories and was coordinated by a Steering Group comprising theReview’s Secretariat and Working Group representatives. The project wasundertaken between April 2002 and January 2003 (see chapter 2 and 3).
XIV EXECUTIVESUMMARY
The efficiency model
The pathways efficiency model is based on a ‘top-down’ application of the activity-based costing (ABC) method. The ABC method exhibits a number of conceptualand pragmatic strengths for application to protection and support services,including:
• it is a strong method when a single input is used to produce multiple outputs,which is a common feature of protection and support service delivery;
• it can represent the relationships that exist between resource use in servicedelivery and the cost of providing those services, contributing to accuratemeasures that are useful for jurisdictions delivering these services as well asnational reporting; and
• the approach does not require jurisdictions to collect financial information in away that mirrors service provision. Given the differences in approach tofinancial information collection across jurisdictions, this is a valuable feature ofthe approach.
To apply ABC requires an agreed set of activities to form a basis from which tocalculate efficiency measures. For the calculated efficiency measures to bemeaningful, it is critical that the underpinning activities fully reflect the nature andscope of protection and support service provision.
The ‘pathways’ concept is an attempt to capture the direction of the current practiceapproaches. This concept recognises that children requiring protection and supportservices can move along and/or between a range of different ‘pathways’ through thesystem to ensure that their needs are being met.
Thus, the efficiency model developed in this project adopts a pathways approach todescribe and define the protection and support services, for the purpose of utilisingABC to calculate efficiency measures. These two aspects of the efficiency modelare described below.
The national pathways
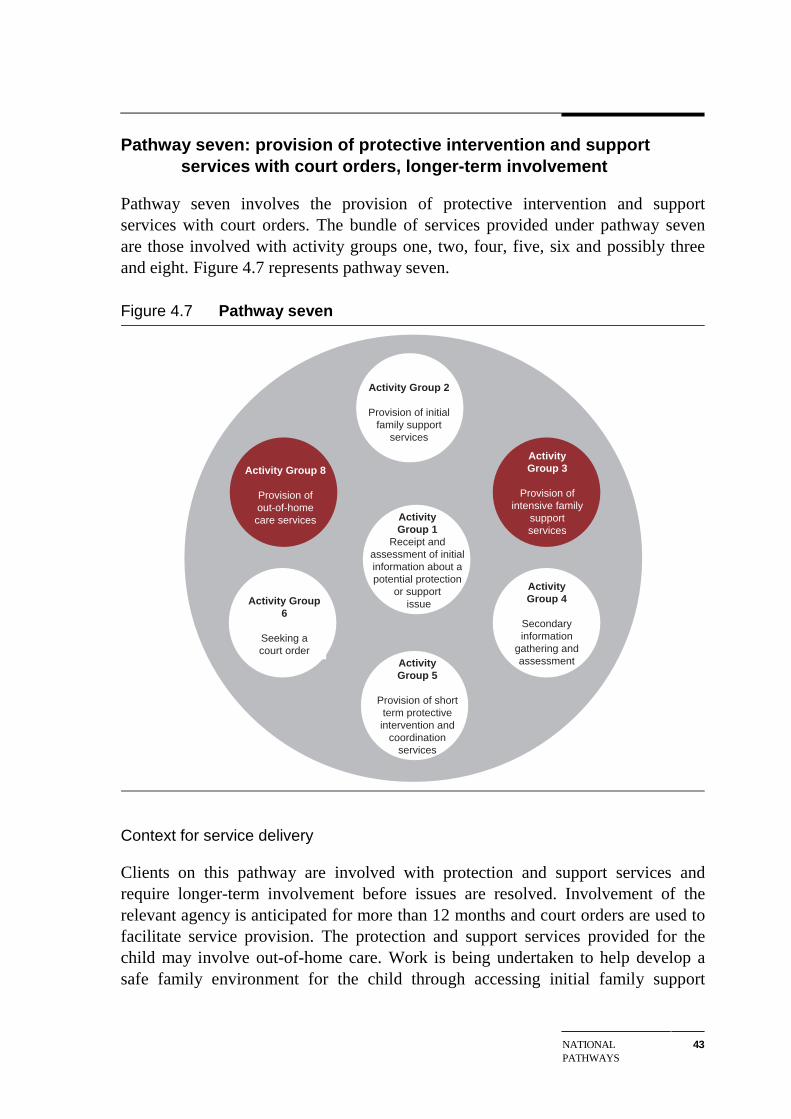
The pathways project developed a set of eight national pathways that are a highlevel depiction of services that a ‘representative’ protection and support client couldreceive in any jurisdiction in Australia (see chapter 4). The broad range of servicesprovided to protection and support clients were formed into eight broad groups,called ‘activity groups’. Each activity group represents a different bundle ofservices. For example, all services that take place as part of seeking a court orderare incorporated into a stand-alone activity group. The activity groups are:
EXECUTIVESUMMARY
XV
1. receipt and assessment of initial information about a potential protection orsupport issue;
2. provision of initial family support services;
3. provision of intensive family support services;
4. secondary information gathering and assessment;
5. provision of short-term protective intervention and coordination services;
6. seeking a court order;
7. provision of longer-term protective intervention, support and coordinationservices; and
8. provision of out-of-home care services.
The activity groups act as the ‘building blocks’ for the pathways. Each pathwayincorporates a unique combination of activity groups and reflects a combination ofservices that are commonly provided to protection and support clients. The shortestpathway has only one activity group, while the longest pathway includes seven ofthe eight activity groups. Some pathways include services that are ‘optional’.
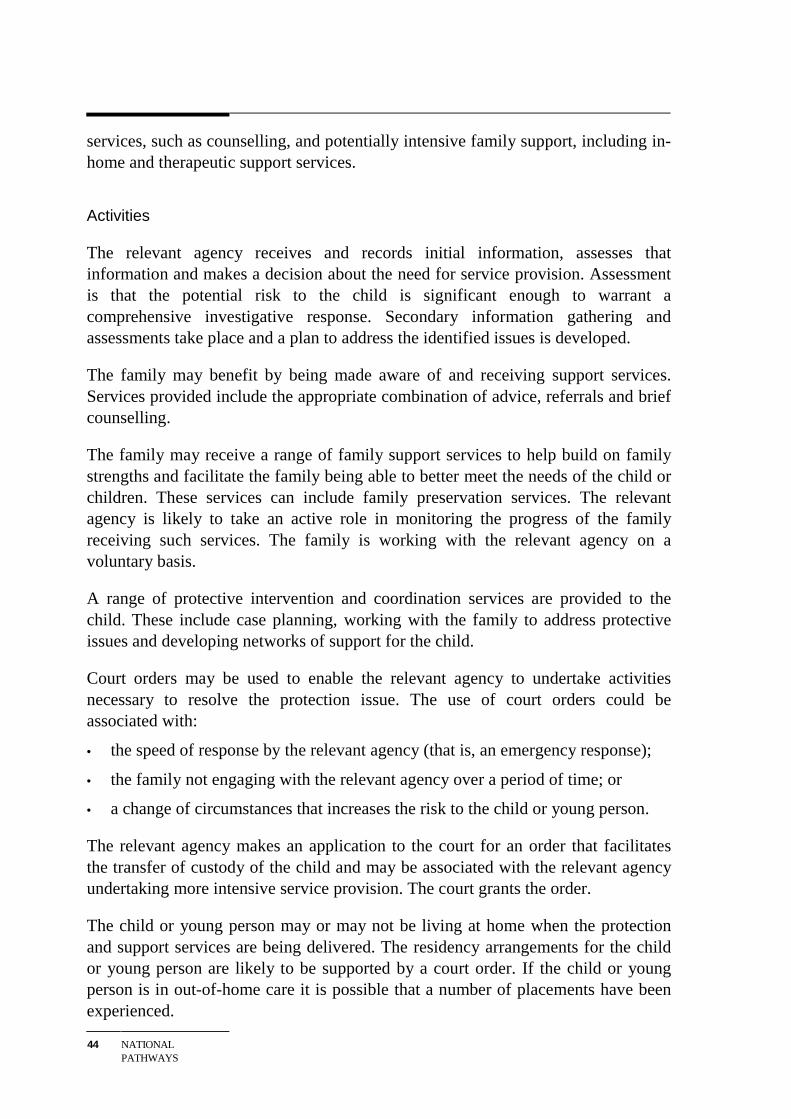
Table 1 summarises the relationship between the activity groups and eightpathways. It indicates where activity groups are included and excluded within apathway, and instances where an activity group may, but is not always, included ona pathway.
The pathways were developed to reflect current protection and support practice inthe jurisdictions. However, it is important to recognise that the pathways are ahypothetical construct, as the actual bundle of services provided to any individualchild and his or her family will be determined by the needs of the child at aparticular point in time, consistent with the legislation and practice of thejurisdiction.
The pathway efficiency measures represent the average cost to government ofproviding a ‘representative’ client with the services included in each of the activitygroups that form a particular pathway in a financial year. Within the limitations ofthe method and the data, a higher pathway cost means that a jurisdiction is utilisingrelatively more resources to deliver a similar bundle of services than anotherjurisdiction. This may represent relatively inefficient use of resources or higherquality/intensity in service provision.
XVI EXECUTIVESUMMARY
Table 1 Relationship between activity groups and the national pathways
Pathways Activity Groups
1 2 3 4 5 6 7 8
1 Receipt and assessment ofinitial information
✓ ✗ ✗ ✗ ✗ ✗ ✗ ✗
2 Provision of initial familysupport services
✓ ✓ ✗ ✗ ✗ ✗ ✗ ✗
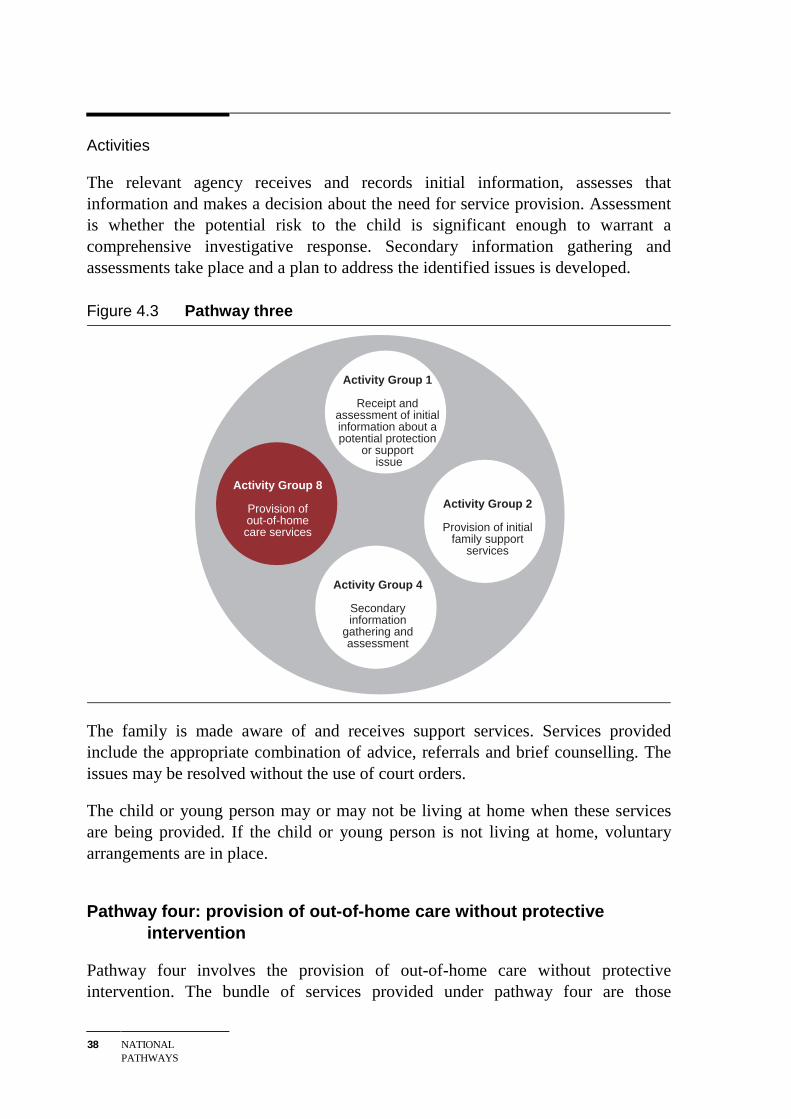
3 Secondary informationgathering and assessment ofcircumstances with provision offamily support services
✓ ✓ ✗ ✓ ✗ ✗ ✗ �
4 Provision of out-of-home carewithout protective intervention
✓ � ✗ ✗ ✗ ✗ ✗ ✓
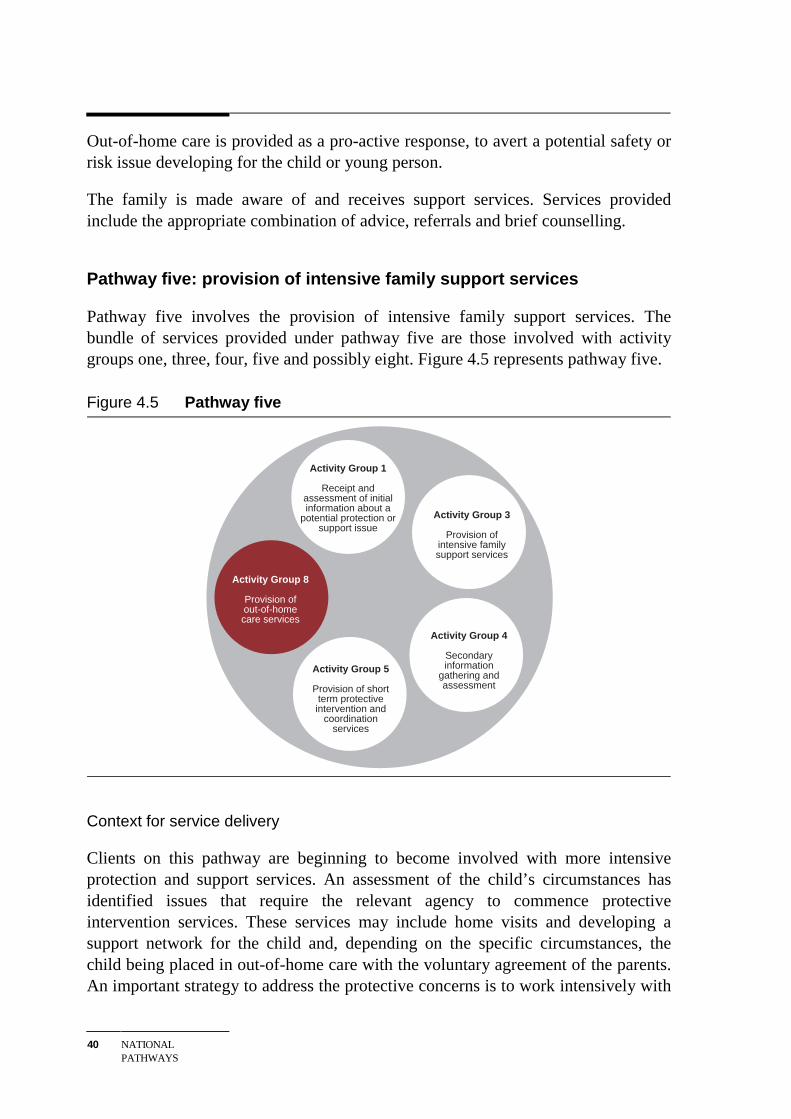
5 Provision of intensive familysupport services
✓ ✗ ✓ ✓ ✓ ✗ ✗ �
6 Provision of protectiveintervention and supportservices without court orders
✓ ✓ ✗ ✓ ✓ ✗ ✗ �
7 Provision of protectiveintervention and supportservices with court orders
✓ ✓ � ✓ ✓ ✓ ✗ �
8 Provision of protection andsupport services with courtorders, continuing involvementwith less service provision
✓ ✓ ✗ ✓ ✓ ✓ ✓ ✓
Note: ✓ indicates that the activity group is part of the pathway, ✗ indicates that the activity group is not part ofthe pathway, � indicates that the activity group may be part of the pathway.
Source: Chapter 4.
Method to calculate pathway efficiency measures
The activity groups on each pathway form the basis on which the pathwayefficiency measures are calculated. As noted above, the calculation of the pathwayefficiency measures uses a ‘top-down’ ABC approach to allocate governmentexpenditure on protection and support services to activity groups, which in turnform the pathways (see chapter 5).
The top-down approach is particularly suitable for government agencies as it startsby identifying total expenditure, which is available from budget information. Itfacilitates the provision of timely financial information that should not place anundue compliance burden on reporting jurisdictions, allows the information to bevalidated against reported budget information, and ensures that total expenditure onprotection and support activities is incorporated into the calculation of efficiencymeasures. The ABC approach is used to allocate total expenditure to pathways costs
EXECUTIVESUMMARY
XVII
in a way that links actual expenditure on the delivery of particular services topathways.
The calculation of the pathway efficiency measures requires a measure of thenumber of services provided over a year for each activity group. The servicedelivery measures represent a proxy for the protection and support outputs providedby each jurisdiction. Thus, the nature of the calculated efficiency measure is per unitof service measure. This approach assumes that each client receives the sameaverage level of service for each activity group on the pathway. The existingAustralian Institute of Health and Welfare protection and support data collectionformed the basis for developing the service measures in the pathways model.
Using the top-down ABC approach, the calculated expenditure on each pathwayrelates inputs (expenditure) to outputs (as defined by a set of service measures) andthus can be taken as a measure of efficiency.
Testing the method
In the course of the project, the method was tested by collecting trial data requiredto calculate pathway efficiency measures from each jurisdiction. This exercisedemonstrated differences in the capacity of jurisdiction information systems toprovide the necessary data (see chapter 6). In some cases the data were not able tobe readily collected or collated in the course of this project, but were expected to beavailable in future years. However, in some cases jurisdictions would need tocommence collecting the required data.
Testing the method also identified a number of issues that affect the comparabilityof measures across jurisdictions. As noted above, many issues related to thenon-availability of data. Other issues impacting on comparability of efficiencymeasures across jurisdictions included the introduction of measures not previouslyincluded in national reporting and non-principal agencies providing protection andsupport services.
The wide variation in trial results reinforces the limitations of the trial data and alsopoints to the need for on-going refinement of the model, including jurisdictions’approach to implementation (see future directions below). However, the test diddemonstrate the ability of jurisdictions to apply the method. The testing phase of thepathways efficiency model demonstrated that, subject to addressing the identifiedlimitations, the model can be used to calculate comparable, protection and supportservice efficiency measures for the purpose of national reporting.
XVIII EXECUTIVESUMMARY
In addition to national reporting purposes, the pathways efficiency model providesdetailed information that will be useful to individual jurisdictions as they managebudgets and develop policy and programs. States and Territories expressed a stronginterest in being able to document and analyse the costs associated with alternativeapproaches to protection and support service delivery. The pathways approachallows jurisdictions to compare the costs associated with, for example, a child that isprovided with protective support services and family support services and then exitsthe system, to the costs of a child involved in the ‘hard end’ statutory processesincluding court and out-of-home care; that is, to quantify cost saving associatedwith successful early intervention strategies. The approach also enables jurisdictionsto better understand cost differences associated with the varying levels of intensityof child protection services; for example, short-term versus long-term provision ofprotection and support services and child protection with and without out-of-homecare.
Future directions
The national reporting of protection and support efficiency measures takes placewithin the context of changes at the State, Territory and national level. Upgradesand enhancements to jurisdiction financial and client information infrastructure,refining of counting rules used by jurisdictions to compile data, and the potentialalignment of existing national data collection of protection and support clientinformation with the information required to calculate pathway costs, will allcontribute to improved reporting (see chapter 8). There may also be futureopportunities to develop the pathways model to better capture the experience ofprotection and support service clients. Ultimately the model could reflect a life-cycle approach where clients have multiple and differing interactions withprotection and support services over time, rather than an episodic approach impliedin the current construction of the pathways efficiency model.
Undoubtedly, unanticipated changes in the external environment will take place andimpact on the future development of the pathway efficiency model. The modelprovides the basis from which the Working Group can continue its work ofdeveloping and refining the nationally reported protection and support efficiencymeasures, both independent of, and in response to such changes.
P A R T A
INTRODUCTION
BACKGROUND TOTHE PROJECT
1
1 Background to the project
This report is the outcome of a cooperative effort between the States and Territoriesthat participate in the Review of Commonwealth/State Service provision (theReview). An important role of the Review is the ongoing development andreporting of comparable performance information in the annual Report onGovernment Services.
Information to enable sophisticated comparisons across jurisdictions of the costsassociated with delivering child protection and support services has been limited inthe past. This has limited the ability of the Review to report on efficiencyperformance indicators. The Review’s Protection and Support Services WorkingGroup (the Working Group) agreed on the need to develop efficiency indicatorswhich would allow improved reporting and that would reflect current servicedelivery models and practice.
In April 2002, the Review commissioned The Allen Consulting Group to develop amethod for the calculation of comparable cost measures for alternative protectionand support pathways. The project was jointly funded by the States and Territoriesand was coordinated by a Steering Group comprising Secretariat and WorkingGroup representatives.
The study received ongoing input from jurisdictions via the Working Group, whichcomprises representatives from the State and Territory community servicesdepartments. The Australian Institute of Health and Welfare (AIHW) also providedvaluable input through its observer status on this working group.
1.1 Report on Government Services
The Council of Australian Governments established the Review to provideinformation on the effectiveness and efficiency of Commonwealth, State andTerritory government services. A Steering Committee, chaired by the Chairman ofthe Productivity Commission and comprising senior representatives from the centralagencies of Commonwealth, State and Territory governments, oversees the Reviewwith the assistance of a Secretariat provided by the Productivity Commission.
2 BACKGROUND TOTHE PROJECT
The Review develops and publishes an annual Report on Government Services,which reports a set of performance indicators for a number of government services,including child protection and support services. The focus of the Report onGovernment Services is on provision of performance information for individualservices which permits comparisons of performance across jurisdictions.Performance for each area is measured using two broad categories of indicators:
• effectiveness — how well the outputs of a service achieve the stated objectives;and
• efficiency — how well governments use their resources to produce units ofservices.
The Report on Government Services is available electronically from the Review’swebsite (www.pc.gov.au/gsp/index.html).
Protection and Support Services Working Group
There is a working group advising the Steering Committee for each service areacovered by the Report on Government Services. The role of these working groupsinclude:
• suggesting the boundary of the services for the purposes of this exercise andprovide comments on boundary issues;
• developing agreed indicators of performance for the services within theframework;
• developing an agreed set of definitions for variables which make up theindicators; and
• identifying appropriate data sources and where appropriate initiate and manage adata collection system.
The Protection and Support Services Working Group comprises representativesfrom the State and Territory agencies responsible for administering child protectionlegislation and policies and delivering services and includes representatives from:
• Commonwealth Department of Family and Community Services;
• NSW Department of Community Services;
• Victorian Department of Human Services;
• Queensland Department of Families;
• Western Australian Department of Family and Children’s Services;
• South Australian Department of Human Services — Family and Youth Services;
BACKGROUND TOTHE PROJECT
3
• Tasmanian Department of Health and Human Services;
• The ACT Department of Education, Youth and Family Services; and
• The NT Department of Health and Community Services.
The group is chaired by a member of the Steering Committee (drawn from theWestern Australian Department of the Premier and Cabinet) and supported by aSecretariat representative from the Productivity Commission. The AIHW is alsorepresented on the group, as a data specialist.
1.2 Reporting on protection and support services
Trends toward a holistic approach to child protection
According to practitioners in the area, child protection services in the 1990s inAustralia faced increasing numbers of reports of suspected child abuse, neglect ormaltreatment in an environment that demanded greater effectiveness and efficiency.Concurrently, as Tomison and Poole (2000) note:
… a substantial proportion of the child maltreatment reports (notifications) wereinappropriately labelled as allegations of child maltreatment by those who referredcases to child protection services. Many of the notifications involved families who hadnot maltreated their child but who had more generic problems, such as financial orhousing difficulties, an incapacitated caregiver, or serious stress problems. Althoughsuch ‘at risk’ cases may require assistance, they do not require child protectionintervention. (p. 19)
Given these factors, governments began to re-examine the way in which they bothconceptualised and delivered services to avoid spreading scarce protection andsupport resources across all child protection cases rather than targeting casesspecifically requiring the involvement of child protection services.
In a report commissioned by the United Kingdom Department of Health (1995), theDartington Social Research Unit offered some insight into this shift of emphasis.The report suggested that in order for child protection agencies to become moreeffective and efficient they needed to utilise a framework that views child protectionas part of a continuum of possible responses. As such, the report holds that there is aneed to adopt a more holistic approach to service delivery, re-balancing theprovision of child protection and family support such that child protection no longerdrives the system but becomes merely one important facet in an overall welfareassessment.
4 BACKGROUND TOTHE PROJECT
This is mirrored in Tomison and Poole’s work (2000), which identifies three majorchanges in recent years to the protection and support systems in Australia:
• a shift away from narrowly defined investigative approaches toward a broader,multi-faceted assessment of the child and family (including, for example, theirwider needs, strengths and resources, and their relationships with both formaland informal support services and networks);
• development and adoption of structured risk assessment protocols and measures,to more effectively screen child protection reports; and
• development of strategies for more efficiently tailored responses to childmaltreatment reports (for example, differentiated response systems, or thestreaming of reports based on an initial assessment).
The implication of these reforms is that children requiring protection and supportcan move along and/or between a range of different ‘pathways’ through the systemto ensure that their needs are being met and thus better outcomes ensue. It is alsoimportant to note that clients can also re-enter the service system (box 1.1).
Efficiency indicators
Existing efficiency indicators
The protection and support services chapter of the Report on Government Servicesreported expenditure-based efficiency data for protection and support services forthe first time in the 2000 Report. Previously, this sort of data had only beenprovided as contextual background information.
The data reported were limited in that they related total government expenditure tothe number of children in the population. Specifically, they did not allow for anexamination of the various pathways through the protection and support systemdiscussed above or an examination of financially based indicators of efficiency.
The ‘pathways’ approach
This project has developed a national framework of efficiency indicators forprotection and support services that is intended to address the limitations of thecurrent indicators. The framework is a set of eight protection and support‘pathways’. These pathways are different combinations of services that a protectionand support client in any jurisdiction in Australia might receive (chapter 4 providesa detailed discussion of the pathways).
BACKGROUND TOTHE PROJECT
5
Box 1.1 Examples of alternate child protection and support pathwaysin the Victorian system
As an example of the possible pathways that can exist, children and young peoplenotified to the Victorian Department of Human Service’s (DHS) child protection servicemay follow one of four pathways:
1. Assessed at the point of notification as having wider family and/or social needs butnot requiring intensive support or statutory intervention. Referred to appropriatefamily support service, counselling service or other secondary service.
2. Assessed at notification or following investigation as requiring intensive support toprevent risk of significant harm. Referred to intensive family support service andother secondary services, possibly including intensive case management. May becase managed by DHS’s child protection service for up to three months to ensureengagement with appropriate services.
3. Determined by the court to be in need of protection and made the subject of asupervision order, possibly preceded by an interim protection order. Intensive casemanagement in addition to specific support, rehabilitation and other services may berequired, some on an involuntary basis.
4. Removed from original carers by court order. Alternate care arrangements as wellas case management, rehabilitation, family reunification services may be required.Long-term shared care or long-term support to parents may be required. Permanentseparation from parents may result.
One pathway or a combination of pathways may be necessary to successfully meet theneeds of an individual client.
Source: Victorian Department of Human Services (unpublished).
A method was developed to estimate expenditure allocated to the services in each ofthe eight pathways. The pathways expenditure for each jurisdiction are the pathwayefficiency indicators. The calculated pathway efficiency indicator represents theaverage cost to government of providing a ‘representative’ client with the bundle ofservices defined by that pathway in a financial year. Each representative client isassumed to receive the same average level of service for each activity in thepathway. In comparison to the efficiency indicators reported in the Report onGovernment Services 2003, the project efficiency framework:
• improves the level of data comparability across jurisdictions. This is because thepathways were developed by focussing on the strong similarities in the activitiesundertaken by jurisdictions to provide protection and support services, ratherthan the differences in legislation and policies;
• provides more meaningful indicators due to the unambiguous links betweenservices provided to clients and the measured expenditure on a pathway. This
6 BACKGROUND TOTHE PROJECT
link is underpinned through the use of a set of ‘activity groups’ that form thebuilding blocks of the pathways; and
• is more comprehensive in the coverage of child protection and support activitiesthat are undertaken by jurisdictions. In particular, the pathways include familysupport services, along with already reported child protection and out-of-homecare services. The inclusion of family support services reflects a shift away froman over-emphasis on a forensic approach to a family support approach inprotection and support agencies across Australia (Tomison and Poole 2000 p. 1).The inclusion should also allow jurisdictions to assess the varying costs ofdifferential responses to families.
1.3 Project overview
Project objective
The project objective was to develop a method for reporting comparable efficiencyindicators for child protection and support pathways that can be applied across allAustralian jurisdictions. In specifying the project, the Working Group agreed that itshould:
• meet the Review’s requirements to report efficiency data for child protection andout-of-home care services;
• provide a method which is meaningful to the policy and decision making ofparticipating jurisdictions;
• facilitate the reporting of comparable and meaningful data; and
• enable all jurisdictions to report annually.
Project scope
The project scope includes all government funded and/or provided protection andsupport services as defined in the protection and support chapter of the Report onGovernment Services. This specifically includes:
• child protection services: the functions of government that receive and assessallegations of child abuse and neglect or harm to children or young people,provide and refer clients to family support and other relevant services, and thatintervene to protect children; and
• out-of-home care services: care for children placed away from their parents forprotective or other family welfare reasons.
BACKGROUND TOTHE PROJECT
7
The scope of the project also included some preventative services (such as initialand intensive family support services), that were not reported in the protection andsupport chapter of the 2003 and earlier Reports on Government Services.
The scope of the project excludes the supported accommodation and assistanceservices that are also reported in the protection and support chapter of the Report onGovernment Services.
Although the Report on Government Services performance framework viewseffectiveness and efficiency indicators as complementary (see section 1.1), thefocus of the project was exclusively on efficiency indicators. Thus, the efficiencyindicators developed in this report do not take account of the outcomes achieved forchildren, their families and the community. Efficiency indicators provide only partof the information required by policy makers and the community to drawmeaningful conclusions about protection and placement service delivery over timeor across jurisdictions.
Project structure
The project was conducted in two stages:
• stage one identified and documented the existing child protection pathways ineach jurisdiction. This information was used to develop a set of nationalpathways that can be mapped across all jurisdictions. The final task in this stagewas to develop a model for reporting comparable cost data for each of thenational pathways; and
• stage two focused on implementing the model developed in stage one. Itinvolved a high-level assessment of the capabilities and limitations of existingdata and information systems, the development of a method for collecting thenecessary financial and service delivery data for each identified pathway, and avalidation of the method using pilot data from jurisdictions.
The project was undertaken between April 2002 and January 2003. The purpose ofthis report is to record both the process and outcomes of the project.
Implementation of the method
The model and the method of implementing the model described in this report havebeen endorsed by jurisdictions through the Working Group members. The decisionon whether to adopt the model for the Report on Government Services ultimatelyrests with the Steering Committee.
8 BACKGROUND TOTHE PROJECT
1.4 Structure of the report
The report comprises five sections:
• Part A Introduction — This section presents the project context. Chapter 1provides an overview of the background and objectives of the project. Chapter 2describes in detail the method used to conduct this project;
• Part B Protection and support activities — This section details the method ofdeveloping a set of nationally comparable child protection and support pathwaysthat were endorsed by all jurisdictions as part of the project. Chapter 3 sets out ata high level the structural and legislative arrangements that govern the deliveryof protection and support services in each jurisdiction and describes the contextin which child protection and support services occur. Chapter 4 describes thecriteria used to establish the national pathways, sets out the activity groups thatunderpin the national pathways and defines the endorsed national pathways.
• Part C National Reporting Method — This section presents the nationalreporting method that was endorsed by all jurisdictions as part of the project anddiscusses issues around the data required to implement the method. Chapter 5describes the model for reporting comparable cost data for the endorsed nationalpathways and the scope and process of the data collection necessary to calculatethe pathway costs. Chapter 6 sets out data availability, comparability andinterpretation issues.
• Part D Implementation issues — This section discusses issues that arose in thecourse of validating the model. Chapter 7 presents selected results obtained fromthe validation phase of the model. Chapter 8 discusses future directions in thedevelopment of the efficiency indicators for protection and support services.
• Part E Appendices — This section presents supporting information. AttachmentA identifies the people in each jurisdiction who took part in the project byattending meetings, teleconferences and providing information. Attachment Bprovides detail on the financial information collection process.
PROJECT METHOD 9
2 Project method
As outlined in chapter 1, the project was planned and undertaken in two stages.Stage one of the project was undertaken between April and August 2002, with stagetwo completed between August 2002 and January 2003.
This chapter describes the method undertaken in completing each stage. Section 2.1describes the method used in stage one to develop the conceptual framework andthe model to derive the efficiency indicators. Section 2.2 describes the method usedin stage two to further develop the model, assess implementation issues, and test themodel using jurisdictions’ data.
2.1 Stage one: developing the conceptual framework
Stage one objectives
The project objective for stage one was:
The identification and documentation of child protection pathways currently in place ineach jurisdiction as well as the development of a model for reporting comparable costdata for a core set of pathways that can be mapped across all jurisdictions. (SCRCSSP2002c, p. 18).
Mapping the pathways
Meetings were conducted in each jurisdiction with people who had policy andpractical experience in protection and support services to allow the jurisdiction’sprotection and support pathways to be mapped. The meetings were extremelyvaluable in understanding the scope of the services delivered and to gain anunderstanding of each jurisdiction’s practice frameworks and philosophies.Information from meetings was supplemented with written information provided bymost jurisdictions or obtained from their websites.
10 PROJECT METHOD
A draft set of protection and support pathways was provided to each jurisdiction.The pathways were described in a three-part framework:
1. child protection activities: described the groups of activities from the time therelevant agency is alerted to a potential client (that is, a child potentially in needof protection and or support services) through the various pathways that a clientmight experience. This was based on a framework developed by the AustralianInstitute of Health and Welfare (AIHW) to facilitate national comparisons in thedelivery of child protection services (AIHW 1999, p. 40);
2. out-of-home care: described the range of out-of-home care options available injurisdictions and considered some of the different characteristics associated withthe particular types of care; and
3. family support services: described the scope of family support services thatclients who are in contact with child protection services may access. Thisapproach adopted the child protection client as a point of reference for relevantfamily support services.
Jurisdictions provided comments on their draft pathways and once all amendmentshad been incorporated, these pathways were endorsed by the project owner in eachjurisdiction. This endorsement was a formal acknowledgment that the pathwaysprovided a high-level representation of the protection and support pathwaysoperating in the particular jurisdiction and that the pathways would be included in apaper for circulation to all jurisdictions.
As part of stage one, the set of jurisdiction pathways was compiled into onedocument and distributed to jurisdictions (ACG 2002c).
The individual jurisdiction pathways formed the basis of the national pathways. Thenational pathways had to adequately capture, at a high level, the activitiesundertaken by jurisdictions and then develop separate pathways to reflect theservices typically provided to clients.
In determining which elements of service delivery to include in the agreed nationalpathways, three key criteria were used (see chapter 4). These were:
• the prevalence of a pathway across jurisdictions — a pathway had to exist in atleast four jurisdictions to be included;
• the demand on a pathway, with low demand pathways being excluded: and
• the pathways in combination had to broadly reflect the scope of servicesprovided by jurisdictions.
The outcome of the process was the identification of a set of eight proposed nationalprotection and support pathways. The pathways represented various bundles of
PROJECT METHOD 11
services that a client might receive — from least intrusive to most intensive. TheWorking Group and other jurisdictional representatives considered the revisedpathways at a workshop (discussed below).
Costing the pathways
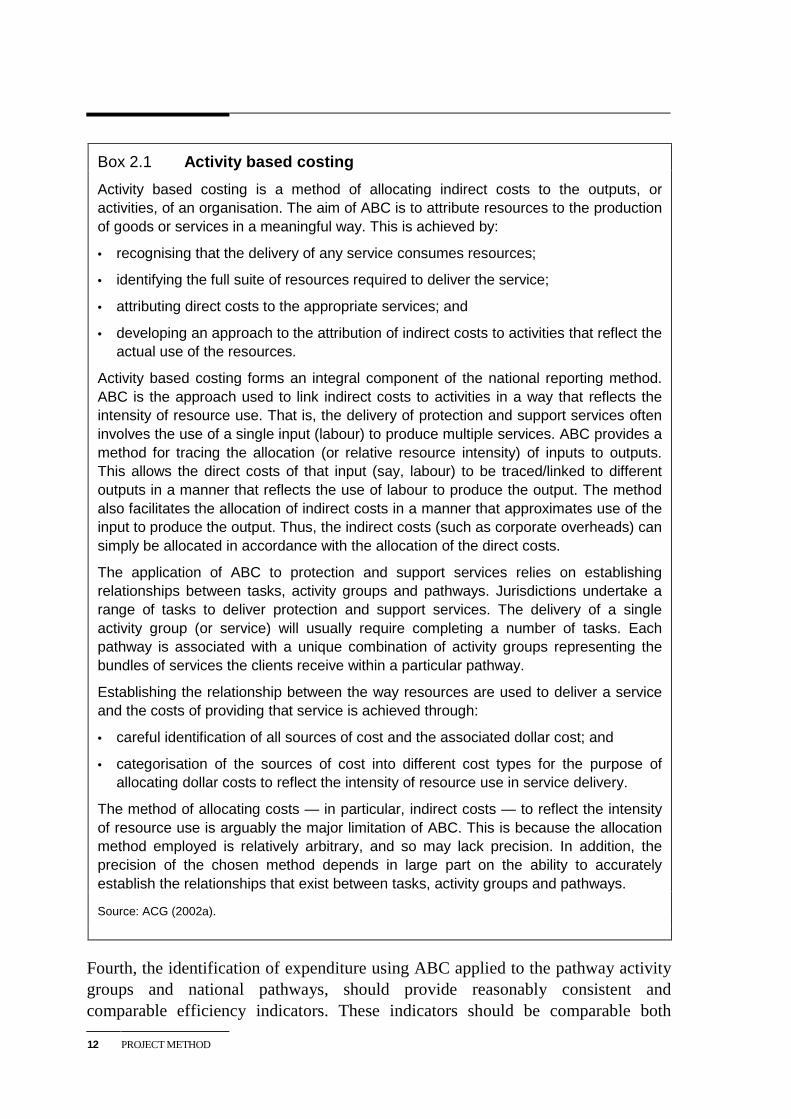
In addition to the mapping exercise described above, a model was developed toestimate cost data for each of the agreed national protection and support pathways.The model used activity based costing (ABC) (box 2.1).
Activity based costing strengths
There were a number of reasons why ABC was chosen as the method of estimatingthe costs associated with protection and support pathways across jurisdictions.
First, a key strength of ABC is its ability to provide meaningful cost allocationswhen a single input is used to produce multiple services (or outputs). The deliveryof protection and support services often uses a single input of labour to producemultiple services. For example, an individual family support or child protectionworker would typically be involved in providing a wide range of protection andsupport services.
Second, ABC can reflect the relationship that exists between the way resources areused to deliver a service and the costs of providing that service. This is achievedthrough the careful identification of all sources of cost and the associated dollarcost, and the categorisation of the sources of cost into different cost types which areused to allocate dollar costs in a manner that reflects the intensity with whichresources are used to deliver a service. This disaggregated approach to costallocation by the ABC method can accommodate different rates of usage of thesame resource across activities. This is achieved by identifying how labour, themost significant input, is allocated across different tasks and activities to deliverprotection and support services. ABC provides a method to capture thesedifferences in resource intensity in the allocation of expenditure across differentactivities. ABC can accommodate the varying relationships between the size of acost and the number of services provided.
Third, the application of the method does not require that jurisdictions necessarilycollect financial information in a way that mirrors the pathway activity groups orthe national pathways. Given the differences in approach to financial informationcollection across jurisdictions, this is a valuable feature of the approach.
12 PROJECT METHOD
Box 2.1 Activity based costing
Activity based costing is a method of allocating indirect costs to the outputs, oractivities, of an organisation. The aim of ABC is to attribute resources to the productionof goods or services in a meaningful way. This is achieved by:
• recognising that the delivery of any service consumes resources;
• identifying the full suite of resources required to deliver the service;
• attributing direct costs to the appropriate services; and
• developing an approach to the attribution of indirect costs to activities that reflect theactual use of the resources.
Activity based costing forms an integral component of the national reporting method.ABC is the approach used to link indirect costs to activities in a way that reflects theintensity of resource use. That is, the delivery of protection and support services ofteninvolves the use of a single input (labour) to produce multiple services. ABC provides amethod for tracing the allocation (or relative resource intensity) of inputs to outputs.This allows the direct costs of that input (say, labour) to be traced/linked to differentoutputs in a manner that reflects the use of labour to produce the output. The methodalso facilitates the allocation of indirect costs in a manner that approximates use of theinput to produce the output. Thus, the indirect costs (such as corporate overheads) cansimply be allocated in accordance with the allocation of the direct costs.
The application of ABC to protection and support services relies on establishingrelationships between tasks, activity groups and pathways. Jurisdictions undertake arange of tasks to deliver protection and support services. The delivery of a singleactivity group (or service) will usually require completing a number of tasks. Eachpathway is associated with a unique combination of activity groups representing thebundles of services the clients receive within a particular pathway.
Establishing the relationship between the way resources are used to deliver a serviceand the costs of providing that service is achieved through:
• careful identification of all sources of cost and the associated dollar cost; and
• categorisation of the sources of cost into different cost types for the purpose ofallocating dollar costs to reflect the intensity of resource use in service delivery.
The method of allocating costs — in particular, indirect costs — to reflect the intensityof resource use is arguably the major limitation of ABC. This is because the allocationmethod employed is relatively arbitrary, and so may lack precision. In addition, theprecision of the chosen method depends in large part on the ability to accuratelyestablish the relationships that exist between tasks, activity groups and pathways.
Source: ACG (2002a).
Fourth, the identification of expenditure using ABC applied to the pathway activitygroups and national pathways, should provide reasonably consistent andcomparable efficiency indicators. These indicators should be comparable both
PROJECT METHOD 13
across and within jurisdictions over time. The level of accuracy achieved isdependent on the rigour employed by jurisdictions in estimating the informationused to allocate indirect costs to activities.
Fifth, the information generated through ABC can describe how resources are usedto deliver the bundles of services represented in each activity group. Theinformation is useful in clarifying the resource requirements of specific services,and, hence, in understanding how changing demands on the protection and supportsystem impact on resource requirements. Such information is useful to jurisdictionsas they review varying approaches to service delivery and make decisions about themost appropriate way to allocate resources between activities. The information canprovide a valuable management tool for government departments responsible forprotection and support services as they track how resources are allocated acrossactivity groups. Over time, the information generated by ABC can show how suchresource allocations change between activity groups. This is useful in terms ofmonitoring and evaluating internal performance and for aligning resources withneeds. It also provides an increased ability to learn from approaches used or tried byother jurisdictions.
The information is also useful for central government departments (that is, treasuryand finance departments) as they decide how to allocate resources across alldepartments within a jurisdiction. For example, anecdotally, jurisdictions reportedan increase in resources required for court processes and implementation of courtorders. The application of ABC can provide an estimate of the expenditure requiredto undertake this work. Thus, if the number of court orders sought by a relevantagency increases over time, ABC provides the information necessary to estimate theadditional expenditure that is needed to undertake this particular activity.
Finally, the use of ABC should result in efficiency indicators for protection andsupport services that better link inputs to outputs and hence make the indicatorsmore meaningful for the purpose of national reporting. As noted in chapter one,efficiency is a reflection of how well governments use their resources to produceunits of services. Thus, improved indicators will promote increased understandingwithin government and in the community more broadly about the efficiency withwhich protection and support resources are being used. Improving efficiencyindicators through the use of ABC is consistent with the overall objectives of theReport on Government Services. The improved efficiency indicators should alsocontribute to the higher-level objectives of the Report on Government Services,which the Chairman of the Steering Committee identified as:
… the ability to develop better policies and achieve better outcomes for the community.(Banks 2002, p.16).
14 PROJECT METHOD
Activity based costing issues
The Working Group identified four key issues regarding the ABC method. First, theABC approach relies on the use of historical information — that is, financial andclient information from the previous financial year. Although the use of historicalinformation is consistent with the current approach adopted in the Report onGovernment Services and is reasonable in a stable environment, more up-to-dateinformation would be beneficial if the indicators were to be used for internalmanagement purposes.
Second, there may be some differences in allocation decisions across jurisdictionsdue to the differing ability of financial and client information systems to support theinformation requirements of the method. While this impacts on the accuracy of costallocations to activity groups, and hence pathway costs, all costs will still beincorporated, and information systems are likely to be upgraded over time allowingfor improved accuracy of cost allocations (see chapter 8).
Third, the general approaches used to allocate indirect costs to activities relies onthe use of a cost driver — that is, a factor that has a significant impact on the overallcost of delivering a service. The cost driver is important as it is used to link theindirect costs to activity groups and should do so in a manner that results inexpenditure being allocated to reflect resource consumption in service provision. Apotential limitation of ABC is that more than one cost driver may be consideredsuitable for the purpose of allocating indirect costs. Three cost drivers wereconsidered in the course of this project: the largest single expense category;employee numbers; and total expenditure. (Indirect costs were allocated inaccordance with the single largest expenditure category — labour costs associatedwith direct service provision to clients.)
Fourth, having established labour as the cost driver for use in the allocation ofindirect costs, it is necessary to collect information on that cost driver. Variousapproaches may be employed to collect information on labour: estimation; proxies(such as rosters or timetables); timesheets; surveys; and retrospective allocation. Ahigh level of accuracy is desirable as it supports more robust allocation of indirectcost to pathways. However, a higher degree of accuracy is usually associated with ahigher resource cost to jurisdictions. (The retrospective allocation approach wasused as it provides a reasonable balance between generating data that are objective,consistent and accurate in a simple and low cost manner.)
PROJECT METHOD 15
Stage one workshop
The set of jurisdiction pathways formed the basis upon which the national pathwayswere developed. The revised national pathways, and the activity groups on whichthey were based, were discussed at a workshop in mid-August. Minor amendmentswere made to some activity groups and pathways at the workshop, to better reflectthe nature of tasks undertaken by jurisdictions in delivering protection and supportservices. Subject to these changes, the Working Group endorsed the set of nationalpathways at the workshop (see chapter 4). These pathways provide the basis for thenational reporting framework for comparable efficiency indicators.
The workshop also considered the model to estimate cost data. To facilitatediscussion at the workshop, the Working Group was provided with a paper thatoutlined the cost model and proposed approach to implementation; in particular thecollection and application of the cost data for the agreed national protection andsupport pathways (ACG 2002a). The Working Group used the workshop to discussthese issues and to identify possible approaches to address them. The proposedapproach to stage two of the project was endorsed, noting:
• the need to resolve specific implementation issues, including the definition offamily support services (that is, establishing the scope of those services);
• the need to consider any discrepancies between allocation of funds and actualexpenditure of funds;
• some jurisdictions already utilise cost allocation processes — for example,Queensland uses activity based costing;
• jurisdictions are capable of making data available;
• the costing framework presented is still ‘work-in-progress’ and the way forwardis an iterative process;
• adoption of the resulting efficiency indicators will be determined by the SteeringCommittee on the advice of the Working Group; and
• overall, the project should prove to be a very worthwhile exercise, particularly ifthe profile of the sector is increased.
Following the endorsement at the workshop of the national pathways and theproposed approach to stage two, a final report was developed which incorporatedfeedback provided at the workshop (ACG 2002b).
16 PROJECT METHOD
2.2 Stage two: implementing the framework
Stage two objectives
The project objective for stage two was:
A high-level assessment of the capabilities and limitations of existing data andinformation systems, and the development of a methodology to avail the collection ofthe minimum range of cost data for each identified pathway. (SCRCSSP 2002c, p. 18)
With this objective in mind, the overarching aim of stage two was to develop amethod for generating comparable efficiency indicators for protection and supportactivities and to validate that model using 2001-02 data. Three key stages wereinvolved in achieving this aim:
• proposing an approach to the collection of the cost data for the agreed nationalprotection and support pathways;
• identifying issues for data comparability across jurisdictions; and
• conducting a high-level assessment of the capabilities of existing data andinformation systems to provide relevant cost data and noting potential futuredirections in the development of data systems.
Stage two of the project began with a teleconference with the Working Group todiscuss the processes and objectives of stage two. Subsequently, a document titledGuide for Stage Two (ACG 2002d) was developed and distributed to the WorkingGroup to outline the approach that would be used to achieve the stage twooutcomes.
After establishing the processes and timing of stage two, approaches weredeveloped to collect the financial and service delivery information necessary tocalculate the relevant efficiency indicators.
Information collection
Financial information
The approach to collecting financial information was modelled on the currentapproach used to collect information for the Report on Government Services:
• a Microsoft Excel based survey instrument was developed to collect theinformation (ACG 2002e); and
PROJECT METHOD 17
• detailed instructions on how to complete the workbook surveys were distributed(ACG 2002f).
Jurisdictions were responsible for completing the financial information collectioninstrument with support from The Allen Consulting Group (ACG). Jurisdictionsnominated the type of support they required during this phase of the project —either face-to-face meetings and/or teleconferences.
The financial data required were largely available from budget and finance areas butinput was required from people with ‘on-ground’ experience to ensure that thescope of the financial information matched the scope of the child protection, out-of-home care and family support services. Thus meetings and/or teleconferencesinvolved people from various areas within relevant agencies.
A particularly important part of this phase of the project was establishing how thetime of employees delivering services to clients was allocated across the variousactivity groups. This is a critical piece of information in the cost allocation process.In some jurisdictions, an established source of information was available on whichto base estimates. Other jurisdictions used the expertise of people with a role inservice delivery to estimate how time was allocated across the eight activity groups.
Following distribution of the financial information survey, survey instructions andinitial meetings and/or teleconferences, ACG followed up with jurisdictions andprovided on-going support with the data collection process. Additional meetingsand teleconferences were held with some jurisdictions, and ongoing correspondenceoccurred with all participants.
The consultancy team reviewed the data provided by jurisdictions. The processinvolved clarifying and checking for consistency across jurisdictions and ensuringthat jurisdictions documented all assumptions made in collection and presentationof information. The model was then tested via the calculation of activity group costsand pathway costs. Following the data review process, the datasets were signed-offby the project owner in each jurisdiction prior to being returned for inclusion in thisfinal report. Further details on the nature of the financial information collected aspart of the national reporting method are presented in chapter 5.
Service delivery information
The pathway cost concept involves developing a measure of the services providedto a representative client for each of the activity groups in the national pathways.These measures represent a proxy for the outputs of protection and support services.
18 PROJECT METHOD
The process of developing the service delivery measures involved the circulation ofan initial paper to the Working Group that contained a proposed service deliverymeasure for each activity group. The AIHW provided assistance throughout theprocess of developing these measures. Through an iterative process, the measurespresented in chapter 5 were endorsed.
As with the financial information collection, a Microsoft Excel survey wasdeveloped and distributed to jurisdictions for completion (ACG 2002g). Where gapsexisted between the agreed measures and data already collected, requests for servicedelivery information were incorporated within the survey sent to jurisdictions.
The consultancy team reviewed the service delivery data provided by jurisdictions,and project owners in each jurisdiction signed-off. Further details on the collectionof service delivery information as part of the national reporting method arepresented in chapter 5.
Data comparability and interpretation issues
The identification and documentation of data comparability issues took placeconcurrently with the financial and service delivery information collections. Whenproviding information, jurisdictions were requested to document specific issuesrelating to definitions, approaches, information availability or counting rules thatwere likely to have impacted on data comparability across jurisdictions. Thisinformation was used to identify issues that should be considered when interpretingthe efficiency indicators produced by the proposed method. Data comparability andinterpretation issues are discussed in further detail in chapter 6.
Future data collection issues
The third major component of stage two was an assessment of future data collectionissues, particularly the capabilities of existing data and information systems toprovide relevant cost data. This assessment was included because the robustness ofthe reported efficiency indicators depends largely on the quality of data jurisdictionsare able to provide.
The quality of financial and service delivery data varied considerably acrossjurisdictions. A number of jurisdictions, however, identified projects or reviewsunderway that were expected to improve their financial and/or service deliveryinformation collections. Future data collection issues are discussed in greater detailin chapter 8.
PROJECT METHOD 19
Annual reporting methodology and project final report
Following the collection of financial and service delivery information fromjurisdictions, draft chapters 5, 6, 7 and 8 were circulated to the Working Group forcomment. These chapters present information on the national reporting method,data availability, comparability and interpretation, future directions and validatingthe model.
The draft chapters were formally presented to the Working Group in Melbourne on13 November 2002. Comments on the draft chapters were provided at thepresentation and in subsequent correspondence.
A complete version of the consultant’s final report was circulated to the WorkingGroup on 2 December 2002 with a request for sign-off by each jurisdiction by7 January 2003.
20 PROJECT METHOD
P A R T B
PROTECTION AND SUPPORT ACTIVITIES
STATE/TERRITORYCHILD PROTECTION &SUPPORT SYSTEMS
21
3 State/Territory child protection andsupport systems
State and Territory governments have the constitutional responsibility for childwelfare in Australia and are therefore responsible for developing, funding anddelivering child protection legislation and services. Child protection systems varymarkedly across jurisdictions, reflecting differences in emphasis or service deliveryparadigms. In WA, for example, mandatory reporting applies only to officers fromthe Family Court, whereas in the NT it applies to all residents. Although the extentof differences has been a hurdle in the development of comparable performanceindicators in the past, the problem was largely overcome in this project by taking ahigh-level approach which focused on the similarities across jurisdictions indeveloping indicators (see chapter 1).
The activities undertaken by jurisdictions to deliver services to clients are in manyrespects very similar. The Australian Institute of Health and Welfare (AIHW) notedthat irrespective of the jurisdiction:
… a referral to a department which ultimately ends up being dealt with as a child abuseor neglect referral passes through a number of similar stages. (AIHW 1999 p. 39)
The project required a detailed understanding of what jurisdictions do to respond topotential and on-going protection and support clients.
This chapter summarises the structural and legislative arrangements that govern thedelivery of protection and support services in each jurisdiction and describes thecontext in which child protection and support services occur. Section 3.1 describesat a high level the structural and legislative arrangements that exist in eachjurisdiction for the delivery of protection and placement services. Section 3.2describes areas of difference and similarity in the delivery of protection and supportservices across jurisdictions.
3.1 Service delivery arrangements
The State and Territory departments responsible for the administration of protectionand support legislation and the delivery and/or funding of services at the time of thisreport were:
22 STATE/TERRITORYCHILD PROTECTION &SUPPORT SYSTEMS
• New South Wales — Department of Community Services;
• Victoria — Community Care Division, Department of Human Services;
• Queensland — Children, Families and Young People, Department of Families;
• Western Australia — Department for Community Development;
• South Australia — Family and Youth Services, Department of Human Services;
• Tasmania — Child and Families, Department of Health and Human Services;
• The ACT Department of Education, Youth and Family Services; and
• The NT Department of Health and Community Services.
State and Territory governments fund child protection and support services, whichmay be delivered by the government or by non-government organisations (NGO)under contract with the relevant agency. NGOs are typically involved in providingfamily support services to clients and in the provision of out-of-home care services.
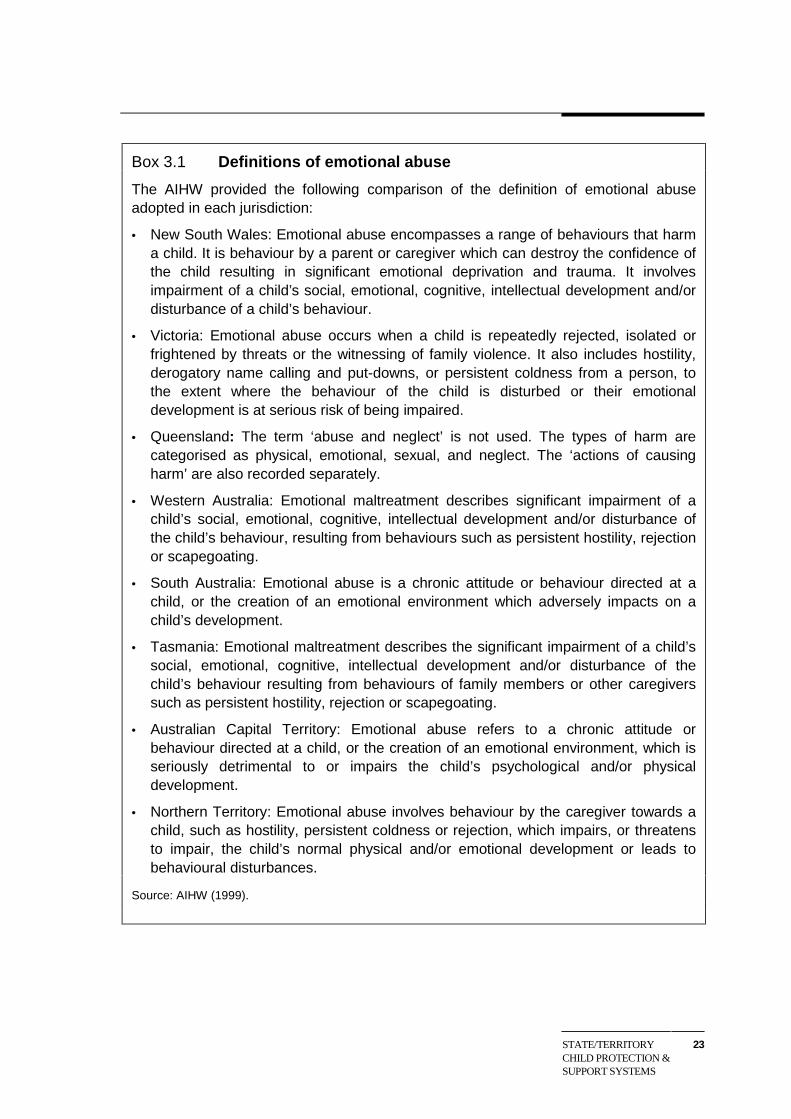
Each jurisdiction delivers protection and support services under a differentlegislative framework, which drive policies and practices. The child protectionlegislation of each jurisdiction at the time of this report is listed in table 3.1. Evensmall differences in legislation can result in substantial differences in policy andpractice. Variations in jurisdictions’ definition of ‘emotional abuse’, for example,reflect the differing conceptions of the term and therefore the range of responsesthat might be provided to protection and support clients (box 3.1).
Table 3.1 Child protection legislationa
Jurisdiction Legislation
New South Wales Children and Young Persons (Care and Protection) Act 1998Victoria Children and Young Persons 1989Queensland Child Protection Act 1999
Health Act 1937Western Australia Child Welfare Act 1947
Community Services Act 1972South Australia Family and Community Services Act 1972
Children’s Protection Act 1993Tasmania Children, Young Persons and Their Families Act 1997
Alcohol and Drug Dependency Act 1968Australian Capital Territory Children and Young People Act 1999Northern Territory Community Welfare Act 1983
a In addition to the State and Territory child protection legislation, the Commonwealth Family Law Act 1975,Criminal law codes and Common law also proscribe certain behaviour of individuals in relation to childprotection issues.
Source: AIHW (2002a).
STATE/TERRITORYCHILD PROTECTION &SUPPORT SYSTEMS
23
Box 3.1 Definitions of emotional abuse
The AIHW provided the following comparison of the definition of emotional abuseadopted in each jurisdiction:
• New South Wales: Emotional abuse encompasses a range of behaviours that harma child. It is behaviour by a parent or caregiver which can destroy the confidence ofthe child resulting in significant emotional deprivation and trauma. It involvesimpairment of a child’s social, emotional, cognitive, intellectual development and/ordisturbance of a child’s behaviour.
• Victoria: Emotional abuse occurs when a child is repeatedly rejected, isolated orfrightened by threats or the witnessing of family violence. It also includes hostility,derogatory name calling and put-downs, or persistent coldness from a person, tothe extent where the behaviour of the child is disturbed or their emotionaldevelopment is at serious risk of being impaired.
• Queensland: The term ‘abuse and neglect’ is not used. The types of harm arecategorised as physical, emotional, sexual, and neglect. The ‘actions of causingharm’ are also recorded separately.
• Western Australia: Emotional maltreatment describes significant impairment of achild’s social, emotional, cognitive, intellectual development and/or disturbance ofthe child’s behaviour, resulting from behaviours such as persistent hostility, rejectionor scapegoating.
• South Australia: Emotional abuse is a chronic attitude or behaviour directed at achild, or the creation of an emotional environment which adversely impacts on achild’s development.
• Tasmania: Emotional maltreatment describes the significant impairment of a child’ssocial, emotional, cognitive, intellectual development and/or disturbance of thechild’s behaviour resulting from behaviours of family members or other caregiverssuch as persistent hostility, rejection or scapegoating.
• Australian Capital Territory: Emotional abuse refers to a chronic attitude orbehaviour directed at a child, or the creation of an emotional environment, which isseriously detrimental to or impairs the child’s psychological and/or physicaldevelopment.
• Northern Territory: Emotional abuse involves behaviour by the caregiver towards achild, such as hostility, persistent coldness or rejection, which impairs, or threatensto impair, the child’s normal physical and/or emotional development or leads tobehavioural disturbances.
Source: AIHW (1999).
24 STATE/TERRITORYCHILD PROTECTION &SUPPORT SYSTEMS
3.2 Trends in current service delivery
In the course of the project, jurisdictions provided information that reflected thetrends in their own approach to service delivery, highlighting the way in whichthese approaches were evolving. Of some note was the extensive level of reviewand development of protection and support services being undertaken injurisdictions. The information provided by jurisdictions supported the notion thatthere are strong similarities in the activities undertaken by jurisdictions whenproviding protection and support services.
Differences
Differences across jurisdictions were particularly evident in relation to the conceptsof ‘a notification’, ‘an investigation’ and/or ‘a substantiation’. The differentmeanings for the same term were often a reflection of differences in legislation. Forexample:
• in Victoria notifications of suspected child abuse are ‘caller defined’, in thatinstances where a person making a report believes a child is in need of protectionare classified as notifications;
• some jurisdictions screen incoming reports, and may undertake activeinvestigation of matters, before deciding if they will be counted as a notification;
• WA and Tasmania use a narrower definition of notification. In Tasmania, reportswhere the initial information gives no indication of maltreatment are classifiedas a ‘child and family concern’ and may be referred to family support services.In WA, reports of concerns about children receive an interim classification as‘child concern’ reports while further assessment is undertaken to determinewhether the case will receive a child protection response, a family supportresponse or no further action. The rates of notifications in these jurisdictions aretherefore lower than the rates in other jurisdictions;
• the criteria for substantiation vary across jurisdictions. Some jurisdictionssubstantiate the harm or risk to the child, while others substantiate actions byparents or incidents that cause harm. In NSW, an intermediate category referredto as ‘child at risk’ has been used. This category includes notifications where noactual harm is identified but where carer/family issues were involved; and
• there are important differences in the provision of out-of-home care services.There is, for example, a different mix of government and non-governmentprovision and varying types of out-of-home care options available acrossjurisdictions.
STATE/TERRITORYCHILD PROTECTION &SUPPORT SYSTEMS
25
Another area of difference is the formality and structure in which ‘support’ services(as opposed to strictly child protection services) are utilised as part of addressing achild protection concern or attempting to minimise the likelihood of a childprotection concern arising. What is consistent is the extensive and seeminglygrowing use of family support services alongside protection services.
Finally, legislation is a critical area of difference across jurisdictions. This isimportant as legislation determines the parameters of practice and policy. Of somenote is the extent of ongoing change to the stock of legislation underpinning theprotection and support activities. A number of jurisdictions have recentlyimplemented new legislation, while others are conducting reviews of existinglegislation or proposing new legislation, suggesting that practice and policy areevolving.
Similarities
Information provided by jurisdictions indicated substantial similarities acrossjurisdictions in the activities undertaken to deliver services to clients. Discussionsabout practice, for example, always included reference to information gathering,assessments, and working with families, court processes, out-of-home care andactivities of NGOs. The similarity in the activities of jurisdictions is an indicationthat the issues and needs faced by protection and support clients are the sameirrespective of their geographical location.
Also of note were the similarities in the issues currently being addressed by thechild protection agencies responsible for administering the policy and delivery ofprotection and support services. Service delivery issues that were frequently raisedduring meetings included:
• the general experience of increasing demand for protection and support services,which has to be managed within budget and workforce constraints;
• a greater focus on early intervention, often through delivery of, or referral to,family and other support services. It was noted that this approach is resourceintensive in the short-term. In the long-term, however, a successful earlyintervention should contribute to a more satisfactory outcome for the child andreduce demand for more intensive and costly services such as out-of-home careand court orders;
• an increase in resources required for court processes and implementation ofcourt orders. The increase in resources was linked to an increase in the numberof contested cases as well as court orders that require more intensive servicedelivery (often associated with more prescriptive orders);
26 STATE/TERRITORYCHILD PROTECTION &SUPPORT SYSTEMS
• the importance of NGOs in service delivery was recognised, alongside a need todevelop more coordinated approaches to the effective and efficient provision ofservices for all clients; and
• the view that an increasing proportion of protection and support clients havecomplex needs and challenging behaviours. These clients require intensiveservices to address issues that include mental disorders and substance abuse. Aparticular issue was the difficulty faced by child protection agencies accessingsuitable out-of-home care for adolescents with complex needs and challengingbehaviours.
Although there are differences associated with variations in legislation and practiceacross jurisdictions, the problems being tackled and the outcomes being soughtwere common to all jurisdictions. In the Report on Government Services, alljurisdictions have agreed that:
The aims of child protection services are to:
• protect children and young people at risk of harm within their family or incircumstances in which the family of the child or young person does not have thecapacity to protect them; and
• assist families to protect children and young people.
The aim of out-of-home care services is to provide quality care for children and youngpeople aged 17 years and under who cannot live with their parents for reasons of safetyor family crisis.
• Child protection and out-of-home care services should be provided in an efficientand effective manner. (SCRCSSP 2003, p. 15.12)
Project assessment
The project proceeded by acknowledging the jurisdictional differences, but focusingon the similarities in activities being undertaken to deliver services to protection andsupport clients. The implications of the differences for the interpretation of theefficiency indicators are discussed in chapter 6.
NATIONALPATHWAYS
27
4 National child protection and supportpathways
This chapter presents the national pathways, developed and endorsed by theWorking Group in stage one of the project. The national pathways are high-levelrepresentations of comparable service delivery responses to potential and identifiedchild protection concerns across jurisdictions. The process used to develop thepathways is described in chapter two. Section 4.1 describes criteria used indeveloping the national pathways. Section 4.2 identifies the eight individual activitygroups that were used to construct the national pathways. Section 4.3 presents theeight national pathways. Section 4.4 presents a depiction of the relationship betweenthe activity groups and the national pathways.
4.1 Determining the national pathways
The national pathways represent comparable activities undertaken by jurisdictionsin the provision of protection and support services. An important part of stage oneof the project was to determine which elements of service delivery (activity groups)should be included in the national pathways.
The process of developing the pathways involved the use of three key criteria:
• the prevalence of a pathway across jurisdictions;
• demand on a pathway; and
• scope of services provided by the jurisdiction.
The prevalence of a pathway across jurisdictions
The prevalence of a pathway across jurisdictions was established by:
• assessing the range of possible decisions and service responses at major decisionpoints in child protection and family support delivery;
• comparing the range of decisions and service responses across jurisdictions; and
28 NATIONALPATHWAYS
• identifying those pathways (decisions and service responses) that exist in at leasthalf the jurisdictions.
Jurisdictions respond differently in similar circumstances. A specific examplewhere service responses vary arises when there is a request for out-of-home care inthe absence of protective concerns. Not all jurisdictions consider the provision ofout-of-home care services to be the responsibility of protection and support servicesin the absence of a protective concern. However, at the workshop in August, at leasthalf the jurisdictions identified that they do provide such services, hence, thisbundle of activities was included as a pathway.
Demand on a pathway
Consideration was given to the reported demand on individual pathways. Theagreed national pathways excluded pathways where there were low client numbersand the level of resources required to deliver services on that pathway were small.Most jurisdictions, for example, identified a separate pathway (or set of processes)for allegations concerning departmental employees or carers. In such circumstances,activities in addition to those that occurred in the ordinary course of an investigationwould take place. This particular pathway was not included as such reports weredescribed by jurisdictions as being few in number (although intensive in effort).
Scope of services provided by the jurisdiction
The pathway framework represents a compromise. While there was a need for detailto capture the full range of services that jurisdictions provide, there was also a needfor the national pathways to be manageable and provide a framework against whichjurisdictions could map their own activities.
Intensive family preservation services, for example, are provided to a relativelysmall number of clients and always in combination with other protective services.Nevertheless, they are provided in all but one jurisdiction, and are an increasinglyimportant aspect of service delivery; hence it was important that they be included asan activity group.
On the other hand, some pathways exist in only one or a small number ofjurisdictions and, therefore, did not meet the criteria for inclusion as a nationalpathway. For example, SA has a separate intake team for indigenous children.Yaitya Tirramangkotti is a team of Aboriginal social workers operating alongsidethe central intake team to provide an initial consultation and response service for allreported Aboriginal children in SA (Family and Community Services, no date).
NATIONALPATHWAYS
29
Similar services were not identified by other jurisdictions; hence, there is no standalone national pathway for the intake of indigenous children into protection andsupport services.
Differences in the scope of services provided by jurisdictions will be accommodatedin the reported efficiency indicator by supporting commentary and caveats. Theimplication of these differences are discussed in more detail in chapter 6.
4.2 Activities in the national pathways
Pathways through protection and support services systems can be considered asgroups of activities. Each activity group is made up of a bundle of servicesdelivered by child protection agencies. The actual bundle of services provided toany individual child and their family will be determined by the needs of the child oryoung person at a particular point in time, consistent with the legislation andpractice of the jurisdiction.
The eight individual activity groups that form the basis of the endorsed nationalpathways are set out in table 4.1, and are described in detail below.
Table 4.1 Activity groups for the national pathways
Activity Group Activity group title
One Receipt and assessment of initial information about a potential protection orsupport issue
Two Provision of initial family support servicesThree Provision of intensive family support servicesFour Secondary information gathering and assessmentFive Provision of short-term protective intervention and coordination servicesSix Seeking a court orderSeven Provision of longer-term protective intervention, support and coordination
servicesEight Provision of out-of-home care services
Activity group one — receipt and assessment of initial informationabout a potential protection or support issue
Activities that are typically associated with receipt and assessment of initialinformation include receipt and recording of information, review of departmentdatabases, initial assessment of information and decisions about the appropriateresponse. This activity can also include consultation, with possible provision ofadvice.
30 NATIONALPATHWAYS
Activity group two — provision of initial family support services
Family support services have been defined as:
Services that seek to benefit families by improving their capacity to care for childrenand/or strengthening family relationships. (AIHW 2001a, p. xi.)
Activities that are typically associated with provision of initial family supportservices include identification of family needs, provision of support services, somecounselling and active linking of the family to support networks. Services arefunded by government but can be delivered by either the relevant agency or a Non-government organisation (NGO). This bundle of services does not involve plannedfollow-up by the relevant agency after initial service delivery. The services will bedelivered under voluntary arrangements between the relevant agency and family.
Activity group three — provision of intensive family support services
Activities that are typically associated with provision of intensive family supportservices include provision of therapeutic and in-home supports such as counsellingand mediation, modelling of positive parenting strategies, referrals to intensivesupport services that may be provided by NGOs, advocacy on behalf of clients andintensive support for a family in a residential setting.
The Australian Institute of Health and Welfare (AIHW) proposed that the range offamily support services available in jurisdictions could be thought of as a‘continuum’. Intensive family support services are those at the ‘hard end’ of servicedelivery or at one end of the continuum. The AIHW has described tertiary ortargeted family support services as:
Those services where the issue, problem or concern is one which requires intensive,and often ongoing intervention. (AIHW 2001a, p. 6.)
In the context of this project, the provision of services occurs where protectiveconcern has been identified. The intensive family support services, as defined andreported by the AIHW, are the basis of this measure (see box 4.1). These servicesare characterised by:
• voluntary engagement by families;
• the provision of a mix of therapeutic and in-home supports; and
• services provided over a period of time, rather than being ‘one-off’ events.
Some jurisdictions provide a subset of the intensive family support services whichare designed to address a specific category of service responses. These services are
NATIONALPATHWAYS
31
additional to the intensive family support services defined by the AIHW. WesternAustralia provides such services.
Intensive family support services in all jurisdictions can be provided cooperativelywith the family, or as part of the case plan for the child subject to statutoryintervention. The services could be provided by the relevant agency (in somejurisdictions this would be by a family support service unit and in some it would bepart of a stand alone relevant agency) or by an NGO.
The outcomes of intensive family support services will potentially influence theneed for additional services to resolve a child protection concern. That is, there is aconnection between intensive family support services and other child protectionservices.
Box 4.1 Definition of intensive family support services
The AIHW defines intensive family support services as services which meet all thefollowing criteria:
• they are provided explicitly to work to prevent separation or to reunify families;
• a range of services is provided as part of an integrated strategy focussing onimproving family functioning and skills, rather than just one type of service such asemergency or respite care;
• they are intensive in nature, averaging at least 4 hours of service provision per weekfor a specified short-term period (usually less than 6 months); and
• generally referrals will come from the statutory agency and will have been identifiedthrough the child protection process. Most cases will have been the subject of achild protection substantiation.
Source: AIHW (2002b).
Activity group four — secondary information gathering andassessment
Activities that are typically associated with secondary information gathering andassessment are currently counted as ‘investigations’ in the Report on GovernmentServices. As part of this activity group a decision may be made to substantiate ornot substantiate. Information gathering activities include:
• sighting the child;
• contacting people with relevant information about the child or family (forexample, teachers, police, support services);
32 NATIONALPATHWAYS
• interviewing the child, sibling(s) and parents;
• observing family interactions;
• obtaining assessments of the child and/or family;
• conducting family group conferences;
• liaising with agencies providing services to the child and family;
• recording a substantiation or non-substantiation decision; and
• case conferences with partners and contributors in the investigation andassessment process.
Activity group five — provision of short-term protective interventionand coordination services
These services are intended to address the specific issue(s) causing the childprotection concern. The services would be provided in the context of a case planand would be designed to address specific objectives of the case plan. Theseservices could be provided prior to any court order being granted. Activities that aretypically associated with provision of short-term protective intervention andcoordination services include:
• working with the family to address protective issues;
• developing networks of support for the child;
• monitoring and reviewing the safety of the child;
• monitoring and reviewing family progress against case planning goals;
• case conferences with agencies providing services to the child and/or family,internal discussions and reviews; and
• specialist child-focused therapeutic support.
Activity group six — seeking a court order
Child protection legislation across jurisdictions provides for court orders that areassociated with:
• an emergency child protection response;
• short-term orders associated with obtaining assessments for families andchildren;
NATIONALPATHWAYS
33
• orders that deal with supervision or placement of a child in the short- ormedium-term. Services will generally include support services required toachieve family re-unification; and
• orders that deal with supervision or placement of a child in the long-termincluding permanent orders.
Activities that are typically associated with seeking court orders include:
• preparing applications for the order;
• preparing reports for the court;
• obtaining assessment reports to submit to the court;
• informing parties to the court proceedings, including parents, the child, andlawyers;
• informing and briefing legal counsel or internal court groups;
• going through internal pre-court review processes;
• attending court; and
• conducting family group conferences.
Activity group seven — provision of longer-term protectiveintervention and co-ordination services
These are services provided once a child or young person is on a court order. Often,the court order transfers the duty of care for the child or young person to therelevant agency or Minister. Activities that are typically associated with provisionof longer-term protective intervention and coordination services include:
• monitoring the child or young person’s progress and development (for example,social development and education progress) and undertaking activities thatfacilitate progress and development;
• assisting the child or young person to maintain contact with their family;
• meeting any specific requirements of any court order;
• reviewing appropriateness of the order for the circumstances of the child oryoung person. This usually occurs at intervals established by the court or inlegislation;
• reporting back to court;
• working to return the child home; and
34 NATIONALPATHWAYS
• assisting the child or young person as they prepare to leave care as the end of theorder approaches.
Activity group eight — provision of out-of-home care services
The range of out-of-home care options varies by type and also by period of time inout-of-home care. The possible combinations of out-of-home care and length oftime are described by the categories identified in table 4.2.
Table 4.2 Out-of-home care options
Types of care Period of residence
Respite care Up to 7 days as a single ‘block’ of care
Kinship/relative care Medium-term Less than 12 months
Long-term More than 12 months
Respite care Up to 7 days as a single ‘block’ of care
Foster care Medium-term Less than 12 months
Long-term More than 12 months
Respite care Up to 7 days as a single ‘block’ of care
Medium-term Less than 12 monthsFacility based care (for examplegroup care, residential or familygroup setting) Long-term More than 12 months
Each combination can involve the relevant agency undertaking slightly differenttasks to provide the required services to a child or young person. The role of NGOsin the provision of out-of-home care will also influence the tasks undertaken by therelevant agency. In some jurisdictions, for example, NGOs are responsible forrecruiting and training foster carers. In other jurisdictions, the relevant agency isresponsible for this role.
The activities that are typically associated with provision of out-of-home careservices include:
• finding suitable placement(s) for the child;
• assisting the child or young person to maintain contact with his/her family;
• in some cases, recruiting and training carers; and
• assessing suitability of potential kinship carers.
4.3 Agreed national pathways
The agreed national pathways represent comparable groupings of activitiesundertaken by jurisdictions in the provision of protection and support services.
NATIONALPATHWAYS
35
There are similarities in the activities undertaken by jurisdictions when providingprotection and support services. Each activity group is made up of a bundle ofservices provided by the relevant agency.
The pathways are identified in table 4.3 and described in detail in the sections thatfollow. The pathways are ordered from least intrusive (pathway one); that is,voluntary engagement by the family with protection and support services, to mostintensive; that is, involving the exercise of statutory powers via court to provideprotection and support services (pathway eight). It is anticipated that the moreintensive pathways reflect more complex needs of the child and/or family andrequire increased resources to meet those needs.
Table 4.3 The national pathways
Pathway no. Pathway title
One Receipt and assessment of initial informationTwo Provision of initial family support servicesThree Secondary information gathering and assessment of circumstances with provision
of family support servicesFour Provision of out-of-home care without protective interventionFive Provision of intensive family support servicesSix Provision of protective intervention and support services without court orders,
short-term involvementSeven Provision of protective intervention and support services with court orders,
longer-term involvementEight Provision of protection and support services with court orders, continuing
involvement
Pathway one: receipt and assessment of initial information
Pathway one is the receipt and assessment of initial information. The bundle ofservices provided under pathway one are those involved with activity group one.Figure 4.1 represents pathway one.
Context for service delivery
Contact with the agency responsible for administering protection and supportservices is generally prompted when someone has concern about the safety orcircumstances of a child/young person. This step is a necessary, but not sufficientcondition, for the provision of protection and support services. In all jurisdictionsexcept WA, various groups in the community are required by law to reportsuspected circumstances of child abuse or neglect. In a number of cases no furtherservice or support is required.
36 NATIONALPATHWAYS
Activities
The relevant agency receives and records initial information, assesses thatinformation and makes a decision about the need for service provision relative tofamily support or protective needs. The outcome is that no further services areprovided.
Figure 4.1 Pathway one
Activity Group 1
Receipt andassessment of initialinformation about apotential protection
or support issue
Pathway two: provision of initial family support services
Pathway two is the provision of initial family support services. The bundle ofservices provided under pathway two are those involved with activity groups oneand two. Figure 4.2 represents pathway two.
Context for service delivery
A child has been the subject of a contact made with the agency responsible foradministering protection and support services. The initial assessment of the agencyis that the concerns expressed do not require further assessment activities but thatthe circumstances of the child’s family may be aided by accessing some form ofinitial family support services, such as financial counselling, anger management,and/or parenting skills.
NATIONALPATHWAYS
37
Activities
The relevant agency receives and records initial information, assesses thatinformation and makes a decision about the need for service provision. Assessmentis that the issue does not require further child protection assessment or intensiveservice provision, but the family is made aware of and receives support services.Services provided include the appropriate combination of advice, referrals and briefcounselling.
Figure 4.2 Pathway two
Activity Group 1
Receipt andassessment of initialinformation about apotential protection
or support issue
Activity Group 2
Provision of initialfamily support
services
Pathway three: secondary information gathering and assessment ofcircumstances with provision of family support services
Pathway three involves secondary information gathering and assessment ofcircumstances with provision of family support services. The bundle of servicesprovided under pathway three are those involved with activity groups one, two, fourand possibly eight. Figure 4.3 represents pathway three.
Context for service delivery
This pathway builds on pathway two. In addition, the agency responsible foradministering protection and support services determines that a more formalinformation gathering and assessment process is required to determine the level ofservice provided. This may be called an investigation. In some circumstances, thechild may be provided with a temporary placement away from home.
38 NATIONALPATHWAYS
Activities
The relevant agency receives and records initial information, assesses thatinformation and makes a decision about the need for service provision. Assessmentis whether the potential risk to the child is significant enough to warrant acomprehensive investigative response. Secondary information gathering andassessments take place and a plan to address the identified issues is developed.
Figure 4.3 Pathway three
Activity Group 1
Receipt andassessment of initialinformation about apotential protection
or support issue
Activity Group 2
Provision of initialfamily support
services
Activity Group 4
Secondaryinformation
gathering andassessment
Activity Group 8
Provision ofout-of-homecare services
The family is made aware of and receives support services. Services providedinclude the appropriate combination of advice, referrals and brief counselling. Theissues may be resolved without the use of court orders.
The child or young person may or may not be living at home when these servicesare being provided. If the child or young person is not living at home, voluntaryarrangements are in place.
Pathway four: provision of out-of-home care without protectiveintervention
Pathway four involves the provision of out-of-home care without protectiveintervention. The bundle of services provided under pathway four are those
NATIONALPATHWAYS
39
involved with activity groups one, eight and possibly two. Figure 4.4 representspathway four.
Figure 4.4 Pathway four
Activity Group 1
Receipt andassessment of initialinformation about apotential protection
or support issue
Activity Group 8
Provision of out-of-home care
servicesActivity Group 2
Provision of initialfamily support
services
Context for service delivery
A child has been the subject of a contact made with the relevant agency. Thecircumstances of the family are such that out-of-home care is required for the child,but there are no protective concerns. The need for out-of-home care in the absenceof protective concerns, indicates that the family does not have a strong supportnetwork. Thus, the family may also benefit from receiving some form of initialfamily support services. For example, the pathway may be used in a situation wherea single parent requires a period of hospitalisation and there are no suitableextended family or friends to care for the child during that time.
Activities
The relevant agency receives and records initial information, assesses thatinformation and makes a decision about the need for service provision. Theassessment is that a period of out-of-home care is required to meet the immediateshort-term needs of the child.
40 NATIONALPATHWAYS
Out-of-home care is provided as a pro-active response, to avert a potential safety orrisk issue developing for the child or young person.
The family is made aware of and receives support services. Services providedinclude the appropriate combination of advice, referrals and brief counselling.
Pathway five: provision of intensive family support services
Pathway five involves the provision of intensive family support services. Thebundle of services provided under pathway five are those involved with activitygroups one, three, four, five and possibly eight. Figure 4.5 represents pathway five.
Figure 4.5 Pathway five
Activity Group 3
Provision ofintensive familysupport services
Activity Group 1
Receipt andassessment of initialinformation about a
potential protection orsupport issue
Activity Group 8
Provision ofout-of-homecare services
Activity Group 4
Secondaryinformation
gathering andassessment
Activity Group 5
Provision of shortterm protectiveintervention and
coordinationservices
Context for service delivery
Clients on this pathway are beginning to become involved with more intensiveprotection and support services. An assessment of the child’s circumstances hasidentified issues that require the relevant agency to commence protectiveintervention services. These services may include home visits and developing asupport network for the child and, depending on the specific circumstances, thechild being placed in out-of-home care with the voluntary agreement of the parents.An important strategy to address the protective concerns is to work intensively with
NATIONALPATHWAYS
41
the family, possibly in their home, to address a range of broader family needs withthe objective of establishing a safe family environment for the child.
Activities
The relevant agency receives and records initial information, assesses thatinformation and makes a decision about the need for service provision. Assessmentis that the potential risk to the child is significant enough to warrant acomprehensive investigative response.
Secondary information gathering and assessments take place and a plan to addressthe identified issues is developed. Assessment is that there are issues that require anintensive family support response and may require a child protection response.
A range of intensive family support services is provided to help build on familystrengths and facilitate the family being able to better meet the needs of the child orchildren. These services can include family preservation services. The relevantagency is likely to take an active role in monitoring the progress of the familyreceiving such services. The family is working cooperatively with the relevantagency.
A range of protective intervention and coordination services is provided to the childincluding case planning; working with the family to address protective issues; anddeveloping networks of support for the child. The child protection issues areresolved without the need for court orders.
The child may or may not be living at home when these services are beingdelivered. If the child is not living at home, voluntary arrangements are in place.
Pathway six: provision of protective intervention and support serviceswithout court orders, short-term involvement
Pathway six involves the provision of protective intervention and support serviceswithout court orders. The bundle of services provided under pathway six are thoseinvolved with activity groups one, two, four, five and possibly eight. Figure 4.6represents pathway six.
Context for service delivery
Like pathway five, an assessment of the child’s circumstances has identified issuesthat require the relevant agency to commence protective intervention services.These services may include home visits and developing a support network for the
42 NATIONALPATHWAYS
child and depending on the specific circumstances the child being placed in out-of-home care with the voluntary agreement of the parents. Initial family supportservices, such as counselling around parenting skills, are provided to help build onthe strengths of the family.
Figure 4.6 Pathway six
Activity Group 1
Receipt andassessment of initialinformation about apotential protection
or support issue
Activity Group 8
Provision ofout-of-homecare services
Activity Group 4
Secondaryinformation
gathering andassessment
Activity Group 2
Provision of initialfamily support
services
Activity Group 5
Provision of shortterm protectiveintervention and
coordinationservices
Activities
The relevant agency receives and records initial information, assesses thatinformation and makes a decision about the need for service provision. Assessmentis that the potential risk to the child is significant enough to warrant acomprehensive investigative response. Secondary information gathering andassessments take place and a plan to address the identified issues is developed.
The family is made aware of and receives support services. Services providedinclude the appropriate combination of advice, referrals and brief counselling.
A range of protective intervention and coordination services are provided to thechild including case planning, working with the family to address protective issuesand developing networks of support for the child. The child or young person may ormay not be living at home when these services are being delivered.
NATIONALPATHWAYS
43
Pathway seven: provision of protective intervention and supportservices with court orders, longer-term involvement
Pathway seven involves the provision of protective intervention and supportservices with court orders. The bundle of services provided under pathway sevenare those involved with activity groups one, two, four, five, six and possibly threeand eight. Figure 4.7 represents pathway seven.
Figure 4.7 Pathway seven
Activity Group 2
Provision of initialfamily support
services
ActivityGroup 5
Provision of shortterm protectiveintervention and
coordinationservices
ActivityGroup 1
Receipt andassessment of initialinformation about apotential protection
or support issueActivity Group
6
Seeking acourt order
Activity Group 8
Provision ofout-of-homecare services
ActivityGroup 4
Secondaryinformation
gathering andassessment
ActivityGroup 3
Provision ofintensive family
supportservices
Context for service delivery
Clients on this pathway are involved with protection and support services andrequire longer-term involvement before issues are resolved. Involvement of therelevant agency is anticipated for more than 12 months and court orders are used tofacilitate service provision. The protection and support services provided for thechild may involve out-of-home care. Work is being undertaken to help develop asafe family environment for the child through accessing initial family support
44 NATIONALPATHWAYS
services, such as counselling, and potentially intensive family support, including in-home and therapeutic support services.
Activities
The relevant agency receives and records initial information, assesses thatinformation and makes a decision about the need for service provision. Assessmentis that the potential risk to the child is significant enough to warrant acomprehensive investigative response. Secondary information gathering andassessments take place and a plan to address the identified issues is developed.
The family may benefit by being made aware of and receiving support services.Services provided include the appropriate combination of advice, referrals and briefcounselling.
The family may receive a range of family support services to help build on familystrengths and facilitate the family being able to better meet the needs of the child orchildren. These services can include family preservation services. The relevantagency is likely to take an active role in monitoring the progress of the familyreceiving such services. The family is working with the relevant agency on avoluntary basis.
A range of protective intervention and coordination services are provided to thechild. These include case planning, working with the family to address protectiveissues and developing networks of support for the child.
Court orders may be used to enable the relevant agency to undertake activitiesnecessary to resolve the protection issue. The use of court orders could beassociated with:
• the speed of response by the relevant agency (that is, an emergency response);
• the family not engaging with the relevant agency over a period of time; or
• a change of circumstances that increases the risk to the child or young person.
The relevant agency makes an application to the court for an order that facilitatesthe transfer of custody of the child and may be associated with the relevant agencyundertaking more intensive service provision. The court grants the order.
The child or young person may or may not be living at home when the protectionand support services are being delivered. The residency arrangements for the childor young person are likely to be supported by a court order. If the child or youngperson is in out-of-home care it is possible that a number of placements have beenexperienced.
NATIONALPATHWAYS
45
The provision of statutory protective intervention and support services resolves therisk and safety issues for the child. Contact with the protection and support servicesends.
Pathway eight: provision of protective intervention and supportservices with court orders, continuing involvement
Pathway eight involves the provision of protective intervention and support serviceswith court orders and continuing involvement. The bundle of services providedunder pathway eight are those involved with activity groups one, two, four, five,six, seven and eight. Figure 4.8 represents pathway eight.
Figure 4.8 Pathway eight
Activity Group 1
Receipt andassessment of initialinformation about apotential protection
or support issue
Activity Group 4
Secondaryinformation
gathering andassessment
Activity Group 2
Provision of initialfamily support
services
Activity Group 5
Provision of shortterm protectiveintervention and
coordinationservices
Activity Group 8
Provision ofout-of-homecare services
Activity Group 6
Seeking a courtorder
Activity Group 7
Provision of long-term potective
intervention andcoordination
services
Context for service delivery
This is the most intensive of the protection and support services pathways andinvolves aspects of all service delivery options over an extended time period.Involvement of the relevant agency is anticipated for more than 12 months and
46 NATIONALPATHWAYS
court orders are used to facilitate service provision. The child is placed in out-of-home care and provided with support during this time. Work is undertaken tosupport family re-unification, and includes providing initial family support services,such as counselling, to help develop a safe family environment. However, at somepoint the focus moves from family re-unification to permanency planning.
Activities
The relevant agency receives and records initial information, assesses thatinformation and makes a decision about the need for service provision. Assessmentis that the potential risk to the child is significant enough to warrant acomprehensive investigative response. Secondary information gathering andassessments take place and a plan to address the identified issues is developed.
The family is made aware of and receives support services. Services providedinclude the appropriate combination of advice, referrals and brief counselling.
A range of protective intervention and coordination services are provided to thechild. These include case planning, working with the family to address protectiveissues and developing networks of support for the child or young person.
Court orders may be used to facilitate the relevant agency undertaking activitiesnecessary to resolve the protection issue. The use of court orders could beassociated with:
• the speed of response by the relevant agency (that is, an emergency response);
• the family not engaging with the relevant agency over a period of time; or
• a change of circumstances that increases the risk to the child or young person.
The child or young person may or may not be living at home when the protectionand support services are being delivered. The residency arrangements for the childor young person are likely to be supported by a court order. If the child or youngperson is in out-of-home care it is possible that a number of placements have beenexperienced.
A decision is made by the relevant agency to cease those activities intended toachieve family re-unification. Permanency planning takes place, court orders arelikely to be used to facilitate the long-term protection of the child or young person.
NATIONALPATHWAYS
47
4.4 Summary of national pathways
Each of the national pathways described in the previous section is a uniquecombination of activity groups that represent:
• the prevalence of a pathway across jurisdictions;
• demand on a pathway; and
• scope of services provided by the jurisdiction.
Table 4.4 summarises the relationship between pathways and activity groups. Itindicates where activity groups are included and excluded within a pathway, andinstances where an activity group may, but is not always, included within apathway.
Table 4.4 Relationship between activity groups and the national pathways
Pathways Activity Groups
1 2 3 4 5 6 7 8
1 Receipt and assessment ofinitial information
✓ ✗ ✗ ✗ ✗ ✗ ✗ ✗
2 Provision of initial familysupport services
✓ ✓ ✗ ✗ ✗ ✗ ✗ ✗
3 Secondary informationgathering and assessmentof circumstances withprovision of family supportservices
✓ ✓ ✗ ✓ ✗ ✗ ✗ �
4 Provision of out-of-homecare without protectiveintervention
✓ � ✗ ✗ ✗ ✗ ✗ ✓
5 Provision of intensive familysupport services
✓ ✗ ✓ ✓ ✓ ✗ ✗ �
6 Provision of protectiveintervention and supportservices without court orders
✓ ✓ ✗ ✓ ✓ ✗ ✗ �
7 Provision of protectiveintervention and supportservices with court orders
✓ ✓ � ✓ ✓ ✓ ✗ �
8 Provision of protection andsupport services with courtorders, continuinginvolvement with lessservice provision
✓ ✓ ✗ ✓ ✓ ✓ ✓ ✓
Note: ✓ indicates that the activity group is part of the pathway, ✗ indicates that the activity group is not part ofthe pathway, � indicates that the activity group may be part of the pathway.
48 NATIONALPATHWAYS
P A R T C
NATIONAL REPORTING METHOD
NATIONALREPORTING METHOD
49
5 National reporting method
The ultimate objective of the protection and support pathways project was todevelop a model for generating robust, comparable pathway efficiency indicatorsfor protection and support activities. Chapter 4 described how the various protectionand support services have been defined and grouped for the purposes of creating abase from which to calculate the pathway efficiency indicators.
This chapter describes the model to collect the financial and service information andto calculate the pathway efficiency indicators. The application of Activity BasedCosting (ABC) is a major component of the national reporting method and isincorporated in the model to calculate the pathway efficiency indicators which isdescribed in seven steps (figure 5.1).
Figure 5.1 Overview of the national reporting method, seven-step model
Section 5.3 Deriving pathway efficiency indicators Section 5.2 Service delivery
information
Section 5.1 Financial information
Step 1(data identification/collection)
Identify resources used todeliver protection and support
services
Step 2(data identification/
collection)Categorise costs as
direct or indirect
Step 3(data identification/
collection)Allocate direct and indirect
costs to activity groups
Step 4(calculation)
Calculate the total costper activity group
Step 5(data identification/collection)
Quantify level of servicesprovided in accordance with
service measures
Step 6(calculation)
Calculate the unit cost foreach activity group
Step 7(calculation)
Calculate the pathwaycost
Source: ACG 2002d.
To apply the model requires the collection of financial and service deliveryinformation for each jurisdiction. The first three steps of the model comprise thekey steps in the identification and collection of financial information, and step fourcalculates the total cost per activity group based on this information. Step five
50 NATIONALREPORTING METHOD
addresses the identification and collection of service delivery information, while thefinal two steps involve the calculation of efficiency indicators.
This chapter describes the data collection method and discusses the processesinvolved in collecting financial information and service delivery information fromjurisdictions. Section 5.1 describes the first four steps of the model used to identifyand collect the necessary financial information, and to derive total costs per activitygroup. Section 5.2 focuses on the identification and collection of service deliveryinformation in accordance with step 5 of the national reporting method. Section 5.3discusses the calculation of efficiency indicators, as addressed by the final two stepsof the method.
5.1 Financial information
The identification and collection of financial information — including thecalculation of total expenditure by activity group — relates to steps one to four inthe national reporting method presented in figure 5.1. A description of conceptsand/or definitions underpinning each step and the application of each step isdescribed below.
Step one — Identify resources used to deliver protection and supportservices
Step one requires the identification of all financial resources, or total expenditure,used to deliver protection and support services consistent with the agreed scope ofreporting. Achieving consistency in the scope of reporting is fundamental to thecalculation of comparable efficiency indicators.
Chapter 1 described the services within the scope of this project. These services arein the areas of child protection, out-of-home care and family support services. Thedetailed counting rules used to define the boundaries of these services acrossjurisdictions are discussed in appendix B.
Total expenditure is the starting point for the collection of financial informationrequired to calculate efficiency indicators. It is a necessary intermediate step in theapplication of ABC (see box 2.1).
Total expenditure can be measured by using either a ‘top down’ or a ‘bottom up’approach. Although the use of either the top down or bottom up approach shouldtheoretically result in the same total expenditure figure, this is rarely the case inpractice.
NATIONALREPORTING METHOD
51
The bottom up approach derives total expenditure by adding the cost to produceeach output or activity group. To apply the bottom up approach requires:
• identifying and costing each task (both operational and non-operationalcomponents) that is undertaken to deliver a service;
• multiplying the cost of each task by the number of times it was performed toobtain the total cost of delivering each task type; and
• summing the total cost for each task type to identify the total cost of deliveringprotection and support services.
A potential drawback with the bottom up approach is the risk that overheadexpenses will not be captured in the estimate of total expenditure. That is, whenidentifying the costs associated with each individual task undertaken to deliver aservice, support costs (such as corporate overheads) may be overlooked orunderestimated as it is not obvious that they are an input to a good or service.
In contrast, the top down approach starts by identifying total expenditure by thejurisdiction on the delivery of all protection and support services. The totalexpenditure figure is the amount that is allocated across all protection and supportactivity groups and pathways. Internal financial systems are important sources ofinformation in identifying the total expenditure by jurisdictions and hence inapplying the top down approach.
There are a number of factors to consider in choosing which method is moreappropriate for use in a particular application of ABC.
First, the approach adopted should be able to deliver timely data. The objective ofthis project is to provide data which support the performance reporting in the Reporton Government Services. All data currently reported are typically for the mostrecently completed financial year. It would be desirable for the pathways data to besimilarly timely. Estimating total expenditure using a top-down approach is likely toprovide more timely data because there are existing systems to do this, there arefewer coordination issues involved, and it will be easier for jurisdictions toreconcile the figure against expenditure data provided for other purposes (such asannual reports).
Second, the approach adopted should allow immediate reporting and not place anundue compliance burden on reporting jurisdictions. Thus, an approach that can beapplied using existing information systems and work practices is preferable.Jurisdictions have been providing total expenditure data for the Report onGovernment Services using the top down approach since 1995. Although the totalexpenditure figure required for this project will be broader in scope than the currentfigure in use, the adoption of the top down approach is an extension of a current
52 NATIONALREPORTING METHOD
approach, rather than a completely new approach to estimating total expenditure forprotection and support services.
Finally, the approach adopted should be accurate and easily validated againstreported data. Accuracy requires capturing all costs and applying consistentcounting rules and standards. In this situation, the top down approach is likely toprovide greater accuracy because there is less scope for costs being omittedparticularly overhead costs, and less likelihood that counting rules will beinterpreted inconsistently. For these reasons, the top down approach was used toestimate total expenditure by each jurisdiction on protection and support activities.The figure used is the actual expenditure on protection and support activities for theprevious financial year.
At the completion of this step, all financial resources used to provide protection andsupport services, consistent with the defined scope, should be identified.
Step two — Categorise costs as direct or indirect
After establishing a total expenditure figure for the relevant protection and supportservices, it is necessary to categorise the full range of costs comprising thisexpenditure figure as either direct or indirect, and allocate these costs to theappropriate activity groups. This is step two of the model.
The application of ABC allows a linking of the physical inputs from tasks toactivity groups and then to pathways. Utilising the financial information obtained instep one and the links between the physical inputs and pathways, total expenditureis allocated to activity groups to reflect the intensity with which resources areconsumed when delivering a service. The process of establishing links betweenphysical inputs and expenditure in particular activity groups is achieved by firstcategorising costs as either direct or indirect.
Direct costs are defined as:
… those which can directly and unequivocally be attributed to a specific activity. Theyinclude labour (including on-costs) and materials used to produce a single good orservice. (CCNCO 1998, p.8)
An example of a direct cost would be the expense associated with obtaining legaladvice needed to seek a court order. This expense is exclusively associated withactivity group six (seek a court order). Direct costs will usually be incurred in anoperational or service delivery setting.
NATIONALREPORTING METHOD
53
Indirect costs are defined as:
… those which are not directly attributable to an activity ... (CCNCO 1998, p.8)
In the case of protection and support services, indirect costs are likely to be a muchlarger group of costs than direct costs and will include operational and non-operational costs. Any cost where a single input (say labour) is used to completetasks associated with a number of activity groups is an indirect cost. For example,the situation where an emergency response is required is an example where thesingle input of a case worker’s time (or labour) is used to undertake tasks that arepart of many activity groups. That is, a case worker may:
• receive the initial phone call and undertake initial assessments (as per activitygroup one);
• undertake secondary information gathering and assessment (as per activity groupfour);
• provide short-term protective intervention and coordination services (as peractivity group five); and
• obtain a court order (as per activity group six).
Appendix B provides greater detail on the process used to identify and collect dataon direct and indirect costs.
At the completion of this step, the cost components making up total expenditureshould be identified as either direct or indirect cost types.
Step three — Allocate direct and indirect costs to activity groups
Step three is to allocate the direct and indirect costs, which collectively shouldaccount for total expenditure identified in step one, to the individual activity groups.
For direct costs, this step is relatively straightforward. The expenditure associatedwith direct costs is allocated to the relevant activity groups — that is, to the activitygroups to which it can be unequivocally linked or traced.
The allocation of indirect costs to activity groups is more complex and requires theadoption of a method to allocate the resources used to provide a service to activitygroups in a manner that reflects the intensity of resource use. Using the exampleabove where an emergency response is initiated, it is evident that a case workerwould spend substantially different amounts of time on each of the identified tasks.The question is how to accurately allocate the value of resources used in those tasksto the activity groups. The process of doing this involves the use of a ‘cost driver’ orfactor that has the most significant impact on the relative use of resources across
54 NATIONALREPORTING METHOD
activity groups. Labour costs of workers involved in service delivery wereconsidered to be the key driver of the majority of activity costs and were used as thebasis for allocating all indirect costs.
For the purposes of the proposed method, indirect costs were allocated to activitygroups in the same proportion as time allocated by workers involved in servicedelivery to the eight activity groups. For example, if a jurisdiction reported that tenper cent of case worker time was spent performing intake duties, ten per cent ofindirect costs were allocated to activity group one. The process for performing theallocation of indirect costs to tasks and activity groups is discussed in detail inAppendix B.
At the completion of this step, total expenditure should be allocated across the eightactivity groups.
Step four — Calculate the total cost per activity group
The final step in the identification and collection of relevant financial information isto sum the direct and indirect costs for each activity group to calculate a totalexpenditure per activity group.
At the completion of step four, there should be information on the total expenditurefor each of the eight activity groups. The sum of the total expenditure for the eightactivity groups should equal the total expenditure identified in step one.
5.2 Service delivery information
The identification and collection of service delivery information relates to step 5 inthe national reporting method presented in figure 5.1.
Step five — Quantify level of services provided
Step five involves the identification and collection of the relevant service deliveryinformation. To calculate the pathway efficiency indicators requires a measure ofthe number of services provided over a year for each activity group. The servicedelivery information represents a proxy for the protection and support outputsprovided by jurisdictions. This information is important because these measures areused as the denominator in the calculation of the activity group unit costs.
NATIONALREPORTING METHOD
55
The objectives of this component of the project were to:
• agree on a set of proposed measures for the units of service delivered for eachactivity group;
• obtain available service delivery information, consistent with the agreed units ofmeasure. Some data for the agreed measures were available from the AustralianInstitute of Health and Welfare (AIHW); and
• for measures where the AIHW did not collect data that matched the agreedmeasures, establish if the data were available directly from jurisdictions, andcollect that data.
In developing a set of proposed measures for the units of service delivered for eachactivity group, a number of principles were adhered to (box 5.1).
Box 5.1 Desirable characteristics of service delivery information
The measures developed should display the following characteristics:
• accurate — provide an accurate measure of the quantum of services provided aspart of that activity group;
• complete — in combination the measures should not include services that are notpart of the agreed national framework and should not exclude services (or subsetsof services) that are part of the agreed national framework;
• consistent across jurisdiction — to maximise comparability across jurisdictions; and
• mutually exclusive — to ensure that there is not double counting of service delivery.This characteristic does not require that services are delivered sequentially. It islikely that a child will receive protection and support services from a number ofactivity groups at the same time; for example, a relevant agency may be seeking acourt order at the same time as providing long-term child protection services. Whatis important is that resources used to deliver services are captured only once andthat the units of measure reflect the quantum of services delivered.
Source: ACG 2002h.
Ideally, the measures developed should relate to the number of services provided,rather than the number of clients receiving a service. The benefit of a ‘service’rather than ‘client/child’ based approach is that it provides a more robust estimate ofthe actual quantum of services provided. This is because a proportion of clients arelikely to receive the same service more than once in a year; for example, be thesubject of more than one court order.
The availability of data reporting the number of services depends on the jurisdictioninformation systems, which vary widely in terms of the information they hold and
56 NATIONALREPORTING METHOD
the difficulty of accessing that information. In many instances, only the ‘client’based measures were available. While use of a ‘client’ measure will under-estimatethe number of services provided by the jurisdiction, it is preferable to no data andcan be improved over time.
Table 5.1 details the service delivery information developed for this project.Appendix B details the manner in which data were collected against these measures.
5.3 Deriving pathway efficiency indicators
The final stage in the national reporting method is to derive the pathway efficiencyindicators for each jurisdiction. This involves steps six and seven in figure 5.1.
Step six — Calculate the unit cost for each activity group
The objective of this step is to calculate the unit cost of delivering the bundle ofservices represented by each activity group. The presumption is that each clientreceives the average level or quantum of services.
To calculate the unit expenditure per activity group requires dividing the totalexpenditure per activity group (identified in step four) by the total number of unitsof service delivered per year (identified in step five).
Step seven — Calculate the pathway efficiency indicators
The objective of this step is to estimate the expenditure used to provide a typicalclient with the bundle of services on a pathway in that financial year.
The calculated pathway efficiency indicator represents the average cost togovernment of providing a ‘representative’ client with the bundle of servicesdefined by that pathway in a financial year. Each representative client is assumed toreceive the same average level of service for each activity in the pathway.
To calculate the pathway efficiency indicators involves summing the appropriateper unit activity costs calculated in the step six. For example, pathway two involvesactivity groups one and two. The pathway two efficiency indicator would be thesum of the unit cost for activity group one and the unit for cost activity group two.
NATIONALREPORTING METHOD
57
Table 5.1 Service delivery information and primary data sources
Activitygroup
Description Proposed measure Primary datasource
1 Receipt and assessment of initialinformation about a potentialprotection or support issue
Number of reports ofconcerns
Jurisdiction
2 Provision of initial family supportservices
Number of initial familysupport services
Jurisdiction
3 Provision of intensive familysupport services
Number of intensive familysupport services
Jurisdiction
4 Secondary information gatheringand assessment
Number of secondaryassessments
AIHW andJurisdiction
5 Provision of short-termprotective intervention andcoordination services
Number of clients receivingshort-term protectiveintervention andcoordination services
AIHW andJurisdiction
6 Seeking a court order Number of court orders AIHW andJurisdiction
7 Provision of longer-termprotective intervention, supportand coordination services
Number of clients receivingprotective intervention andsupport services long-term
Jurisdiction
8 Provision of out-of-home careservices Number of children
accessing kinship care‘plus’Number of childrenaccessing foster careplusNumber of childrenaccessing residential/facility based care
Jurisdiction
8a Provision of kinship careservices
Number of childrenaccessing kinship carea
Jurisdiction
8b Provision of foster care services Number of childrenaccessing foster careb
Jurisdiction
8c Provision of residential/ facilitybased care services
Number of childrenaccessing residential/facility based carec
Jurisdiction
a Data were also requested on total number of weeks of kinship care. b Data were also requested on totalnumber of weeks of foster care. c Data were also requested on total number of weeks of facilitybased/residential care.
Source: ACG 2002g.
58 NATIONALREPORTING METHOD
DATA AVAILABILITY,COMPARABILITY &INTERPRETATION
59
6 Data availability, comparability andinterpretation
This chapter discusses the conceptual issues around the availability, comparabilityand interpretation of the financial and service delivery information currentlyavailable in jurisdictions. Section 6.1 reports on the availability of the financial andservice delivery information. Section 6.2 considers comparability of the data acrossjurisdictions. Section 6.3 considers interpretation of the pathway costs.
6.1 Availability
An objective of the project was to develop a framework that could be used byjurisdictions to calculate efficiency indicators. Hence, an important consideration inthe development of the pathways approach was the availability of the data uponwhich the efficiency indicators would be calculated. This section discusses issuesaround the availability of data, considering first financial information and thenservice delivery information.
Financial information
Jurisdictions have been reporting financial information for inclusion in the Reporton Government Services since the initial report was published in 1995. Thisinformation covered the service delivery areas of child protection and out-of-homecare.
At the highest level, all jurisdictions were able to identify the relevant financialinformation for the currently reported aspects of service delivery — child protectionand out-of-home care.
However, as noted previously in this report, the inclusion of family support servicesin the project broadened the existing scope of reporting. Not surprisingly, financialinformation pertaining to family support services was generally not as readilyavailable as information on child protection and out-of-home care services. In alljurisdictions it was necessary to establish the family support programs within (either
60 DATA AVAILABILITY,COMPARABILITY &INTERPRETATION
totally or partially) and outside the scope of the project, prior to establishing thefinancial information for family support activities.
A second major change in financial information requirements was for out-of-homecare services. This activity accounts for a substantial proportion of total expenditureon protection and support services. The project developed more disaggregated out-of-home care indicators than those currently included in the Report on GovernmentServices.
The process of identifying and allocating financial information was, in some cases,assisted by a jurisdiction’s approach to service delivery. For example, somejurisdictions have centralised intake functions that operated as a separate costcentre. Thus, the cost centre could be entirely allocated to activity group one. Asimilar situation existed in a number of jurisdictions with specialised court units.
Another factor that assisted some jurisdictions to identify the relevant financialinformation was the structure of their cost centres. For example, some jurisdictionshad cost centres that reflected the kinship, foster and residential/facility based caresplit in activity group eight. In this circumstance the cost centres and hencefinancial information could be mapped directly into relevant activity groups.
The extent to which service delivery arrangements and financial informationsystems were aligned with activity groups varied across jurisdictions. This wasanticipated and was one of the major reasons for adopting activity based costing(ABC), which does not require that financial information be maintained in a waythat matches activities (see chapter 2).
Despite the expanded scope of reporting, and the need to rely on a number ofestimates and assumptions, most of the financial information required to estimatepathway costs was available in the majority of jurisdictions (see table 6.1).
Service delivery information
There is a strong history of jurisdictions reporting child protection and out-of-homecare client data to the Australian Institute of Health and Welfare (AIHW) for thepurpose of national reporting. Detailed data are reported for the areas of (the yearsin brackets indicate the first year the data was reported by the AIHW):
• Notifications, investigations and substantiations (1990-91);
• Care and protection orders (1995-96); and
• Out-of-home care (1996) (AIHW 2001b and personal communication).
DATA AVAILABILITY,COMPARABILITY &INTERPRETATION
61
Table 6.1 Availability of financial information
Activity GroupsJurisdiction Data forthe year
1 2 3 4 5 6 7 8Aa 8Ba 8Ca
New South Wales 2001-02 ✓ ✓ ✓ ✓ ✓ ✓ ✓ ✓ ✓ ✓
Victoria 2000-01 ✓ ✓ ✓ ✓ ✓ ✓ ✓ ✓ ✓ ✓
Queensland 2001-02 ✓ ✓ ✓ ✓ ✓ ✓ ✓ ✓ b ✗ ✗
Western Australia 2001-02 ✓ ✓ ✓ ✓ ✓ ✓ ✓ ✓ b ✗ ✗
South Australia 2000-01 ✓ ✓ ✓ ✓ ✓ ✓ ✓ ✓ ✓ ✓
Tasmania 2001-02 ✓ ✓ ✓ ✓ ✓ ✓ ✓ ✓ ✓ ✓
Australian Capital Territory 2000-01 ✓ ✓ ✓ ✓ ✓ ✓ ✓ ✓ ✓ ✓
Northern Territory 2000-01 ✓ ✓ ✗ ✓ ✓ ✓ ✓ ✗ c ✓ c ✓
a For activity group eight: 8A represents kinship care, 8B represents foster care and 8C representsfacility/residential care. b These jurisdictions could not provide a breakdown of financial information by type ofcare. The financial information provided pertains to all three types of care. c The financial information reportedas 8B refers to kinship care and foster care expenditure.
Three of the final service delivery measures adopted in the project were consistentwith the current AIHW collection (although a number of the other measures couldbe derived from AIHW data).
Jurisdictions generally experienced greater difficulty reporting service delivery thanfinancial information. The increased difficulty was anticipated in the developmentof the final service measures (ACG 2002g). This difficulty arises because of thenature of existing information systems. Data availability is constrained by scope ofdata recorded in jurisdictions’ information systems. Even if the necessary data arecaptured, the technical design of the system or skills of users may mean that thedata cannot be easily be extracted in a usable format. In most instances, the ‘client’based information will be available, rather than the preferred ‘service’ basedinformation. As noted in chapter 5, while use of a ‘client’ measure will under-estimate the number of services provided by the jurisdiction, it is consideredpreferable to no data.
Identifying the service delivery measure for the initial point of contact with arelevant agency caused problems for some jurisdictions. This is because systems aredesigned to record only those contacts with clients where specific further servicesare provided. Thus, more simple contacts seeking brief information orstraightforward referrals are not recorded.
Tasmania and the NT considered that it was not possible to undertake accurateestimates of the number of initial contacts made with their agency given thislimitation. These jurisdictions were unable to provide service delivery informationfor activity group one (see table 6.2). Part of the difficulty experienced in thesejurisdictions is that contact is made with regional offices — making the process of
62 DATA AVAILABILITY,COMPARABILITY &INTERPRETATION
estimation complex and time consuming. In contrast, jurisdictions where allcontacts were counted as notifications or where intake was centralised, did not havethe same difficulties reporting service delivery information for the activity group.
As with financial information, the currently reported data does not include familysupport services. Thus, obtaining service delivery information for family supportrequired jurisdictions to estimate or seek advice of experienced practitioners or thenon-government organisations (NGOs) involved in service delivery. However,some jurisdictions considered that they were not in a position to undertake suchestimates and could not report service delivery information for activity groups twoand/or three.
Relative to family support service delivery information, jurisdictions had lessdifficulty reporting data for the child protection activity groups (one, four, five, sixand seven). This seemed to reflect that a number of these measures were closelyaligned with data currently reported to the AIHW and that there are a number ofwell established ‘counting points’ on the child protection service continuum.
Obtaining out-of-home care service delivery information was an area where somejurisdictions had difficulty reporting data at a dissaggregate level. As with thefinancial information, such difficulties reflected that the data are not currentlyreported nationally at this level, and to some extent, because of the difficulty inobtaining data on the quantum of services provided by NGOs.
The availability of services delivery information by jurisdictions is represented intable 6.2.
Table 6.2 Availability of service delivery information
Activity GroupsJurisdiction Data forthe year
1 2 3 4 5 6 7 8Aa 8Ba 8Ca
New South Wales 2001-02 ✓ ✓ ✓ ✓ ✓ ✓ ✓ ✓ ✓ ✓
Victoria 2000-01 ✓ ✓ ✓ ✓ ✓ ✓ ✓ ✓ ✓ ✓
Queensland 2001-02 ✓ ✗ ✓ ✓ ✓ ✓ ✓ ✓ ✓ ✓
Western Australia 2001-02 ✓ ✗ ✓ ✓ ✓ ✓ ✗ ✓ ✗ ✗
South Australia 2000-01 ✓ ✓ ✓ ✓ ✓ ✓ ✓ ✓ ✓ ✓
Tasmania 2001-02 ✗ ✗ ✓ ✓ ✓ ✓ ✓ ✓ ✓ ✓
Australian Capital Territory 2000-01 ✓ ✓ ✓ ✓ ✓ ✓ ✓ ✓ ✗ ✗
Northern Territory 2000-01 ✗ ✗ ✗ ✓ ✓ ✓ ✗ ✗ ✗ ✗
a For activity group eight: 8A represents kinship care, 8B represents foster care and 8C representsfacility/residential care.
DATA AVAILABILITY,COMPARABILITY &INTERPRETATION
63
6.2 Comparability
The ultimate objective of the project was to develop improved efficiency indicatorsfor the purposes of national reporting. One aspect in which the current indicatorswere to be improved was by increasing the comparability of efficiency indicatorsacross jurisdictions. This section considers:
• the factors that impact on data comparability across jurisdictions; and
• issues of comparability for each activity group.
Factors that impact on comparability
Three general factors have the potential to impact on comparability of efficiencyindicators across jurisdictions.
The first and possibly most fundamental was ensuring that the indicators wereactually capturing the same services across jurisdictions. For example, it is welldocumented that the term ‘notifications’ is associated with quite different points inthe service continuum across jurisdictions (see chapter 3). Hence a ‘notifications’efficiency indicator would not have a high level of comparability acrossjurisdictions as it would not be measuring the same activities.
A premise of the project was to group the activities that jurisdictions deliver toclients, as these are similar, and hence provide a strong basis for comparison acrossjurisdictions. The project established the eight activity groups of the pathwaysmodel in stage one. In stage two it was important that the jurisdictions incorporatedthe same services within activity groups — that is, jurisdictions did not excludeservices that should be in an activity group and did not include services that shouldnot be in an activity group. In the course of calculating the trial pathway costs (seechapter 7), attention was given to assisting jurisdictions to achieve consistencywhen including, excluding and allocating particular services to activity groups.
The second general comparability issue was the extent to which agencies, other thanthe relevant agency, provided protection and support services at less than full cost.For example, in SA, legal services are provided by the Crown Solicitor and somefamily support services are provided by other government agencies. Similarly, itwas possible that in some jurisdictions, not-for-profit NGOs providing protectionand support services were providing such services at less than full cost.
Third, it was recognised that the resources that jurisdictions allocated to the processof collecting and verifying financial and service delivery information would impacton comparability. This was because the lower the level of resourcing, the less
64 DATA AVAILABILITY,COMPARABILITY &INTERPRETATION
opportunity to seek out all potential sources of information and to verify data. Thiswas a particular issue in the calculation of the trial pathway costs, as the informationrequired for the trial was in addition to the regular annual data collection for theReport on Government Services.
In addition to the three general factors that impacted on comparability (as set outabove), the comparability of the pathway costs also depended on the comparabilitybetween activity groups. Each activity group had specific issues around thefinancial and/or service delivery information. The comparability issues of eachactivity group are discussed in turn.
Activity group one — Receipt and assessment of initial information about apotential protection or support issue
In the development of the pathways framework, attention was given to establishinginclusions and exclusions for the ‘intake’ activities that make up this activity group.
A difficulty with the activity group was that Tasmania and the NT were not able toreport service delivery information to calculate the trial pathway costs. However, itwas anticipated that this would change over time.
For jurisdictions that did report service delivery information for activity group one,NSW, SA and the ACT were able to include data estimating the number of childprotection and family support concerns, while Victoria, Queensland and WA couldnot separately report the number of child protection concerns and the number offamily support concerns. The inability to separately identify family supportconcerns may result in under-reporting of the service delivery information.
In addition to excluding the number of family support concerns, WA’s data foractivity group one is also affected by the fact that it includes only notifications ofabuse and neglect and does not include data on the number of concerns aboutchildren nor contacts relating to family support matters. This means that this activitygroup one service delivery information in WA is definitely under-reported. Basedon additional data provided by WA on the number of concerns about children, itappears that the unit cost measure is overstated by more than 100 per cent, beforeaccounting for any contacts made about family support matters. WA indicated thatthe numbers of child concerns and family support matters could be included inactivity group one in future years.
DATA AVAILABILITY,COMPARABILITY &INTERPRETATION
65
Activity group two — Provision of initial family support services
The issues in the development of activity group two are described in chapter 4 andappendix B. These issues meant that the comparability of activity group two acrossjurisdictions was more limited than comparability evident in other activity groups.
It was anticipated that the comparability of activity group two across jurisdictionswould improve over time if more detailed counting rules were developed and if theavailability and quality of information — particularly for data on the quantum ofservices — was improved.
Activity group three — Provision of intensive family support services
The comparability issues for activity group three were not as great as for activitygroup two. This was because the financial and service delivery information werebased in large part on data that were already contained in the Report on GovernmentServices. The NT was unable to report financial or services delivery information forthe purpose of the trial.
The comparability of activity group three across jurisdictions is expected to improveover time as the counting rules are refined and as the availability and quality ofinformation available to jurisdictions on the quantum of services delivered isimproved.
It may emerge, however, that comparability is somewhat restricted by the differinginstitutional arrangements for service provision within jurisdictions. The approachin this project is to include only those activities that are provided by the principalagencies responsible for protection and support matters (see chapter 3). In at leastone jurisdiction, SA, some services that are consistent with the definition ofintensive family support services are provided by a government agency that is notthe principal agency. Thus, SA has not included financial or service deliveryinformation for those intensive family support services such as therapeuticinterventions with children and families, that are delivered by health agencies.
Activity group four — Secondary information gathering and assessment
The AIHW data on investigations formed the basis of the service deliveryinformation for activity group four. To assist with comparability, the servicesdelivery information for this activity group took account of the fact that somejurisdictions undertake information gathering and assessment activities that are notrecorded as investigations for the purpose of reporting to the AIHW.
66 DATA AVAILABILITY,COMPARABILITY &INTERPRETATION
There were no specific comparability concerns with financial or service deliveryinformation of activity group four.
Activity group five — Provision of short-term protective intervention andcoordination services
To facilitate a high level of comparability, particular attention was given to thereporting of service delivery information for activity group five.
The starting point of the service delivery information for activity group five was theAIHW ‘number of substantiations’. This measure was selected based on the strongrelationship between substantiations and the provision of short-term protectiveintervention and coordination services to clients.
However, comparability across jurisdictions was increased by recognising that somejurisdictions provide short-term protective intervention and coordination services toclients without necessarily making a ‘substantiate’ decision. Thus, Queenslandservice delivery information for activity group five included both the AIHWreported substantiation figure as well as the number of additional equivalentservices.
An adjustment would also be made to the AIHW reported substantiation figure inthe jurisdictions where it was possible for a ‘substantiation’ to be recorded, butwhere no further services might be provided. This could be the case if, for example,an event that was assessed as being unlikely to occur again was substantiated. TheACT was the only jurisdiction to incorporate data on the number of substantiationswhere no further services were provided in its service delivery information foractivity group five.
Activity group six — Seeking a court order
The basis of the services delivery information for activity group six, seeking a courtorder, is the AIHW reported figure of ‘number of care and protection orders issued’.From an efficiency perspective, the relevant measure is how many orders weresought (including those granted and not granted). Jurisdictions were also asked toidentify orders sought but not granted.
Victoria, Queensland, and the ACT were able to report data on the number of courtorders sought but not granted. However, NSW, SA and Tasmania were not able toreport on the number of court orders sought but not granted. The impact is that theservice delivery information for NSW, SA and Tasmania were lower than they
DATA AVAILABILITY,COMPARABILITY &INTERPRETATION
67
would otherwise be. The NT did not report service delivery information for activitygroup six.
The service measure also requested that jurisdictions identify the number ofadministrative arrangements and voluntary care orders for the purpose of excludingthem from the data. The ACT was the only jurisdiction to report data on the numberof administrative arrangements and voluntary care orders. NSW, Victoria,Queensland, SA and Tasmania were not able to identify and exclude the number ofadministrative arrangements and voluntary care orders. As a result, data for thesejurisdictions may over-estimate the number of court orders sought.
In relation to financial data, as noted earlier in the general discussion aboutcomparability, in SA, the Crown Solicitor provides legal services utilised by therelevant agency when seeking court orders and there is no transfer of funds betweenthe government agencies. For SA, the efficiency cost for activity group six will notbe comparable to the jurisdictions where legal fees are incurred and paid out of aprotection and support agency’s budget.
Activity group seven — Provision of longer-term protective intervention, supportand coordination services
There appear to be no significant comparability issues with activity group seven,although, WA had difficulty in allocating expenditure between activity groupsseven and eight. The majority of activity group seven expenditure is captured as‘care of children’ type expenditure in WA, and has been reported as activity groupeight expenditure for the trial data collection. Given that over two thirds of thechildren in out-of-home care in WA at any one time are on care and protectionorders, and that the majority of these orders are more than one year in length, it isanticipated that allocation of expenditure between activity groups seven and eightwill substantially change in future years.
Activity group eight — Provision of out-of-home care services
The disaggregated out-of-home care information for kinship, foster andresidential/facility based care, reflect the range of out-of-home care servicesdelivered and hence offer potential for increased comparability across jurisdictions.
All jurisdictions were able to report financial and service delivery information at theaggregate level (that is, all out-of-home care). NSW, Victoria, Queensland, SA andTasmania were able to report financial and service delivery informationdisaggregated by care type — kinship, foster or facility/residential. The ACTreported service delivery information at an aggregate level, and financial data at a
68 DATA AVAILABILITY,COMPARABILITY &INTERPRETATION
disaggregated level. The NT was able to report financial data disaggregated into twocomponents— kinship/foster care, and residential care — and did not report servicedelivery information. WA reported financial and service delivery information at anaggregate level.
Data on activity group eight are comparable. Improved availability of data at thedisaggregated level would support the future reporting of comparable disaggregatedout-of-home care delivery information.
Summary
The majority of activity groups were considered to be comparable. The exceptionswere activity groups two and, to a lesser extent, six.
Activity group two was the activity group where comparability was considered tobe lowest across jurisdictions. The implication is that if no further refinement ofactivity group two is undertaken, prior to reporting pathway costs as efficiencyindicators, the pathways costs that include activity group two would need toacknowledge comparability as an issue.
For activity group six, the intra-government approach used in SA meant that legalcosts incurred seeking protection and support court orders were not incurred by therelevant agency. In the strict sense of the project scope, costs incurred outside therelevant agency were not relevant. However, for comparability purposes it wasimportant to acknowledge this as a potential source of a cost difference.
6.3 Interpretation
The ultimate objective of the project was to develop improved efficiency indicatorsfor the purpose of national reporting. The efficiency indicators developed were thecosts of delivering the services on the eight pathways described in chapter 4. Eachpathway represented a different combination of activities (or services). The eightpathways were determined in stage one of the project and were considered to be ahigh level representation of services that a ‘representative’ protection and supportclient could receive in any jurisdiction in Australia. The Working Group agreed thatthe eight national pathways reflect the most common combinations of servicesreceived by protection and support clients.
Stage two of the project involved the development of a method to cost the pathwaysin a way that recorded the inputs used by each jurisdiction to deliver the specificservices (defined in the activity groups) to clients. Each pathway cost relates inputs
DATA AVAILABILITY,COMPARABILITY &INTERPRETATION
69
to outputs and thus can be taken as an indicator of efficiency. Within the limitationsof the method and the data, a higher pathway efficiency indicator means that ajurisdiction is utilising relatively more resources to deliver a similar bundle ofactivities than another jurisdiction.
The pathways are a hypothetical construct. The indicators have been developed toreport the expenditure of services provided to a ‘representative’ client that receivesan ‘average’ level of service delivery. As often identified in meetings withjurisdictions, a child or young person’s experience of protection and support servicedelivery is not typically linear. That is, over time children and young people spenddifferent amounts of time receiving services from a particular group of activitiesand over a period of time may receive services from a range of activity groups indifferent combinations and intensities. The actual bundle of services provided toany individual child and their family will be determined by the needs of the child oryoung person at a particular point in time, consistent with the legislation andpractice of the jurisdiction.
It is important to recognise that as an efficiency indicator concerned only withinputs and outputs, the pathway efficiency indicators take no account of outcomesor, therefore, of the effectiveness of service delivery. The Report on GovernmentServices publishes protection and support effectiveness indicators.
The pathways are ordered from least intrusive to more intrusive encounters in termsof the level of involvement with statutory services. Thus, the costs of the differentpathways provide an indication of the difference in expenditure for a client thatreceives initial support services and then exits the protection and support system aswell as the expenditure for a client involved in the ‘hard end’ statutory processesincluding court and out-of-home care. Jurisdictions expressed particular interest inbeing able to compare the expenditure of the alternative pathways.
Finally, each pathway efficiency indicator is calculated by summing the relevant perunit activity group costs. This detailed information will be useful in understandingthe factors contributing to differences in pathway costs across jurisdictions anduseful to jurisdictions analysing their own approaches to service delivery.
70 DATA AVAILABILITY,COMPARABILITY &INTERPRETATION
P A R T D
IMPLEMENTATION ISSUES
TESTING THE MODEL 71
7 Testing the model
An important objective of stage two of the project was to validate the model forcalculating pathway efficiency indicators using pilot data provided by jurisdictions.The detailed aims of testing the model were to:
• test the collection methods and instruments (see chapter 5);
• identify areas requiring clarification and further development; and
• provide jurisdictions with the opportunity to gather and compare trial datautilising the support available from the project consultants.
The main benefit to jurisdictions from completing the financial and servicemeasures data returns was to gain a ‘hands-on’ understanding of availability,comparability and interpretation issues described in chapter 6, and to identify issuesfor future development in chapter 8.
7.1 Trial data issues
The trial data allowed the method to be tested and helped identify areas forimprovement (see chapter 8). Jurisdictions were confident that the data providedwere adequate to meet the project objective to test the model. These data, however,had a number of issues which made meaningful assessment of jurisdictions’performance difficult. These issues include:
• the trial data were not fully comparable: Victoria, SA, the ACT and the NT wereable to provide data for 2000-01, while NSW, Queensland, WA and Tasmaniawere able to provide data for 2001-02. The choice of year for the pilot datadepended on which data was easiest to utilise. The reporting of data for differentyears had no bearing on the testing of the model to calculate pathway costs; and
• the data have not been subjected to rigorous quality control processes:jurisdictions indicated that their ability to provide information for the testingphase of the project was constrained due to limitations on resources. The impactof such resource limitations was that jurisdictions sometimes reported data basedon very high level assumptions, or on assumptions that had not been fully testedor that relied on dated information. As a result, trial data may not be the bestpossible representation of resources allocated across activities.
72 TESTING THE MODEL
In addition to the general reasons, there were a number of jurisdiction specificissues that meant the data provided were either not comparable or not a truerepresentation of the efficiency of service delivery. As a result of these limitations,the trial data are not reproduced in this report.
Implications for annual reporting
The two general issues described above are specific to the trial data. When thepathways approach is adopted as the national reporting framework of efficiencyindicators in the Report on Government Services, neither of the general issuesidentified above will be a problem because:
• all jurisdictions would be reporting data for the same financial year; and
• jurisdictions would have a longer time frame in which to gather and reviewinformation, and jurisdictions would be able to use the time that they currentlyallocate to the collection and reporting of protection and support efficiencymeasures for the collection and reporting of pathway efficiency measures. Theavailability of additional resources would improve the quality of the reporteddata.
7.2 Ability to report
This section summarises the ability of each jurisdiction to provide trial data usingtheir existing information systems.
Differences in the scope and/or inclusion/exclusion of specific expenditure items —along with differences in the methods used to allocate direct and indirect costs toactivity groups across jurisdictions — are discussed in chapter 6 and throughout theremaining sections of this chapter. Further, chapter 8 focuses on future issues withrespect to applying the national reporting method, and so includes a discussion of anumber of jurisdiction-specific developments that may impact upon the futurecollection of financial information.
Similarly, chapters 6 and 8 include discussions of the provision of service deliverymeasures information insofar as the extent of jurisdictional involvement in thecollection of data, and the degree to which data sourced from the AustralianInstitute of Health and Welfare, was relied upon.
TESTING THE MODEL 73
New South Wales
NSW was able to provide all financial and service delivery data subject to resourceconstraints and the review of its information management systems that was takingplace during the pilot. Given these constraints, the approach adopted for the pilotwas to allocate all costs (both direct and indirect) to direct cost categories. AlthoughNSW was able to provide all expenditure on protection and support activities, theapproach adopted for the pilot is likely to allocate expenditure across the variousactivity groups in different proportions than an allocation on a direct/indirect costbasis.
Victoria
Victoria was also able to provide all financial and service delivery data. Thisincluded the disaggregation of data on out-of-home care by type of care — foster,kinship and residential/facility-based.
Queensland
Queensland was able to provide all financial data. It was also able to provide servicedelivery data for all activity groups except activity group two (number of clientsreceiving initial family support services) which contributes to six of the eightpathways for Queensland.
In contrast to most other jurisdictions (that allocated their costs in accordance withthe method outlined in chapter 5 and Appendix B), Queensland undertook aninternal activity-based costing exercise in recent years and used this information tomap financial data to the activity groups developed in stage one of this project.Hence, the method of allocation differed to the method employed in most otherStates and Territories.
Western Australia
WA was able to provide most financial and service delivery data. WA could notprovide service delivery data for activity group two (number of clients receivinginitial family support services), nor could they provide data for activity group seven(number of clients receiving protective intervention and support services long term).WA was also unable to disaggregate its costs or service measures for out-of-homecare by type of care.
74 TESTING THE MODEL
Chapter 6 identified a number of detailed issues about data availability andcomparability, as follows:
• Activity group one service measure is under-reported hence the unit costmeasure is overstated by more than 100 per cent.
• WA indicated that they could easily provide service measures data for activitygroup seven in future years.
• WA had difficulty in allocating expenditure between activity groups seven, andeight and anticipated substantial change in the allocation between these twoactivity groups in future years.
WA indicated that during the testing phase, there were limited time and resourcesavailable for the project and the Department was undergoing change. As a result,the data provided were derived from high level estimations and were unlikely toprovide an accurate indication of how the Department delivers services from afinancial viewpoint. As such, it would be inappropriate to draw conclusions aboutefficiency or patterns of expenditure in WA based on the pilot data. This being thecase, the results for WA have been omitted from this publication .
WA noted that a more rigorous approach would be possible for future data returnsafter the organisational change has been completed. A specific issue identified forfurther work was the time allocation used by WA as it was based on a dated surveywith limitations such as not including staff in specialist and central office positions.
South Australia
SA was able to provide all financial and service delivery data. This included thedisaggregation of data on out-of-home care by type of care — foster, kinship andresidential/facility-based.
There were no significant qualifications relating to SA data, with both the financialand service delivery information collections being completed in accordance with therecommended approach. It should, however, be noted that the financial and servicedelivery information reported is based on high level estimations of the allocation ofresources across activities. A component of the allocation process was based onwork undertaken a number of years ago for a different purpose. SA noted that if thepathways approach was adopted they would need to consider significant changes tocurrent recording systems to allow routine reporting.
TESTING THE MODEL 75
Tasmania
Tasmania was able to provide all financial measures data, but limited servicedelivery data. Tasmania could not provide data for activity group one (number ofinitial reports of concern), nor could they provide an estimate for activity group two(number of clients receiving initial family support services).
There were no significant qualifications relating to Tasmania’s data, with both thefinancial and service delivery information collections being completed inaccordance with the recommended approach. Due to resource limitations, however,the allocation of financial information was undertaken at a high level.
Tasmania noted that ‘output is not reflective of actual expenditure’ — that is,although at the highest level Tasmania’s expenditure data represents actualexpenditure, the allocation of this data across activity groups may not accuratelyrepresent the expenditure actually incurred in undertaking those activities. This islikely to be the case in almost all jurisdictions to some degree given the level ofestimation involved in the allocation of expenditure to activity groups.
Australian Capital Territory
The ACT was able to provide all financial and service delivery data. This includedthe disaggregation of data on out-of-home care by type of care — foster, kinshipand residential/facility-based.
There are no significant qualifications relating to the ACT’s data, with both thefinancial and service delivery information collections being completed inaccordance with the recommended approach. However, as noted at the presentationto the Working Group, as a jurisdiction with a small number of clients the impact offixed costs of providing protection and support services means that any cost perclient measure will be high relative to a jurisdiction with a large client base.
Northern Territory
The NT was able to provide most financial data including the disaggregation of dataon out-of-home care by type of care — foster and residential/facility-based care.The NT provides kinship care as part of their foster care program. However, unlikesome other jurisdictions, the NT does not fund and provide kinship care as adiscrete program which can easily be reported on separately.
The NT was able to provide only limited service delivery data which severelyrestricted the scope for calculating meaningful pathway costs.
76 TESTING THE MODEL
Data for activity group three (intensive family support services) were not providedbecause the NT does not provide or fund such services. Data for activity groupsone, two, seven and eight were not provided because it was not possible to extractthese data from the NT’s information systems, although the NT indicated that it islikely this situation will be rectified for future collections.
The NT allocated their indirect operational costs to activity groups based on theactivities of staff based in the Darwin urban area only. Thus, the time-basedallocation of indirect operational costs (to reflect resource intensity) does notaccount for rural/remote regions within the NT. Further, the NT submitted thatfamily support was largely underreported (partly due to the allocation methodsused) and would be concerned if these figures were to be utilised for comparativepurposes.
7.3 Activity group expenditure analysis
This section presents expenditure on activity groups as a proportion of totalrecurrent expenditure across jurisdictions. Total recurrent expenditure is the sum ofchild protection, out-of-home care and family support services expenditure.table 7.1 and figure 7.1 present expenditure on activity groups as a proportion oftotal expenditure in each jurisdiction. This data provides a base-line for jurisdictionsto assess the accuracy of their allocations across activity groups.
Table 7.1 Activity group expenditure as a proportion of total expenditure,by jurisdiction (per cent)a
a Figures based on 2000-01 data for Victoria, SA, ACT and NT. Figures based on 2001-02 data for NSW,Queensland, WA and Tasmania. b These jurisdictions could not provide a breakdown of financial informationby type of care. The financial information provided pertains to all three types of care for Queensland and WA.c Due to concerns regarding data quality, results for WA have been omitted. d The NT does not provide orfund intensive family support services. e NT data relate to foster and residential care only. The NT provideskinship care as part of their foster care program. However, unlike some other jurisdictions, the NT does notfund and provide kinship care as a discrete program which can easily be reported on separately. na Notavailable. .. Not applicable. np Not published.
Source: State and Territory Governments (unpublished).
TESTING THE MODEL 77
Figure 7.1 Proportion of total expenditure on activity groupa
Activity group oneb
0
3
6
9
NS
W Vic
Qld
WA
SA
Tas
AC
T
NT
Ave
.
Per
cen
t
np
Activity group twob
0
10
20
NS
W Vic
Qld
WA
SA
Tas
AC
T
NT
Ave
.
Per
cen
t
np
Activity group threeb
0
3
6
NS
W Vic
Qld
WA
SA
Tas
AC
T
NT
Ave
.
Per
cen
t
nana np
Activity group fourb
0
5
10
15
20
NS
W Vic
Qld
WA
SA
Tas
AC
T
NT
Ave
.
Per
cen
t
np
Activity group fiveb
0
5
10
15
20
NS
W Vic
Qld
WA
SA
Tas
AC
T
NT
Ave
.
Per
cen
t
np
Activity group sixb
0
3
6
9
12
NS
W Vic
Qld
WA
SA
Tas
AC
T
NT
Ave
.
Per
cen
t
np
Activity group sevenb
0
5
10
15
20
NS
W Vic
Qld
WA
SA
Tas
AC
T
NT
Ave
.
Per
cen
t
np
Activity group eightb, c, d
0
15
30
45
60
NS
W Vic
Qld
WA
SA
Tas
AC
T
NT
Ave
.
Per
cen
t
np
a Data for Victoria, SA, ACT and NT are for 2000-01. Data for NSW, Queensland, WA and Tasmania are for2001-02. b Due to concerns regarding the quality of data, results for WA have been omitted c Queenslandand WA could not provide a breakdown of financial information by type of care. d Data for the NT related tofoster and residential care only. The NT provides kinship care as part of their foster care program. However,unlike some other jurisdictions, the NT does not fund and provide kinship care as a discrete program whichcan easily be reported on separately. na Not available. np Not published.
Source: State and Territory Governments (unpublished).
78 TESTING THE MODEL
FUTURE DIRECTIONS 79
8 Future directions
The national reporting of protection and support efficiency measures takes placewithin the context of changing environments, both at jurisdiction and national level.Chapters 6 and 7 described the ability of jurisdictions to provide the financial dataand service measures information at the time of completing this project.
Over time, changes will occur that contribute to improved reporting. This isparticularly the case for upgrades and enhancements to jurisdiction financial andclient information infrastructure. Other changes, however, may create difficultiesfor national reporting. For example, a jurisdiction may continue to develop someaspect of service delivery that limits comparisons of financial and/or client dataacross different financial years.
As with all ‘future’ issues, there is no certainty as to the exact changes that willoccur (either within jurisdictions or at a national level) and how they might impacton national reporting for protection and support services. What is evident is thatchanges will occur that impact on information availability and comparability andthat the pathways model can be further developed and refined independently of, andin response to, such changes.
Section 8.1 of this chapter identifies on-going reforms and projects as well asanticipated changes that may impact on the availability and accuracy of the dataprovided by jurisdictions. Section 8.2 discusses a number of specific areas forfurther development in the implementation of the pathways framework. Section 8.3describes the scope for aligning national reporting requirements for servicemeasures.
8.1 Reforms, projects and anticipated changes
All jurisdictions have projects or reviews underway, or are in the process ofimplementing changes from recently completed reviews, that will impact on futurefinancial and/or client information collection. These projects or reviews include:
• NSW anticipates a number of major changes to out-of-home care when theprovisions of new legislation come into effect. There are a number of on-goingprojects taking place related to further development of data systems.
80 FUTURE DIRECTIONS
• Victoria is currently reviewing its home-based care program and has recentlycompleted a strategic review of child protection services.
• Queensland is developing a new set of activities and outputs in accordance withthe Australian Institute of Health and Welfare’s (AIHW) National Classificationof Community Services. This is expected to be completed by the end of 2002.
• In WA, the Department for Community Development is undergoing anorganisational change . It is anticipated that as a result of this change there willbe major ramifications for the way that services are delivered and measured, andalso in the way that financial information is collected and reported. TheDepartment is currently developing new legislation to replace the Child WelfareAct 1947, Welfare and Assistance Act 1961 and Community Services Act 1972,which is expected to be passed by Parliament by December 2003. A significantchange in the proposed legislation is the range of court orders that may be madeby the Children’s Court. This would have a significant impact on theDepartment’s current policies and procedures in relation to child protection andout-of-home care.
• In SA a major independent review of the legislation that governs the provisionof protection and support services is currently being conducted. This review isexpected to make recommendations that could potentially impact on currentservice delivery arrangements.
• There are a number of aspects of service delivery in Tasmania that are currentlysubject to review. Tasmania, for example, is moving to centralise its intakefunction. Also, the existing child protection classification structures of ‘childfamily concern’ and ‘child harm maltreatment’ are currently being reviewed,while another project is examining the funding methodology for out-of-homecare.
• The ACT is reviewing a number of aspects of service delivery, including aspecific Indigenous Foster Care Review.
• In the NT, there is an Internal Management Group that is identifying future datacollection requirements and developing a strategic plan about the best way tomeet these requirements.
8.2 Issues for further review and development
It is expected that the detailed approach to costing the pathways will be refined overtime. The process of testing the pathways model identified a number of specificissues that could usefully be subject to further review. The specific issues were:
• refining some counting rules;
FUTURE DIRECTIONS 81
• further exploring the extent of recorded information and the limitations ofinformation infrastructure in jurisdictions; and
• reviewing time allocations used to allocate financial resources to activity groups.
These issues are discussed in turn.
Refining counting rules
Counting rules provide guidance for jurisdictions in the process of reportingfinancial and service delivery information. It is vital that jurisdictions have acommon understanding of the counting rules, as the degree to which data can becompared across jurisdictions is dependant on the consistent implementation ofcounting rules. This section discusses a number of specific opportunities for furtherrefinement of counting rules.
The AIHW made the general comment that it would be reasonable to expect that,over time, counting rules will be refined and developed to reflect changes in theexternal environment.
Following the discussion in section 6.2, a specific area where there would be benefitin further immediate attention to the counting rules is for activity group two, initialfamily support services (see chapter 6). Some Working Group members alsoexpressed a concern about the need for further development of counting rulesapplying to ‘intensive family support services’.
The counting rules for the service measures for activity groups five and seveninvolve establishing ‘counting points’ in a service delivery continuum. Thisapproach differs from the service delivery approach where services are determinedon a case-by-case basis and thus vary considerably in terms of scope of servicesprovided and the length of time that a client is involved in the service. The servicemeasures establish counting points to capture the number of times the ‘bundle ofservices’ is provided in a financial year. They are not trying to count the number ofdistinct clients. The use of ‘substantiations’ and ‘court orders’ as the basis of theservice measures for activity group five and seven respectively, are intended toprovide a clear guide to jurisdictions reporting data. There was still some concernexpressed about the use of ‘services’ based measures rather than ‘client’ basedmeasures. There may be benefits if the Working Group discussed this issue toensure a common understanding and acceptance of these measures.
For activity group six, one jurisdiction noted that a client can be on multiple ordersand that it is possible to apply for, and be granted, multiple orders in one courtappearance. In discussion, it was acknowledged that each order requires separate
82 FUTURE DIRECTIONS
reports and applications, hence applying for two orders in one court attendance doesrequire more resources than applying for one order. However, there is substantialvariation in the average number of court orders per client across jurisdictions. Forexample, in 1999-00 the ratio of children admitted to orders to the number of ordersissued ranged from a low of 1:1.2 (in NSW, Victoria and Western Australia) to ahigh of 1:6.0 (in Tasmania) (AIHW, 2001 p. 30). The Working Group couldconsider this issue further, in any future refinements to this measure.
Another specific area for potential development are the counting rules surroundingthe different options for out-of-home services. The trial pathway costs requestedinformation from jurisdictions for kinship, foster and facility/residential care. Asevident in chapter 6, not all jurisdictions were able to report at the disaggregatedlevel. A future issue for the Working Group could be to consider adding a ‘period ofresidence’ dimension to this activity group; say, respite, medium and long-termcare.
Information infrastructure
A number of jurisdictions had difficulty reporting data, due to limitations ofinformation infrastructure. For example, for activity group one, Tasmania’sinformation infrastructure can provide a measure of all telephone contacts madewith the Department. This, however, included many contacts that are not related toprotection and support services. It was envisaged that the introduction of centralisedintake would allow reporting of the service measure for activity group one.
Many jurisdictions indicated that there were likely to be changes to theirinformation systems in future years. Some of the changes identified by jurisdictionsin the course of consultation included:
• NSW has recently redeveloped its financial reporting arrangements and work iscontinuing in a number of areas on further enhancements to informationinfrastructure.
• Subject to budget, there is a planned upgrade of Tasmania’s protection andsupport information infrastructure.
• The ACT indicated that their client database, the Children and Young PersonsSystem (CHYPS), is subject to ongoing development.
• For the purpose of the project, the NT was unable to extract information onservice measures that was not already reported to the AIHW. However, subjectto resource availability, the information infrastructure could be further enhancedto extract additional service measures data.
FUTURE DIRECTIONS 83
It seems reasonable to assume that such changes are likely to increase the capacityof jurisdictions to provide data, particularly if that data are required for the purposesof national reporting.
Reviewing time allocations
As resource use can vary across activities over time, it is important that the timeallocations that underpin the allocation of some financial information remainrelevant. The project method proposes that jurisdictions’ time allocations bereviewed in one year’s time.
Most jurisdictions indicated that due to the timing of the pilot the resourcesavailable for providing the trial data were limited. They felt that greater resourceswould need to be available to gather information for collecting and refining data ifthe national reporting method were adopted. The increased resource availability, aswell as a number of jurisdiction specific projects, may potentially improve thequality of time allocations. For example:
• NSW has engaged consultants to conduct a survey over three months on timeuse.
• Queensland is implementing a new activity based costing framework whichcould have flow-on effects for the time allocation which is implicit in such aframework.
• WA indicated that the time allocation used in the trial pathway costs was basedon a dated survey with limitations, for example, not including staff in specialistand central office positions. WA indicated that additional work on timeallocation issues would be necessary if information on time allocation wererequired for the purposes of national reporting.
• ACT is conducting a management review on how time is being allocated acrossvarious activities.
For these jurisdictions, there could be a significant impact on the time allocationsfrom the trial pathway costs to an initial pathways approach to national reporting.
8.3 Aligning national data collections
A number of jurisdictions noted that if the Steering Committee for the Review ofCommonwealth/State Service Provision endorsed the use of the frameworkdeveloped in the project, there would be benefit for jurisdictions in aligning the
84 FUTURE DIRECTIONS
AIHW national collection of protection and support services client information withthe service measures information required to calculate pathway costs.
The National Child Protection and Support Services, under the auspice of theCommunity Services Ministers’ Advisory Council, has been reviewing theframework used to collect the national child protection data. The aim of this reviewwas to establish the feasibility of updating the national reporting framework so thatthe national data:
• more accurately reflected the current responses of States/Territories to childprotection and child concern reports;
• presented a more comprehensive data set; and
• increased the consistency and comparability of the data reported upon.
A new framework for collecting national data has been agreed to by alljurisdictions. National reporting will be aligned to this framework over the next fewyears. This will include the development of a national minimum dataset and a datadictionary.
This new framework incorporates much of the client information required for thenational pathways. The information required for the national pathways can alsoinform the development of specific data items for the new child protection nationalminimum dataset. The AIHW’s view is that most of the client information for thenational pathways will be collected each year as part of the annual data collectionprocess.
P A R T E
APPENDICES
PROJECTCONSULTATION
85
A Project consultation
This appendix identifies details of consultations that took place in the course of theproject. It identifies the people in jurisdictions who participated in meetings andteleconferences and provided or reviewed information. It also documents attendanceat the project workshop held on 13 August 2002 and a presentation held on13 November 2002.
Consultation with jurisdictions
Table A.1 Consultation with jurisdictions
Person Position
New South WalesToni MilneProject Owner
Executive Director, Corporate Strategy,Department of Community Services
Kate Southam (WorkingGroup Member)
Team Leader Information Management,Corporate Strategy Directorate, Department ofCommunity Services
Robert Oliver (WorkingGroup Member April-July)
Manager Corporate Performance
Stephen Gal (WorkingGroup Member (August–October)
A/Manager Corporate Performance, Departmentof Community Services
Ian Clarke Senior Project Officer, Corporate PerformanceUnit
David Cheney Consultant, Finance DirectorateBill Bastock Finance and Admin. Manager, Finance
DirectorateBelinda Holding Financial Systems Officer, Finance DirectorateMark Galvin PriceWaterhouseCoopersVirginia Connor Executive OfficerCora Ingram Project Manager Child Protection, Child and
Family Services DirectorateMarie Wighton Senior Project Officer, Child and Family Services
DirectoratePhil Smith Principal Policy Officer, Child and Family
Amanda Foran Project Manager, NaamoraMike Vanderley A/Manager Community Services Grants Program,
Partnerships and Communities DirectorateVictoria
Alan HallProject Owner
Director Research, Budget & Program SupportCommunity Care Division
John Prent (Working Group) Manager, Research and Web ServicesGill Callister Director, Child Protection and Juvenile Justice
BranchBrenda Whitmore-Seidel Manager, Budget and Program SupportPaul Perversi Manager Information Management and AnalysisLinda Gerdtz Manager, Protective Services Strategic Planning,
Child ProtectionJanice Roberston Manager, Service Development Unit, Child
ProtectionJoanna Breen Acting Child Protection ManagerJenny Willox Policy and Program Advisor, Family and
Individual Support, Family & Community SupportTim Willmot Manager, Planning and Service Innovation,
Family and Community SupportPaul Mountney Project Officer, Family and Community SupportPeter GrossmanPeter GreenAri Sabapathee
QueenslandAndrew DavisProject Owner
Executive Director, Children, Families and YoungPeople Department of Families
Tracey Smith (WorkingGroup Member)
Child Protection Branch, Department of Families
Deb Partridge Director, Information Services Branch, Departmentof Families
Linda Clark Finance and Asset Management Branch,Department of Families
Ann Miller Families, Youth and Community Branch,Department of Families
Claire Tilbury Child Protection Branch, Department of FamiliesJulie Bray Child Protection Branch, Department of FamiliesJane Thorpe Child Protection Branch, Department of FamiliesCarol Strawbridge Child Protection Branch, Department of FamiliesKathy Masters Child Protection Branch, Department of FamiliesPam Phillips Child Protection Branch, Department of FamiliesClaire Gardiner-Barnes Information Management Unit, Department of
Families
Continued next page.
PROJECTCONSULTATION
87
Table A.1 (continued)
Person Position
Richard Rubendra Performance Measurement and Analysis Unit,Department of Families
Belinda Hersey Child Protection Branch, Department of FamiliesDesley Murphy Grants Administration Unit, Department of FamiliesVicky Mann Statistical Services Unit, Department of FamiliesAngelo Vecchio Statistical Services Unit, Department of FamiliesSue Smith Child Protection Branch, Department of FamiliesDoylys Hartridge Statistical Services Unit, Department of FamiliesLyn ConwayCathy Marksis
Western AustraliaPaul BirchallProject Owner
A/Executive Director, Industry Design & ServiceSpecification, Department for CommunityDevelopment
Malcolm Tsang (WorkingGroup Member)
A/Senior Information Officer
Ian Allen Senior Legal OfficerAlison Braid Team Leader Narrogin OfficeMark Crake Principal Service Design OfficerJulie Dixon Senior Service Design OfficerMaria Djulbic A/Service Delivery Manager, Rockingham OfficeMaurice Hanrahan Senior Cost AccountantDawn Lamperd Senior Casework Supervisor, Northam OfficeHarold Luxton Senior Service Design OfficerRichard Mathews A/Director Service DevelopmentPeter McGlynn Principal Planning and Policy OfficerAndrea Nixon Service Delivery Manager, Cannington OfficeMarilyn Treacey Senior Service Support OfficerJudy Wilkinson Manager Legislation Project
South AustraliaFiona WardProject Owner
A/Regional Director, Family and Youth ServicesDepartment of Human Services
Ros Wilson (Working GroupMember)
A/Principal Project Leader
Cathy Heinrich Manager, Aberfoyle Park District CentreJulie Glover Senior Project OfficerPaul Searston Senior Project OfficerRoger McCarron Manager, Crisis Response and Child Abuse ServiceGeorgene Rothney Senior Practitioner, Riverland District CentreCatherine Wood Senior Practitioner, Adelaide District CentreAnne Nicolaou Principal Social WorkerJoe Walker Manager, FAYS Data SystemsBridgitte Matthews Manager, FAYS Info SystemsAlexandra Bates Business Analyst, FAYS
Continued next page.
88 PROJECTCONSULTATION
Table A.1 (continued)
Person Position
TasmaniaVicki RundleProject Owner
Divisional Director, Child and Families, Departmentof Health and Human Services
Helen Stone (Working GroupMember)
Policy and Project Officer, Children and Families
David Fischmann A/Manager, Child & Family Services (byteleconference)
Marlene Horne Senior Practice Consultant, Southern ServiceCentre
Lillian Haines Project Manager, Funding of Out of Home CareMarja Elizabeth Manager, Child Protection Assessment and Referral
ServiceSimone Duncombe Manager Business OperationsKathy Bergin Information Systems OfficerBill Smith Statewide Manager, Child & Family ServicesScilla Weber Team Leader, Child & Family Services Support UnitSally Christensen Budget AnalystLee-Ann Russell Acting Manger, Business Operations
Australian Capital TerritoryBarbara BaikieProject Owner
Director, Family Services, Department of Educationand Community Services
Lisa Gooley (Working GroupMember)
Family Services, Department of Education andCommunity Services
Jenny Reynolds Family Services, Department of Education andCommunity Services
Senior Policy Officer, Family & Children’s ServicesBranch, Department of Health & CommunityServices
Kathryn White Budget Management Coordinator, FACS (Financial)Bronwyn Thompson Senior Policy Officer, FACS (Policy Overview)Sue Keys Project Officer, FACS (Policy Overview)Peter Kerr Manager, Community Care Information System
(Client Information System Overview)Carol Sa Pereira Community Welfare Worker, FACSAnnie Zon Provider Support Co-ordinator, FACSMiang Que-Noy Family Support Team Leader, FACSJenny Scott Director, Community Services, Service Development
Division (Financial & Service Development)Anthony Burton Director, FACS (Policy Overview)
Continued next page.
PROJECTCONSULTATION
89
Table A.1 (continued)
Person Position
Australian Institute of Health and WelfareHelen Moyle Children, Youth and Families UnitHelen Johnstone Children, Youth and Families UnitSuzie Kelly Children, Youth and Families Unit
Workshop attendees
The following table provides a list of attendees and apologies to the PathwaysWorkshop held in Melbourne on 13 August, 2002.
Table A.2 Workshop attendees
Jurisdiction Individual
Protection and SupportWorking GroupConvenor
Petrice Judge (Convenor) (WG)Director, Federal Affairs, Department of the Premier and Cabinet
New South Wales Kate Southam (WG)Information and Research Unit, Department of Community ServicesSteven Gal, A/Manager Corporate PerformanceDepartment of Community ServicesCora Ingram, Project ManagerChild Protection, Child Family Services, Department of CommunityServices
Victoria John Prent (WG),Manager, Research and Web Services, Department of Human ServicesBrenda Whitmore-Seidel, ManagerBudget and Program SupportLinda Gerdtz, ManagerProtective Services Strategic Planning, Child Protection
Queensland Deb Partridge, DirectorInformation Services Branch, Department of Families
Western Australia Malcolm Tsang (WG), A/Senior Information OfficerSouth Australia Ros Wilson (WG)
Department of Human Services – Family and Youth ServicesFiona Ward, A/Regional DirectorFamily and Youth Services, Department of Human Services
Tasmania Helen Stone (WG), Policy and Project OfficerChildren and FamiliesScilla Weber, Team LeaderChild & Family Services Support UnitDanny Ransley, Policy OfficerChild and Family Services Support Unit
Australian CapitalTerritory
Lisa Gooley (WG)Family Services, Department of Education and Community Services
Continued next page.
90 PROJECTCONSULTATION
Table A.2 (continued)
Jurisdiction Individual
Jenny ReynoldsFamily Services, Department of Education and Community Services
AIHW Helen Moyle (WG)Children, Youth and Families UnitSusie KellyChildren, Youth and Families Unit
Secretariat(Productivity Commission)
Danny Forwood
John NoronhaThe Allen ConsultingGroup
Mary Ann O’Loughlin
Kathleen ForresterLeonie BenstedDr Jerome Fahrer (pm)Geoff Jones (pm)
Apologies:Queensland Tracey Smith (WG)
Child Protection Branch, Department of FamiliesNorthern Territory Gary Sherman (WG), Senior Policy Officer
Territory Health ServicesAIHW Helen Johnstone (WG)
Children, Youth and Families Unit
WG Protection and Support Services working group member.
Presentation attendees
The following table provides a list of attendees at the pathways presentation held inMelbourne on 13 November, 2002.
Table A.3 Presentation attendees
Jurisdiction Individual
Protection and SupportWorking Group Convenor
Petrice Judge (Convenor) (WG)Director, Federal Affairs, Department of the Premier and Cabinet
New South Wales Kate Southam (WG)Information and Research Unit, Department of Community Services
Victoria John Prent (WG),Manager, Research and Web Services, Department of HumanServices
Queensland Tracey SmithChild Protection Branch, Department of FamiliesDonnalee Moriaty
Continued next page.
PROJECTCONSULTATION
91
Table A.3 (continued)
Jurisdiction Individual
South Australia Ros Wilson (WG)Department of Human Services – Family and Youth Services
Tasmania Helen Stone (WG), Policy and Project OfficerChildren and Families
Australian Capital Territory Lisa Gooley (WG)Family Services, Department of Education and Community Services
AIHW Helen Johnstone (WG)Children, Youth and Families UnitSusie KellyChildren, Youth and Families Unit
Secretariat(Productivity Commission)
Danny Forwood
John NoronhaThe Allen Consulting Group Kathleen Forrester
Joe SunderlandLeonie Bensted
92 PROJECTCONSULTATION
REPORTING SCOPEAND INFORMATIONGATHERING
93
B Reporting scope and the process togather information
This appendix describes the process of collecting the information needed to applythe national reporting method described in chapter 5. The appendix provides thecounting rules used to determine the scope of reporting in section B.1, and describesthe approach to collect financial information in section B.2 and service measuresinformation in section B.3.
B.1 Scope of reporting
Child protection
Child protection services are provided to protect children and young people at riskof harm within their families or in circumstances in which their families do not havethe capacity to protect them. Child protection activities undertaken by governmentwhich fall within the scope of this project include:
• receiving and responding to allegations of child abuse and neglect, includinginvestigation and assessment where appropriate;
• initiating formal statutory intervention, including applying to the court forprotective orders, to secure the safety of children or young people;
• ensuring the ongoing safety of children by working with families to resolveprotective concerns;
• working with families to reunite children — removed for safety reasons — withtheir parents as soon as possible; and
• securing permanent alternative care when it is determined that a child is unableto be returned to the care of their parents.
Child protection activities undertaken by government which do not fall within thescope of child protection information reported in this project include:
• services which fall within the scope of supported placement services; and
94 REPORTING SCOPEAND INFORMATIONGATHERING
• services that are not limited to children in need of protection (that is thoseavailable to a wider section of the population).
Out-of-home care
Supported placement services provide care for children and young people aged17 years and under who are placed away from their parents or family home forreasons of safety or family crisis. These reasons include abuse or neglect, illness ofparents or the inability of parents to provide adequate care. The placements may bevoluntary or in conjunction with care and protection orders.
Supported placements can occur in either family based care (such as foster care,care with the child’s extended family, and other home based arrangements) orfacility based care (such as family group homes).
State or Territory Government departments fund supported placements, which maybe provided by the government or by the non-government sector. The non-government sector plays a significant role in providing services in all States andTerritories.
Supported placement services funded by government which fall with the scope ofthis project include:
• facility based care — where placement is in a residential building whosepurpose is to provide placements for children and where there are paid staff,including placements in ‘family group home’;
• home based care — where placement is in the home of a carer who isreimbursed for expenses for the care of the child, including:
– placements with relatives/kin (family members other than parents) or aperson well known to the child and/or family (based on a pre-existingrelationship) who is reimbursed by the State/Territory for the care of thechild;
– placements in foster care/community care-where the care is authorised andreimbursed by the State/Territory and supported by an approved agency; and
– placements in other-home based care.
• independent living — including private board; and
• other supported placement services — including placements that do not fit intothe above categories and unknown living arrangements.
REPORTING SCOPEAND INFORMATIONGATHERING
95
Supported placement services funded by government which do not fall within thescope of out-of-home care information reported in this project include:
• placements made in disability services, psychiatric services and juvenile justicefacilities, or in overnight child care services;
• overseas adoption services;
• children in SAAP placement;
• services which fall within the scope of child protection services;
• services which fall within the scope of family preservation services; and
• services that are not limited to children in need of protection (that is, thoseavailable to a wider section of the population).
Family support services
There is considerable difference in the formality and structure with which ‘support’services (as opposed to strictly child protection services) are utilised as part ofaddressing a child protection concern or attempting to minimise the likelihood of achild protection issue arising. At the same time, there is considerable similarityacross jurisdictions in their use of family support services in conjunction withprotection services.
Although family support services are increasingly important, their inclusion in theagreed national pathways presents two challenges. The first is being able to clearlyidentify the group of family support services or activities that are appropriate forinclusion in the project. Family support services range from universal servicesaccessed by the entire community (for example maternal and child health services)to highly specific services that can only be accessed by a referral from childprotection services. Within the child protection context, family support services:
• range from provision of advice or information in the course of one phone call tointensive family preservation services;
• vary in terms of their intensity, when they are delivered and the frequency ofnon-government organisation involvement in service delivery; and
• can be provided as part of child protection case work or as a separate familysupport service.
The second challenge is being able to establish an accurate cost for activities.
This issue is of significant policy interest to jurisdictions as it is recognised that the‘hard end’ of the statutory child protection pathway involving court orders and out-
96 REPORTING SCOPEAND INFORMATIONGATHERING
of-home care is costly. What is not known is the magnitude of cost differencebetween a pathway with early intervention using family support services and apathway that requires the ‘hard end’ statutory services.
The endorsed national pathways include two groups for family support services:
• activity group two — provision of initial family support services; and
• activity group three — provision of intensive family support services.
The detailed description of these activity groups is in chapter four.
As part of stage one of the project, each jurisdiction provided examples of the rangeof family support services provided in accordance with the Australian Institute ofHealth and Welfare (AIHW) definitions of universal, secondary and tertiary familysupport services (AIHW 2001, p. 6):
• universal services — services directed to the whole target population. There isno expectation that users of services have specific issues, problems or concerns;
• secondary services — services are directed to people who do have a particularissue, problem or concern and who need assistance to help them manage orresolve this. People may seek out the service or be referred to the service; and
• tertiary services — services where the issue, problem or concern is one whichrequires intensive and often on going intervention. People may seek out theservice, be referred to the service or be subject to statutory intervention.
The approach to setting the scope of family support services was established havingregard to one of the purposes of the project — the identification of the costs ofalternative or ‘diversionary’ pathways to child protection. Therefore, in consideringwhich services to include, it was concluded that the project should encompassservices that provide a different approach to child protection when responding toconcerns about families and children.
Family support services that fall within the scope of this project include:
• family support services funded by the State or Territory government, providedby government or non-government organisations;
• examples of included services are parenting services targeted at vulnerable andat risk families, mental health services focussed exclusively on child protectionclients, family violence services, sexual assault services, family supportcounselling services;
• intensive family preservation services (as defined by the AIHW as ‘intensivefamily support services’ — see chapter 4); and
REPORTING SCOPEAND INFORMATIONGATHERING
97
• other intensive family support services such as those where a jurisdiction has aspecific family support pathway. Stage one of the project explicitly identifiedfamily support pathways in a number of jurisdictions.
The services must be provided as a series of counselling/support sessions.
Family support services that do not fall within the scope of this project include:
• services not funded by the State or Territory government, for example, servicesfunded by Commonwealth Government and local government;
• universal services, for example, services such as maternal and child health,children’s services, general (untargeted) parenting services and youth services;
• secondary services that are not focussed on providing an alternative or priorservice to child protection, for example, disability services, mental healthservices, problem gambling counselling, financial counselling, early childhoodservices, child care, specialist children’s services, telephone counselling, schoolfocussed youth services, neighbourhood houses;
• other tertiary services such as juvenile justice; and
• family support services delivered by phone only, and in one-off-counselling/support sessions.
B.2 Financial information
Cost identification
The estimate of total expenditure by each jurisdiction on protection and supportactivities was measured using a top down approach. The top down approach startsby identifying total expenditure by the jurisdiction on the delivery of all protectionand support services. The total expenditure figure is the amount that is allocatedacross all protection and support activity groups and pathways. Internal financialsystems were important sources of information in identifying the total expenditureby jurisdictions and hence in applying the top down approach.
For each service type (child protection, out-of-home care and family supportservices) jurisdictions disaggregated total expenditure into relevant individual costdrivers/inputs (for example, salaries and related on-costs, office expenses andpayments to third parties) in accordance with a survey spreadsheet (figure B.1).
98 REPORTING SCOPEAND INFORMATIONGATHERING
Figure B.1 Cost identification, step 1 in survey spreadsheet
Source: ACG 2002f.
Cost categorisation
The second step in the financial information collection process is to categorise thefull range of costs identified above as either direct or indirect (see definitionsbelow) and also to allocate direct costs to the appropriate activity groups. This wasdone in accordance with a survey spreadsheet (figure B.2).
REPORTING SCOPEAND INFORMATIONGATHERING
99
Figure B.2 Cost categorisation, step 2 in survey spreadsheet
Source: ACG 2002f.
The categorisation of direct and indirect costs — and the allocation of direct costs toactivity groups — involved a three-stage process:
• stage 1 — break down all of the costs identified in the cost identification stepinto indirect costs and direct costs. Direct costs are costs that can be attributeddirectly and unequivocally to a specific activity group or groups. For example,the salary and on-costs of a person working exclusively on intake would be adirect cost to activity group one, while the salary and on-costs of a personworking exclusively on court issues would be a direct cost to activity group six.The remaining costs are indirect;
• stage 2 — allocate direct costs to the activity groups for which they can bedirectly and unequivocally attributed/traced; and
• stage 3 — distinguish between operational and non-operational indirect costs:
– operational tasks involve direct service delivery to clients; and
– non-operational tasks are essential to deliver services but not necessarilyevident to the client.
100 REPORTING SCOPEAND INFORMATIONGATHERING
Cost allocation
The final step is to link indirect costs to activities in a way that reflects the intensityof resource use. This was done in accordance with a survey spreadsheet (figureB.3).
Figure B.3 Cost allocation, step 3 in survey spreadsheet
Source: ACG 2002f.
For all indirect costs (operational only), the people with relevant practitionerexperience within each jurisdiction estimate what proportion of each indirect(operational) cost driver/input was attributable to different tasks, activities andactivity groups over the relevant financial year.
Labour costs were considered to be the key driver of the majority of activity costs(provision of out-of-home care was the exception). Therefore, non-traceable indirectcosts were allocated to activity groups in the same proportion as total labour costallocation to activity groups.
REPORTING SCOPEAND INFORMATIONGATHERING
101
B.3 Service delivery information
As with the financial information collection, a Microsoft Excel workbook wasprovided to jurisdictions to collect the required data (figure B.4). Each jurisdictionnominated the financial year data it provided (either 2000-01 or 2001-02).
Figure B.4 Survey delivery information, service measures surveyspreadsheet
Source: ACG 2002fg
The Allen Consulting Group sought the assistance of the AIHW in using data thatjurisdictions have provided to AIHW. Where gaps exist between the agreedmeasures and data currently collected (for example, for family support services),requests for client information were made directly to jurisdictions. The potential foraligning the information required to calculate the pathway costs and the AIHWannual child protection data collection is discussed in chapter 8.
102 REPORTING SCOPEAND INFORMATIONGATHERING
REFERENCES 103
References
ACG (The Allen Consulting Group 2002a), Costing the Pathways — Protection andSupport Pathways Project Workshop, mimeo, Melbourne, 13 August 2002.
—— 2002b, National Protection and Support Services Pathways: NationalProtection and Support Pathways and a Model for Reporting Comparable CostData — Stage One Final Report, mimeo, Melbourne, 9 September.
—— 2002c, Protection and Support Pathways Project: Mapping the Pathways —Compendium of Individual Jurisdiction Protection and Support Pathways,mimeo, Melbourne, 10 September.
—— 2002d, Protection and Support Pathways Project: Guide for Stage Two,mimeo, Melbourne, 6 September.
—— 2002e, Protection and Support Pathways Project: Stage Two Survey, mimeo,Melbourne, September.
—— 2002f, Protection and Support Pathways Project: Stage Two SurveyInstructions, mimeo, Melbourne, 13 September.
—— 2002g, Protection and Support Pathways Project: Service Delivery MeasuresWorkbook, Microsoft Excel Workbook, Melbourne, 16 October.
—— 2002h, Protection and Support Pathways Project: Service Delivery Measures,mimeo, Melbourne, 16 October.
AIHW (Australian Institute of Health and Welfare) 1999, Comparability of ChildProtection Data, AIHW cat. no. CWS 9, Canberra.
—— 2001a, Family Support Services in Australia 2000, AIHW cat. no. CFS 4,Canberra.
—— 2002b, Intensive Family Support Service Australia: Data collectionStandards, Tables and Counting Rules 2001-02, AIHW, mimeo, Canberra.
Banks, G. 2002, Chairman, Steering Committee for the Review ofCommonwealth/State Service Provision, Reviewing the Service Performance of
104 REFERENCES
Australian Governments, Address to the conference, ‘Measuring and ManagingGovernment Performance Summit’, Rydges Hotel, Canberra, hosted by theInternational Quality and Productivity Centre, 20 February.
Commonwealth Competitive Neutrality Complaints Office (CCNCO) 1998, CostAllocation and Pricing, CCNCO Research Paper, Productivity Commission,Canberra, October.
Family and Community Services, Child Protection in South Australia — a newapproach, (no date).
SCRCSSP (Steering Committee for the Review of Commonwealth/State ServiceProvision) 2003, Report on Government Services 2003, AusInfo, Canberra.
—— 2002a, 2001-2002 Financial Data Collection Manual Version 4.1, Protectionand Support Services Working Group, mimeo, Melbourne.
—— 2002b, Report on Government Services 2002, AusInfo, Canberra.
—— 2002c, Protection and Support Services Pathways Project: Consultancy Brief,Protection and Support Services Working Group, mimeo, 18 February.
Tomison, A. and Poole, L. 2000, Preventing Child Abuse and Neglect: Findingsfrom an Australian Audit of Prevention Programs, National Child ProtectionClearinghouse.
United Kingdom Department of Health, 1995, Child Protection: Messages fromResearch, London, HMSO.