41
Efficiency through technology and collaboration Road Diet (Roadway Reconfiguration) Every Day Counts 3 Innovative Safety Initiative
| Date post: | 18-Dec-2015 |
| Category: |
Documents |
| Upload: | anissa-fleming |
| View: | 217 times |
| Download: | 0 times |

Efficiency through technology and collaboration
Road Diet (Roadway Reconfiguration)
Every Day Counts 3 Innovative Safety Initiative
2
Presentation Agenda
• Overview of Road Diets • New York City Example • Washington DC Example • Tampa FL Example • Resources and Questions

3
Safety – A Central Goal for USDOT
“Safety is our highest priority and that commitment is the same regardless of which form of transportation people choose, including walking and biking.”
Secretary Anthony FoxxProWalk ProBike ProPlace
ConferenceSeptember 10, 2014
4
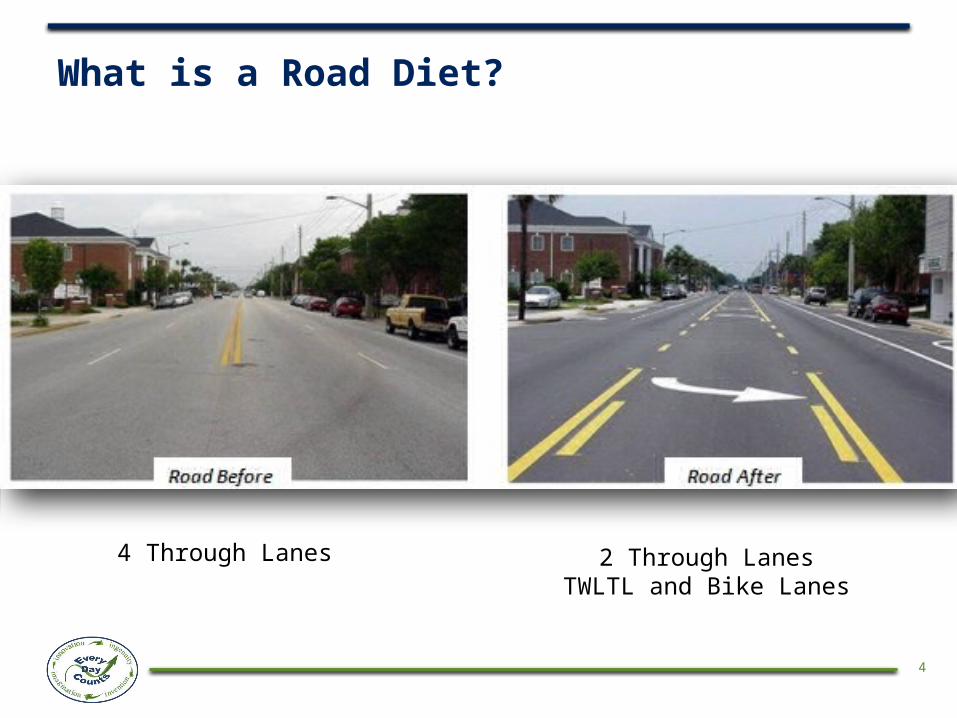
What is a Road Diet?
4 Through Lanes 2 Through LanesTWLTL and Bike Lanes

5
What is a Road Diet?
4 Through Lanes 2 Through LanesTWLTL and Bike Lanes

6
Other Roadway Reconfigurations
4-Lane to 5-Lane 2-Lane to 3-Lane
3-Lane to 3-Lane 5-Lane to 3-Lane

7
Determining Road Diet Purpose/Feasibility
• Improve safety •Reduce speeds and speed variance
•Mitigate left turn/through traffic conflicts
• Improve bicyclist accessibility• Improve walkability•Enhance transit service•Fit the community context

8
Determining Road Diet Purpose/FeasibilityOther Factors (Challenges/Obstacles)• Funding Formulas• Public and Business Concerns• Parallel roadways• Parking• Truck Traffic• Transit Vehicles

9
Why Consider a Road Diet? -- Case Studies
• New York City – Advantages & Disadvantages
• District of Columbia – East Street • Tampa, FL – Nebraska Avenue
Enhanced SAFETY for ALL ROAD
USERS
LOW COST and LOW IMPACT
Improved MOBILITY and ACCESS for
all modes
“COMPLETE STREETS”
characteristics

10
New York City Road Diets
Pedestrian and Bicyclist Benefits
Improved MOBILITY and ACCESS for
all modes
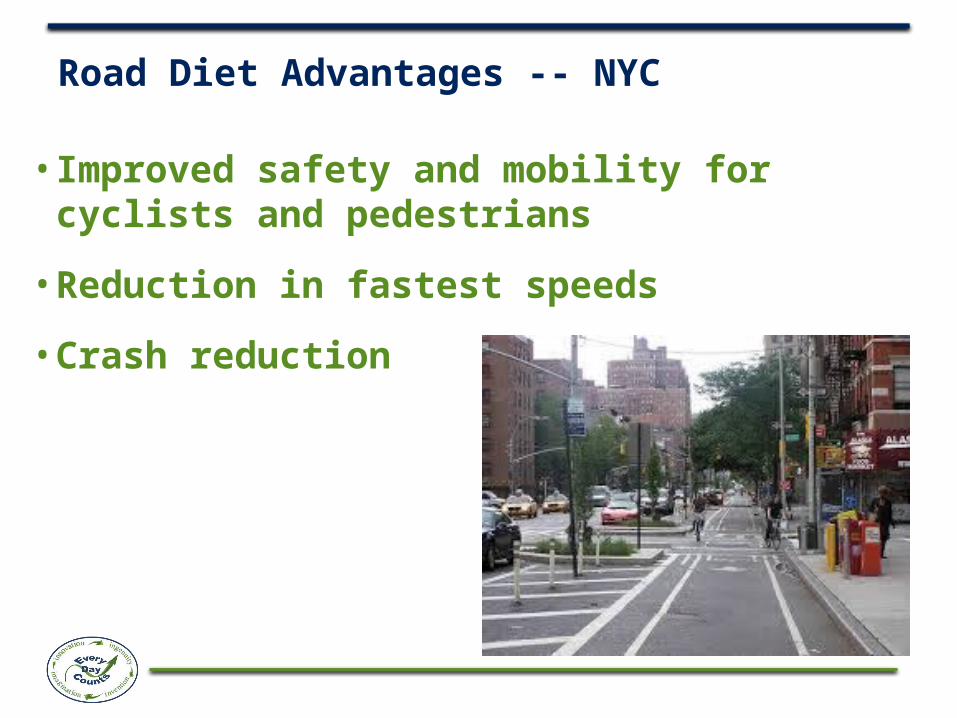
Road Diet Advantages -- NYC
• Improved safety and mobility for cyclists and pedestrians
• Reduction in fastest speeds
• Crash reduction

Road Diet Disadvantages -- NYC
• Increased travel delay
• Increased delay on side streets
• Loss of passing opportunities

13
District of Columbia Road Diets
“COMPLETE STREETS”
characteristics
Livabililty and Complete Streets
14
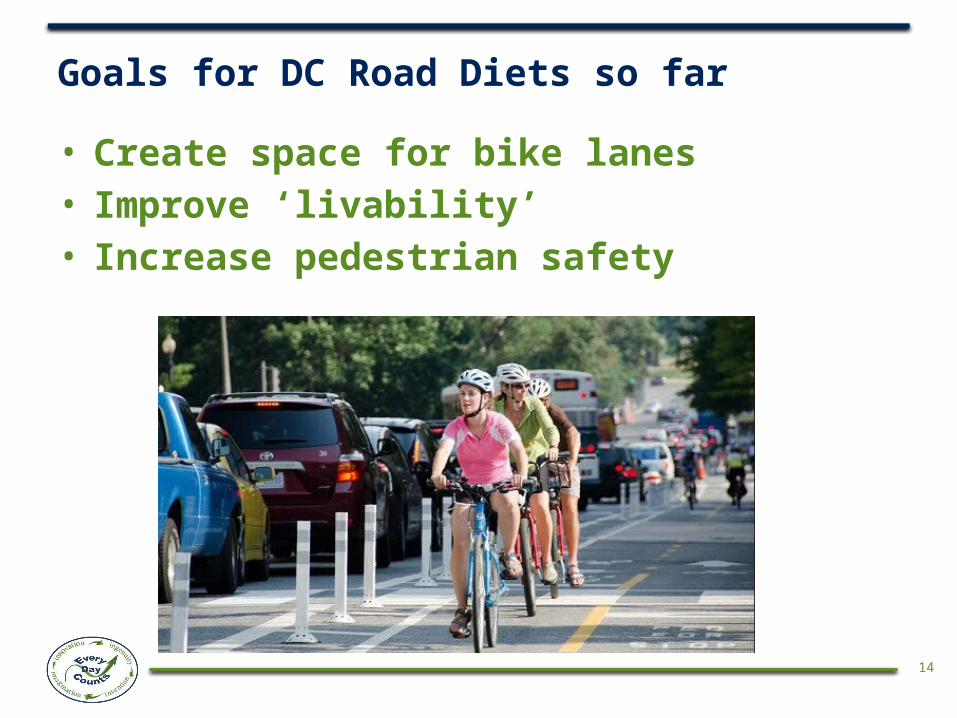
Goals for DC Road Diets so far
• Create space for bike lanes• Improve ‘livability’• Increase pedestrian safety

Build it and they will come
1990 2000 2006 2007 2008 2009 2010 2011 2012 2013 20140
10
20
30
40
50
60
70
0.00%
0.50%
1.00%
1.50%
2.00%
2.50%
3.00%
3.50%
4.00%
4.50%
5.00%
2.7 2.7
24.730.1
38.544.7
50.3 51.355.8
6066
0.75%
1.16%
2.00%
1.68%
2.33%2.17%
3.13%3.30%
4.10%
4.54%
DC Travel to Work by Bicycle & Bike Lane Development
Miles of Bike Lanes
Bike to Work Modesare
Year

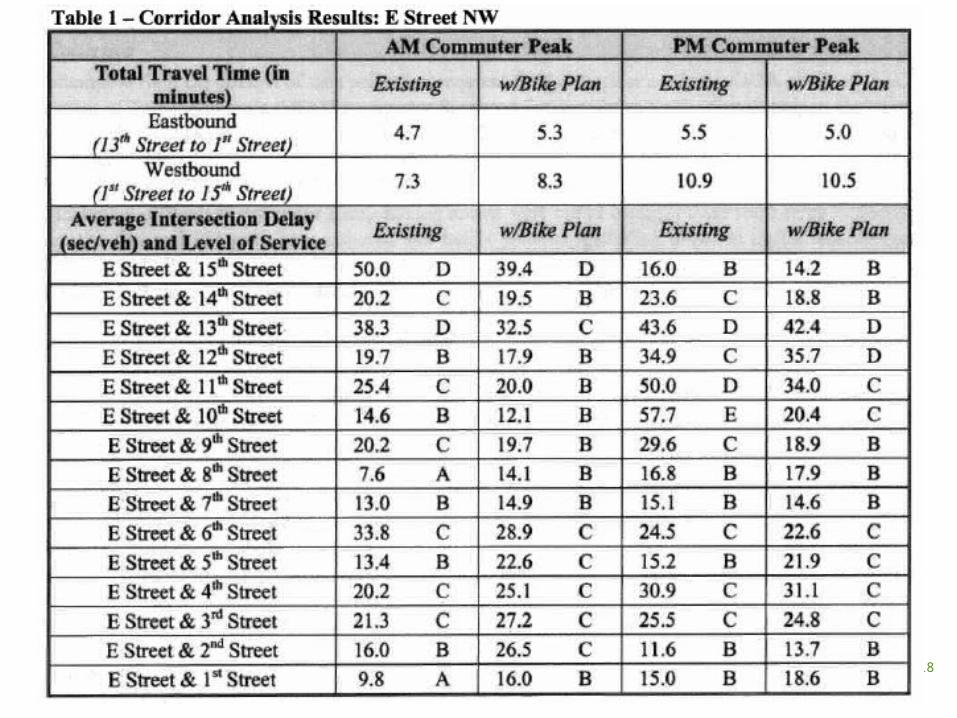
E Street NW Road Diet
Before After

17
E Street, NW. Turn Lanes.
18

19
E Street
Total Crashes Ped Crashes Bike Crashes0
10
20
30
40
50
60
BeforeAfter
Peak Hour Cyclists Before: 11Peak Hour Cyclists After:32

20
15th Street Protected Bike Lane (cycletrack)

• 4 lanes 1-way North
• North half residential, south half CBD
• Parking both sides• Concerns of safety,
traffic speeds– Posted speed 25– 85th Percentile
between 36-45 mph
• Excess capacity– 6,000 to 12,000
ADT
15th St. Before

• Remove 1 NB auto lane in north half
• Initially, SB contraflow cycle track behind full-time parking lane, with NB sharrows
• Later, converted to 2-way cycle track on west curb and extended south to CBD
• LOS drop of one letter grade at most intersections
15th St. After

23
15th Street--Increase in cyclists

24
15th Street NW--LOS and Speed
25
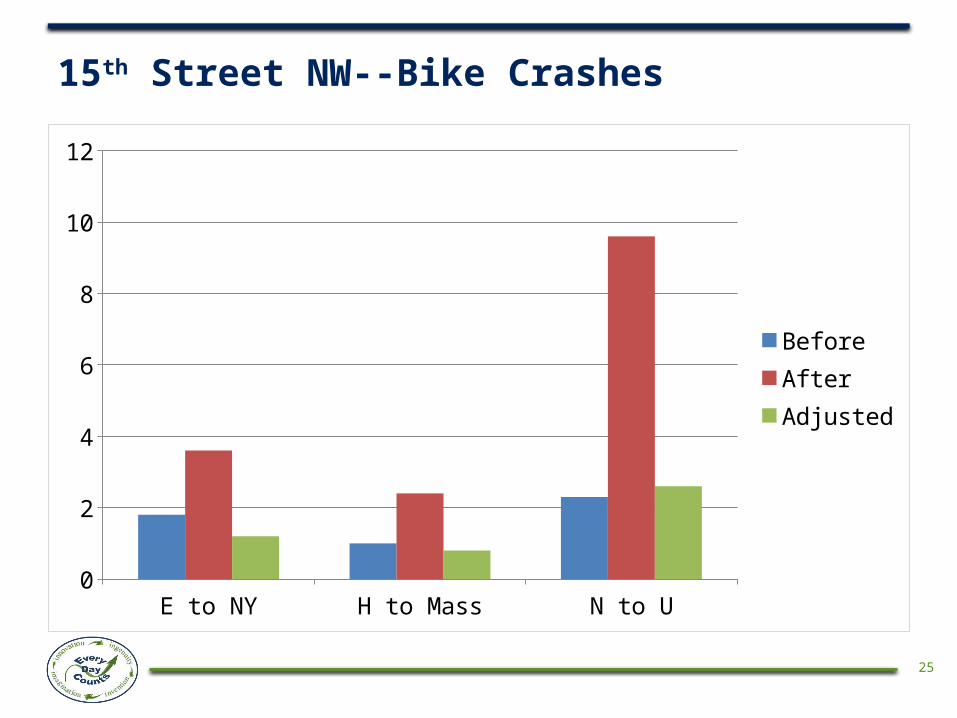
15th Street NW--Bike Crashes
E to NY H to Mass N to U0
2
4
6
8
10
12
BeforeAfterAdjusted

26
15th Street--Bicycle Volume and Crashes

Sherman Ave Rehabilitation

Sherman Ave. NW Road Diet, 2013
•85th% Speeds: • before:
35mph• after:
28mph•Too early for crash data
After:
• Median• Wider sidewalks• Trees• Sharrows
29
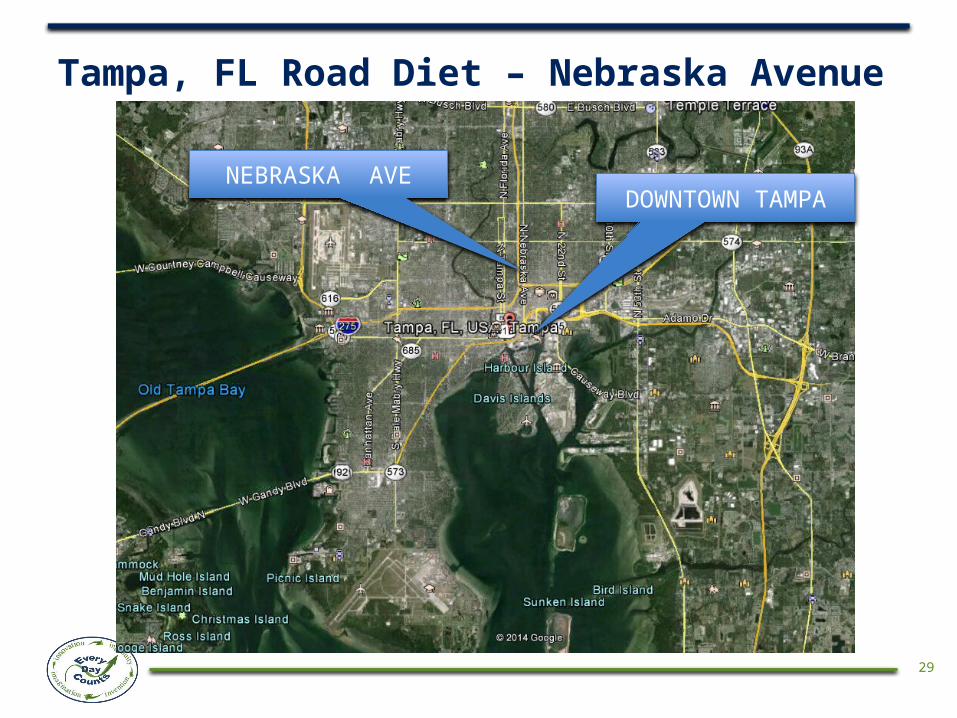
Tampa, FL Road Diet – Nebraska Avenue
DOWNTOWN TAMPANEBRASKA AVE

30
Tampa, FL Road Diet – Nebraska Avenue
• 3.15 miles• Before: 4-lane undivided urban arterial• Construction 2007-2008•$11.1 million•After: 2-lane arterial
–Two way left turn lane–Painted medians–Bus pull outs–Bike lanes

31
Tampa, FL Road Diet – Nebraska Avenue

32
Nebraska Avenue – Before/After Crash Comparison• Before (2004 – 2006)
–17,900 ADT–174 crashes per year–13 fatal/incapacitating crashes per year–7 pedestrian crashes per year
•After (2009-2013)–15,000 ADT–71 crashes per year–6 fatal/incapacitating crashes per year–<3 pedestrian crashes per year
•59% reduction in crashes, 51% reduction in crashes per MVMT

33
Nebraska Avenue – Before/After Crash Comparison
TotalCrashes/
YearTotal
Crashes/ Year
AADT LengthYearly MVMT
Crashes/ MVMT
AADT LengthYearly MVMT
Crashes/ MVMT
Total Crashes 523 174.33 355 71.00 59% 17900 3.15 20.58 8.47 15030 3.15 17.28 4.11 51%
Fatal/Incapacitating Injury Crashes 38 12.67 31 6.20 51% 17900 3.15 20.58 0.62 15030 3.15 17.28 0.36 42%
Pedestrian Crashes 21 7.00 13 2.60 63%
Bicycle Crashes 15 5.00 28 5.60 -12%
Sideswipe Crashes 47 15.67 18 3.60 77% 17900 3.15 20.58 0.76 15030 3.15 17.28 0.21 73%
Angle & Left Turn Crashes 215 71.67 147 29.40 59% 17900 3.15 20.58 3.48 15030 3.15 17.28 1.70 51%
Head-On Crashes 14 4.67 13 2.60 44% 17900 3.15 20.58 0.23 15030 3.15 17.28 0.15 34%
Rear-End Crashes 73 24.33 103 20.60 15% 17900 3.15 20.58 1.18 15030 3.15 17.28 1.19 -1%
Pedestrian and Bike Crashes are not reported on a per MVMT basis.
% ReductionCrash Type
Before (January 2004 thru December 2006)
After (January 2009 thru December 2013)
% Reduction
Before (January 2004 thru December 2006) After (January 2009 thru December 2013)

34
Tampa, FL Road Diet – Nebraska Avenue

35
Tampa, FL Road Diet – Nebraska Avenue

36
Tampa, FL Road Diet – Nebraska Avenue

37
Tampa, FL Road Diet – Nebraska Avenue
38
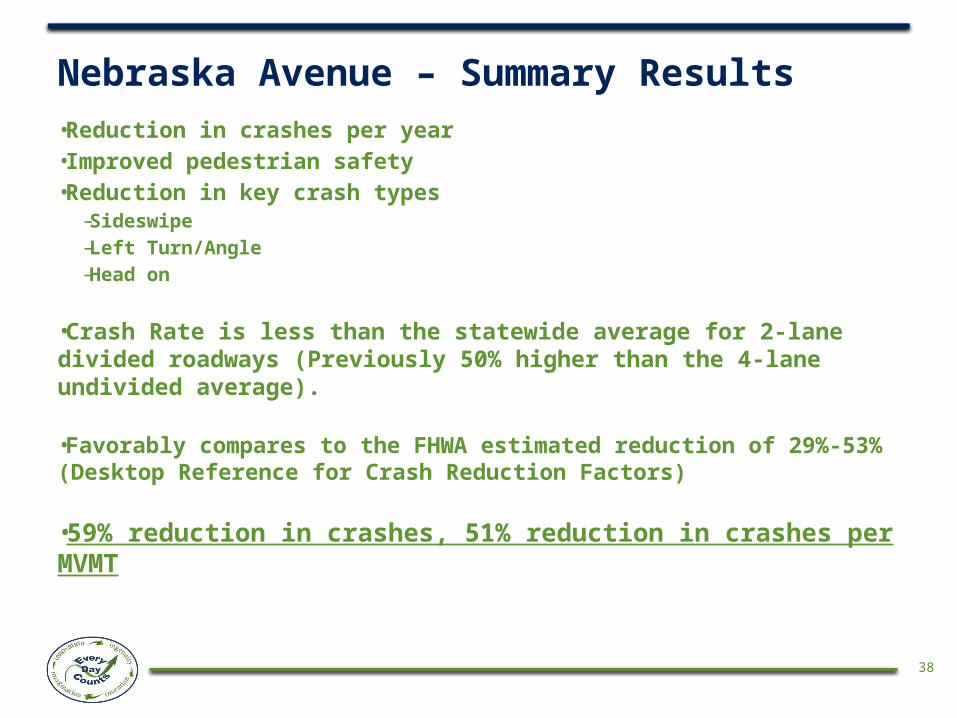
Nebraska Avenue – Summary Results•Reduction in crashes per year•Improved pedestrian safety•Reduction in key crash types
–Sideswipe–Left Turn/Angle–Head on
•Crash Rate is less than the statewide average for 2-lane divided roadways (Previously 50% higher than the 4-lane undivided average).
•Favorably compares to the FHWA estimated reduction of 29%-53% (Desktop Reference for Crash Reduction Factors)
•59% reduction in crashes, 51% reduction in crashes per MVMT
39
Resources
• FHWA Road Diet Informational Guide – Coming Soon!
• FHWA Road Diet Case Studies – Coming Soon!
• EDC 3 Initiatives: Road Diet Fact Sheet
• FDOT Road Diet Policy – Coming Soon!

40
Questions

41
For Additional Information:
Becky CroweFHWA Office of Safety(804) 775-3381Cell: (804) [email protected]
Peter Hsu, P.E.FDOT District Safety EngineerOffice: (813) [email protected]


