76
Efficient Ammonia Production Jim Gosnell 13 October 2005 Hydrogen Conference Argonne National Laboratory
Efficient Ammonia ProductionJim Gosnell13 October 2005Hydrogen ConferenceArgonne National Laboratory
Topics to be Covered
• Overview of KBR Activities
• Ammonia Supply & Demand
• History of Ammonia Manufacture
• Ammonia Plant Market Trends
• Current Manufacturing Technology
• Ammonia from Renewable Energy
• Summary
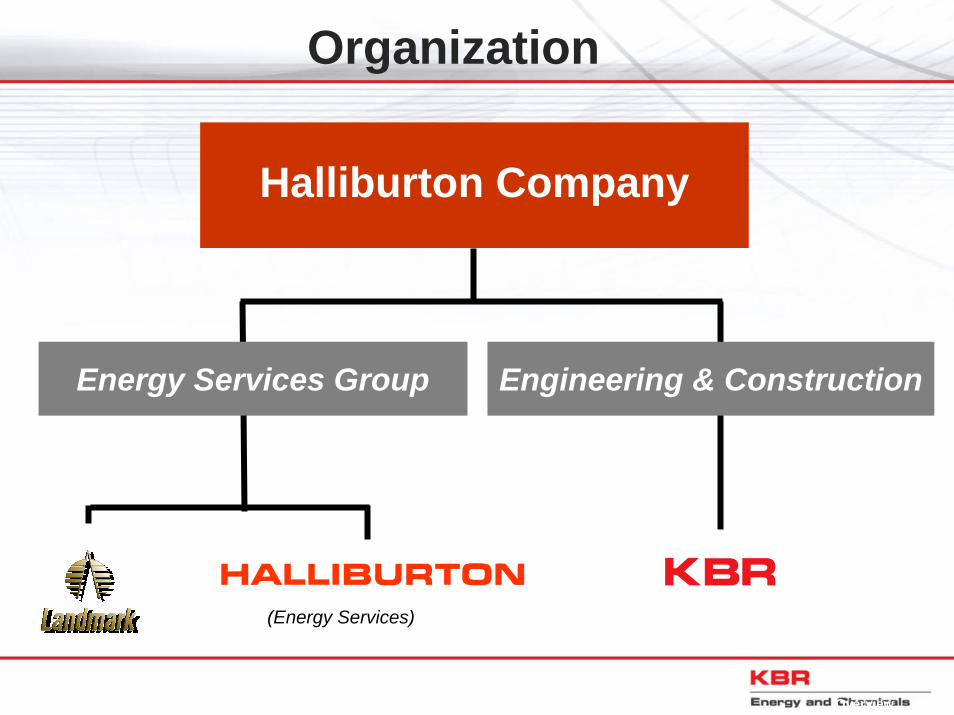
Organization
(Energy Services)
Overview
Halliburton Company
Energy Services Group Engineering & Construction
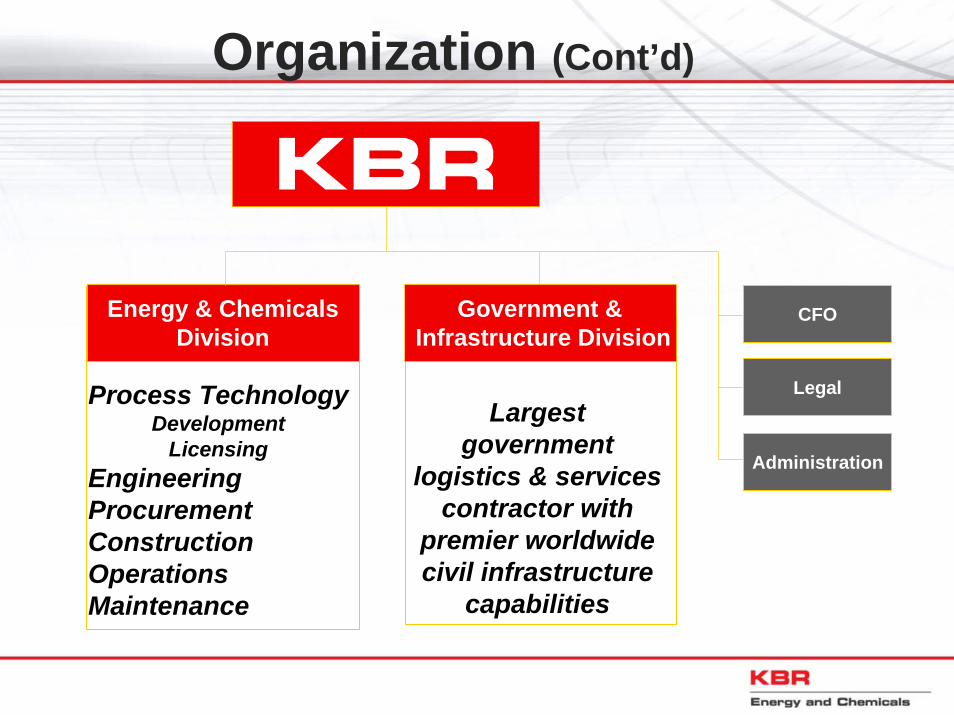
Energy & ChemicalsDivision
Process Technology Development
LicensingEngineeringProcurementConstructionOperationsMaintenance
CFO
Legal
Administration
Government & Infrastructure Division
Largest government
logistics & services contractor with
premier worldwide civil infrastructure
capabilities
Organization (Cont’d)
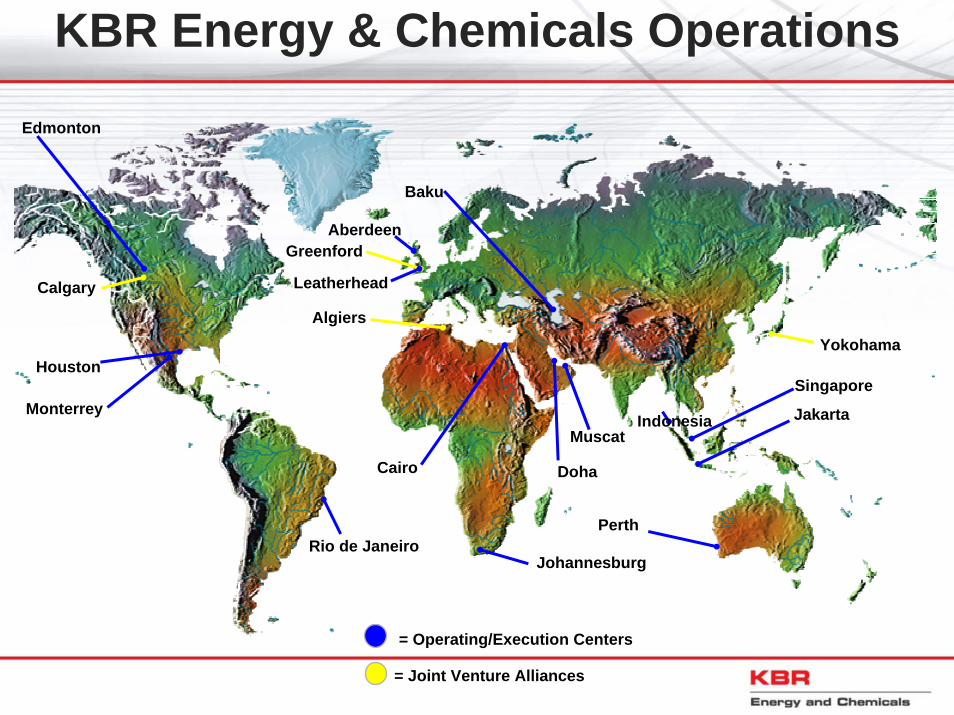
KBR Energy & Chemicals Operations
= Operating/Execution Centers
Edmonton
Houston
Johannesburg
Perth
Muscat
Doha
Jakarta
Cairo
Singapore
Baku
Monterrey
Leatherhead
Yokohama
Greenford
Algiers
Calgary
= Joint Venture Alliances
Aberdeen
Rio de Janeiro
Indonesia
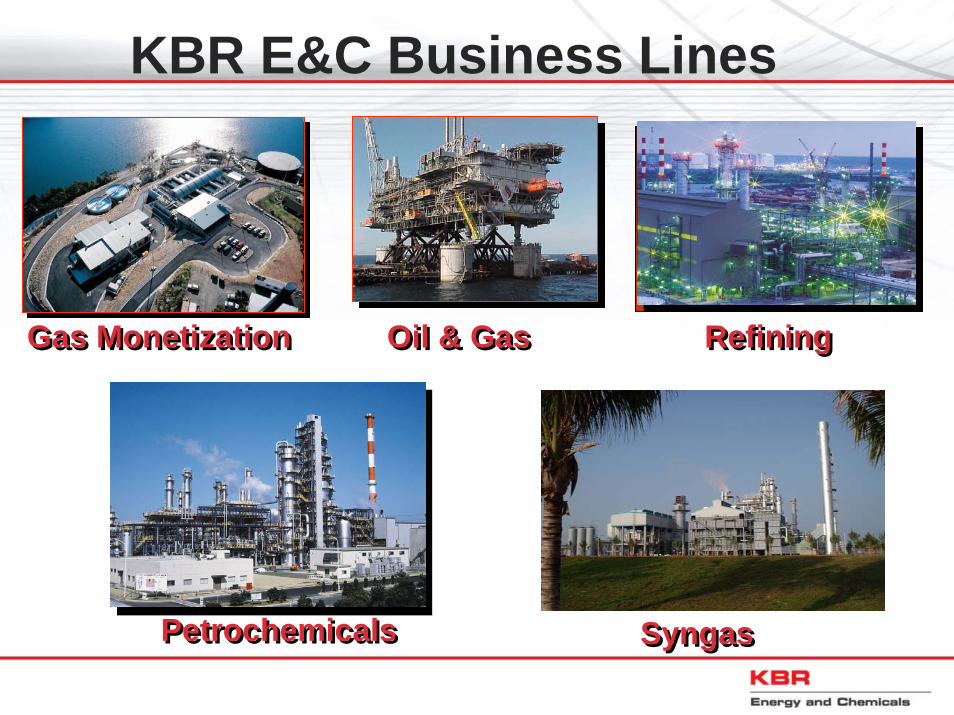
KBR E&C Business Lines
Gas MonetizationGas Monetization RefiningRefiningOil & GasOil & Gas
SyngasSyngasPetrochemicalsPetrochemicals
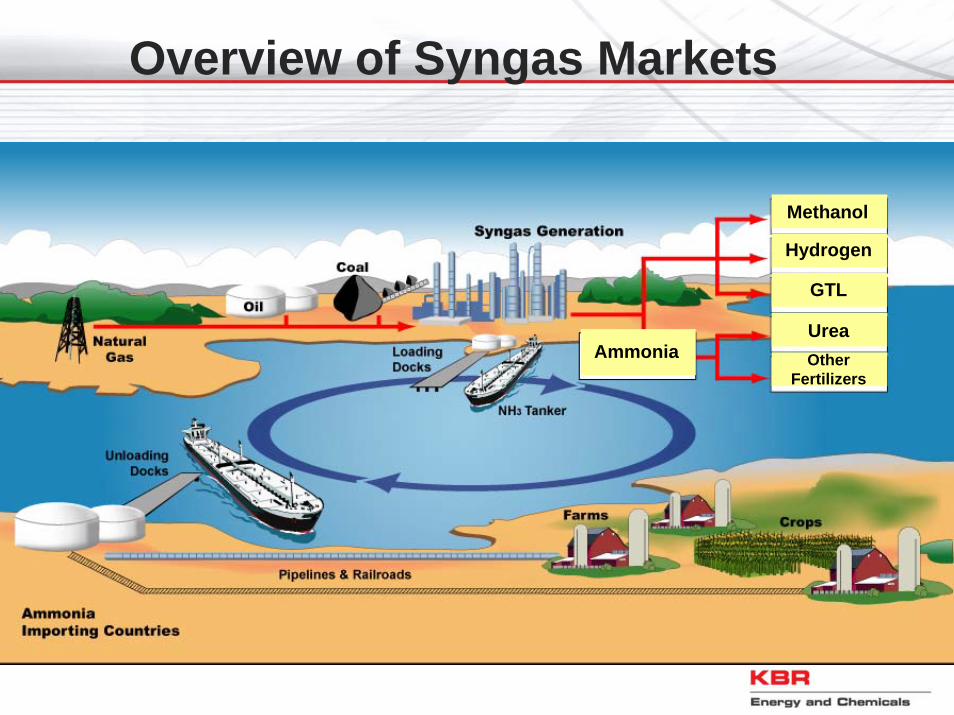
Overview of Syngas Markets
Ammonia
Hydrogen
Methanol
GTL
UreaOther
Fertilizers
Topics to be Covered
• Overview of KBR Activities
• Ammonia Supply & Demand
• History of Ammonia Manufacture
• Ammonia Plant Market Trends
• Current Manufacturing Technology
• Ammonia from Renewable Energy
• Summary
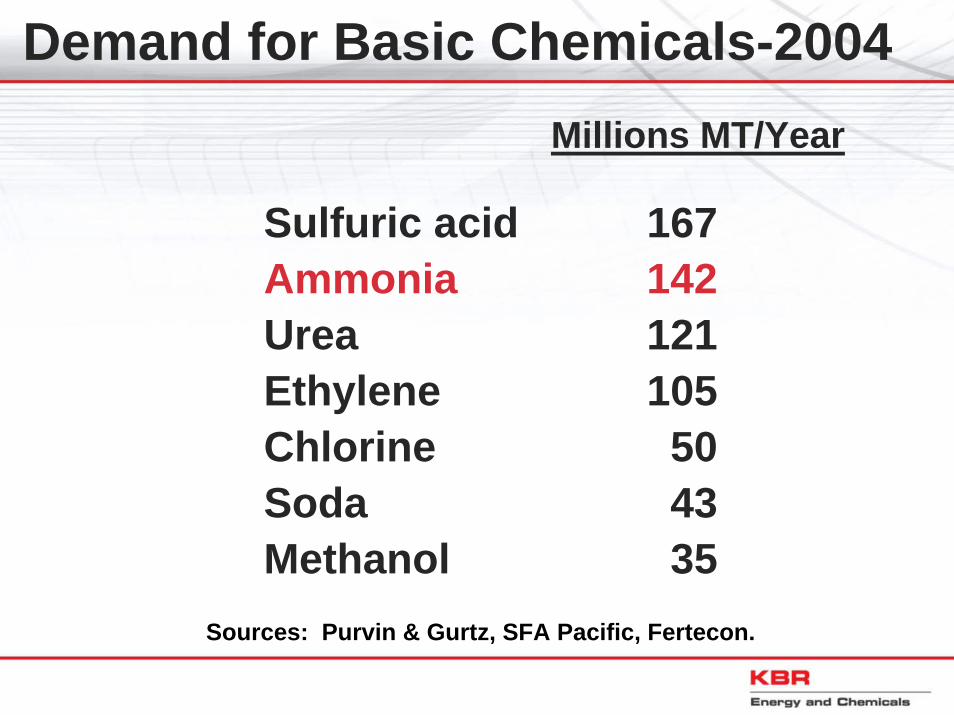
Demand for Basic Chemicals-2004 Millions MT/Year
Sulfuric acid 167Ammonia 142Urea 121Ethylene 105Chlorine 50Soda 43Methanol 35
Sources: Purvin & Gurtz, SFA Pacific, Fertecon.
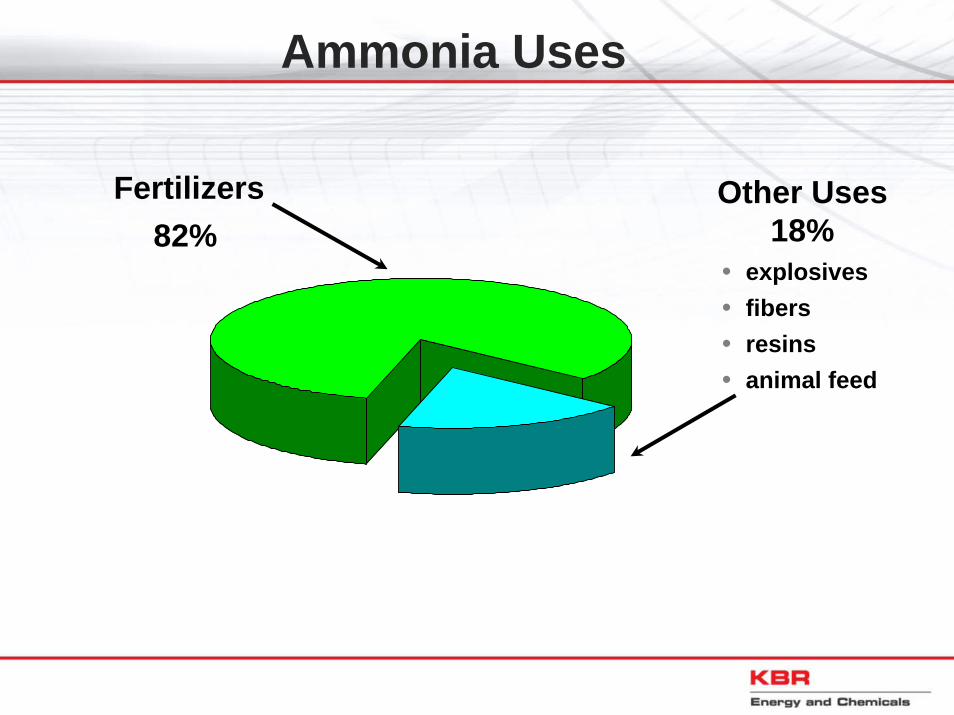
Ammonia Uses
• explosives• fibers• resins• animal feed
Other Uses18%
Fertilizers82%

0
200
400
600
800
1,000
1,200
1,400
1,600
1980 1990 2000
Mill
ions
of h
ecta
res
Rest of WorldSouthwest AsiaSocialist AsiaFSUEuropeNorth America
Source: SRI
World Arable Land
0
1,000
2,000
3,000
4,000
5,000
6,000
7,000
8,000
1980 1990 2000 2010 2020
Mill
ions
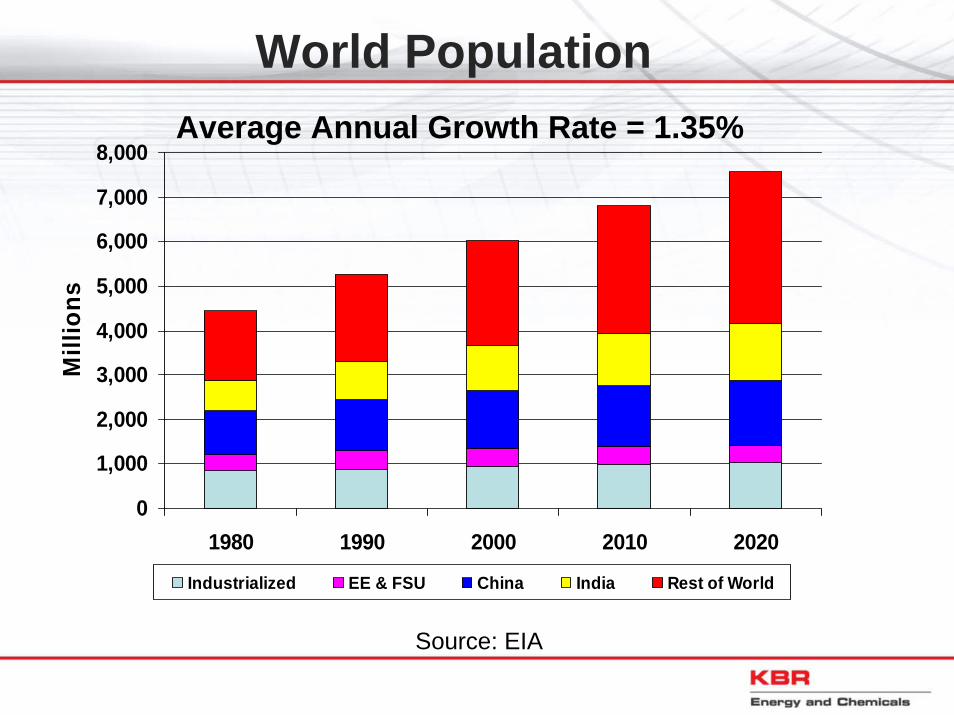
Industrialized EE & FSU China India Rest of World
Source: EIA
World PopulationAverage Annual Growth Rate = 1.35%
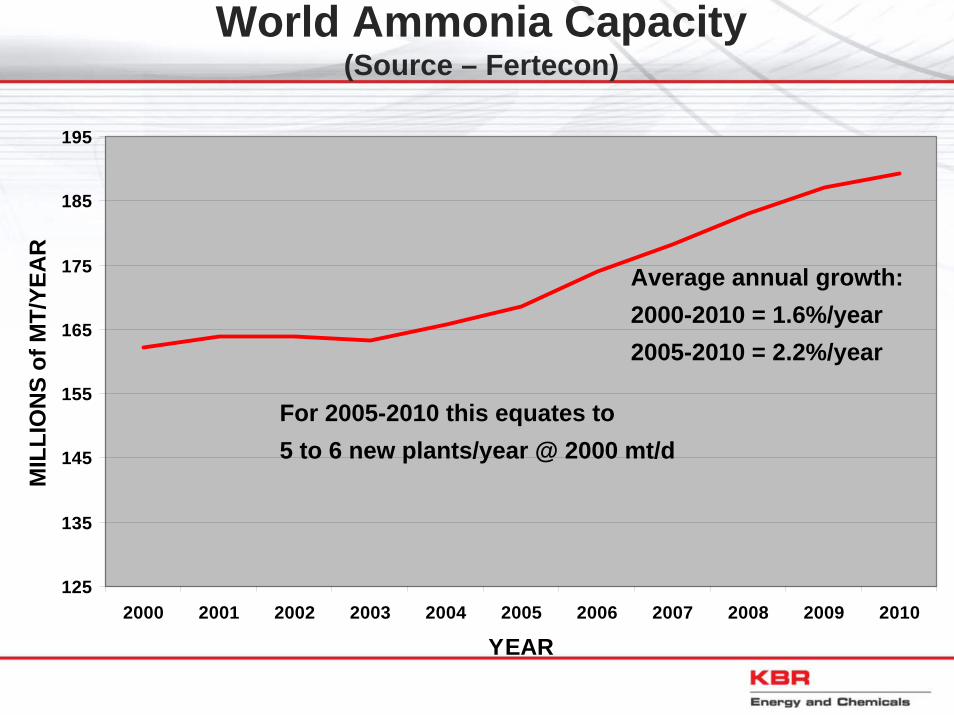
World Ammonia Capacity(Source – Fertecon)
125
135
145
155
165
175
185
195
2000 2001 2002 2003 2004 2005 2006 2007 2008 2009 2010
YEAR
MIL
LIO
NS
of M
T/YE
AR
Average annual growth:2000-2010 = 1.6%/year2005-2010 = 2.2%/year
For 2005-2010 this equates to5 to 6 new plants/year @ 2000 mt/d
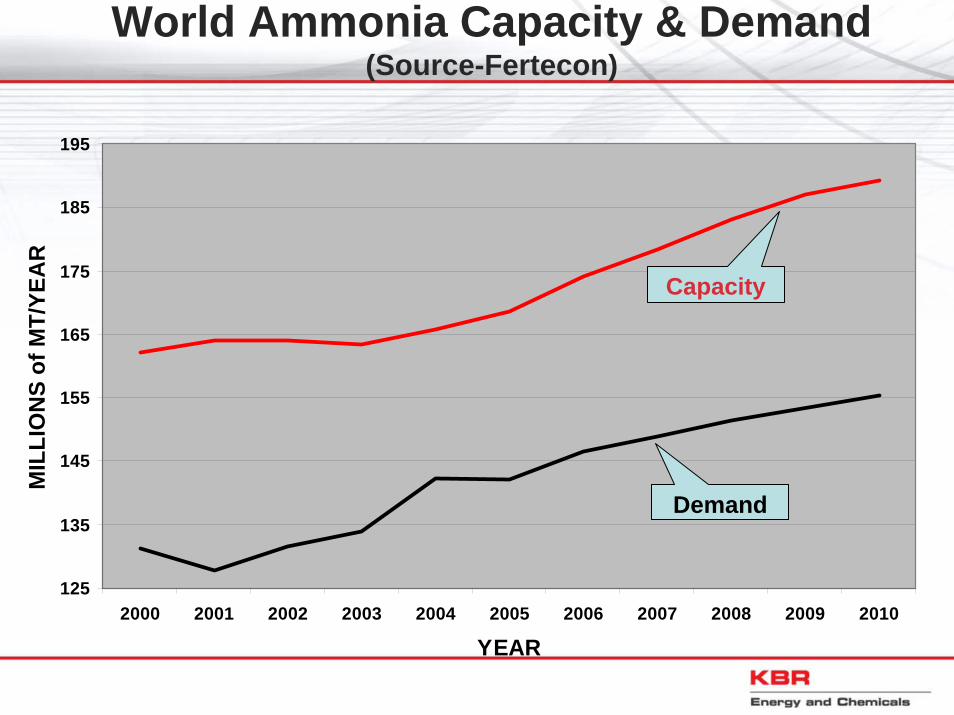
World Ammonia Capacity & Demand (Source-Fertecon)
Installed Capacity
Demand
125
135
145
155
165
175
185
195
2000 2001 2002 2003 2004 2005 2006 2007 2008 2009 2010
YEAR
MIL
LIO
NS
of M
T/YE
AR
Demand
Capacity
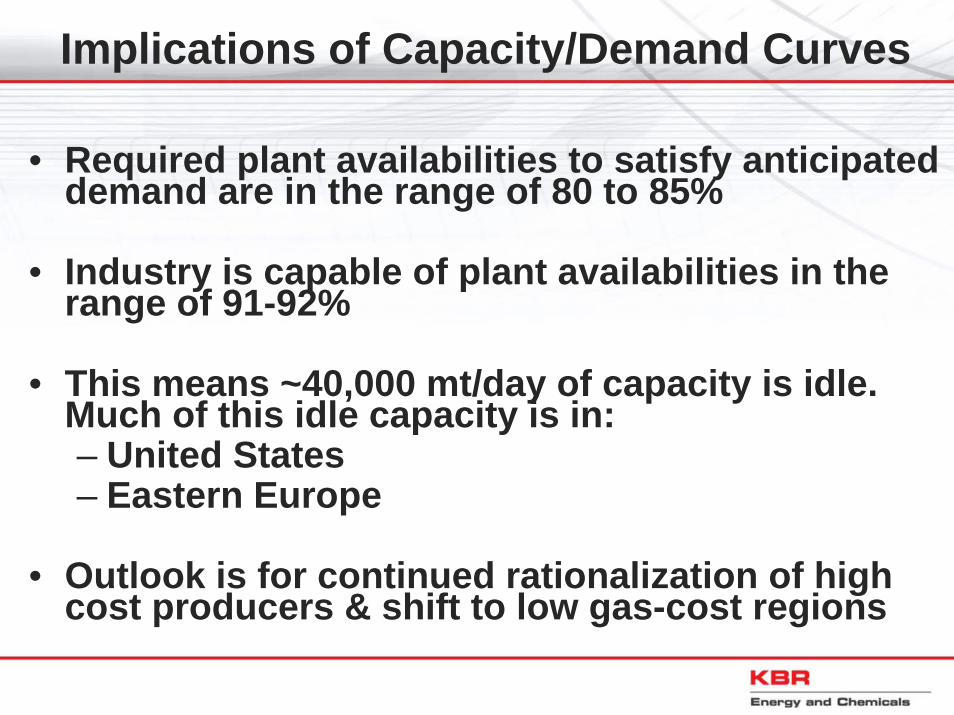
Implications of Capacity/Demand Curves
• Required plant availabilities to satisfy anticipated demand are in the range of 80 to 85%
• Industry is capable of plant availabilities in the range of 91-92%
• This means ~40,000 mt/day of capacity is idle. Much of this idle capacity is in:– United States– Eastern Europe
• Outlook is for continued rationalization of high cost producers & shift to low gas-cost regions
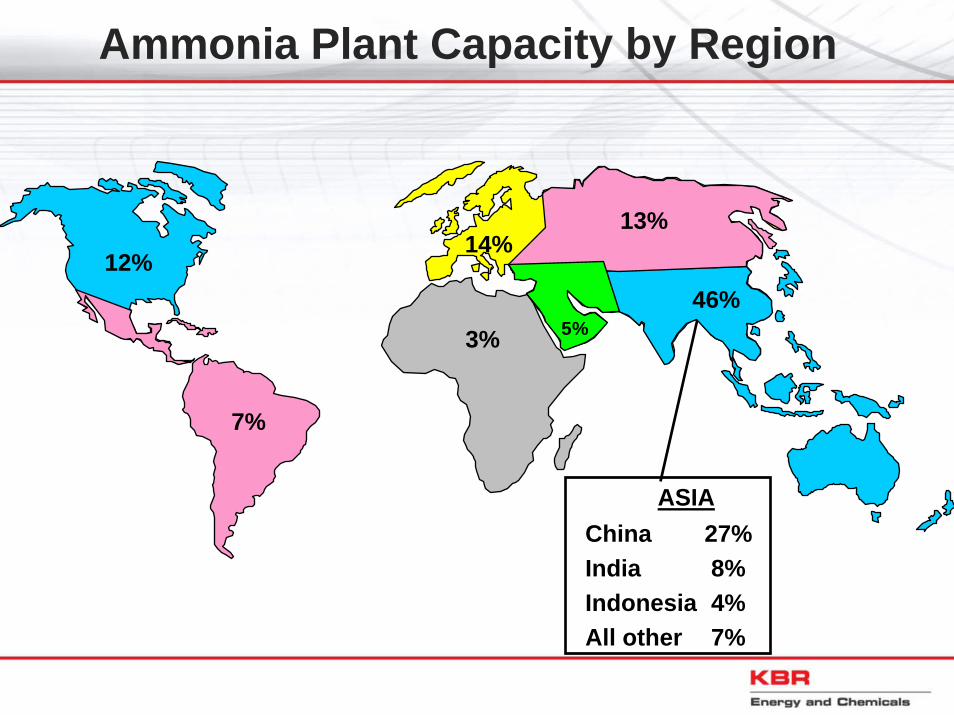
Ammonia Plant Capacity by Region
ASIAChina 27%India 8%Indonesia 4%All other 7%
7%
3%
14%12%
46%
13%
5%
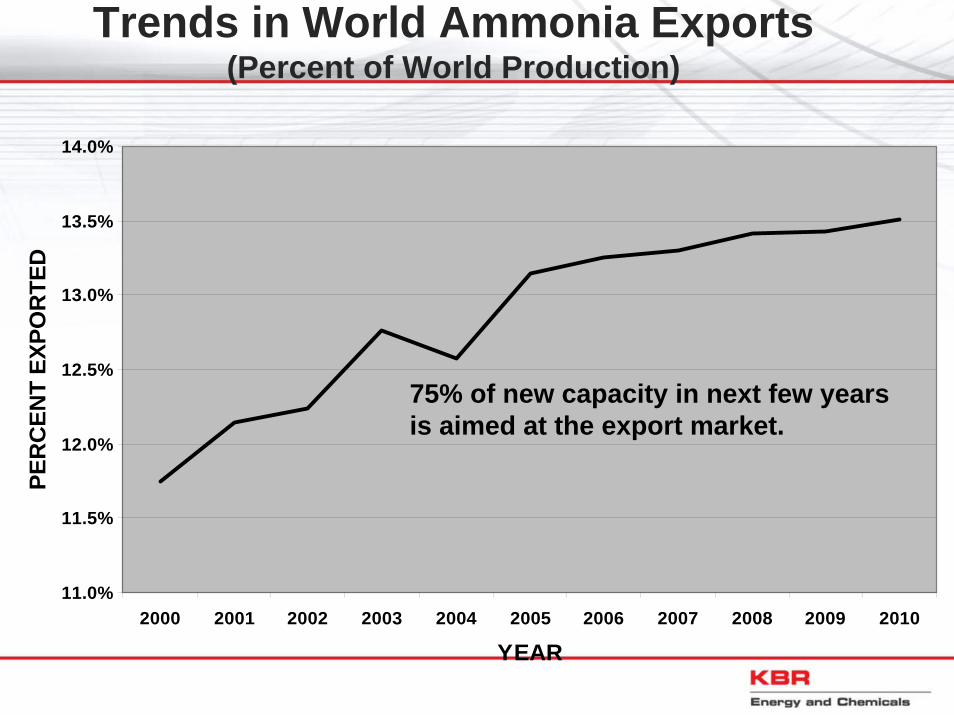
Trends in World Ammonia Exports(Percent of World Production)
11.0%
11.5%
12.0%
12.5%
13.0%
13.5%
14.0%
2000 2001 2002 2003 2004 2005 2006 2007 2008 2009 2010
YEAR
PER
CEN
T EX
POR
TED
75% of new capacity in next few years is aimed at the export market.
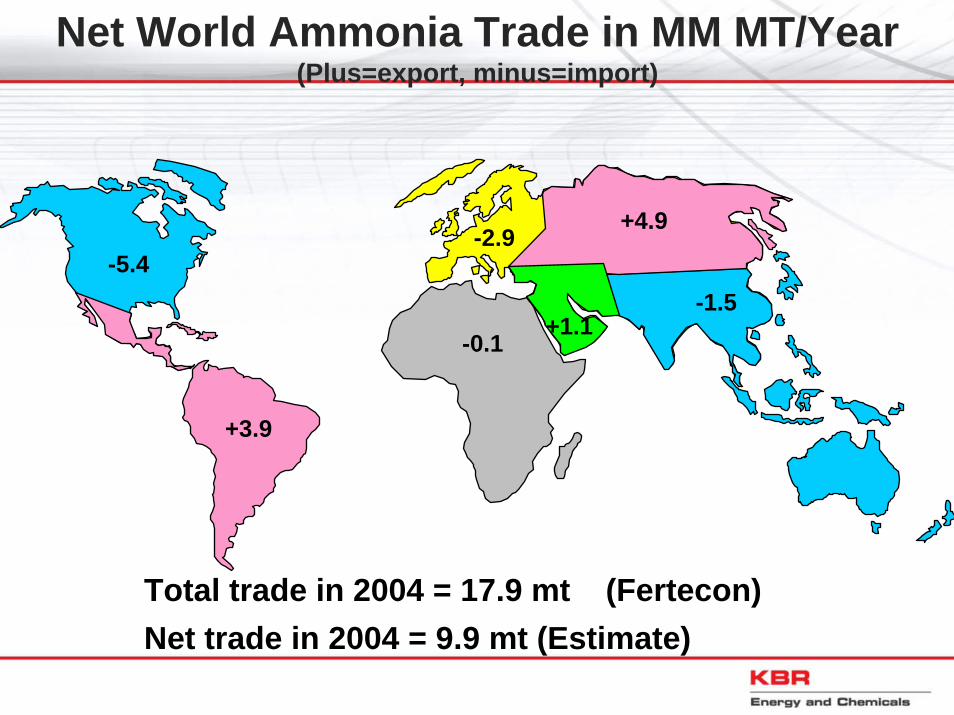
Net World Ammonia Trade in MM MT/Year(Plus=export, minus=import)
+3.9
-0.1
-2.9-5.4
-1.5
+4.9
+1.1
Total trade in 2004 = 17.9 mt (Fertecon)Net trade in 2004 = 9.9 mt (Estimate)
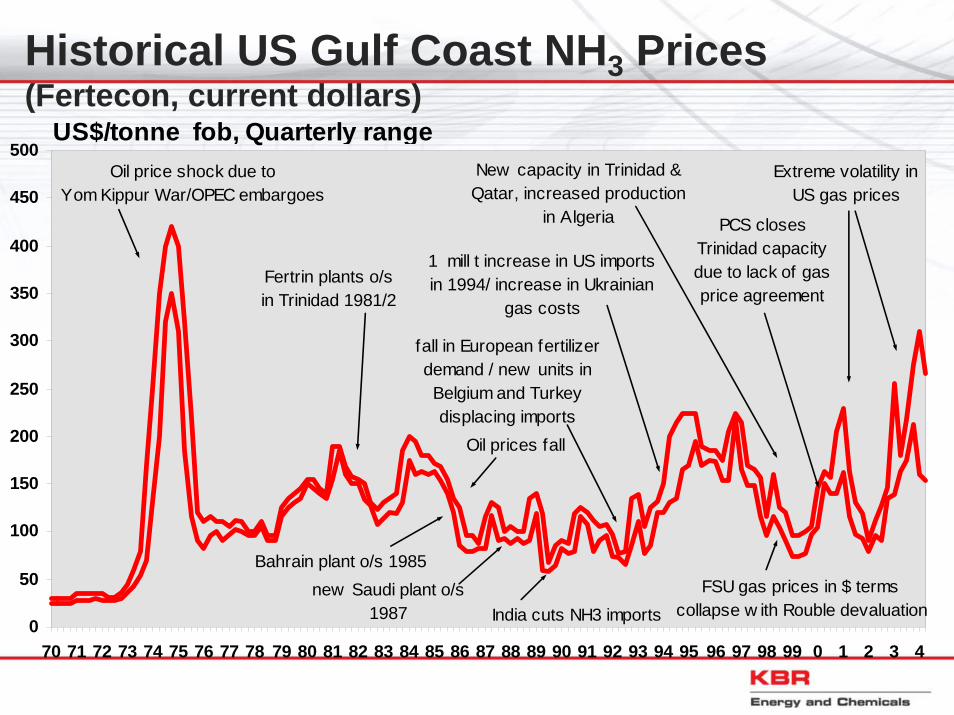
Historical US Gulf Coast NH3 Prices(Fertecon, current dollars)
0
50
100
150
200
250
300
350
400
450
500
70 71 72 73 74 75 76 77 78 79 80 81 82 83 84 85 86 87 88 89 90 91 92 93 94 95 96 97 98 99 0 1 2 3 4
US$/tonne fob, Quarterly range
Bahrain plant o/s 1985new Saudi plant o/s
1987
Oil price shock due to Yom Kippur War/OPEC embargoes
India cuts NH3 imports
Fertrin plants o/s in Trinidad 1981/2
fall in European fertilizer demand / new units in Belgium and Turkey displacing imports
1 mill t increase in US imports in 1994/ increase in Ukrainian
gas costs
New capacity in Trinidad & Qatar, increased production
in Algeria
FSU gas prices in $ terms collapse w ith Rouble devaluation
PCS closes Trinidad capacity due to lack of gas price agreement
Extreme volatility in US gas prices
Oil prices fall
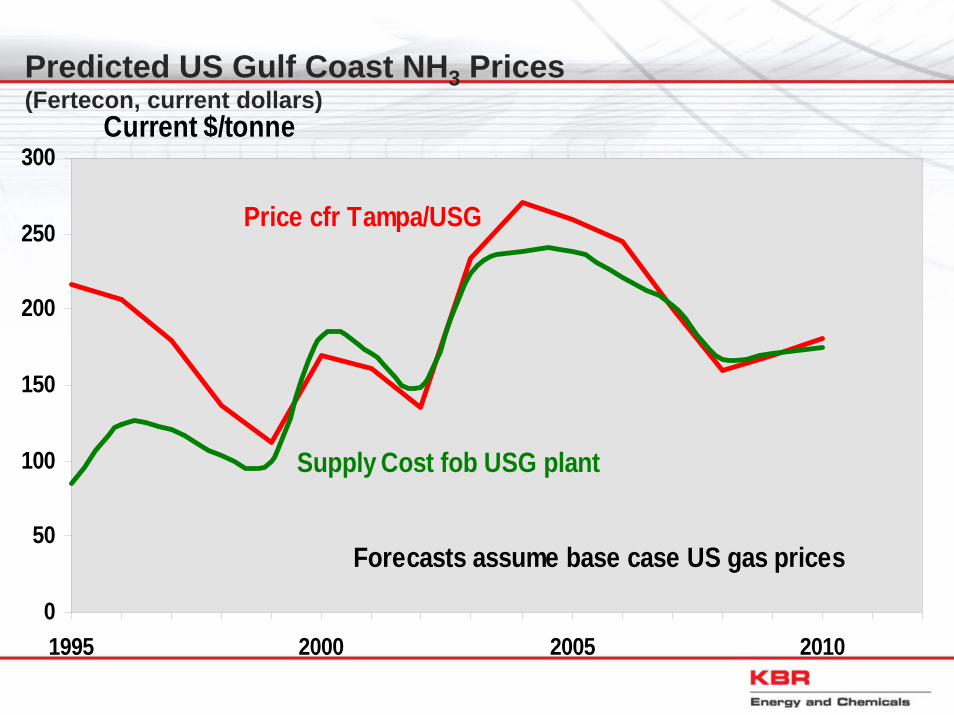
Predicted US Gulf Coast NH3 Prices(Fertecon, current dollars)
0
50
100
150
200
250
300
1995 2000 2005 2010
Current $/tonne
Forecasts assume base case US gas prices
Price cfr Tampa/USG
Supply Cost fob USG plant
Topics to be Covered
• Overview of KBR Activities
• Ammonia Supply & Demand
• History of Ammonia Manufacture
• Ammonia Plant Market Trends
• Current Manufacturing Technology
• Ammonia from Renewable Energy
• Summary
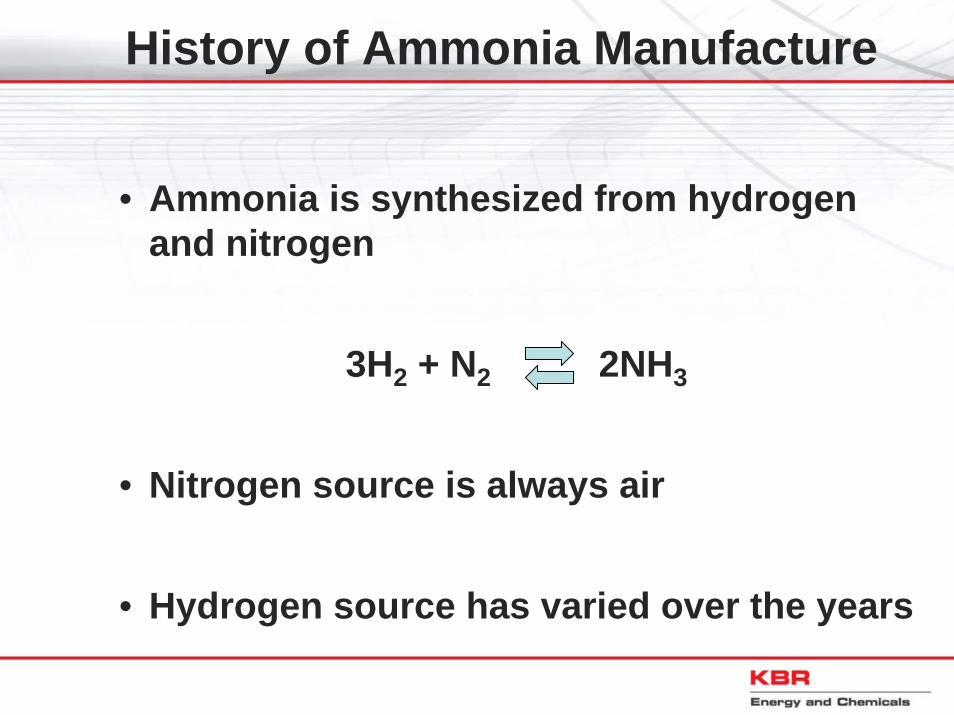
History of Ammonia Manufacture
• Ammonia is synthesized from hydrogen and nitrogen
3H2 + N2 2NH3
• Nitrogen source is always air
• Hydrogen source has varied over the years
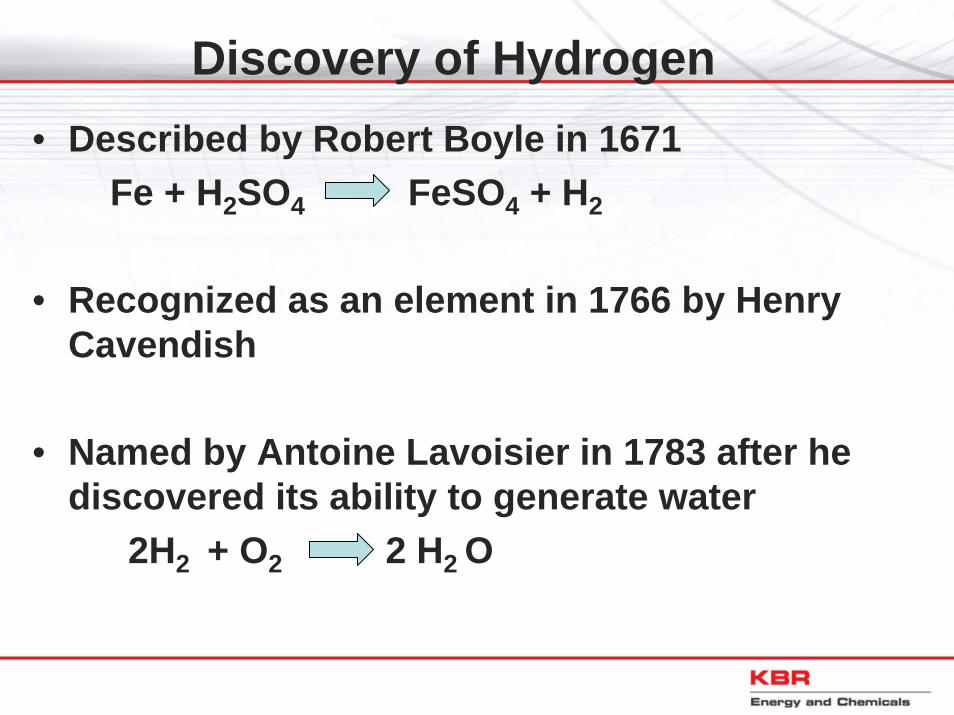
Discovery of Hydrogen• Described by Robert Boyle in 1671
Fe + H2SO4 FeSO4 + H2
• Recognized as an element in 1766 by Henry Cavendish
• Named by Antoine Lavoisier in 1783 after he discovered its ability to generate water
2H2 + O2 2 H2 O
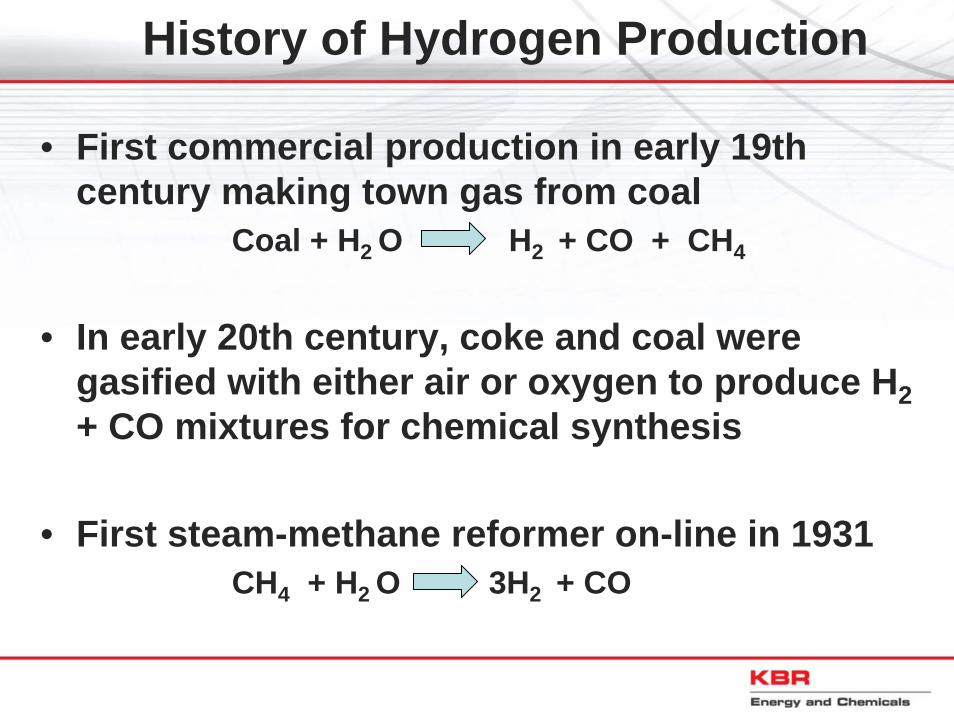
History of Hydrogen Production
• First commercial production in early 19th century making town gas from coal
Coal + H2 O H2 + CO + CH4
• In early 20th century, coke and coal were gasified with either air or oxygen to produce H2 + CO mixtures for chemical synthesis
• First steam-methane reformer on-line in 1931CH4 + H2 O 3H2 + CO
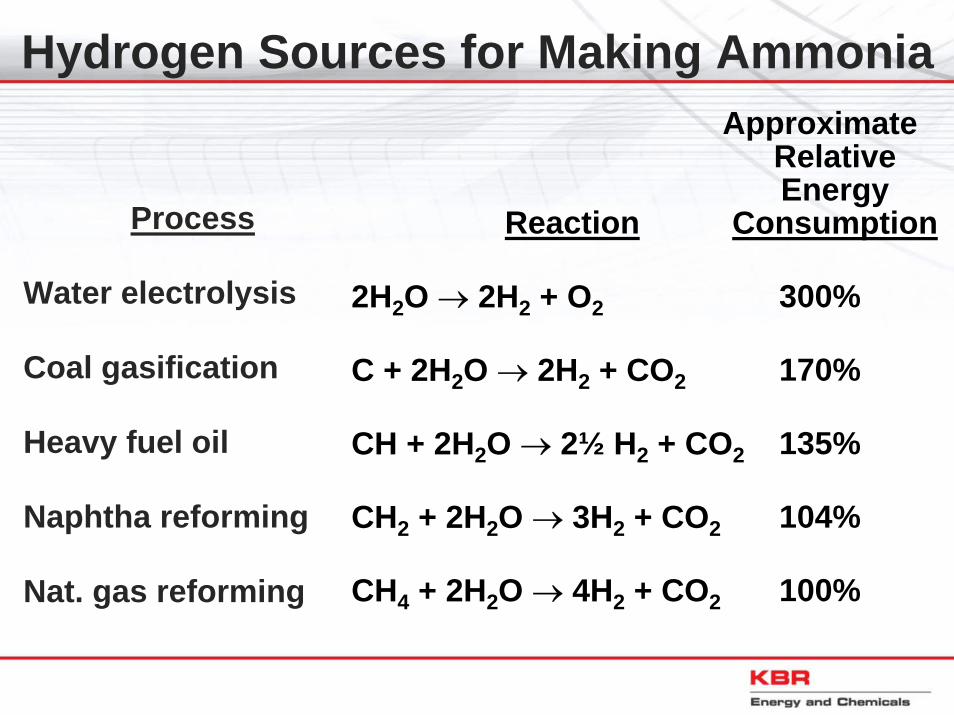
Hydrogen Sources for Making Ammonia
Process
Water electrolysis
Coal gasification
Heavy fuel oil
Naphtha reforming
Nat. gas reforming
Reaction
2H2O → 2H2 + O2
C + 2H2O → 2H2 + CO2
CH + 2H2O → 2½ H2 + CO2
CH2 + 2H2O → 3H2 + CO2
CH4 + 2H2O → 4H2 + CO2
Approximate Relative Energy
Consumption
300%
170%
135%
104%
100%
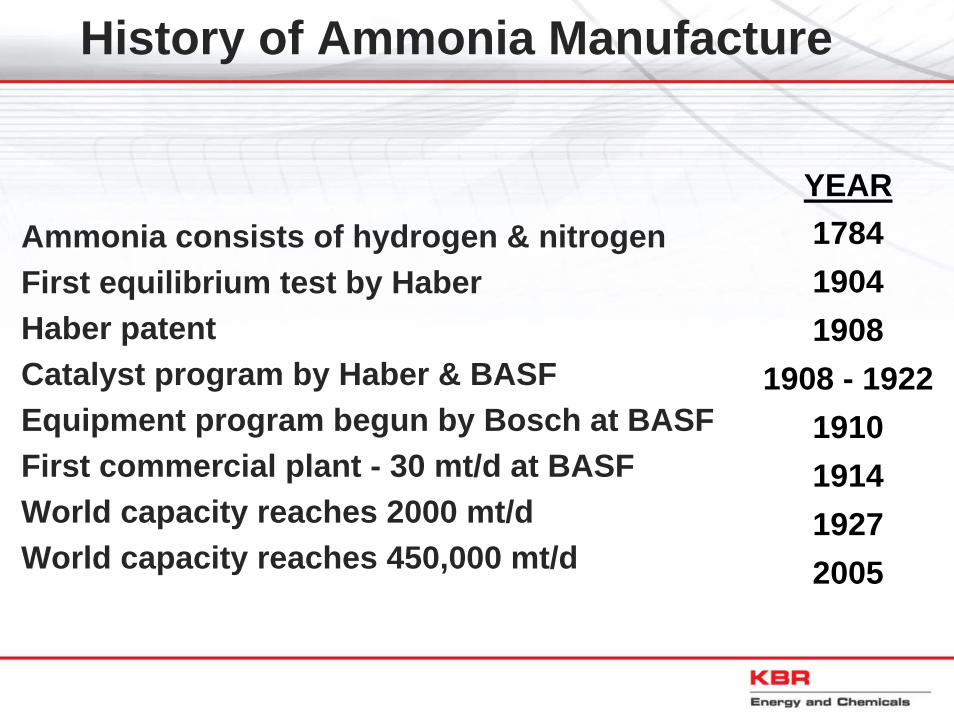
History of Ammonia Manufacture
Ammonia consists of hydrogen & nitrogenFirst equilibrium test by HaberHaber patentCatalyst program by Haber & BASFEquipment program begun by Bosch at BASFFirst commercial plant - 30 mt/d at BASFWorld capacity reaches 2000 mt/dWorld capacity reaches 450,000 mt/d
YEAR178419041908
1908 - 19221910191419272005
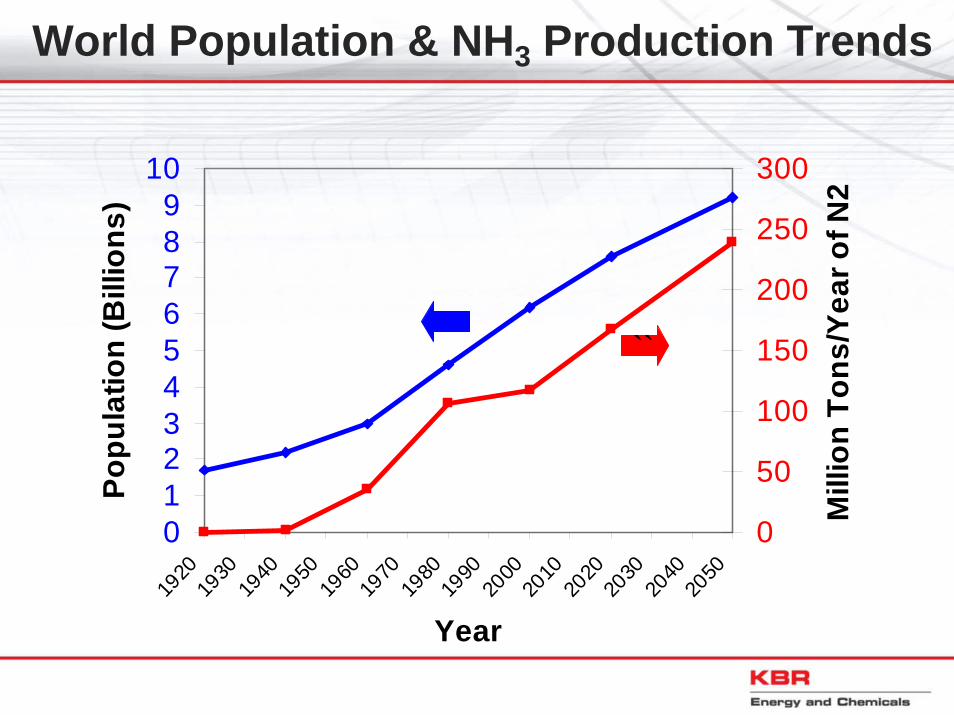
World Population & NH3 Production Trends
0123456789
1019
2019
3019
4019
5019
6019
7019
8019
9020
0020
1020
2020
3020
4020
50
Year
Popu
latio
n (B
illio
ns)
0
50
100
150
200
250
300
Mill
ion
Tons
/Yea
r of N
2
``
Topics to be Covered
• Overview of KBR Activities
• Ammonia Supply & Demand
• History of Ammonia Manufacture
• Ammonia Plant Market Trends
• Current Manufacturing Technology
• Ammonia from Renewable Energy
• Summary
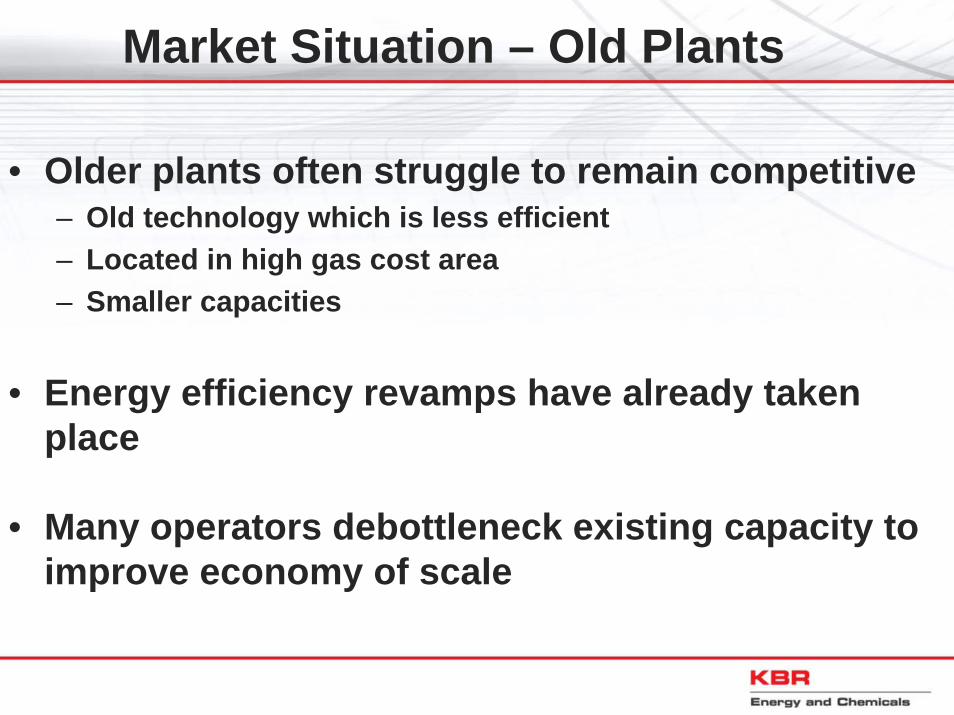
Market Situation – Old Plants
• Older plants often struggle to remain competitive– Old technology which is less efficient– Located in high gas cost area– Smaller capacities
• Energy efficiency revamps have already taken place
• Many operators debottleneck existing capacity to improve economy of scale
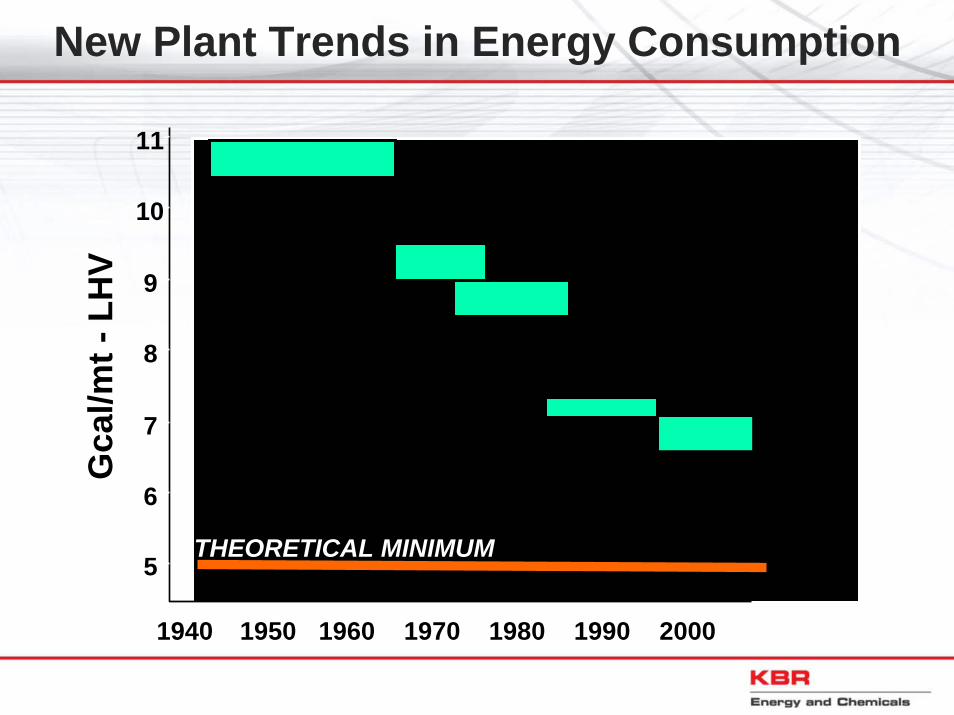
10
9
8
7
6
5
11G
cal/m
t -LH
V
THEORETICAL MINIMUM
1940 1950 1960 1970 1980 1990 2000
New Plant Trends in Energy Consumption
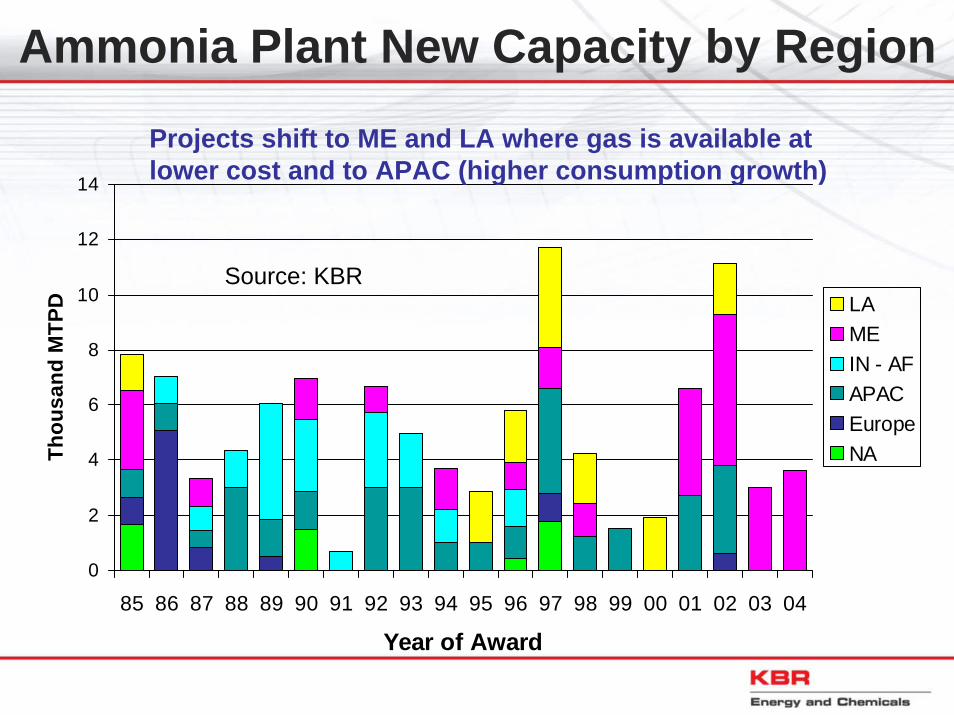
Ammonia Plant New Capacity by Region
0
2
4
6
8
10
12
14
85 86 87 88 89 90 91 92 93 94 95 96 97 98 99 00 01 02 03 04
Year of Award
Thou
sand
MTP
D LAMEIN - AFAPACEuropeNA
Projects shift to ME and LA where gas is available at lower cost and to APAC (higher consumption growth)
Source: KBR
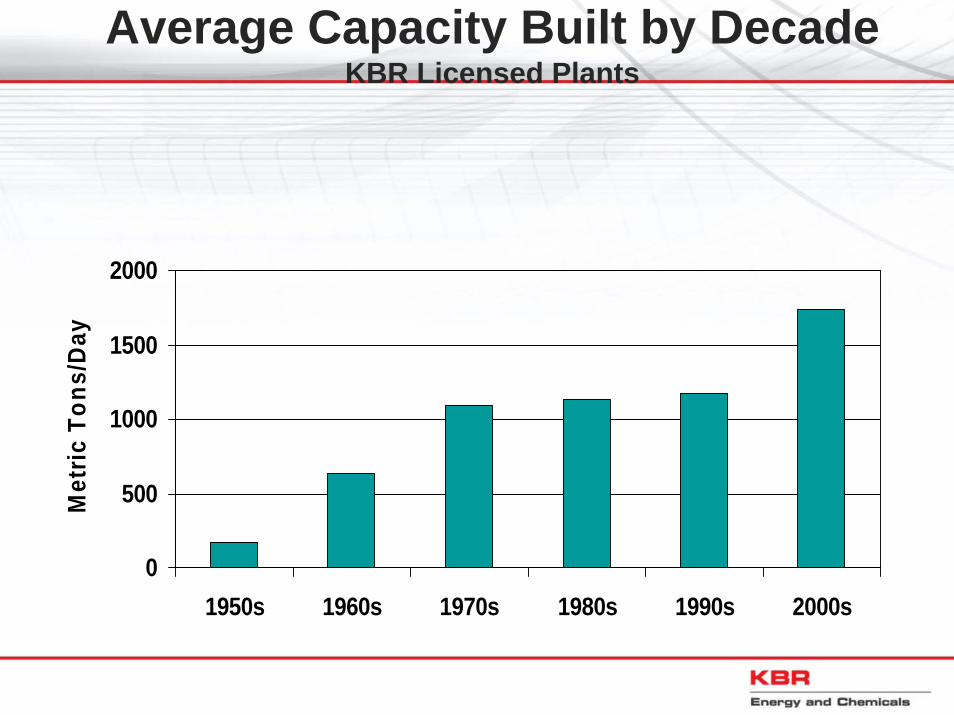
Average Capacity Built by DecadeKBR Licensed Plants
0
500
1000
1500
2000
1950s 1960s 1970s 1980s 1990s 2000s
Met
ric T
ons/
Day
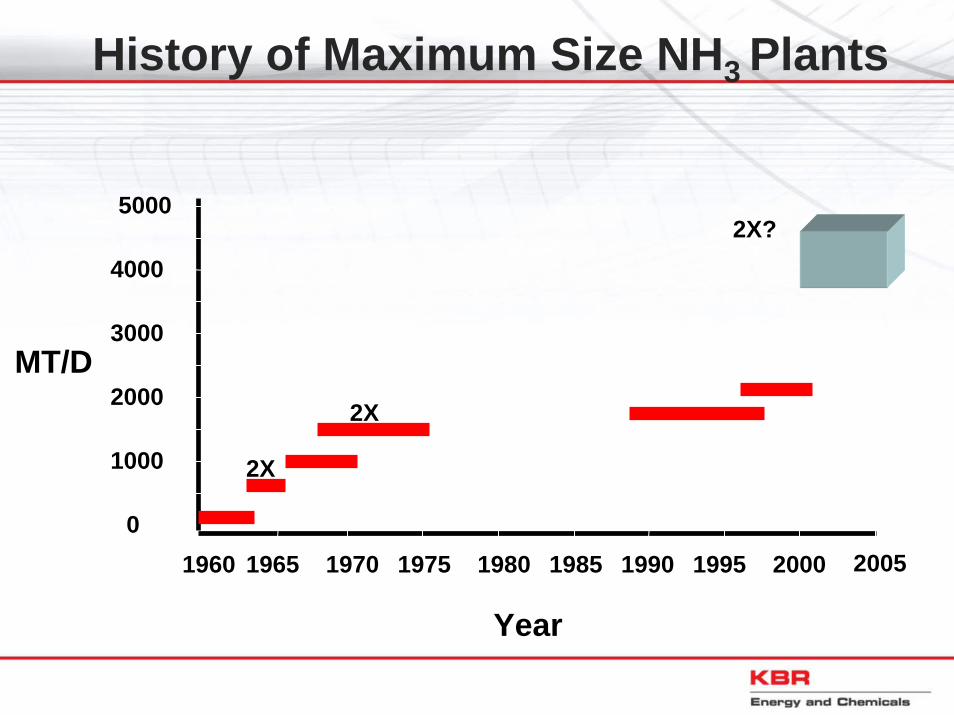
History of Maximum Size NH3 Plants
0
1000
2000
3000
4000
5000
1960 1965 1970 1975 1980 1985 1990 1995 2005
Year
MT/D
2000
2X
2X
2X?
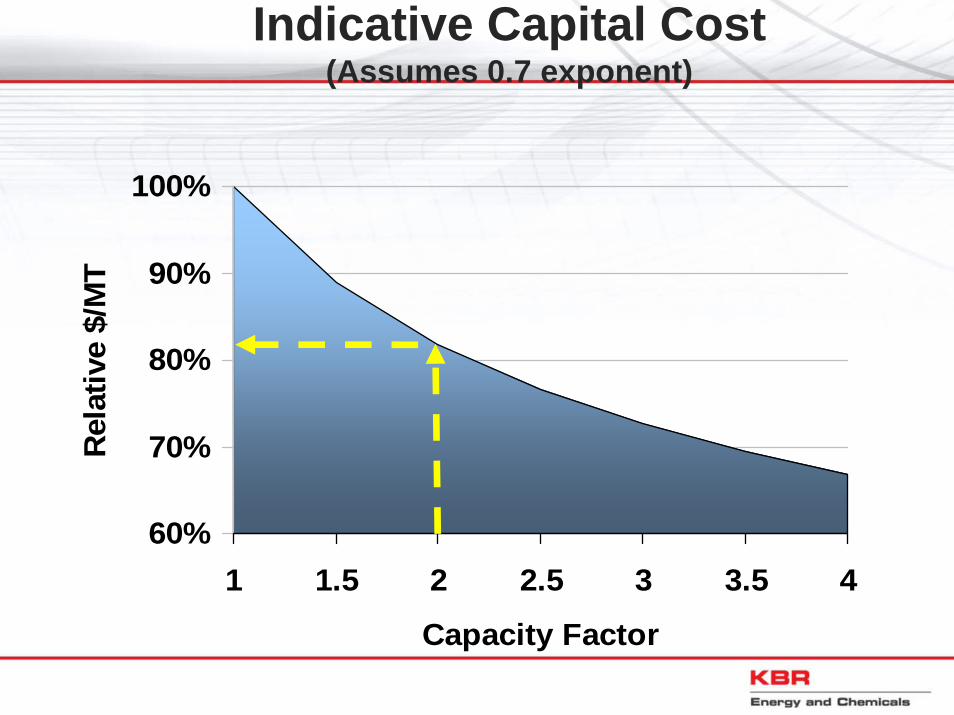
Indicative Capital Cost (Assumes 0.7 exponent)
60%
70%
80%
90%
100%
1 1.5 2 2.5 3 3.5 4
Capacity Factor
Rel
ativ
e $/
MT
Trends in Maximum Capacity• All licensors are now claiming that they can
design single-train plants for >3000 mt/day
• KBR has a 2200 mt/day plant under construction in Australia
• KBR is willing to offer and guarantee a single-train 4000 mt/day plant
• KBR internal studies have shown that a single train capacity of 5000 mt/day is possible
Market Implications – Capacity Trend
• There will be fewer projects
• Large amounts of ammonia (& urea) will suddenly come on the market
• Projects will require more capital, leading to increased industry partnering to share risks
• These “mega-capacity” projects will be in low gas cost areas
Market Implications (Continued)
• These “mega-capacity” plants will be located at coastal sites
• There will be some logistics issues moving large volumes of product
• Plants that are older, smaller, and in locations with high feed costs will continue to shut down
Topics to be Covered
• Overview of KBR Activities
• Ammonia Supply & Demand
• History of Ammonia Manufacture
• Ammonia Plant Market Trends
• Current Manufacturing Technology
• Ammonia from Renewable Energy
• Summary
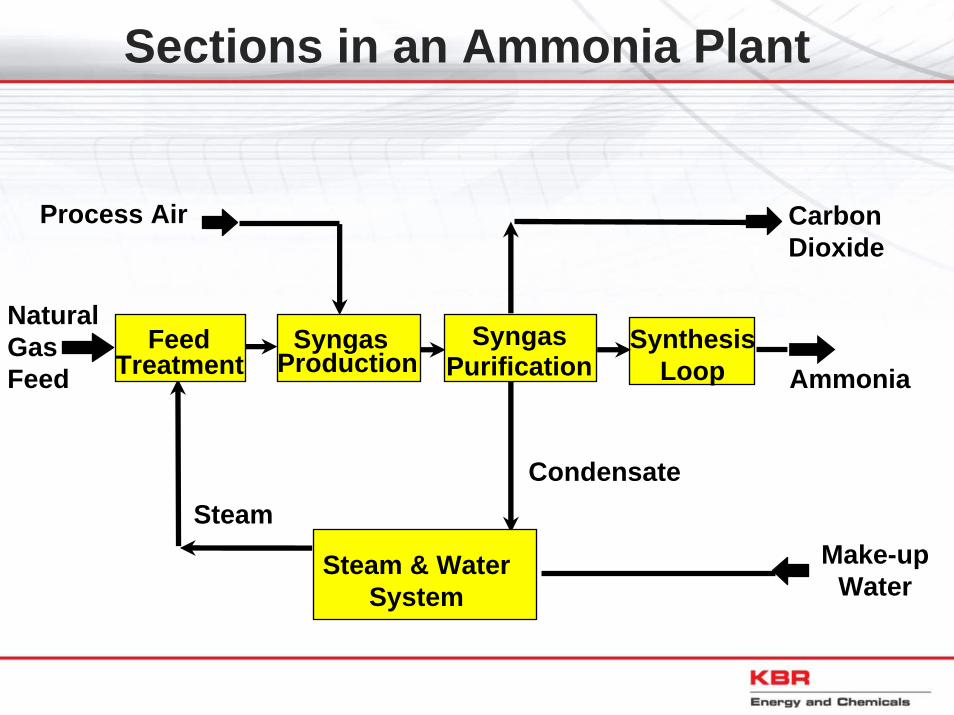
Sections in an Ammonia Plant
SyngasProduction
SyngasPurification
SynthesisLoop
Steam
Ammonia
Process Air CarbonDioxide
Condensate
FeedTreatment
NaturalGasFeed
Steam & WaterSystem
Make-upWater
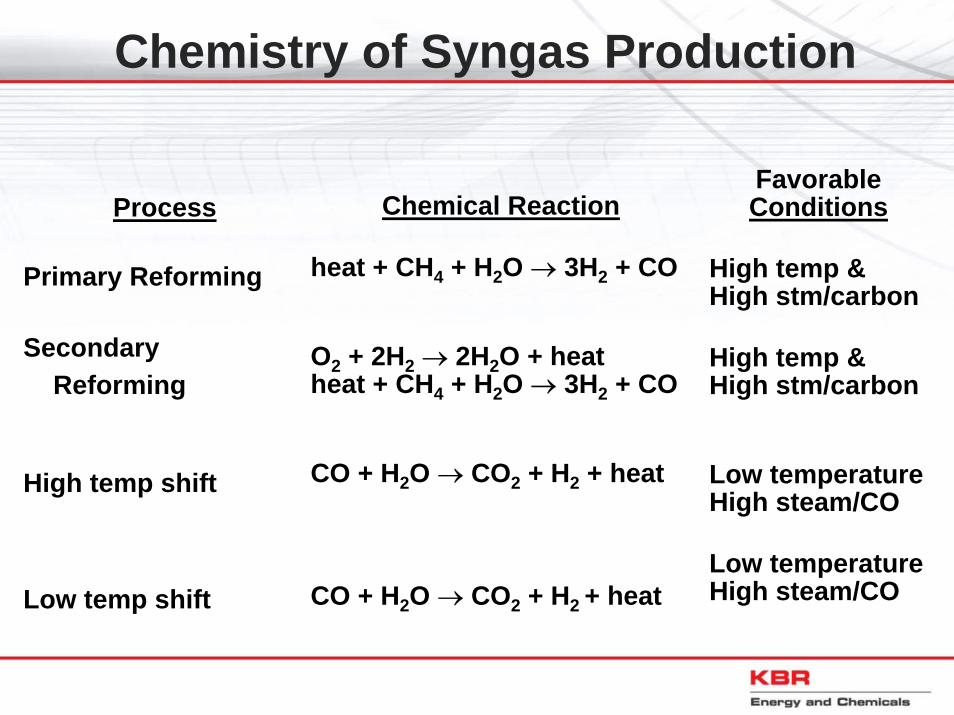
Chemistry of Syngas Production
Process
Primary Reforming
Secondary Reforming
High temp shift
Low temp shift
Chemical Reaction
heat + CH4 + H2O → 3H2 + CO
O2 + 2H2 → 2H2O + heatheat + CH4 + H2O → 3H2 + CO
CO + H2O → CO2 + H2 + heat
CO + H2O → CO2 + H2 + heat
FavorableConditions
High temp & High stm/carbon
High temp & High stm/carbon
Low temperatureHigh steam/CO
Low temperatureHigh steam/CO
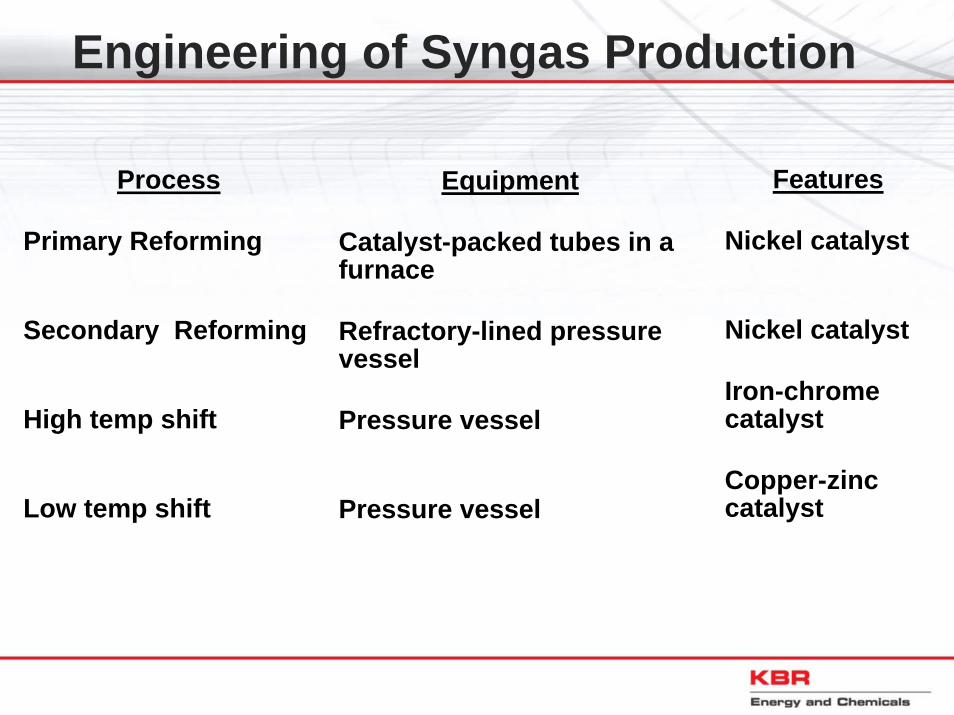
Engineering of Syngas Production
Process
Primary Reforming
Secondary Reforming
High temp shift
Low temp shift
Equipment
Catalyst-packed tubes in a furnace
Refractory-lined pressure vessel
Pressure vessel
Pressure vessel
Features
Nickel catalyst
Nickel catalyst
Iron-chrome catalyst
Copper-zinc catalyst
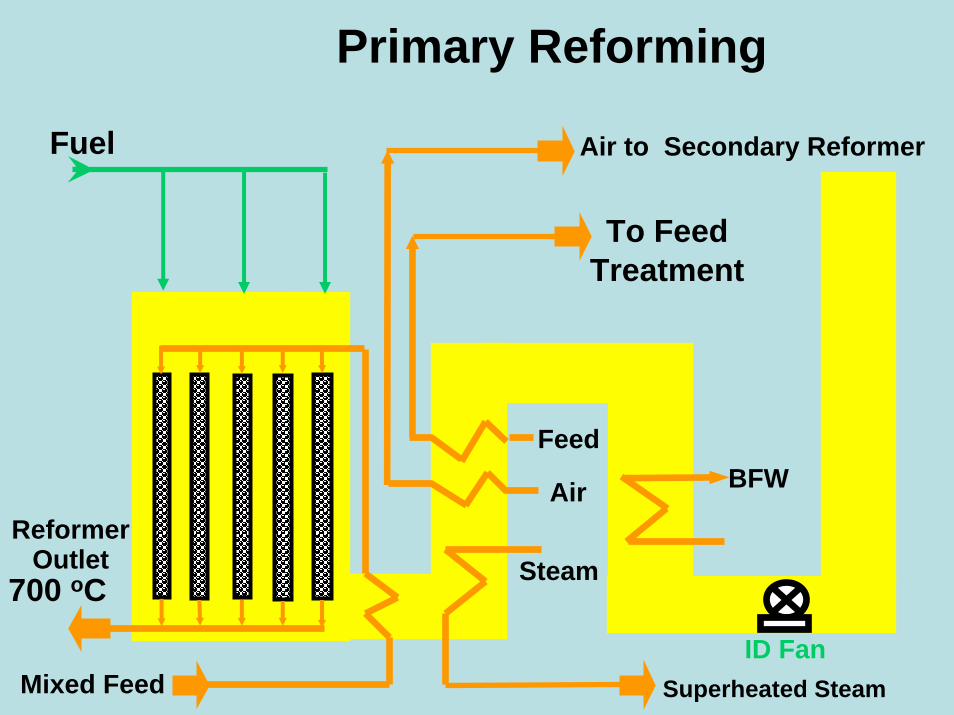
Primary Reforming
Fuel
ID Fan
Feed
Air
Mixed Feed
To Feed Treatment
ReformerOutlet
Air to Secondary Reformer
BFW
Steam
Superheated Steam
700 oC
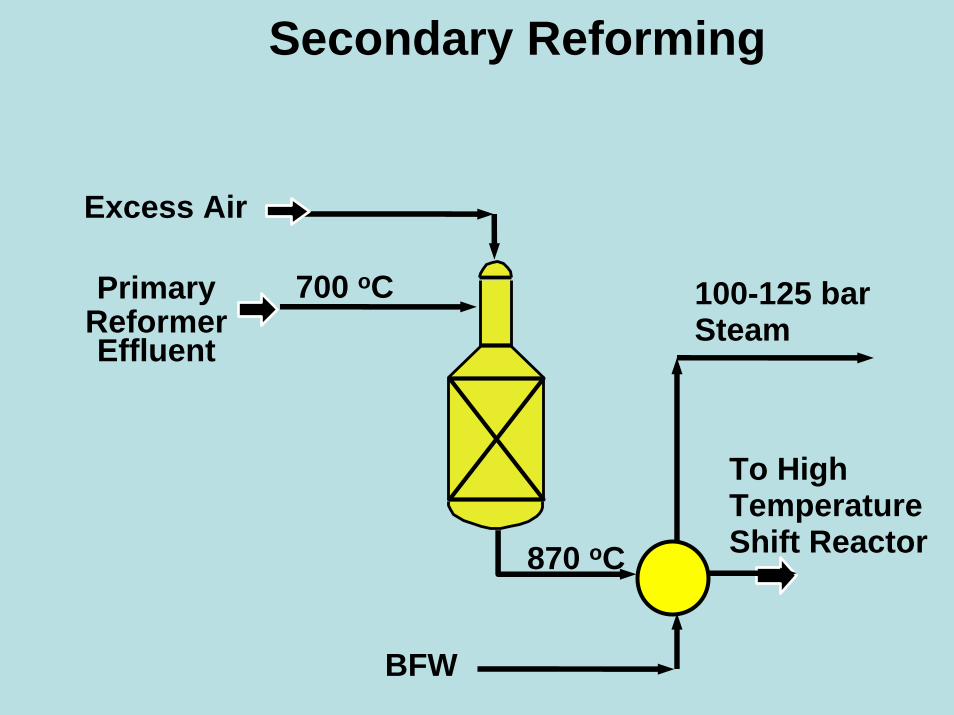
Secondary Reforming
Excess Air
Primary ReformerEffluent
To High Temperature Shift Reactor870 oC
700 oC 100-125 bar Steam
BFW
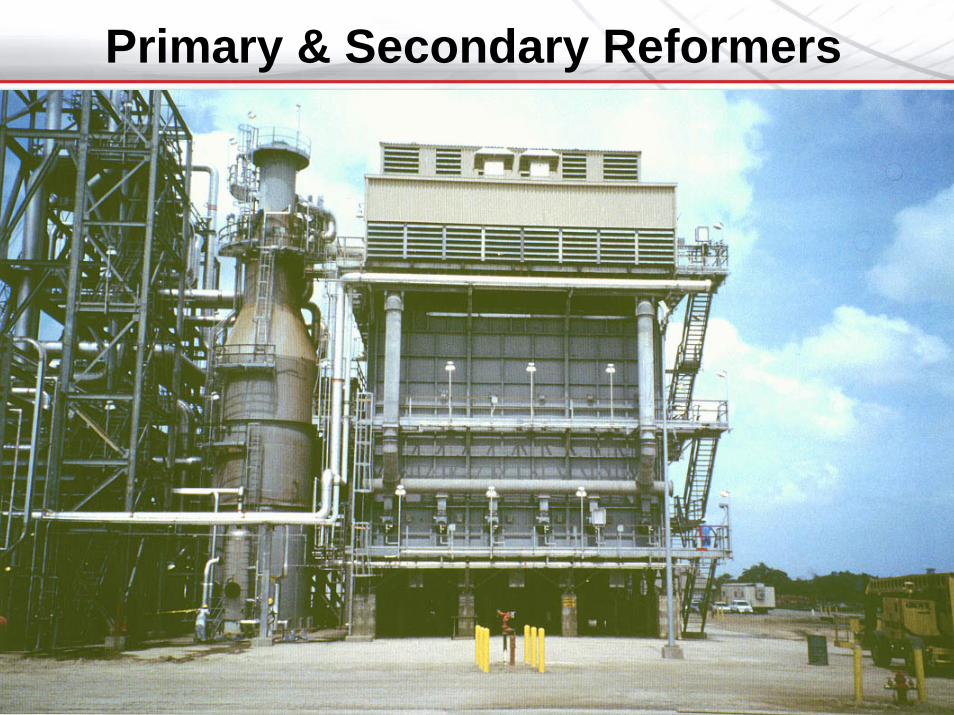
Primary & Secondary Reformers
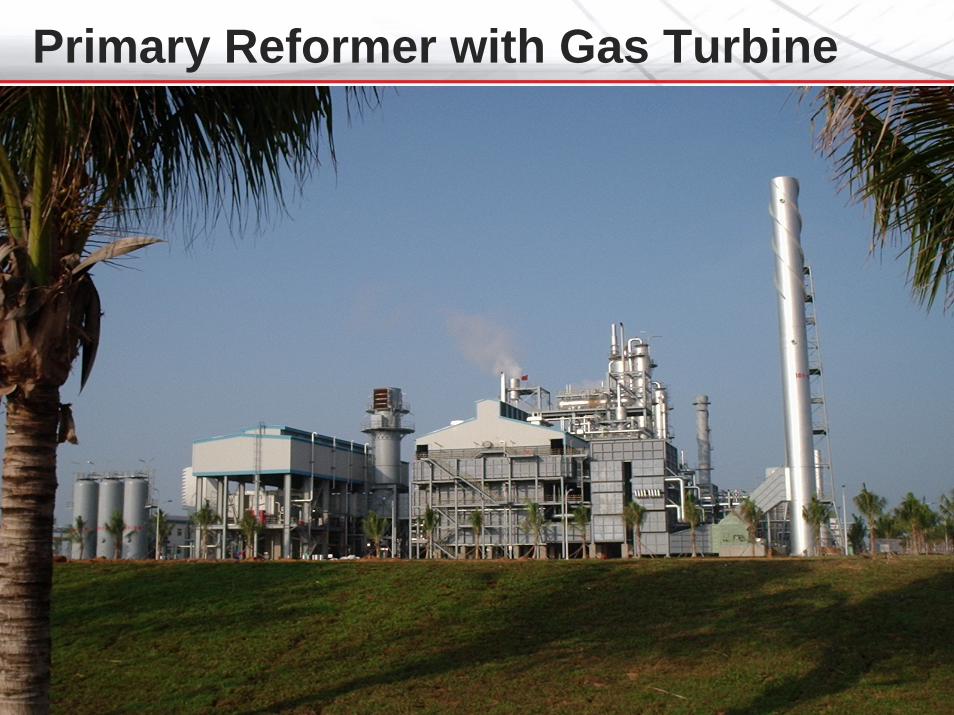
Primary Reformer with Gas Turbine
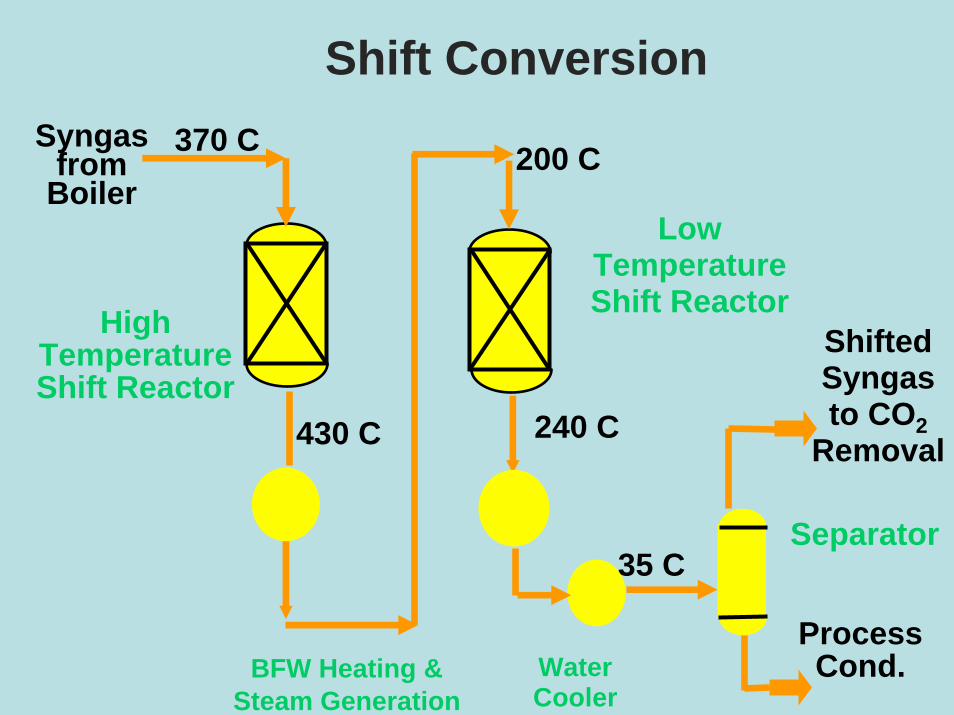
Shift ConversionSyngas
from Boiler
High Temperature Shift Reactor
Shifted Syngas to CO2
Removal
Process Cond.
Separator
BFW Heating &Steam Generation
Water Cooler
370 C
430 C
35 C
Low Temperature Shift Reactor
200 C
240 C
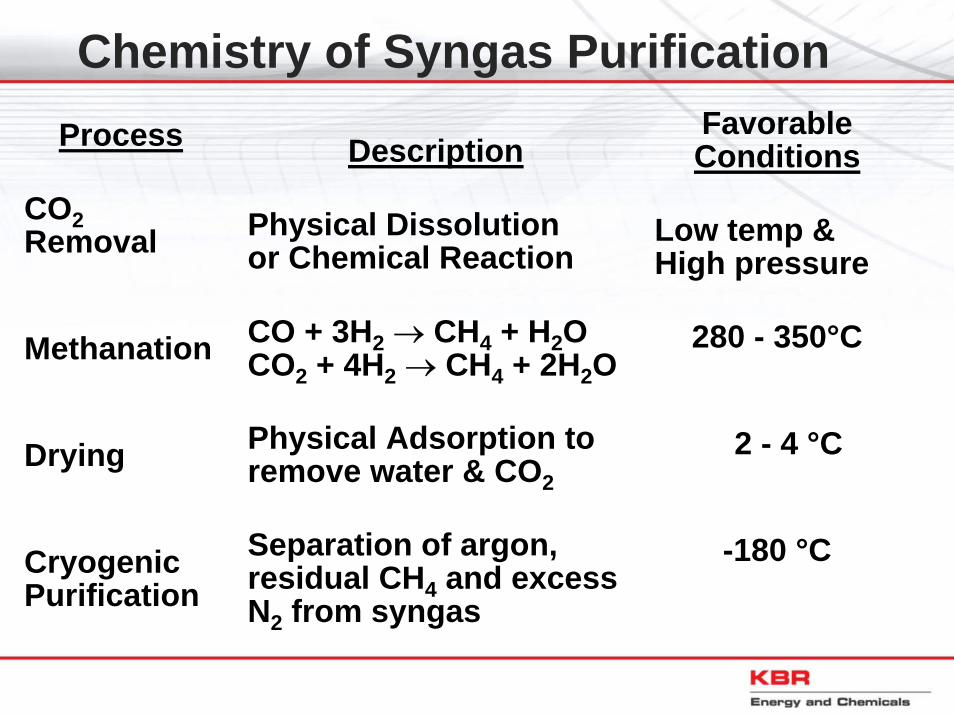
Chemistry of Syngas PurificationProcess
CO2Removal
Methanation
Drying
Cryogenic Purification
Description
Physical Dissolutionor Chemical Reaction
CO + 3H2 → CH4 + H2OCO2 + 4H2 → CH4 + 2H2O
Physical Adsorption to remove water & CO2
Separation of argon, residual CH4 and excess N2 from syngas
FavorableConditions
Low temp & High pressure
280 - 350°C
2 - 4 °C
-180 °C
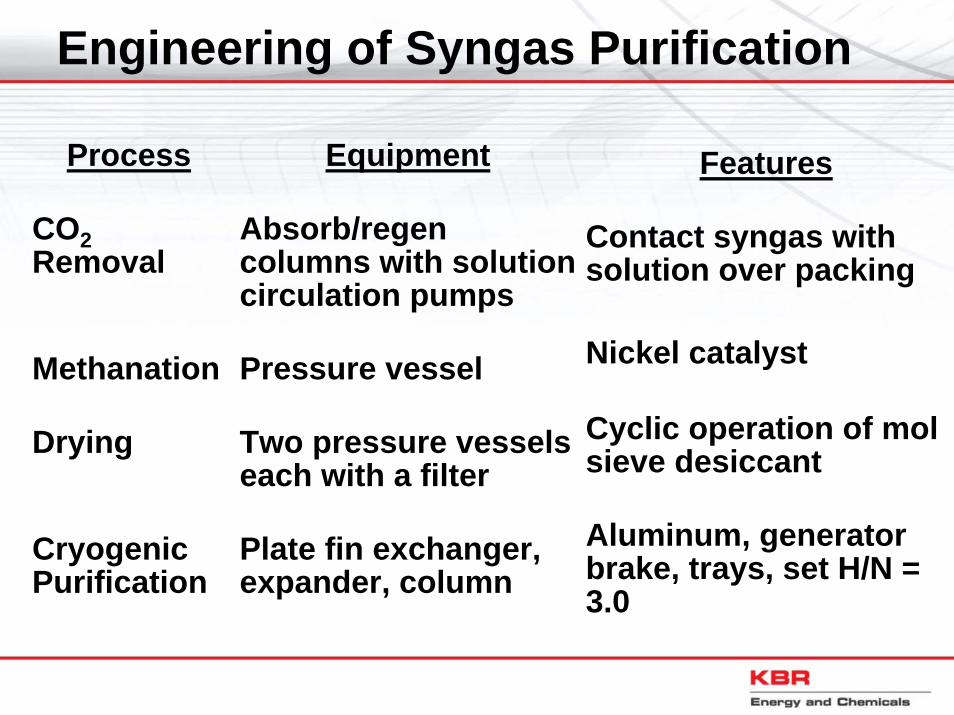
Engineering of Syngas Purification
Process
CO2Removal
Methanation
Drying
Cryogenic Purification
Equipment
Absorb/regencolumns with solution circulation pumps
Pressure vessel
Two pressure vessels each with a filter
Plate fin exchanger, expander, column
Features
Contact syngas with solution over packing
Nickel catalyst
Cyclic operation of mol sieve desiccant
Aluminum, generatorbrake, trays, set H/N = 3.0
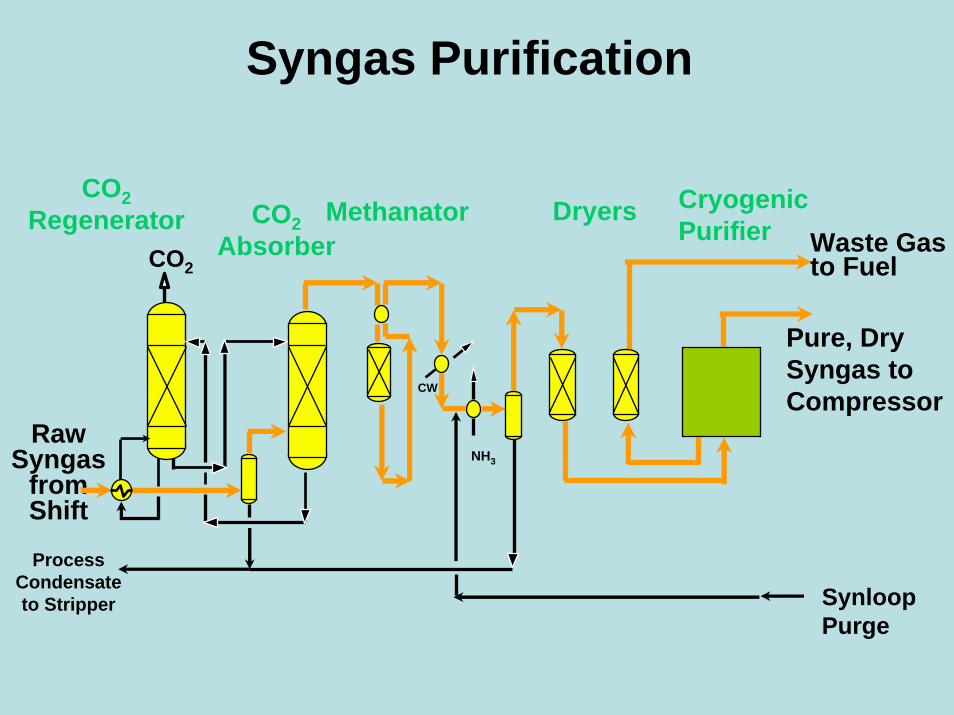
Syngas Purification
RawSyngas
fromShift
CO2
CO2Absorber
Dryers
NH3
CW
Cryogenic Purifier Waste Gas
to Fuel
Pure, DrySyngas toCompressor
CO2Regenerator
SynloopPurge
Methanator
ProcessCondensateto Stripper
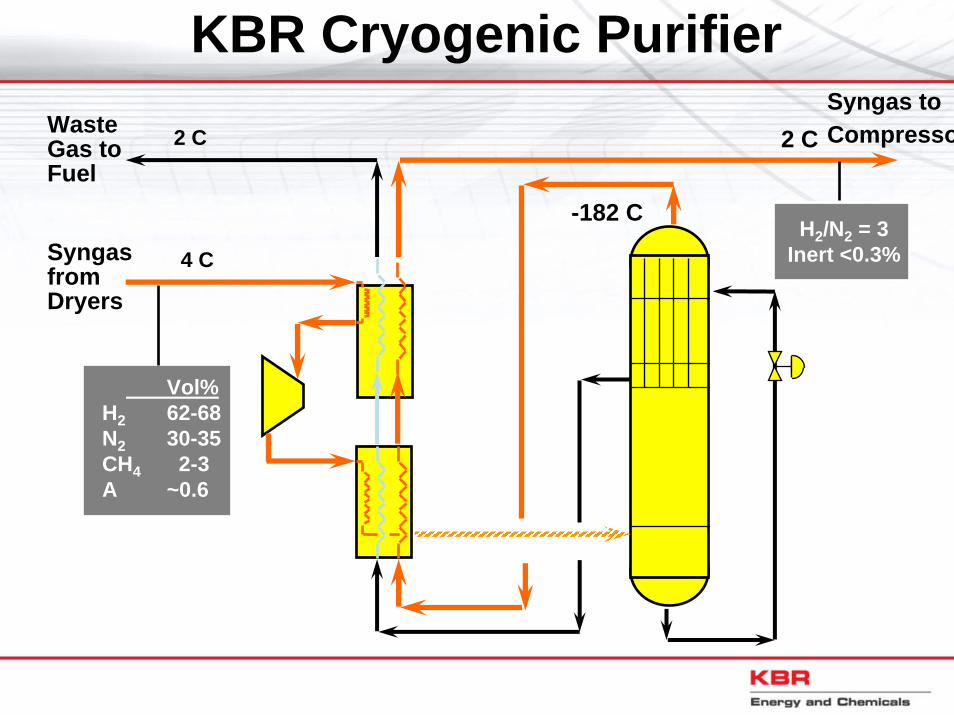
KBR Cryogenic PurifierWaste Gas to Fuel
Syngas from Dryers
2 C
4 C
Vol%H2 62-68N2 30-35CH4 2-3A ~0.6
-182 C
2 C
H2/N2 = 3Inert <0.3%
Syngas to Compresso

CO2 Removal System1500 t/d plant in China
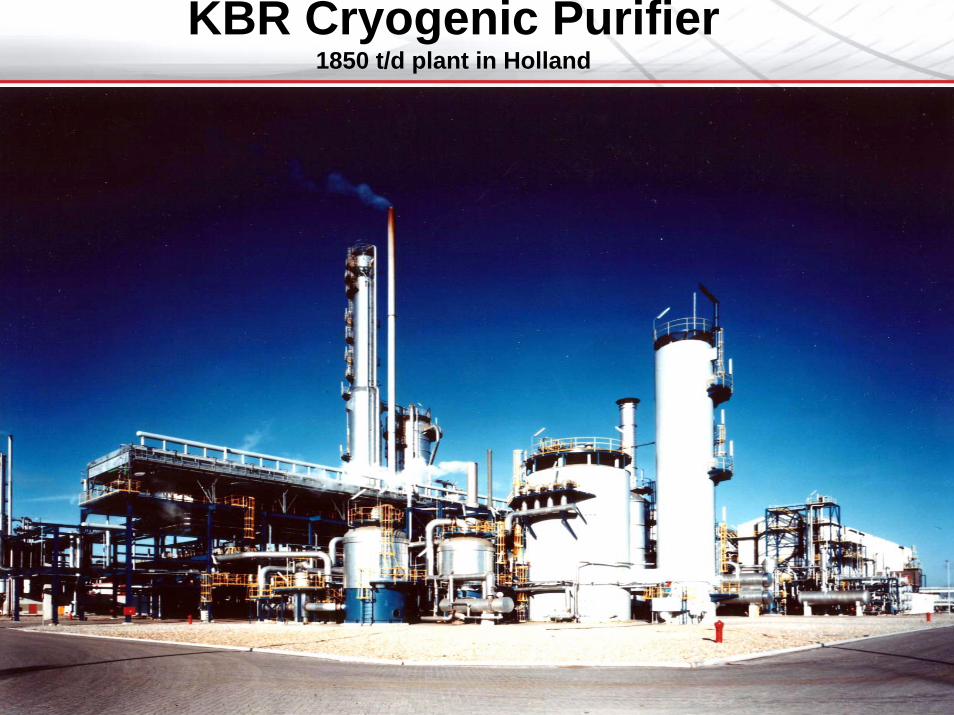
KBR Cryogenic Purifier1850 t/d plant in Holland
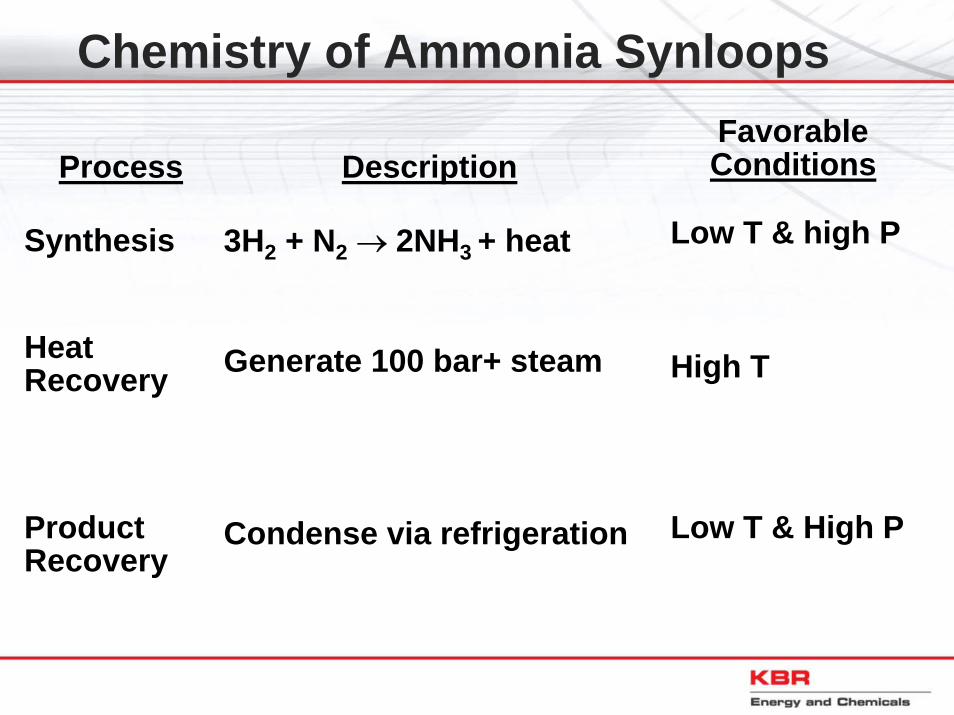
Chemistry of Ammonia Synloops
Process
Synthesis
Heat Recovery
Product Recovery
Description
3H2 + N2 → 2NH3 + heat
Generate 100 bar+ steam
Condense via refrigeration
FavorableConditions
Low T & high P
High T
Low T & High P
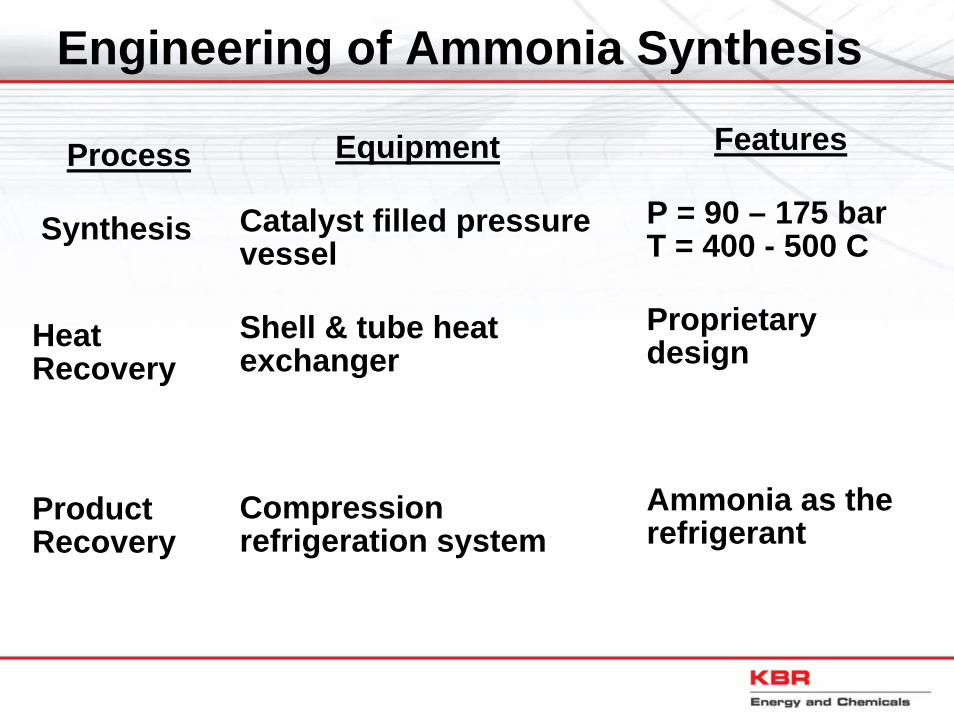
Engineering of Ammonia Synthesis
Process
Synthesis
Heat Recovery
Product Recovery
Equipment
Catalyst filled pressure vessel
Shell & tube heat exchanger
Compression refrigeration system
Features
P = 90 – 175 bar T = 400 - 500 C
Proprietary design
Ammonia as the refrigerant
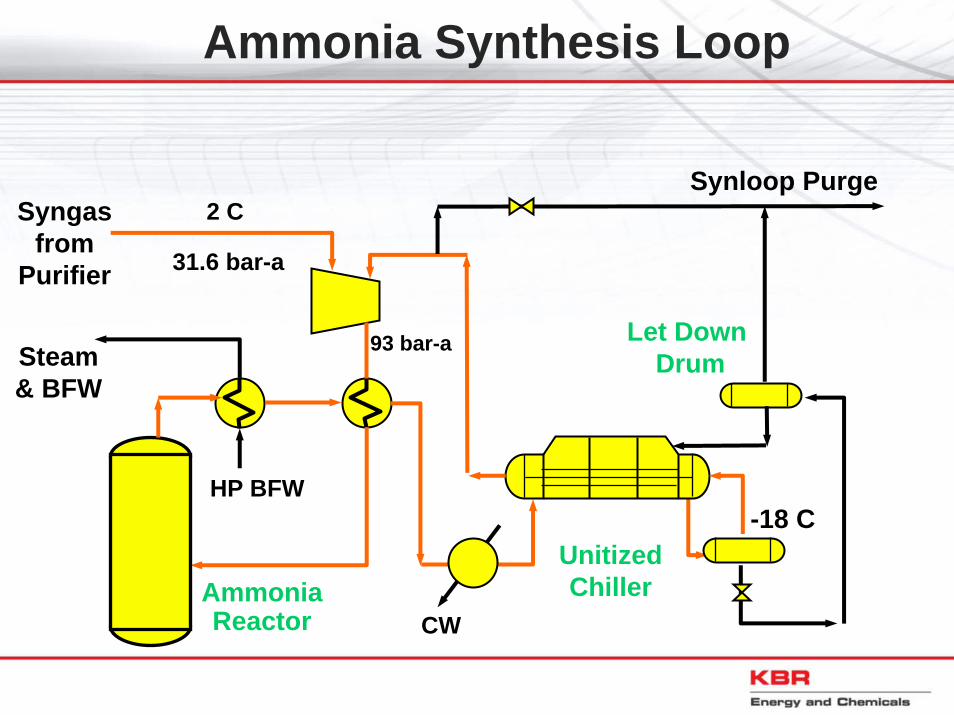
Ammonia Synthesis Loop
Syngasfrom
Purifier
Steam & BFW
HP BFW
CW
Synloop Purge
-18 C
93 bar-a
2 C
31.6 bar-a
AmmoniaReactor
UnitizedChiller
Let Down Drum
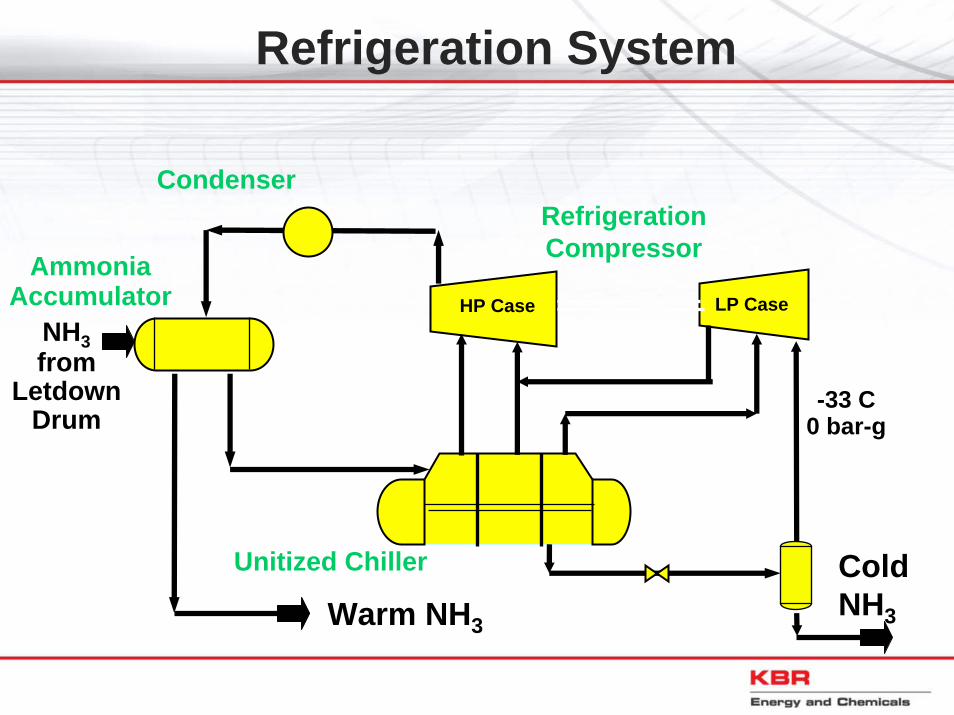
Refrigeration System
LP CaseHP Case
-33 C0 bar-g
Condenser
Unitized Chiller
AmmoniaAccumulator
RefrigerationCompressor
NH3from
LetdownDrum
ColdNH3Warm NH3
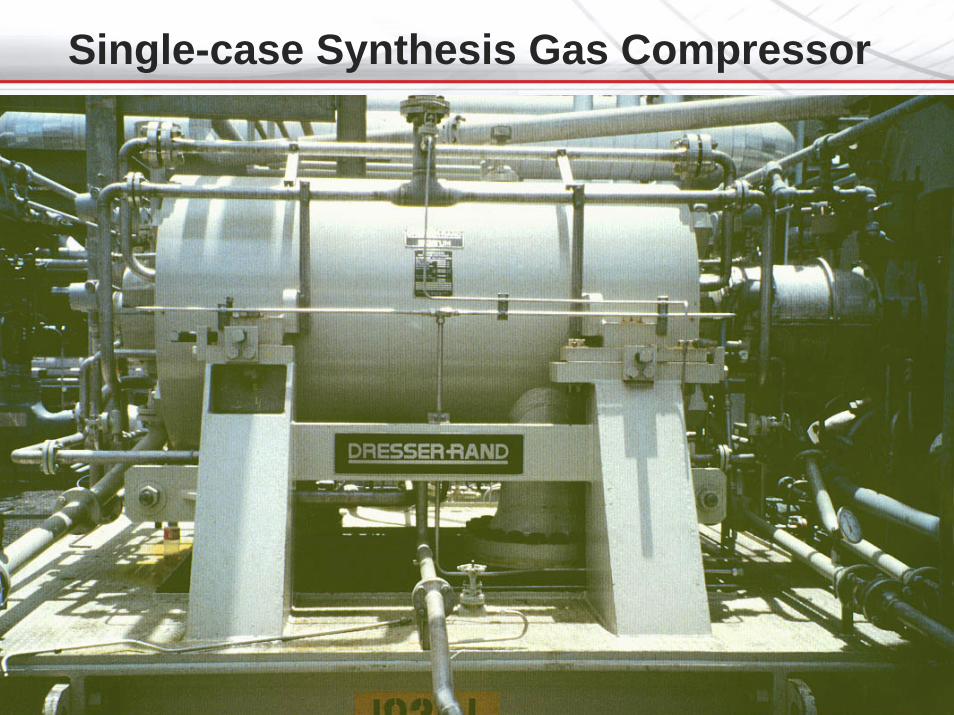
Single-case Synthesis Gas Compressor
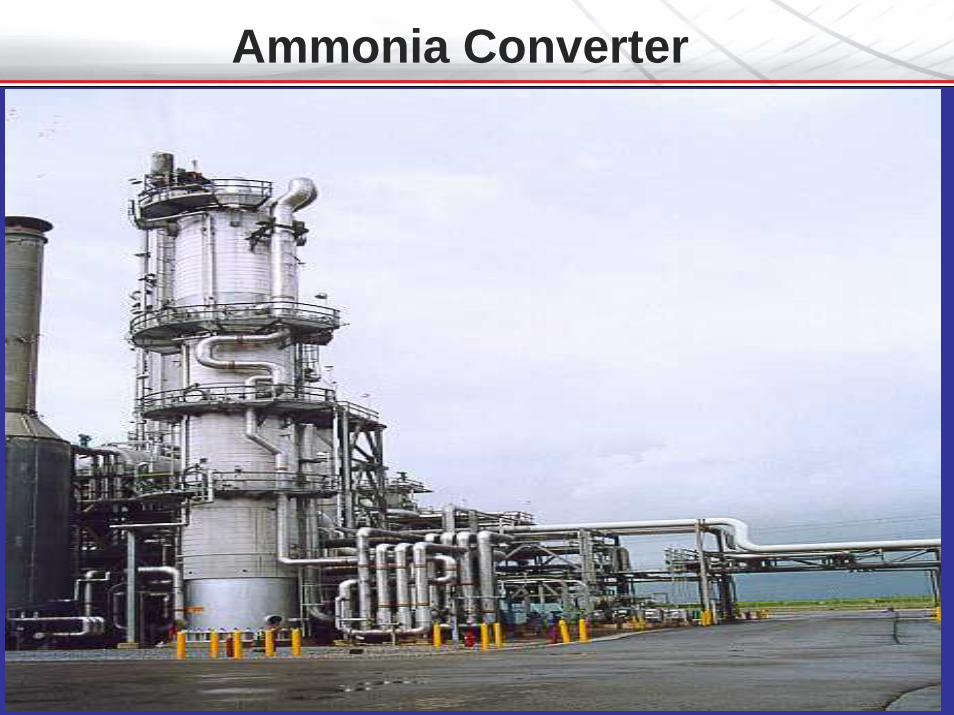
Ammonia Converter
KAAP Catalyst
Topics to be Covered
• Overview of KBR Activities
• Ammonia Supply & Demand
• History of Ammonia Manufacture
• Ammonia Plant Market Trends
• Current Manufacturing Technology
• Ammonia from Renewable Energy
• Summary
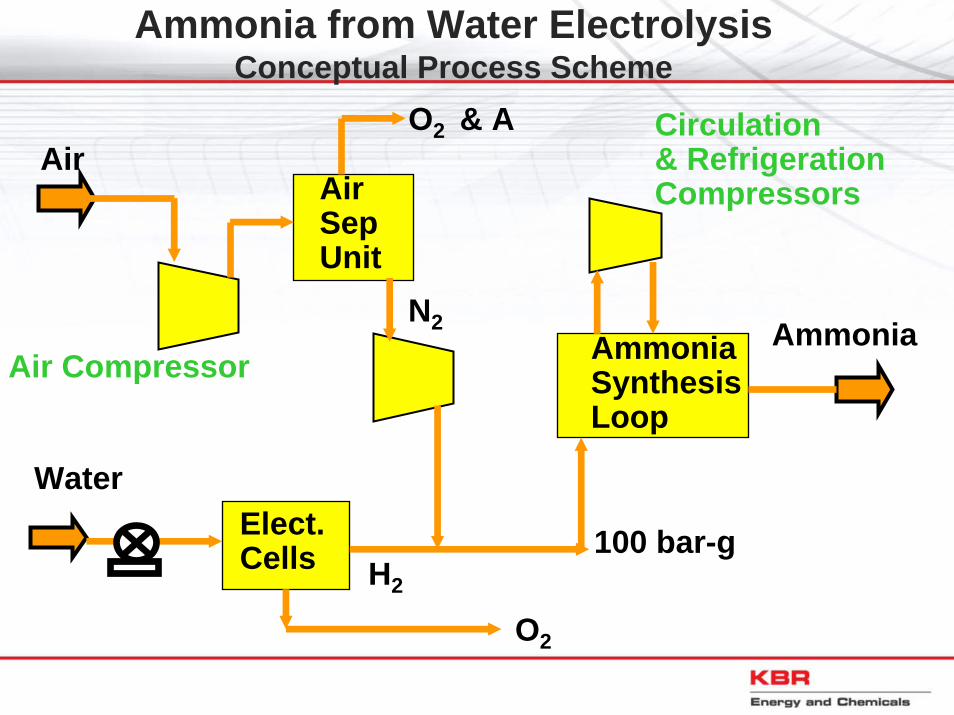
Ammonia from Water ElectrolysisConceptual Process Scheme
Air
Water
AirSepUnit
AmmoniaSynthesisLoop
Ammonia
Circulation& RefrigerationCompressors
100 bar-gElect.Cells
N2
H2
O2 & A
O2
Air Compressor
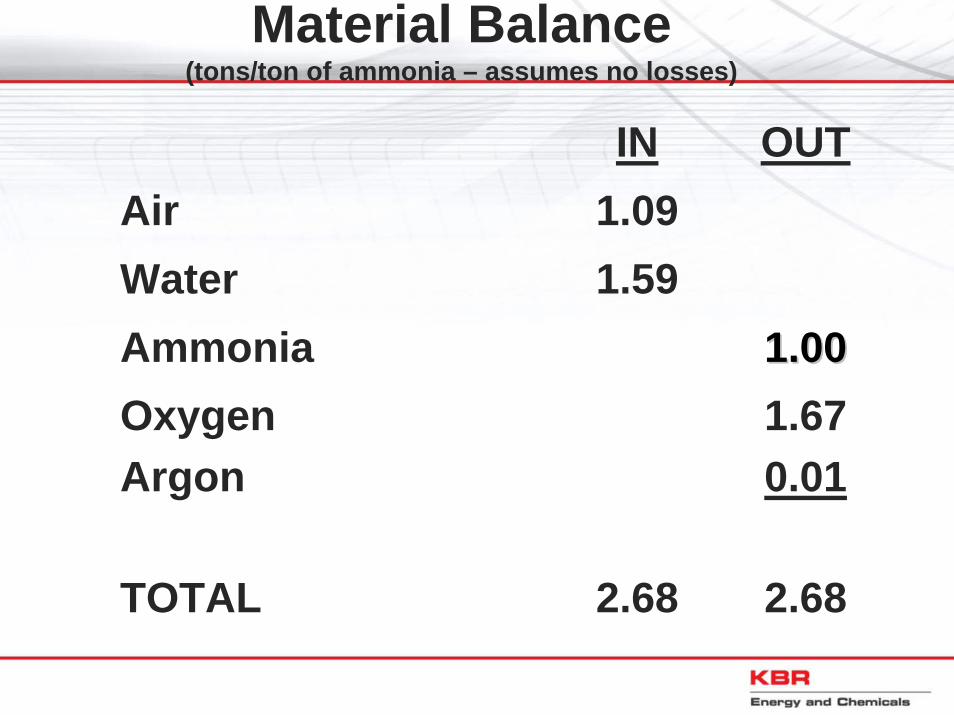
Material Balance(tons/ton of ammonia – assumes no losses)
IN OUTAir 1.09Water 1.59Ammonia 1.001.00OxygenArgon
1.670.01
TOTAL 2.68 2.68
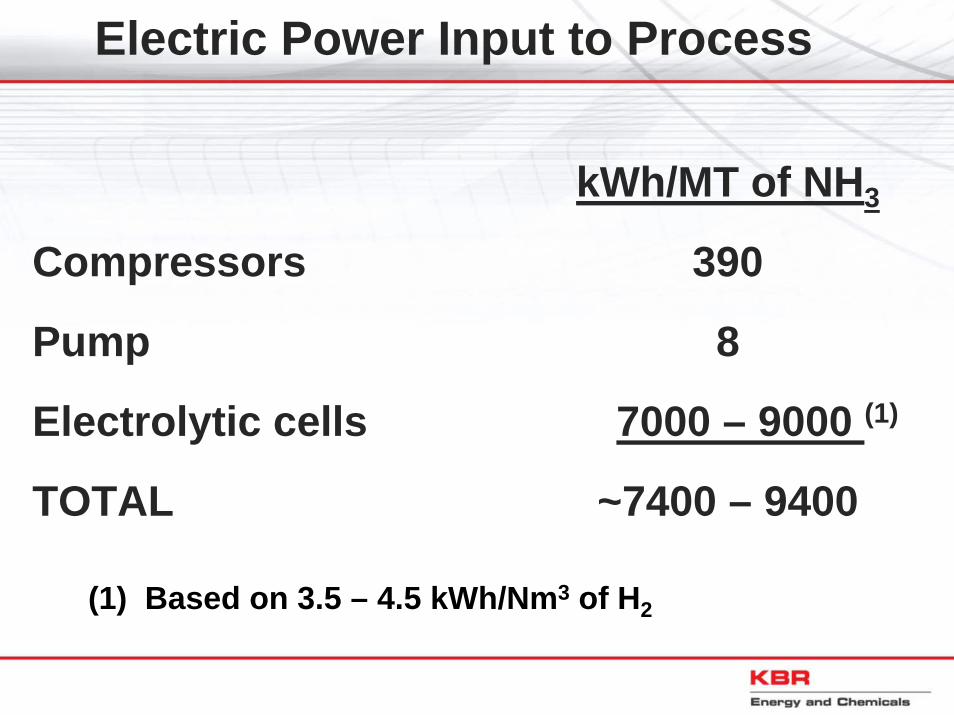
Electric Power Input to Process
kWh/MT of NH3
Compressors 390
Pump 8
Electrolytic cells 7000 – 9000 (1)
TOTAL ~7400 – 9400
(1) Based on 3.5 – 4.5 kWh/Nm3 of H2
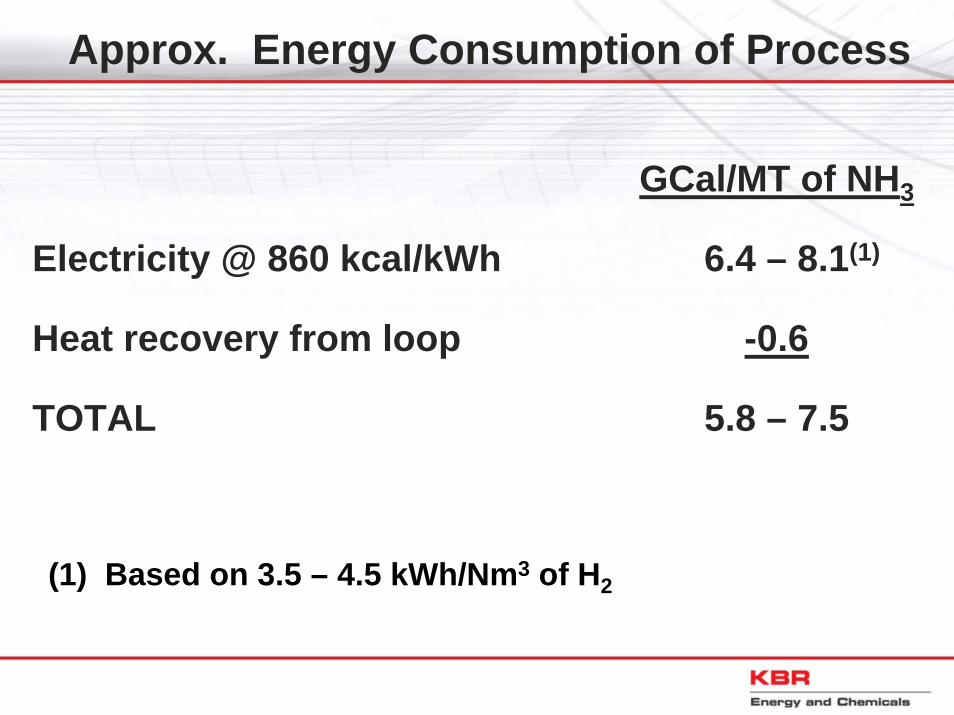
Approx. Energy Consumption of Process
GCal/MT of NH3
Electricity @ 860 kcal/kWh 6.4 – 8.1(1)
Heat recovery from loop -0.6
TOTAL 5.8 – 7.5
(1) Based on 3.5 – 4.5 kWh/Nm3 of H2
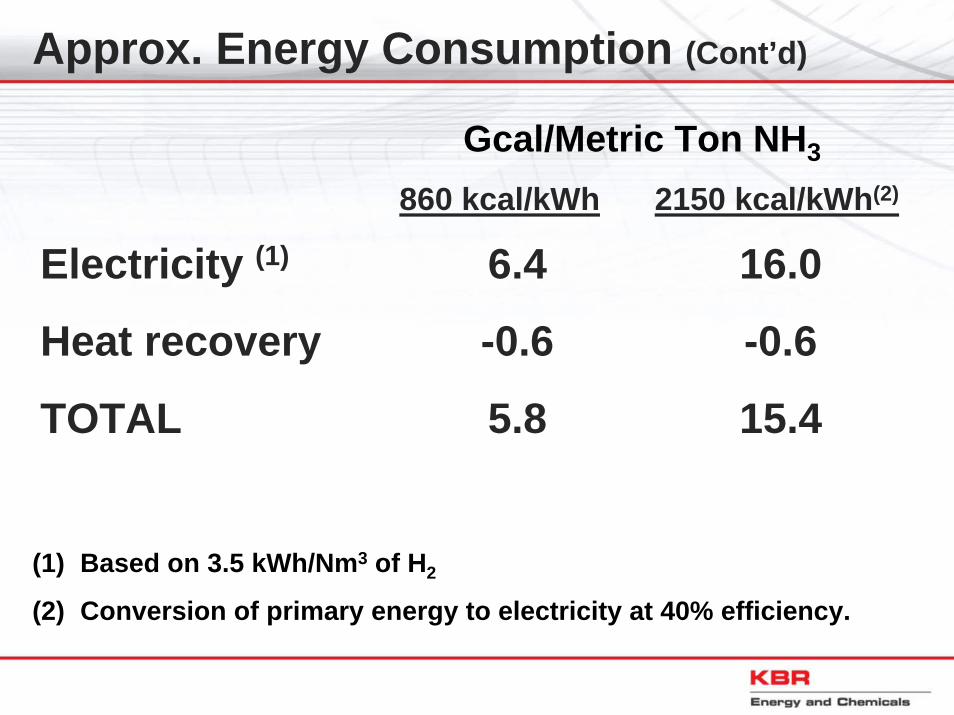
Approx. Energy Consumption (Cont’d)
860 kcal/kWh 2150 kcal/kWh(2)
Electricity (1) 6.4 16.0
Heat recovery -0.6 -0.6
TOTAL 5.8 15.4
Gcal/Metric Ton NH3
(1) Based on 3.5 kWh/Nm3 of H2
(2) Conversion of primary energy to electricity at 40% efficiency.
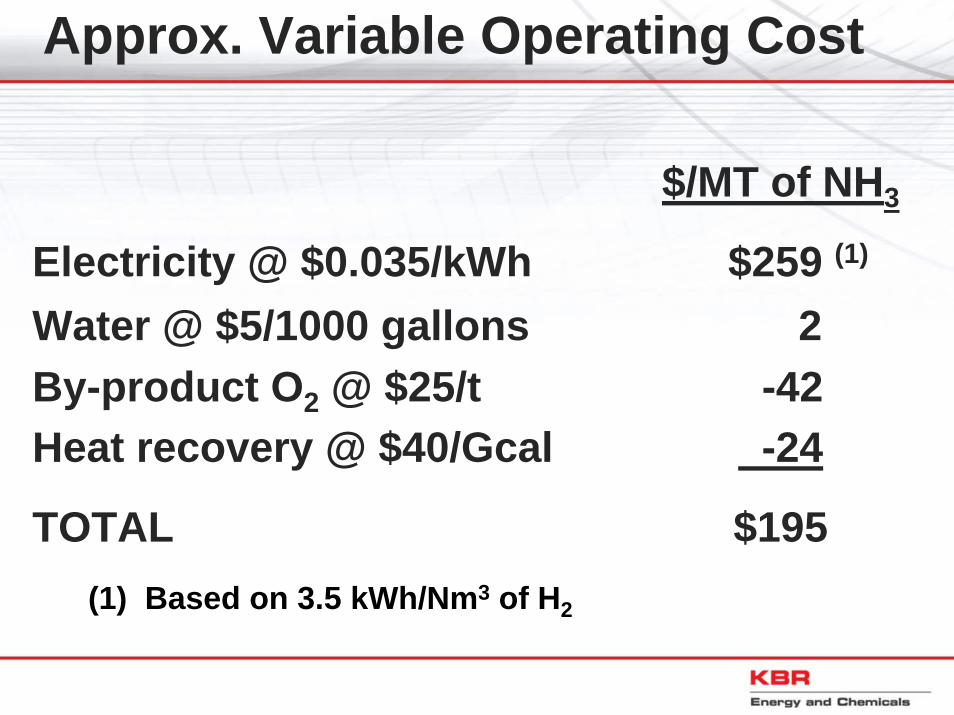
Approx. Variable Operating Cost
$/MT of NH3
Electricity @ $0.035/kWh $259 (1)
Water @ $5/1000 gallonsBy-product O2 @ $25/t
2 -42
Heat recovery @ $40/Gcal -24
TOTAL $195(1) Based on 3.5 kWh/Nm3 of H2
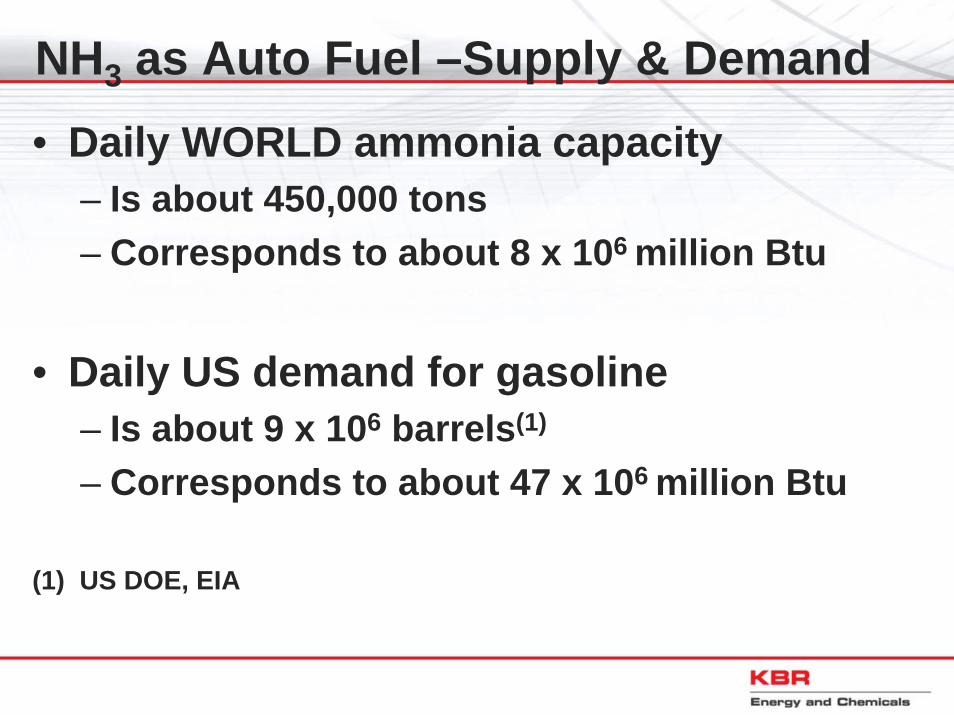
NH3 as Auto Fuel –Supply & Demand• Daily WORLD ammonia capacity
– Is about 450,000 tons– Corresponds to about 8 x 10⁶ million Btu
• Daily US demand for gasoline– Is about 9 x 10⁶ barrels(1)
– Corresponds to about 47 x 106 million Btu
(1) US DOE, EIA
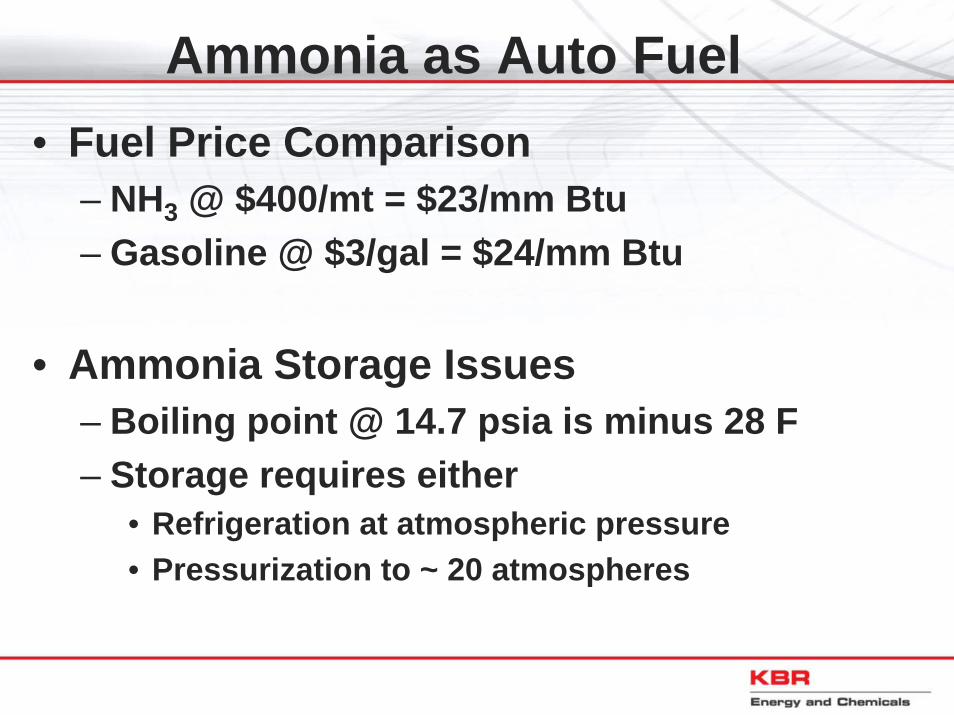
Ammonia as Auto Fuel • Fuel Price Comparison
– NH3 @ $400/mt = $23/mm Btu– Gasoline @ $3/gal = $24/mm Btu
• Ammonia Storage Issues– Boiling point @ 14.7 psia is minus 28 F– Storage requires either
• Refrigeration at atmospheric pressure• Pressurization to ~ 20 atmospheres
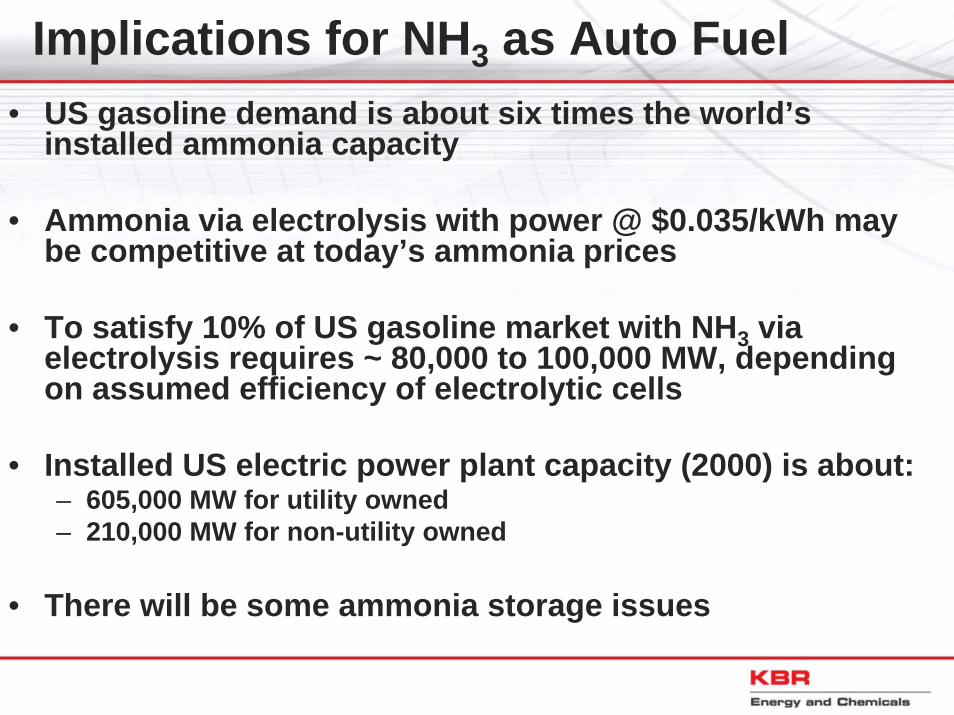
Implications for NH3 as Auto Fuel• US gasoline demand is about six times the world’s
installed ammonia capacity
• Ammonia via electrolysis with power @ $0.035/kWh may be competitive at today’s ammonia prices
• To satisfy 10% of US gasoline market with NH3 via electrolysis requires ~ 80,000 to 100,000 MW, depending on assumed efficiency of electrolytic cells
• Installed US electric power plant capacity (2000) is about:– 605,000 MW for utility owned– 210,000 MW for non-utility owned
• There will be some ammonia storage issues
Topics to be Covered
• Overview of KBR Activities
• Ammonia Supply & Demand
• History of Ammonia Manufacture
• Ammonia Plant Market Trends
• Current Manufacturing Technology
• Ammonia from Renewable Energy
• Summary
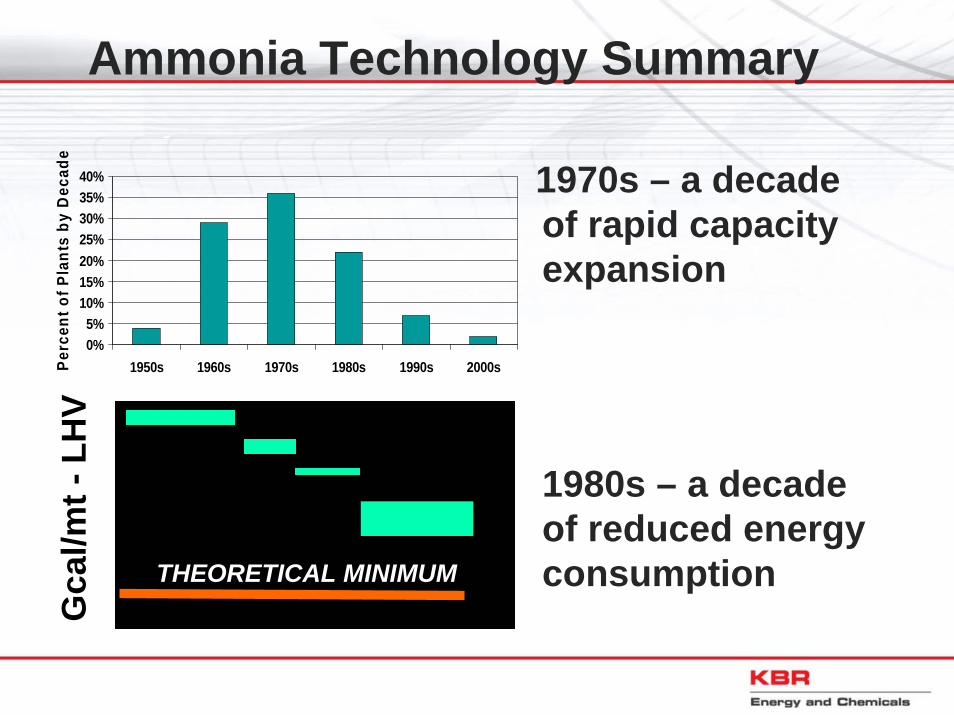
Ammonia Technology Summary
1970s – a decade of rapid capacity expansion
1980s – a decade of reduced energy consumption
0%5%
10%15%20%25%30%35%40%
1950s 1960s 1970s 1980s 1990s 2000sPerc
ent o
f Pla
nts
by D
ecad
eG
cal/m
t -LH
V
THEORETICAL MINIMUM
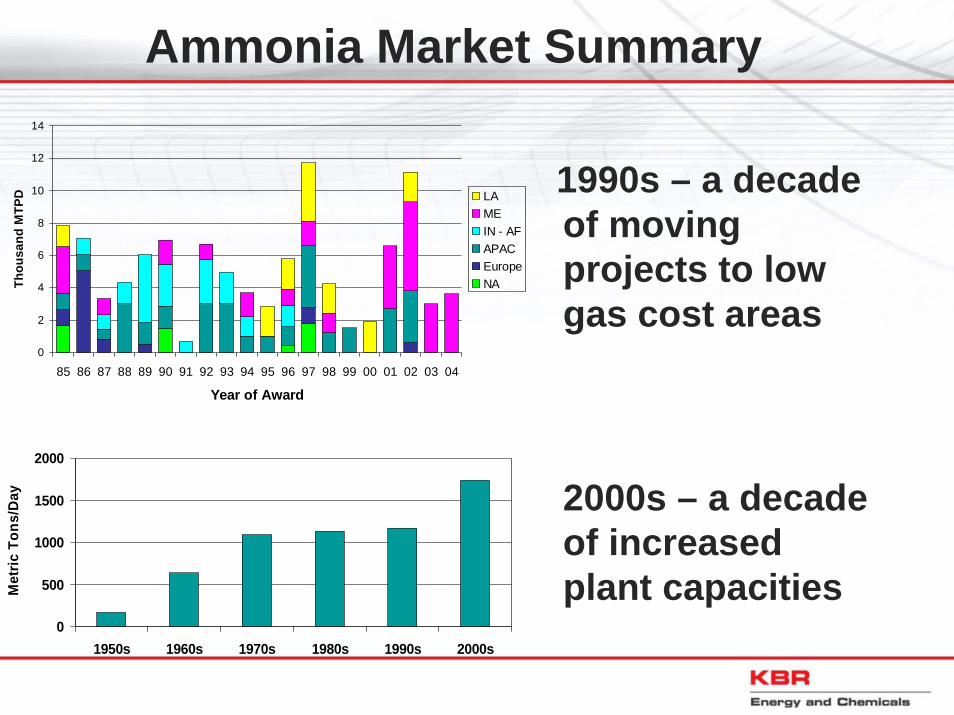
Ammonia Market Summary
1990s – a decade of moving projects to low gas cost areas
2000s – a decade of increased plant capacities
0
2
4
6
8
10
12
14
85 86 87 88 89 90 91 92 93 94 95 96 97 98 99 00 01 02 03 04
Year of Award
Thou
sand
MTP
D LAMEIN - AFAPACEuropeNA
0
500
1000
1500
2000
1950s 1960s 1970s 1980s 1990s 2000s
Met
ric T
ons/
Day
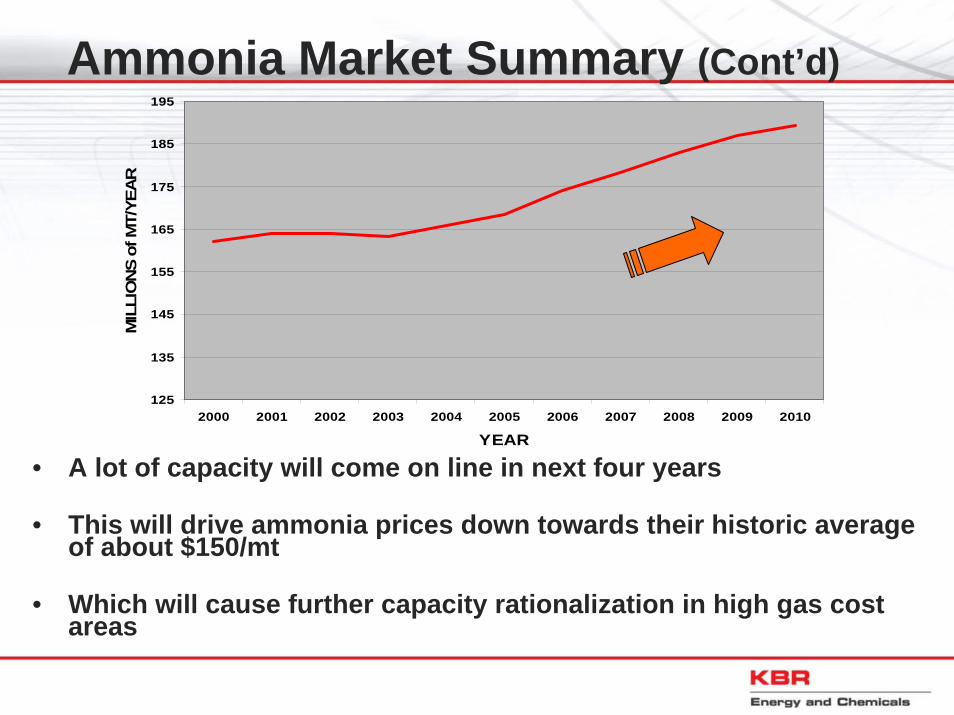
Ammonia Market Summary (Cont’d)
• A lot of capacity will come on line in next four years
• This will drive ammonia prices down towards their historic average of about $150/mt
• Which will cause further capacity rationalization in high gas cost areas
125
135
145
155
165
175
185
195
2000 2001 2002 2003 2004 2005 2006 2007 2008 2009 2010
YEAR
MIL
LIO
NS
of M
T/YE
AR
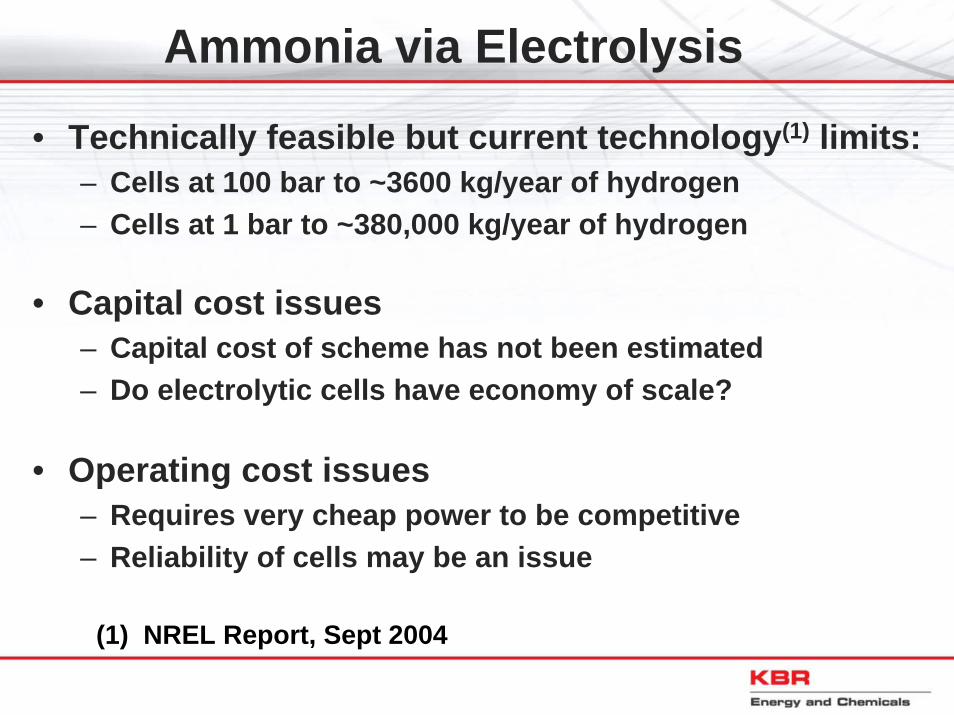
Ammonia via Electrolysis
• Technically feasible but current technology(1) limits:– Cells at 100 bar to ~3600 kg/year of hydrogen– Cells at 1 bar to ~380,000 kg/year of hydrogen
• Capital cost issues– Capital cost of scheme has not been estimated– Do electrolytic cells have economy of scale?
• Operating cost issues– Requires very cheap power to be competitive– Reliability of cells may be an issue
(1) NREL Report, Sept 2004
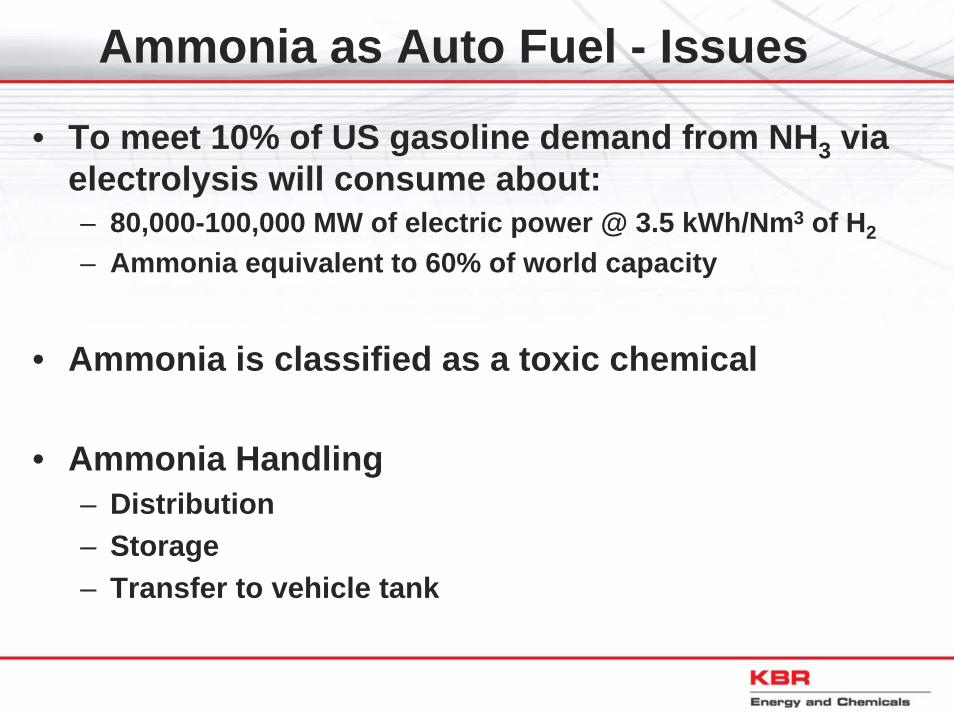
Ammonia as Auto Fuel - Issues
• To meet 10% of US gasoline demand from NH3 via electrolysis will consume about:– 80,000-100,000 MW of electric power @ 3.5 kWh/Nm3 of H2
– Ammonia equivalent to 60% of world capacity
• Ammonia is classified as a toxic chemical
• Ammonia Handling– Distribution– Storage – Transfer to vehicle tank
THANK YOUTHANK YOU


