25/10/2006 MeLLow WORKSHOP 17-18 OCTOBER 2006 1 Effort Prediction Models for Interval Estimation Lefteris Angelis & Ioannis Stamelos Programming Languages and Software Engineering Laboratory, (PLaSE Lab) Department of Informatics Aristotle University of Thessaloniki
Transcript
25/10/2006 MeLLow WORKSHOP 17-18 OCTOBER 2006 1
Effort Prediction Models for Interval Estimation
Lefteris Angelis & Ioannis StamelosProgramming Languages
and Software Engineering Laboratory,(PLaSE Lab)
Department of InformaticsAristotle University of Thessaloniki
25/10/2006 MeLLow WORKSHOP 17-18 OCTOBER 2006 2
Interval Estimation Confidence intervals for Point Estimations
Regression Estimation by AnalogyOther statistical models
Estimation of Probabilities of Predefined intervals
Ordinal RegressionBBNsMachine learning methods
25/10/2006 MeLLow WORKSHOP 17-18 OCTOBER 2006 3
Advantages of interval estimation
Safer to produce interval estimates, along with a probability distribution over the estimated intervalsRelying blindly on point estimates may lead easily in wrong decisionsAn interval estimate can provide a point estimate for practical purposesIntervals give information about the reliability of the estimation processIntervals provide the basis for risk and what-if project analysis
25/10/2006 MeLLow WORKSHOP 17-18 OCTOBER 2006 4
Relevant research at PLaSE Lab
Since 1999…Statistical models for interval estimationComparisons of various modelsPhd studentsMaster theses Involved in two relevant funded research projects Most recent project: Optimization of Telecommunication Software process development (DIERGASIA)
25/10/2006 MeLLow WORKSHOP 17-18 OCTOBER 2006 5
Confidence Intervals for Estimation by Analogy (EbA)
Bootstrap resampling methods Non-parametric bootstrap (draw samples with replacement from the original sample)Parametric bootstrap (draw samples from a theoretical distribution fitting well to the sample)
The same methods were used for calibration of EbA (number of analogies, distance metric, standardization, etc)
25/10/2006 MeLLow WORKSHOP 17-18 OCTOBER 2006 6
Example (Albrecht data set)Non-parametric bootstrap confidence intervalEstimate the effort of a new hypothetical project:Predictors: IN = 27, OUT = 36, FILE = 20, INQ = 10.Point estimation based on 2 analogies = 5.55 man monthsB = 1000 bootstrap samples, estimation each time of the effort using 2 analogies exactly as for the point estimationConfidence intervals (using bootstrap distribution and kernel density smoother):
[ ]11.45 ,6.3 %95 =bootCI [ ]7.5 ,6.3 50% =bootCI
25/10/2006 MeLLow WORKSHOP 17-18 OCTOBER 2006 7
Example (cont.)
0 2 4 6 8 10 12 14 16 18 20 220.00
0.04
0.08
0.12
Estimations from 1000 bootstrap samples
0 2 4 6 8 10 12 14 16 18 20
0.10
0.30
0.10
0.30
0.10
0.30
Estimations from 1000 bootstrap samples
25/10/2006 MeLLow WORKSHOP 17-18 OCTOBER 2006 8
Confidence zones for EbA using bootstrap and jackknife(Albrecht data set)
Typical input/output functions and file management facilitiesDefinition of attributes and project characterisationProject/attribute management (e.g. exclusion of projects/attributes from calculations)Choice of options to be considered for method calibration (with and without bootstrap)Determination of the best attribute set (the one providing the
better accuracy results according to some criterion)Generation of estimations for a single project (with and
without bootstrap)
25/10/2006 MeLLow WORKSHOP 17-18 OCTOBER 2006 11
A Case Study in Industrial Context
Controlling the Cost of Software Development for Supply Chain Information SystemsSupply Chain ISBSG Project Subset
59 projects implementing information systems for manufacturing, logistics, warehouse management, …characterised through effort, size, elapsed time, team size, project nature attributesaccurate project attribute measurementaverage productivity ~ 190 FP/ 1000 mh
BRACE ApplicationVarious strategies were tried because of missing values Best strategy pursued a trade-off between number of projects and attributesPrecision was measured through jackknifeDifferent treatment for elapsed time and max team size
25/10/2006 MeLLow WORKSHOP 17-18 OCTOBER 2006 12
Interval Estimation of the cost of a project portfolio
Combination of :EbAnon-parametric bootstrapStochastic Budget Simulation)
The method allows risk analysis
25/10/2006 MeLLow WORKSHOP 17-18 OCTOBER 2006 13
Example
Cost data set: Abran – Robillard21 projects - 10 variables16 projects considered completed5 project considered new (portfolio)Estimation by analogy and 1000 bootstrap samples: empirical distributions of individual projects
25/10/2006 MeLLow WORKSHOP 17-18 OCTOBER 2006 14
Histogram of the 1000 bootstrap estimates for each one of the individual efforts
Estimations for the individual project efforts based on 1000 bootstrap samples
0.0
0.3
0.60.0
0.3
0.60.0
0.3
0.60.0
0.3
0.60.0
0.3
0.6
25/10/2006 MeLLow WORKSHOP 17-18 OCTOBER 2006 15
Using the empirical distribution for simulation
Fitting of a known theoretical distribution or a smoothing procedure like kernel density estimationStochastic simulation sampling from fitted distributions a large number of times, adding each time the individual effort values to get the overall effortThe entire set of the overall effort values from simulation produces the cumulative density function (useful for computing probabilities of various effort intervals)
25/10/2006 MeLLow WORKSHOP 17-18 OCTOBER 2006 16
Cumulative distribution function of the overall effort obtained byStochastic Budget Simulation
600 800 1000 1200 1400 1600 1800 2000
Overall effort
0.0
0.1
0.2
0.3
0.4
0.5
0.6
0.7
0.8
0.9
1.0
Cum
ulat
ive
prob
abilit
y
25/10/2006 MeLLow WORKSHOP 17-18 OCTOBER 2006 17
Confidence intervals for project portfolios costs
25/10/2006 MeLLow WORKSHOP 17-18 OCTOBER 2006 18
Estimation of predefined intervals – Ordinal Regression
For ordinal dependent variables (the cost intervals) General form of the OR prediction equations :
the cumulative probability for the -th category,
link function (usually one of the following):
Logit function:
Complementary log-log function:
Negative log-log function:
Probit function:
Cauchit function:
∑−==
k
iiijj xcl
1)( βθ
jc
)( l⎟⎠⎞
⎜⎝⎛− cc
1log
))1log(log( c−−
))log(log( c−−
)(1 c−Φ
))5.0(tan( −cπ
25/10/2006 MeLLow WORKSHOP 17-18 OCTOBER 2006 19
Application of OR to three data sets (4 categories)
MaxwellCOCOMO81ISBSG 7
25/10/2006 MeLLow WORKSHOP 17-18 OCTOBER 2006 20
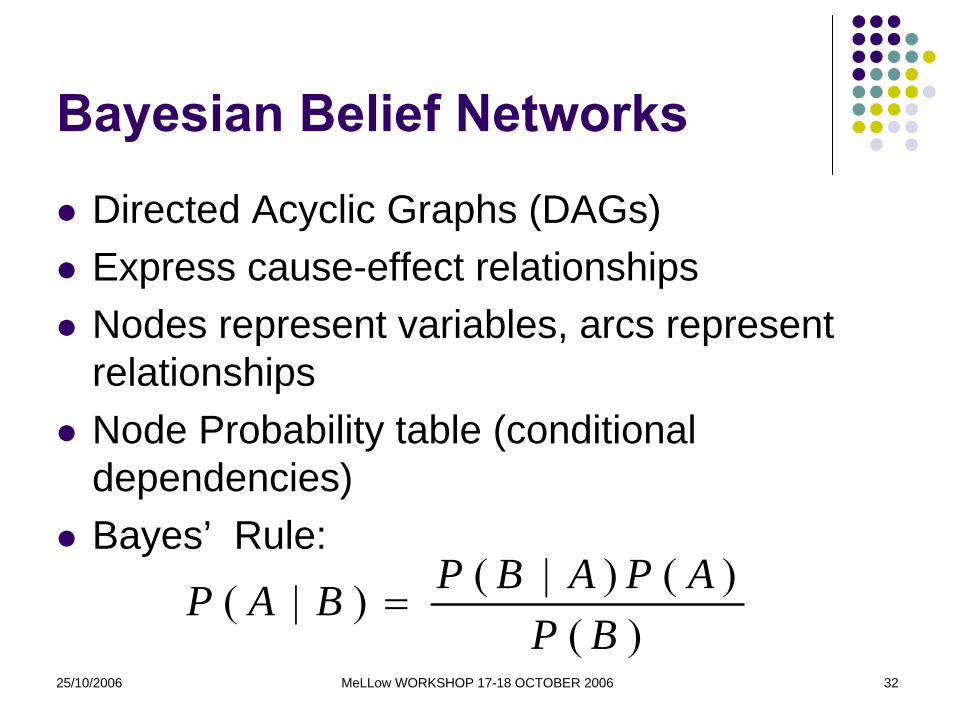
Machine Learning methods for predefined intervalsMachine Learning (ML) methods
Association RulesClassification and Regression TreesBayesian Belief Networks
Predefined intervals in combination with ML Estimation of an intervalProbabilitiesCombination of information from past historical data with expert knowledgeJustification of the estimation
25/10/2006 MeLLow WORKSHOP 17-18 OCTOBER 2006 21
Estimation Process for ML
Initial discretization of productivity valueApplication of the methods, estimation modelsTransformation of the interval estimate into a numeric estimate using the mean or the median point of the intervalCalculation of MMRE, pred(25), hitrate
25/10/2006 MeLLow WORKSHOP 17-18 OCTOBER 2006 22
Estimation example ISBSG data set release 7
Data split in 3 sets according to their application type. Models predicting the productivity values of Management Information Systems (MIS), Transaction Production systems and the rest of the projectsVariables used:
Function points, time size, language type, primary programming language, organization type, database, development platform, use of methodology, business area type, implemntation date.
Methods applied AR, CART, AR+CART (combination)Example: Estimation models of MIS projectsTraining data set: 128 projects Test data: 7 projects
25/10/2006 MeLLow WORKSHOP 17-18 OCTOBER 2006 23
Association Rules Probabilistic statements about the co-occurenceof certain events in a database.
IF A1=X AND A2=Y THEN A3=Z
A1=X AND A2=Y : rule bodyA3=Z : rule headConfidence: p(A3=Z|A1=X,A2=Y)Support : expresses the frequency of the rule in the whole data set.
25/10/2006 MeLLow WORKSHOP 17-18 OCTOBER 2006 24
AR for ISBSGMIS projects
no support confidence rule body rule head
1. 3.1 100.0 BAT = OTHER and PPL in {APG, 4GL, VB, SQL, TELON, OTHER}
0.137< P ≤0.273
2. 9.4 92.3 PPL= ACCESS 0.274< P ≤5.353
3. 3.1 80.0 DP = MF and 286<FP≤629 and DT in {New=development, Re- development}
0.066< P ≤0.136
4. 3.1 80.0 LT= 4GL and DP= PC and OT= ProfessionalServicesand BAT in {Engineering, Personnel, Research&Development}
0.274< P ≤0.590
5. 8.6 78.5 DBMS= IMS and BAT in {Banking, Accounting, Logistics, Manufacturing, Sales& Marketing}
0.015< P ≤0.065
6. 7.8 76.9 PPL= COBOL and BAT in {Banking, Accounting, Logistics, Manufacturing, Sales&Marketing}
0.032< P ≤0.065
7. 4.0 71.4 LT=3GL and DBMS=ORACLE 0.066< P ≤0.136
8. 3.1 66.7 BAT=Engineering andPPLin{ACCESS,NATURAL} 0.274< P ≤0.590
9. 2.4 58.3 DT=Enhancement and PPL=SQL 0.015< P ≤0.065
10. 3.9 45.5 LT=4GL and DBMS=ACCESS 0.591< P ≤5.353
25/10/2006 MeLLow WORKSHOP 17-18 OCTOBER 2006 25
AR ISBSG data set
Support and confidence threshold 3,125% (4 projects) and 45.5 % correspondingly.Frequent appearing attributes are Business Area Type (BAT) and Development Type (DT). Rules for high productivity values were very few.
25/10/2006 MeLLow WORKSHOP 17-18 OCTOBER 2006 26
AR-ISBSG data set
Estimate the project with the following values use the previous table
8. 3.1 66.7 BAT_Engineering+PPL in{ACCESS, NATURAL} 0.274< P ≤0.590
The first two rules that provide estimation for the project are the following:
25/10/2006 MeLLow WORKSHOP 17-18 OCTOBER 2006 27
CART CART tree model consists of an hierarchy of:
Univariate binary decisions.Classifies all possible cases.Example: simple CART estimating productivity measured in Lines of code per hour
25/10/2006 MeLLow WORKSHOP 17-18 OCTOBER 2006 28
CART- ISBSG data set
25/10/2006 MeLLow WORKSHOP 17-18 OCTOBER 2006 29
CART- ISBSG data setThe CART can be explained as following:
If the business area type is Accounting, Banking, Manufacturing, Sales&Marketing, Logistics then there is 56,5% probablitiy that the productivity will be between 0.032 and 0.065 fp/ hourElse if the business area type is Inventory, Financial, Legal or Unknown then if :
the language used is C, C++, Cobol, Access, Visual Basic or Java then there is 60% probability that the productivity will be between 0.066 and 0.136 fp/ hourotherwise there is 60% probability that the productivity will be between 0.066 and 0.136 fp/ hour
If none of the previous is true then there is 45,2% probability that productivity will be between 0,274 and 0,590 fp/h.
25/10/2006 MeLLow WORKSHOP 17-18 OCTOBER 2006 30
AR+CART The method exploits the advantages of AR
pertinent relationships among the project attributes and the developmentAR is a method for descriptive modeling representation form of AR, is transparent
CART method on the other handas a predictive modeling methodprovides a complete estimation framework constructs a model that classifies all projects CART also avoids overfitting of the model to the historical data information
The combination of the methods provides:Improved estimation resultsBetter understanding of the problemDeals with the problem of AR to provide an estimation of all possible projectsDeals with the problem of CART that are often very inaccurate
25/10/2006 MeLLow WORKSHOP 17-18 OCTOBER 2006 31
AR+CARTEstimation process
Identify ARs describing the influence of certain project attributes on the software development productivityBuild a CART model that will be able to classify all possible projects to a productivityIf the new project can be estimated by the AR model with a stronger confidence value than the CART model then use that estimateOtherwise use the CART estimateAR+CART results in 10-15% accuracy improvement w.r.t. AR alone
BBN + COCOMO81 data setVariable that directly affects productivity is mode and can classify correct 34,9% of the data.For improved estimation results we empirically added 3 nodes as parents of productivity, PCAP,CPLX and application type.In the BBN we can observe the relationships among the projects attributes as well.The number that accompanies each arc is the estimation hitrate that each nodes classifies its child node.Evaluation results, Jackknife method
25/10/2006 MeLLow WORKSHOP 17-18 OCTOBER 2006 36
Interval Estimation papers ANGELIS L., I. STAMELOS (2000). A simulation tool for efficient analogy based cost estimation. Empirical Software Engineering, 5, pp. 35-68.STAMELOS I., L. ANGELIS (2001). Managing uncertainty in project portfolio cost estimation. Information and Software Technology, 43, pp. 759-768 .STAMELOS I., L. ANGELIS, P. DIMOU, E. SAKELLARIS (2003). On the use of Bayesian belief networks for the prediction of software development productivity. Information and Software Technology, 45, 1, pp. 51-60.STAMELOS I., L. ANGELIS, M. MORISIO, G. BLERIS, E. SAKELLARIS (2003). Estimating the development cost of custom software. Information & Management, 40, pp. 729-741.BIBI S., I. STAMELOS, L. ANGELIS, (2003) Bayesian Belief Networks as a Software ProductivityEstimation Tool, Proceedings of the 1st Balkan Conference in Informatics, pp. 585-596, Thessaloniki, November 2003.BIBI S., I. STAMELOS, (2004) Software Process modeling with Bayesian Belief Networks, OnlineProceedings of the 10th IEEE International Conference on Software METRICS , Chicago.BIBI S., I. STAMELOS, L. ANGELIS, (2004) Software Productivity estimation based onAssociation Rules, Proceedings of the 1st European Software Process Improvement Conference, pp. 13 A.6, Trondheim.BIBI S., I. STAMELOS, L. ANGELIS, (2004) Software Cost Prediction with Predefined IntervalEstimates, Proceedings of the 1st Software Measurement European Forum, pp. 237-246, Rome..SENTAS P., L. ANGELIS, I. STAMELOS, G. BLERIS (2005). Software productivity and effort prediction with ordinal regression. Information and Software Technology, Volume 47, Issue 1, 17-29.BIBI S., I. STAMELOS (2006). Selecting the Appropriate Machine Learning Tecnhiques for the Prediction of Software Development Costs, Proceedings of the 3rd IFIP Conference on Artificial Intelligence Applications & Innovations, pp 533-540, Athens.
25/10/2006 MeLLow WORKSHOP 17-18 OCTOBER 2006 37
DIERGASIA
Optimization of Telecommunication Software
PROCESS development
Funded by the Greek Secretariat for Research and Technology, a PAVET grant
Aristotle University
Teletel S.A.
25/10/2006 MeLLow WORKSHOP 17-18 OCTOBER 2006 38
Target of the project
Design, development and application of models describing software process development for telecommunication systems software.
Definition of measurementsDefinition of the appropriate observation points. Selection and implementation of statistical models and software.
Cost estimationQuality estimation
Specification of new improved processes.Preparation for CMM-I assesment
25/10/2006 MeLLow WORKSHOP 17-18 OCTOBER 2006 39
W.P.1 – Research on software metrics and statistical methods for data processing
D1- Guide for measurement and statistical analysis Identification of measurements and metrics for gathering quantitative data.Identification of statistical and data mining methods for qualitative analysis of data
Regression models, analogy based estimation, CART, Association Rules, Bayes Networks.
Research on requirements specification process
25/10/2006 MeLLow WORKSHOP 17-18 OCTOBER 2006 40
W.P.2 – Measurement and data collection and transformation
D2.1 – Company data base of measurementsPlacement of the appropriate audits and metric pointers at particular development points.Measurement completion and result recording.Data collection from measurements.Data collection from SAFIRE tool.
D2.2 – Quality report for measurements Initial application, mining, comparison and evaluation of models – emphasis on interval models Data selectionPre-ProcessingTransformationStatistical analysis
25/10/2006 MeLLow WORKSHOP 17-18 OCTOBER 2006 41
W.P.3 – Modeling company's process
D3.1 – Mathematical models for estimation of company’s process.Statistical processing of data
W.P.4 – A model for SDL Systems Quality Evaluation
D4.1 – Quality model evaluation for SDLSpecification of a model for quality evaluationDevelopment of a quality rule set SDL
D4.2 – Tool for automated quality evaluation for SDL
Development of static metrics that implement SDL rulesSpecification of quality intervals for each metricQuality evaluation based on mathematical equationsProject evaluation based on the quality model.
25/10/2006 MeLLow WORKSHOP 17-18 OCTOBER 2006 43
W.P.5 – Specification of the company’s processes-evaluation of the models
D5.1 – Company’s process quality guideModels application
Models evaluation
Result comparison
Quality models specification
Models modification
25/10/2006 MeLLow WORKSHOP 17-18 OCTOBER 2006 44
W.P.6 – Software Process Improvement Certification
D6.1 – Software process improvement certification Software Process Improvement Certification by major clients of Teletel (Alcatel).Process maturity estimation based on the standards of CMM/I.Training for CMM/I.
25/10/2006 MeLLow WORKSHOP 17-18 OCTOBER 2006 45
D1.1 – Guide for measurements and statistical analysis
Part Α- Software metrics.IntroductionProduct metrics


![Artificial Neural Network (ANN) Modeling for Prediction of ... · Measurements of COD were done in accordance to Standard Methods [31]. In an effort to In an effort to minimize an](https://static.documents.pub/doc/80x56/5d5630e288c993aa308b985c/artificial-neural-network-ann-modeling-for-prediction-of-measurements.jpg)
