32
1 Egenkapitalbevis- og kredittmarkedet fra et investorperspektiv Bankenes Sikringsfond – Høstkonferansen 2016 Arctic Securities, Joakim Svingen (Analyst)
| Date post: | 20-Aug-2018 |
| Category: |
Documents |
| Upload: | hoangtuyen |
| View: | 213 times |
| Download: | 0 times |

11
Egenkapitalbevis- og kredittmarkedet fra et investorperspektivBankenes Sikringsfond – Høstkonferansen 2016
Arctic Securities, Joakim Svingen (Analyst)

Prising av egenkapitalbevis i dag
Arctic Securities
2
Utviklingen i markedet for egenkapitalbevis
Kredittmarkedet
Oppsummering
Egenkapitalbevis- og kredittmarkedet fra et investorperspektiv

Arctic Buy NOK 28
Arctic Buy NOK 115
Arctic Buy SEK 94
Arctic Buy SEK 195
Arctic Sell SEK 92
Hold SEK 85
Hold DKK 196
Arctic Buy NOK 100
Arctic Buy NOK 52
Arctic Buy NOK 65
Arctic Buy NOK 50
Hold NOK 39
Hold NOK 175
Arctic Buy NOK 170
Arctic Buy NOK 230
Arctic Buy NOK 80
Highly regarded and experienced research team covering the Nordic
financial institutions and insurance sector
Full research coverage of 6 large Nordic banks and 9 Norwegian savings
banks, in addition closely monitoring the niche bank sector
Full research coverage of Gjensidige Forsikring and Storebrand, as well as
debt specialists B2Holding and Axactor
Arctic research team have made savings banks a priority since the
inception of the company in 2007
Arctic research team maintains a positive view on the Norwegian banking
sector
Savings banks have been a key priority since the inception of
Arctic in 2007
FIG is a key priority coverage industry to Arctic Arctic is enthusiastic about the savings banks sector
FIG sector corporate team overview FIG sector analyst team overview
Joakim
Svingen
Equities - FIG
Lead Analyst
5 years of investment banking experience
Previously worked as associate at EY (2007-2009) and as
analyst/group controller at Eika Gruppen (2009-2011)
From 2011 to 2014: Corporate finance at Norne Securities and
specialized in banking and finance
Holds an MSc from the Norwegian School of Economics (NHH)
Roy
Tilley
Equities - FIG
Analyst
1 year of investment banking experience
Previously worked at SpareBank 1 Gruppen as an analyst (2013-
2015) and before that as a corporate trainee (2011-2013)
Holds an MSc in Financial Economics from the Norwegian
University of Science and Technology (NTNU)
Kjetil R.
Bakken
Partner
Corporate Finance
Fridtjof
Berents
Head of Corp.
Finance
Corporate Finance
8 years of investment banking & 10 years of experience from Ministry of Finance,
includes banking and insurance regulation
Previously headed Arctic’s Research department
Arctic’s research team consistently ranked as no. 1
Jon
Gunnar
Pedersen
Founding partner
Corporate Finance
20 years of investment banking experience, specializing in FIG and government
related transactions
Returning to FIG and corporate finance after serving as Deputy Minister of Finance
since 2013
13 years investment banking experience, 5 years FIG from Deutsche Bank and UBS
prior to joining Arctic in 2007
Experience from numerous M&A transactions, capital raisings and IPO’s in both
Nordic and European FIG space
| 3

Prising av egenkapitalbevis i dag
Arctic Securities
4
Utviklingen i markedet for egenkapitalbevis
Kredittmarkedet
Oppsummering
Egenkapitalbevis- og kredittmarkedet fra et investorperspektiv

DNB SRBANK MING SVEG NONG MORG RING HELG SOAG SBVG
04.01.2016 100 100 100 100 100 100 100 100 100 100
15.09.2016 98 116 113 120 117 117 104 125 113 109
60
70
80
90
100
110
120
130
140
4-Jan 18-Jan 1-Feb 15-Feb 29-Feb 14-Mar 28-Mar 11-Apr 25-Apr 9-May 23-May 6-Jun 20-Jun 4-Jul 18-Jul 1-Aug 15-Aug 29-Aug 12-Sep
Total return
DNB SRBANK MING SVEG NONG MORG RING HELG SOAG SBVG
Source: Bloomberg
Norske banker: Relativ utvikling hittil i år
| 5

0.0 x
0.5 x
1.0 x
1.5 x
2.0 x
2.5 x
2006 2008 2010 2012 2014 2016
P/B (12m forward estimates)
DNB
SRBANK
MING
NONG
SVEG
MORG
Source: FactSet, Arctic Securities
Historisk P/B over 1: Egenkapitalavkastning lavere enn historisk
| 6
ARCe ROE
DNB SRBANK MING NONG MORG SVEG
Average - 2005-09 16.4% 18.2% 18.6% 17.6% 13.2% 12.3%
Average - 2010-14 12.6% 13.2% 13.4% 11.3% 13.0% 11.4%
Average - 2005-14 14.5% 15.7% 16.0% 14.5% 13.1% 11.9%
2016e 10.2% 9.3% 9.4% 11.0% 9.8% 8.9%
2017e 10.5% 9.0% 9.5% 10.4% 9.3% 8.8%
Norwegian Savings BanksForward 12m BVPS
DNB SRBANK MING NONG MORG SVEG
15.09.2016 0.85 0.60 0.76 0.89 0.72 0.79
Vs peers (0.4) (0.1) +0.0 +0.2 +0.0 +0.1
Average - 2005-09 1.12 1.17 1.12 1.18 1.15 1.17
Average - 2010-14 0.97 0.76 0.78 0.74 0.77 0.72
Average - 2005-14 1.04 0.96 0.94 0.95 0.96 0.94
Current vs Average (18%) (37%) (19%) (7%) (24%) (16%)
Norwegian Savings Banks

P/E next 12m SRBANK MING NONG SVEG MORG Sav Bank Average DNB Diff Sav Bank vs DNB
15.09.16 7.2 x 7.9 x 7.6 x 8.2 x 7.9 x 7.8 x 9.3 x -1.5 x
10Y average 8.4 x 8.1 x 7.8 x 9.2 x 8.8 x 8.5 x 9.2 x -0.7 x
Diff vs average -1.2 x -0.2 x -0.2 x -1.0 x -0.9 x -0.7 x 0.1 x
Source: FactSet, Arctic Securities
Historisk P/E: Sparebankene handler til rabatt ift DNB
3.0 x
5.0 x
7.0 x
9.0 x
11.0 x
13.0 x
15.0 x
17.0 x
19.0 x
Sep-06 Sep-08 Sep-10 Sep-12 Sep-14 Sep-16
DNB SRBANK MING NONG SVEG MORG Sector Average
| 7

Pris/Bok i forhold til egenkapitalavkastning
Source: Arctic Securities, FactSet
| 8
Regionbankene – P/B 0.8
0.64
0.78
0.860.90
0.860.79
0.70 0.700.67
0.83
9.0 %
9.9 %
11.2 %
9.7 %
10.3 % 10.4 %
11.6 %
13.7 %
8.7 %
9.5 %
0%
2%
4%
6%
8%
10%
12%
14%
16%
0.0
0.2
0.4
0.6
0.8
1.0
1.2
1.4
1.6
1.8
2.0
SRBANK MING NONG RING SVEG MORG SOAG HELG SOR SPOG
Lokalbankene – P/B 0.7
0.46
0.69
0.62 0.64
1.24
0.95
0.60
0.53
0.68
0.87
0.42
3.9 %
7.9 %
6.9 %
10.0 %
8.1 %
8.7 %
6.2 %
7.5 %
9.8 %
7.8 %
5.5 %
0%
2%
4%
6%
8%
10%
12%
0.0
0.2
0.4
0.6
0.8
1.0
1.2
1.4
1.6
1.8
2.0
SADG TOTG JAEREN SBVG AURG MELG VVL SKUE NTSG HSPG ISSG

Ser man på inntjeningen er regionbankene rimeligere
Source: Arctic Securities, FactSet
| 9
Regionbankene – P/E ~7
7.1
7.7 7.7
8.9
7.9
7.4
6.0
5.3
7.1
8.4
6.6
7.47.5
9.4
8.7
7.5
6.1
7.3
8.0
9.0
0
1
2
3
4
5
6
7
8
9
10
SRBANK MING NONG RING SVEG MORG SOAG HELG SOR SPOG
Lokalbankene – P/E ~9
8.4 8.58.1
6.1
15.4
10.39.7
7.2
6.2
11.1
7.67.57.7
8.5
6.3
14.2
11.1
8.9
7.7
6.7
11.0
7.7
0
2
4
6
8
10
12
14
16
18
SADG TOTG JAEREN SBVG AURG MELG VVL SKUE NTSG HSPG ISSG

Endelig kommer normalt utbytte igjen!
Source: Arctic Securities, FactSet
| 10
Regionbankene – Snitt på 5.8%
2.8%
4.6%
5.8%5.6%
6.3%
6.8%
5.0%
6.3%
6.8%
7.9%
6.1%
6.8%6.6%
5.2%
5.8%
6.6% 6.5%
6.9% 6.8%
8.2%
0%
1%
2%
3%
4%
5%
6%
7%
8%
9%
SRBANK MING NONG RING SVEG MORG SOAG HELG SOR SPOG
Lokalbankene – Snitt på 6.6%
1.8%
7.3%
4.4%
8.2%
5.9%
7.5%
3.9%
5.2%
3.0%
5.7%
6.6%
4.8%
8.1%
4.8%
7.9%
6.2%
7.3%
4.1%
5.2%
4.4%
5.8%
6.2%
0%
1%
2%
3%
4%
5%
6%
7%
8%
9%
SADG TOTG JAEREN SBVG AURG MELG VVL SKUE NTSG HSPG ISSG

Volum – Likviditet er en stor utfordring, særlig for de minste
*Eksklusive SADG som emitterte i perioden.
Source: Arctic Securities, FactSet
| 11
Regionbankene – 1.7 mill i snitt per dag
4,374
7,145
3,808
71
1,341 1,415
238366
855
303
0
1,000
2,000
3,000
4,000
5,000
6,000
7,000
8,000
SRBANK MING NONG RING SVEG MORG SOAG HELG SOR SPOG
Lokalbankene – TNOK 170 i snitt per dag (TNOK 85*)
1,040
94
17
361
102
4115
50
128
9
34
0
200
400
600
800
1,000
1,200
SADG TOTG JAEREN SBVG AURG MELG VVL SKUE NTSG HSPG ISSG

-1
-0.5
0
0.5
1
1.5
2
Dec-14 Mar-15 Jun-15 Sep-15 Dec-15 Mar-16 Jun-16
%Interbank Rates
3m STIBOR Swedish Forward 3m NIBOR Norwegian Forward 3m CIBOR Danish Forward
The forward relates to a fixed maturity, while the 3m interbank rates is rolling. In each 3m period, these two rates converge (and in the meantime,
the forward rate is a predictor of interbank rates 0-3 months ahead
Source: Bloomberg
31.12.2014 31.08.2015 Change YTD
Denmark 0.28 -0.07 -0.35
Norway 1.48 1.13 -0.35
Sweden 0.26 -0.32 -0.59
Finland 0.08 -0.03 -0.11
3m interbank offer rate Nordic countries
Pengemarkedsrenter – Norge, Danmark og Sverige
31.12.2015 31.03.2016 30.06.2016 16.09.2016 Change Q3/16
Denmark -0.09 -0.08 -0.21 -0.19 0.02
Norway 1.13 1.00 1.01 1.08 0.07
Sweden -0.29 -0.45 -0.53 -0.47 0.06
Finland -0.13 -0.24 -0.29 -0.30 -0.02
3m interbank offer rate Nordic countries
| 12

Regulatorisk usikkerhet nærmer seg nå slutten
Source: Company reports, Arctic Securities
Pillar II kravene til hver enkelt bank gjenstår Kravene til ren kjernekapital (CET1)
Motsyklisk kapitalbuffer ble 1. juli i år økt fra 1.0%
til 1.5%.
Denne økningen kom tidligere enn vi hadde
forventet og kravet til ren kjernekapital for SIFI-
bankene er minimum 13.5% fra 1. Juli 2016. Andre
banker må ha minimum 11.5%.
Pilar II krav til hver enkelt bank viktigste
gjenstående usikkerhetsfaktor.
Pilar II krav til DNB 1.5%, inkludert SIFI buffer er
minimumskrav 15%.
De største norske sparebankene forventes å ha en
ren kjernekapitaldekning på 14.5% innen nyttår.
Leverage ratio forventes ikke å være en bindende
begrensning for norske banker.
Eneste «ukjente» gjenværende faktor vil da være
økt fradrag for ikke-vesentlige eierandeler i
finansiell sektor (overgangsordningen).
4.5 % 4.5 % 4.5 %
2.5 % 2.5 % 2.5 %
3.0 % 3.0 % 3.0 %
1.0 %2.0 %
1.0 %
1.5 %
10.0 %
12.0 %
13.5 %
July 2014 July 2015 July 2016
0%
2%
4%
6%
8%
10%
12%
14%
16%
Minimum Requirement Conservation Buffer
Systemic Buffer SIFI Buffer (max)
Countercyclical Buffer (1.5%*) Sum
| 13

Sources: Company reports, Arctic Securities
15.2 %
13.5 % 13.9 %14.2 % 13.8 %
14.5 %
14.7 % 15.7 % 15.4 %
16.8 %
0%
2%
4%
6%
8%
10%
12%
14%
16%
18%
20%
DNB SRBANK MING NONG SVEG MORG HELG RING SOAG SBVG
Q213 Q313 Q413 Q114 Q214 Q314 Q414 Q115 Q215 Q315 Q415 Q116 Q216 SIFI requirement (13.5%)
Rapportert ren kjernekapitaldekning (inkl. 50% av resultat HIÅ)Leverage ratio 6-10% - Godt over antatt minimumsnivå
| 14

Olje- og offshoreeksponering for norske banker
Source: Company reports
*Exposure at Default used for DNB, SRBANK and MING. Loans outstanding used for NONG, SVEG and MORG
Oil related exposure in % total lending.* Q2/16. Comment
DNB and SRBANK has the
highest direct oil related
exposure with 8.1% and
8.7%, respectively.
MING and MORG has
roughly half of this and
customers are mainly
operating in the offshore
segment.
NONG has a low direct
oil related exposure
compared to the other
regional banks.
SVEG’s low direct oil
related exposure is
helped by a relatively
low share of corporate
lending (24%).
8.1 %
8.7 %
4.6 %4.2 %
2.3 %
1.1 %
DNB SRBANK MING MORG NONG SVEG
| 15
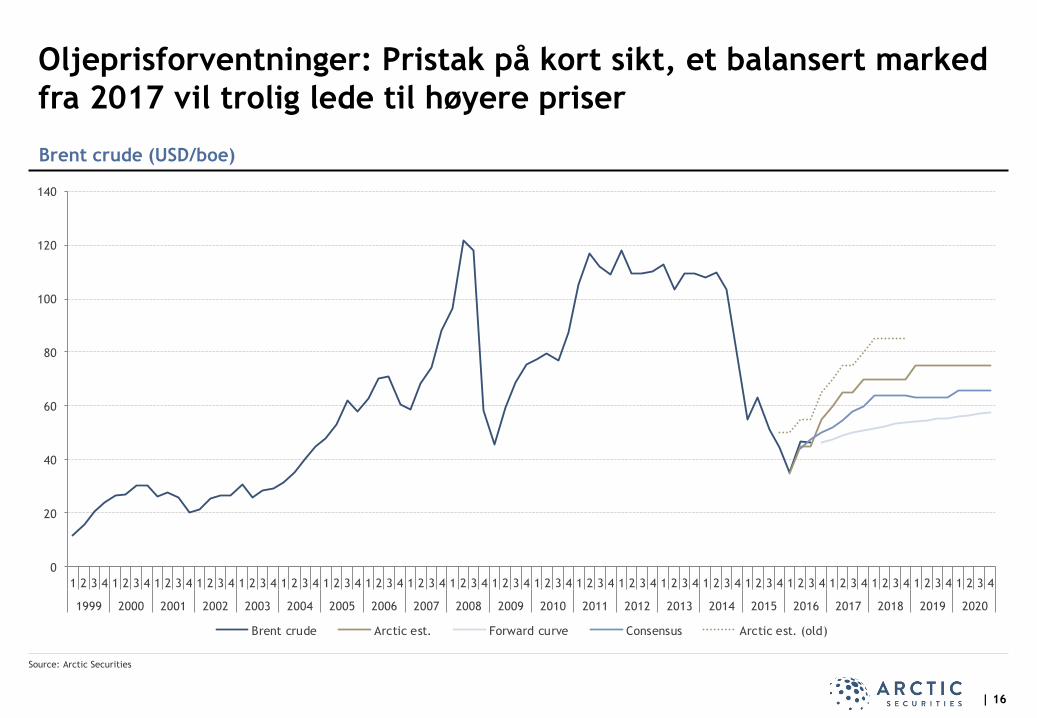
Oljeprisforventninger: Pristak på kort sikt, et balansert marked
fra 2017 vil trolig lede til høyere priser
Brent crude (USD/boe)
0
20
40
60
80
100
120
140
1 2 3 4 1 2 3 4 1 2 3 4 1 2 3 4 1 2 3 4 1 2 3 4 1 2 3 4 1 2 3 4 1 2 3 4 1 2 3 4 1 2 3 4 1 2 3 4 1 2 3 4 1 2 3 4 1 2 3 4 1 2 3 4 1 2 3 4 1 2 3 4 1 2 3 4 1 2 3 4 1 2 3 4 1 2 3 4
1999 2000 2001 2002 2003 2004 2005 2006 2007 2008 2009 2010 2011 2012 2013 2014 2015 2016 2017 2018 2019 2020
Brent crude Arctic est. Forward curve Consensus Arctic est. (old)
Source: Arctic Securities
| 16

Lånetap i et historisk perspektiv:
Lave tap de siste 10 årene
Source: FNO/Sparebankforeningen/Statistics Norway
| 17
Loan losses (% of gross lending) the last 20 years
-0.60%
-0.40%
-0.20%
0.00%
0.20%
0.40%
0.60%
0.80%
1995 1996 1997 1998 1999 2000 2001 2002 2003 2004 2005 2006 2007 2008 2009 2010 2011 2012 2013 2014 2015
Savings Banks DNB
Comments
DNB has had average
loan losses the last 20
years of ~13bp, this
includes reversals in the
years prior to the
banking crisis in the
period 1988-1993
Norwegian savings banks
has in the same period
had average loan losses
of ~21bp
2015 was another year
of low loan losses
despite the rise in
provisions in Q4.

Styrket fokus på lånetap i Norske banker
Source: Company reports, Arctic Securities
* Gross loans excluding loans transferred to covered bonds company.
| 18
Loan losses in % lending – History
0.16%0.14%
0.11%
0.24%
0.13%0.10%
0.23%
0.05%
0.24%0.21%
0.00%
0.05%
0.10%
0.15%
0.20%
0.25%
0.30%
0.35%
0.40%
0.45%
DNB SRBANK MING NONG SVEG MORG HELG RING SOAG SBVG
10Y 5Y 3Y
Loan losses in % lending – Table including history
Loan losses in % lending – Arctic Estimates
0.53%
0.60%
0.53%
0.31% 0.31%
0.14%
0.25%
0.12%
0.17%
-0.16%
0.40%
0.51% 0.50%
0.37%
0.30%
0.34% 0.33%
0.16%
0.35% 0.34%
-0.20%
-0.10%
0.00%
0.10%
0.20%
0.30%
0.40%
0.50%
0.60%
0.70%
DNB SRBANK MING NONG SVEG MORG HELG RING SOAG SBVG
2015 2016e 2017e
Arctic estimates 10Y 5Y 3Y 2015 2016e 2017e 2015 2016e 2017e
DNB 0.16% 0.21% 0.18% 0.15% 0.53% 0.40% 2,270 8,095 6,234
SR-Bank 0.14% 0.17% 0.15% 0.28% 0.60% 0.51% 420 933 808
SMN 0.11% 0.11% 0.15% 0.18% 0.53% 0.50% 169 508 516
Nord Norge 0.24% 0.32% 0.41% 0.32% 0.31% 0.37% 200 204 263
Vest 0.13% 0.21% 0.25% 0.15% 0.31% 0.30% 185 150 423
Møre 0.10% 0.09% 0.09% 0.10% 0.14% 0.34% 50 73 185
Helgeland 0.23% 0.16% 0.17% 0.14% 0.25% 0.33% 32 41 79
Ringerike 0.05% 0.08% 0.06% 0.02% 0.12% 0.16% 3 21 30
Østfold Akershus 0.24% 0.27% 0.29% 0.09% 0.17% 0.35% 14 28 60
BV 0.21% 0.14% 0.15% 0.09% -0.16% 0.34% 17 -32 71
Average 0.16% 0.18% 0.19% 0.15% 0.28% 0.36%
Loan losses (% gross lending) Loan losses (NOK million)Average loan losses

IFRS 9 kommer 1. januar 2018 – Effekten per bank er ikke kjent
Source: Ernst & Young
| 19
Nedskrivningspraksis endres
Innføring av ny regnskapsstandard innebærer større
tapsavsetninger for de fleste bankene, også de
norske
Noen banker vil kanskje starte å øke avsetningene
tidligere?
Barclays/EY/PWC har alle estimert at snittbanken
må øke avsetningene med over 30%
Ekstremt vanskelig for investor/analytiker å sitte på
utsiden uten full innsikt i låneportføljene å vurdere
dette selv
Bankene har jevnt over uttrykt i årsrapportene for
2015 at avsetningene «kan øke», men ingen har
enda estimert effekten
Vi håper bankene gir informasjon om estimert effekt
senest i årsrapportene for 2016
Fra «incurred losses» til «expected losses»

~90% av befolkningen bruker nettbank Og bare 10% er hyppige brukere av bankkontoret
Norge er langt framme på digitalisering
| 20

Prising av egenkapitalbevis i dag
Arctic Securities
21
Utviklingen i markedet for egenkapitalbevis
Kredittmarkedet
Oppsummering
Egenkapitalbevis- og kredittmarkedet fra et investorperspektiv

0
100
200
300
400
500
600
700
800
900
Norway OSE Equity Certificate (Rebased) Norway OSE Benchmark (Rebased)
Egenkapitalindeksen (OSEEX) har levert bedre enn OSEBX
Source: Oslo Børs, FactSet, Artic Securities
OSEEX vs OSEBX fra 1999 til 15.9.2016 Comment
De første bankene med
egenkapitalbevis var
Sparebanken Øst i 1988
og Sparebanken Møre i
1989
Egenkapitalbevisindeksen
ble etablert i 1994,
FactSet har data tilbake
til 1999
De siste 17 årene har
OSEEX gitt en
gjennomsnittlig årlig
avkastning på 11%, OSEBX
har på samme periode
gitt en gjennomsnittlig
årlig avkastning på 8%
Hittil i år er OSEEX opp
11% mot OSEBX ned 2%
| 22

0
20
40
60
80
100
120
140
MIN
G
SVEG
NO
NG
SOR
SBH
E
MO
RG
SFSB
SPO
G
HELG
SBV
G
SAD
G
SBT
E
RIN
G
SOA
G
JAER
EN
NVSB
TO
TG
HG
SB
SBH
A
SKU
E
AU
RG
NTSG
SKA
SB
ME
LG
ASK
SB
HSP
G
BLS
G
SUSB
SESB
GR
ON
G
ISSG
HA
RSB
KD
SB
BFSB
G
AA
SB
HJG
SB
SBSB
HJS
B
KBSB
SUN
SB
AFJO
RD
OFSB
TYSB
NESS
CU
LTU
RA
45 (!) Egenkapitalbevisbanker - 6 nye banker i år10 SpareBank1, 9 Alliansefrie og 26 Eika banker
Source: Finans Norge, Company reports, Arctic Securities
| 23

De store dominerer på Oslo Børs, men sliter fortsatt med
innpass hos de fleste institusjonelle investorene
Source: Oslo Børs, Arctic Securities
| 24
Hvordan vurderer investorer markedet for EK bevis?
De største (MING og NONG)
- Sliter med innpass hos mange institusjonelle
investorer
- Gjennomgående langsiktige «long» investorer
- Indeks er en utfordring for noen
- Likvidit er en utfordring for mange
- Vil være positivt med flere store noterte banker
Øvrige regionale banker
- 3-4 av de unoterte kan vurdere børsnotering
hvis/når dette eventuelt er ønskelig
- Flere banker her som kan vurdere nedsalg fra
stiftelsene for å øke likviditeten i
egenkapitalbevisene
Lokalbankene
- Blir for smått og illikvid for de fleste fond
- Mange banker å velge i for interesserte retail
investorer
- Bør rendyrke rollen som trygge retail banker med
attraktivt kontantutbytte
9 banker utgjør ~90% av market cap
MING27%
NONG16%
RING9%
SVEG9%
MORG8%
SOAG6%
HELG5%
SOR4%

Utsteder av egenkapitalbevis – Hva bør bankene tenke på?
Source: Folketrygdfondet, Arctic Securities
Tydelig kommunikasjon av finansielle måltall Viktige momenter bankene bør ha fokus på
Finansielle måltall
- Egenkapitalavkastning
- Utdelingsgrad – F.eks. minimum 50% eller 40-60%
- Andre relevante nøkkeltall (internt mål for ren
kjernekapital, rentemargin, kostnader, tap etc.)
Rapportering – Store forskjeller blant bankene
- Utforming av kvartals- og årsrapporter
- Presentasjon av relevante nøkkeltall
- Tidsaktuelle tema i tillegg til vanlig rapportering
- Oljeeksponering
- Ren kjernekapital eksklusive overgangsordning
IR arbeid – Hvordan fremstå attraktiv
- Presentere banken for lokale investorer og kunder
- Knytte dette opp mot andre arrangement
- Gaveutdeling
- Kundekvelder om pensjon o.l.
Øke investors innflytelse i banken
- Øke egenkapitalbeviseiernes representasjonen i
generalforsamling/forstanderskap/rep.skap
«Det forventes at styret i selskapene fastsetter og
begrunner finansielle måltall som er tilpasset
selskapets sektor, strategi og potensialet for
verdiskaping.»
- Kilde: Folketrygdfondet
| 25

Prising av egenkapitalbevis i dag
Arctic Securities
26
Utviklingen i markedet for egenkapitalbevis
Kredittmarkedet
Oppsummering
Egenkapitalbevis- og kredittmarkedet fra et investorperspektiv

Senior Financials CDS up
6bps over the last month
-50
0
50
100
150
200
-50
0
50
100
150
200
Mar-11 Aug-11 Jan-12 Jun-12 Nov-12 Apr-13 Sep-13 Feb-14 Jul-14 Dec-14 May-15 Oct-15 Mar-16 Aug-16
Spread Difference iTraxx Senior Finance vs. iTraxx Europe
0
50
100
150
200
250
300
350
400
0
50
100
150
200
250
300
350
400
Mar-11 Aug-11 Jan-12 Jun-12 Nov-12 Apr-13 Sep-13 Feb-14 Jul-14 Dec-14 May-15 Oct-15 Mar-16 Aug-16
iTraxx Senior Finance vs. iTraxx Europe
iTraxx Europe (LHS) iTraxx Senior Finance (RHS)
The spread between
financials and industrials is
now 23 bps
Source: Bloomberg
European senior bank CDSs vs broad index spreads (5yr EUR)
| 27

Subordinated Financials
CDS is up 6bps over the last
month
The spread between
subordinated and senior is
now 112 bps
Source: Bloomberg
European sub. bank CDSs vs senior bank CDSs(5yr EUR)
| 28
-50
50
150
250
350
450
550
650
-50
50
150
250
350
450
550
650
Mar-11 Aug-11 Jan-12 Jun-12 Nov-12 Apr-13 Sep-13 Feb-14 Jul-14 Dec-14 May-15 Oct-15 Mar-16 Aug-16
iTraxx Senior Finance vs. iTraxx Subordinated Finance
Itraxx Subordinated Finance iTraxx Senior Finance (RHS)
-50
0
50
100
150
200
250
300
-50
0
50
100
150
200
250
300
Mar-11 Aug-11 Jan-12 Jun-12 Nov-12 Apr-13 Sep-13 Feb-14 Jul-14 Dec-14 May-15 Oct-15 Mar-16 Aug-16
Spread Difference iTraxx Senior Finance vs. iTraxx Subordinated Finance

Prising av egenkapitalbevis i dag
Arctic Securities
29
Utviklingen i markedet for egenkapitalbevis
Kredittmarkedet
Oppsummering
Egenkapitalbevis- og kredittmarkedet fra et investorperspektiv

Oppsummering – Fra et investorperspektiv
Egenkapitalbevis- og kredittmarkedet fra et investorperspektiv
Interesse for egenkapitalbevis og kreditt i norske sparebanker
- Mange banker å velge mellom både for kreditt- og egenkapitalinvestorer
- Muligheter for god diversifisering på antall/region etc.
Markedet for egenkapitalbevis og prising
- Positiv utvikling så langt i år og vi tror resten av året blir bra (offentliggjøring av Pilar 2 vil bidra)
- Markedet har alltid rett, men bankene kan bidra til å redusere enkelte av usikkerhetsmomentene
- Likviditet hovedutfordringen for de fleste fond, noen pga utelatelse i indeks
Investorene er gjennomgående opptatt av
1. Rentenivå og eventuelt press på rentenetto – Rentemøte senere denne uken, har vi sett bunnen?
2. Oljeeksponering og ytterligere tap – denne usikkerheten vil vedvare, men markedet priser inn relativt høye
tap i 2017/2018
3. Kapitaldekning – her er vi snart i mål (oppfordrer bankene til å kommunisere ren kjerne eksklusive
overgangsordning)
4. IFRS 9 kommer – her kan bankene bidra til å redusere usikkerheten ved å offentliggjøre anslag på økning i
avsetninger
5. Fintech – Norge ligger langt fremme innen digitalisering og bankene posisjonerer seg så godt de kan
(spesielt innen betalingsformidling) – Økte investeringer innen sektoren vil legge press på bankenes
produkter i årene fremover
Source: Arctic Securities
| 30

Disclaimer
This presentation (hereinafter referred to as the “Presentation”) has been prepared exclusively for information purposes, and does not constitute an offer to sell
or the solicitation of an offer to buy any financial instruments.
This Presentation includes and is based on, among other things, forward-looking information and statements. Such forward-looking information and statements are
based on current expectations, estimates and projections. Such forward-looking information and statements reflect current views with respect to future events
and are subject to risks, uncertainties and assumptions. We cannot give any assurance as to the correctness of such information and statements.
Several factors could cause the actual results, performance or achievements of the companies mentioned herein to be materially different from any future
results, performance or achievements that may be expressed or implied by statements and information in this Presentation, including, among others, risks or
uncertainties associated with the company’s business, segment, development, growth management, financing, market acceptance and relations with customers,
and, more generally, general economic and business conditions, changes in domestic and foreign laws and regulations, taxes, changes in competition and pricing
environments, fluctuations in currency exchange rates and interest rates and other factors. Should one or more of these risks or uncertainties materialize, or
should underlying assumption prove incorrect, actual results may vary materially from those described in this document. We do not intend, and do not assume
any obligation, to update or correct the information included in this Presentation.
There may have been changes in matters which affect the companies herein subsequent to the date of this Presentation. Neither the issue nor delivery of this
Presentation shall under any circumstance create any implication that the information contained herein is correct as of any time subsequent to the date hereof or
that the affairs of the company/ies have not since changed, and we do not intend, and do not assume any obligation, to update or correct any information
included in this Presentation.
The contents of this Presentation are not to be construed as legal, business, investment or tax advice. Each recipient should consult with its own legal, business,
investment and tax adviser as to legal, business, investment and tax advice.
We make no undertaking, representation or warranty, express or implied, regarding the accuracy or completeness of the information (whether written or oral and
whether included in this Presentation or elsewhere), whether such information was received through us or otherwise. We expressly disclaim any liability
whatsoever in connection with the matters described herein.
Please see our website www.arctic.com for further disclaimers and disclosures.
This Presentation is subject to Norwegian law, and any dispute arising in respect of this Presentation is subject to the exclusive jurisdiction of Norwegian courts
with Oslo City Court AS exclusive venue.

3232
Norway
Arctic Securities AS
P.O. Box 1833 Vika
NO-0123 Oslo
Haakon VIIs gt 5, NO-0161 Oslo
USA
Arctic Securities LLC
1 Rockefeller Plaza
Suite 1706, New York
NY 10022
Sweden
Arctic Securities AS
Sweden Branch
Biblioteksgatan 8
SE-111 46 Stockholm
Brazil
Arctic Brasil Escritório de
representação Ltda
Rua Lauro Müller, 116 - Sala 4404
Torre do Rio Sul / Botafogo
22290-160 Rio de Janeiro
Tel +47 21 01 31 00 Tel +1 (212) 597 5555 Tel +5521 2025 7400Tel +46 844 68 6100


