November 2015 PhD thesis in Chemical Engineering supervised by Prof. Margarida Maria João de Quina and Prof. Rosa Maria de Oliveira Quinta Ferreira and submitted to the Department of Chemical Engineering, Faculty of Science and Technology of the University of Coimbra Micaela Alexandra da Rocha Soares EGGSHELL VALORISATION BY CO-COMPOSTING PROCESS FOR ENVIRONMENTAL APPLICATIONS
Transcript
November 2015
PhD thesis in Chemical Engineering supervised byProf. Margarida Maria João de Quina and Prof. Rosa Maria de Oliveira Quinta Ferreira
and submitted to the Department of Chemical Engineering,Faculty of Science and Technology of the University of Coimbra
Micaela Alexandra da Rocha Soares
EGGSHELL VALORISATION BY CO-COMPOSTINGPROCESS FOR ENVIRONMENTAL APPLICATIONS
Micaela
Alex
andra
da R
ocha
Soa
res
EGGS
HELL VA
LORISATIO
N BY
CO-
COMP
OSTIN
G PR
OCESS FO
R EN
VIRON
MENT
AL APP
LICATIONS
Micaela Alexandra da Rocha Soares
Eggshell valorisation by co-composting process for
environmental applications
PhD Thesis in the scientific area of Chemical Engin eering, submitted to the Department of Chemical Engineering, Faculty of Scie nce and Technology,
University of Coimbra
Supervisors: Prof. Margarida Maria João de Quina
Prof. Rosa Maria de Oliveira Quinta Ferreira
Coimbra November 2015
i
ACKNOWLEDGEMENTS
The development of this work was an adventure, that was not possible to conclude
without the guidance and support of some persons to whom I wish to express my genuine
acknowledgement.
To my supervisor, Professor Margarida Quina, I am very grateful for all the motivation,
availability, scientific guidance and accuracy throughout all the phases of this study. In
particular, her patient and support during a difficult phase of my life was of extreme importance
to conclude the writing of this document.
To my co-supervisor, Professor Rosa Quinta-Ferreira, I would like to acknowledge for
her scientific wisdom, suggestions and human character. Also, her words of support and
collaboration have guide me to this point.
To Professor Licínio Gando-Ferreira I am grateful for the advices in the sorption studies
and for all logistical resources made available for this work. The suggestions and guidance of
Professor Marco Seabra in the principal component analysis are also deeply appreciated.
To all the collaborators and students of the Department of Chemical Engineering from
the Faculty of Sciences and Technology of the University of Coimbra that contributed to this
study, my appreciation is in here expressed and recognised.
To Leonor Pato, my gratitude for all the help and friendship during the analytic work,
namely in soils characterisation and carbon/nitrogen determination. It has been a pleasure
working with you and I am really glad that our professional paths have been crossed!
There are no sufficient words in the world that can express the role that João and Diogo
have played while this task lasted. To them, I attribute the reason for getting this far! João, you
were my breath and advisor at times of uncertainty and my motivation on the opportunities and
challenges. Diogo, your young age and your hugs showed me that is always worth to start over
against all odds!
To my parents, that are the reason for being who I am, my deepest acknowledgments for
the human values that have transmitted to me during all these years. For all the support and
motivation you gave me, I hope to make you proud!
ii
ABSTRACT
Nowadays, the European guidelines boost the concept of “circular economy” where the
focus is to reuse, repair, refurbish and recycle existing materials and products. As a result, the
waste can be turned into a resource with benefits to the economy and environment. In this scope,
composting is a waste management option that can promote the retrieval of waste organic matter
and nutrients, which can be tailored to obtain a product for suppressing soil deficiencies.
This work aimed to evaluate the feasibility of co-composting industrial eggshell waste
(ES) with other agro wastes (potato peel, grass clippings and rice husks), to obtain an added
value product. For attaining this key motivating factor, co-composting was assessed at three
levels: i) process performance, ii) end-product quality and iii) added-value of the final product
(compost).
In lab-scale self-heating reactors with forced aeration, several mixtures were composted.
Firstly, a starting composting mixture of organic rich wastes was selected based upon its
biological activity. Then, increasing quantities of industrial eggshell (inorganic material) were
added up to 60% (w/w, wet basis). The influence of N-rich sources was also investigated. In
these experiments, temperature and oxygen uptake rate were the main process variables
monitored and conventional physical, chemical and stability parameters were also evaluated.
Principal components analysis was used to unravel the main relationships structuring the
variability associated to the composting experiments. Finally, added-value of the composting
end-products obtained was appraised, in terms of sorption capacity and immobilisation of metals
in soil. In this ambit, the fractionation of metals was determined.
Globally, results showed that co-composting of industrial eggshell waste is feasible to
fulfil the pathogen-killing criteria (70ºC, for 1 hour), when an N-rich source was present. At
higher level of ES (60% w/w, wet basis) pathogen-killing temperatures were atained, but aerobic
biological activity was hindered by some physical properties of the mixture, namely due to high
density and low water holding capacity. Eggshell composting product (CES) was stable, non-
phytotoxic and can be an effective liming material with intrinsic properties for in situ
remediation of soil contaminated with lead and zinc.
iii
RESUMO
Hoje em dia, as diretrizes europeias fomentam o conceito de "economia circular", onde o
foco é a reutilização, reparação, recuperação e reciclagem de materiais e produtos em fim de
vida. Como resultado, os resíduos podem ser transformados em recursos com benefícios para a
economia e meio ambiente. Neste âmbito, a compostagem é uma opção de gestão de resíduos
que pode promover a recuperação de matéria orgânica e nutrientes através da obtenção de um
produto adequado para suprimir determinadas deficiências do solo.
Este trabalho teve como objetivo avaliar a aplicabilidade da co-compostagem de resíduos
industriais de casca de ovo (RCO) com outros agro-resíduos (casca de batata, aparas de relva e
casca de arroz), de forma a obter um produto de valor acrescentado para remediação ambiental.
Para o efeito, o processo de co-compostagem foi avaliado a três níveis: i) desempenho
operacional, ii) qualidade do produto final e iii) valor acrescentado do produto final (composto)
para aplicação ambiental.
Em reatores laboratoriais de auto-aquecimento e com arejamento forçado foram testadas
misturas com várias composições, de forma a selecionar uma mistura de base tendo como
critério a atividade biológica. Posteriormente, quantidades crescentes de casca de ovo industrial
(material inorgânico) foram adicionadas até um máximo de 60% (p/p, base húmida).
Adicionalmente foi também investigada a influência de fontes ricas em azoto no
desenvolvimento do processo. Nestas experiências laboratoriais, a temperatura e a taxa de
consumo de oxigénio foram os principais variáveis monitorizadas, tendo sido avaliados diversos
parâmetros convencionais de natureza física e química, bem como a estabilidade biológica.
A análise de componentes principais (PCA) foi utilizada para mostrar as principais
relações que estruturam a variabilidade associada aos testes de compostagem. O valor
acrescentado dos produtos finais de compostagem obtidos foi avaliado, em termos de capacidade
de sorção e potencial de imobilização de metais no solo. Neste âmbito, foram realizados testes
descontínuos de sorção e o fracionamento de metais no solo.
Globalmente, os resultados evidenciaram que a co-compostagem de resíduos industriais
de casca de ovo é viável para cumprir os critérios higienização (70ºC, durante 1 h), quando uma
fonte de rica em N está presente na mistura de base. No nível mais alto de incorporação de RCO
(60% p/p, base húmida), o critério de higienização foi atingido, mas a atividade biológica aeróbia
foi dificultada por algumas propriedades físicas da mistura, nomeadamente devido à elevada
densidade bulk e à baixa capacidade de retenção de água. Os produtos finais de compostagem
ricos em RCO são estáveis, não-fitotóxicos e podem ser utilizados como material de calagem
iv
com propriedades intrínsecas para remediação in situ de solos contaminados com chumbo e de
zinco.
v
INDEX Abstract………………………………………………………………. ii Resumo……………………………………………………………….. iii List of Figures………………………………………………………... ix List of Tables………………………………………………………… xiii Acronyms……………………………………………………………. xv Part A. Thesis Scope and Outline…………………………………… 1
1. Introduction……………………………………………………………...…….. 3 1.1. The egg processing sector and eggshell production………………………. 4 1.2. Eggshell properties…………………………………...…………………… 7 1.3. Potential valorisation options for eggshell………………………………... 9
1.3.1. Eggshell utilisation as raw material………..………………………... 10 1.3.2. Eggshell utilisation as operating supplies.………………………….. 13
1.4. European legal framework……………………………………………….... 17 1.5. Work motivation and scope……………………………………………….. 21 1.6. Thesis structure……………………………………………………………. 22 1.7. References………………………………………………………………… 25
2. State of the art in composting process………………………………………... 31
2.1. Introduction……………………………………………………………….. 32 2.2. Temperature-dependent phases and general biotic aspects……………….. 32 2.3. Pathogen destruction………………………….…………….…………….. 34 2.4. Organic matter and nitrogen transformation.…………….……………….. 37
3.2.3. Analytical methods………………….…………….………………… 78 3.3. Results and discussion………………….…………….…………………… 79
3.3.1. Characterisation of the composting materials………………….…… 79 3.3.2. Response regression model analysis………………….…………….. 81 3.3.3. Surface and response trace plots analysis………………….………... 83 3.3.4. Validation of the response regression model………………….……. 84
4. Assembly and operation of lab-scale composting reactors………………….. 91
4.1. General design concepts of composting reactors………………….……… 92 4.2. Description of the reactors………………….…………….………………. 94
4.2.1. General characteristics………………….…………….…………….. 94 4.2.2. Temperature monitoring………………….…………….…………... 95 4.2.3. Air flow and oxygen measuring systems…………………………… 97
4.4.1. Temperature gradients and oxygen measuring system……………... 101 4.4.1.1. Material and methods………………….…………….………. 102 4.4.1.2. Results…………………….…………….…………………… 103
4.4.2. Ash conservation………………….…………….…………………... 106 4.4.2.1. Material and methods………………….…………….………. 106 4.4.2.2. Results………………….…………….……………………… 106
Part C. Composting trials with industrial eggshell waste…………. 111
5. Evaluation of the self-heating potential of specific mixtures………………... 113 5.1. Introduction………………….…………….……………………………… 114 5.2. Materials and methods………………….…………….…………………… 115
5.2.1. Self-heating reactors………………….…………….……………….. 115 5.2.2. Materials and experimental design………………….…………….… 116 5.2.3. Analytical methods………………….…………….………………… 117 5.2.4. Statistical analysis of data………………….…………….…………. 117
6. Valorisation of industrial eggshell by co-composting: influence of eggshell content and N-rich material……………………………………………………... 125
6.1. Introduction………………….…………….……………………………… 126 6.2. Materials and methods………………….…………….…………………… 127
6.2.1. Composting materials and experimental design………………….…. 127 6.2.2. Experimental set-up and composting tests………………….………. 128 6.2.3. Monitoring parameters………………….…………….…………….. 128 6.2.4. Statistical analysis of data………………….…………….…………. 130
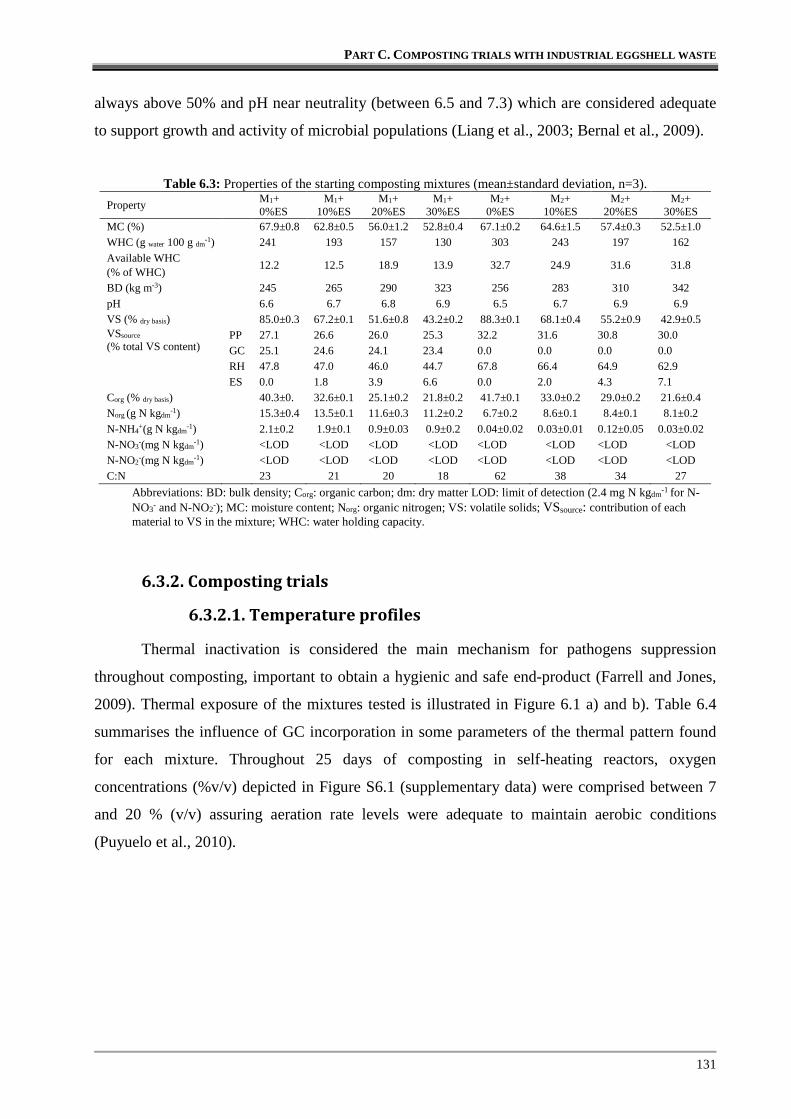
6.3. Results and discussion………………….…………….…………………… 130 6.3.1. Characteristics of the starting composting mixtures…...…………… 130 6.3.2. Composting trials………………….…………….………………….. 131
6.3.2.1. Temperature profiles………………….…………….……….. 131
vii
6.3.2.2. Oxygen uptake and organic matter conversion……………… 133 6.3.2.3. Moisture and physical changes………………….…………… 136 6.3.2.4. Nitrogen transformation and estimation of N losses………… 137
Part D. Environmental applications for eggshell compost………... 181 8. Biosorbent potential of an eggshell rich composting product for lead removal from aqueous solutions………………………………………………… 183
8.1. Introduction………………….…………….……………………………… 184 8.2. Materials and methods………………….…………….…………………… 185
8.2.1. Biosorbents characterisation………………….…………….……….. 185 8.2.1.1. Physical and chemical properties………………….………… 185 8.2.1.2. pH at the point of zero charge and acid neutralisation
capacity………………….…………….……………………...
186
8.2.2. Sorption studies………………….…………….……………………. 187 8.2.2.1. Kinetic studies………………….…………….……………… 187 8.2.2.2. Equilibrium studies………………….…………….…………. 188 8.2.2.3. Effect of pH on metal sorption………………….…………… 189
8.2.3. Calculation of lead distribution between aqueous phase and biosorbent………………….…………….…………………………..
189
8.2.4. Statistical analysis………………….…………….…………………. 190 8.3. Results and discussion………………….…………….…………………… 190
9.2.3.1. pH and electrical conductivity………………….……………. 214 9.2.3.2. Single chemical extractions………………….…………….… 214 9.2.3.3. Sequential chemical extractions………………….………….. 215
9.2.4. Environmental risk of metals in soil………………….……………... 216 9.2.5. Bioassays………………….…………….…………………………... 216 9.2.6. Monitoring of CO2 and kinetic modelling………………….……….. 216 9.2.7. Statistical analysis………………….…………….…………………. 217
9.3. Results and discussion………………….…………….…………………… 217 9.3.1. Properties of soil and amendments………………….…………….… 217 9.3.2. Effect of amendments on soil pH and electrical conductivity………. 219 9.3.3. Influence of soil treatment on lead and zinc environmental availability..………………….…………….………………………...
219
9.3.3.1. Mobile and mobilisable fraction………………….………….. 219 9.3.3.2. Distribution in soil phases and risk assessment……………… 222
9.3.4. Toxicity evaluation………………….…………….………………… 224 9.3.5. CO2 efflux and kinetic modelling…………...………………………. 224
Figure 2.2: Humic substances: a) classification and chemical properties, b) proposed formation mechanisms..…………………………………………………………..
39
Figure 2.3: Generalised bar diagram showing VS and ash components for starting composting mixture and compost product. Ash fraction is conservative...………
40
Figure 2.4: Schematic representation of nitrogen transformations and transfer throughout composting..………………………………………………………………………
42
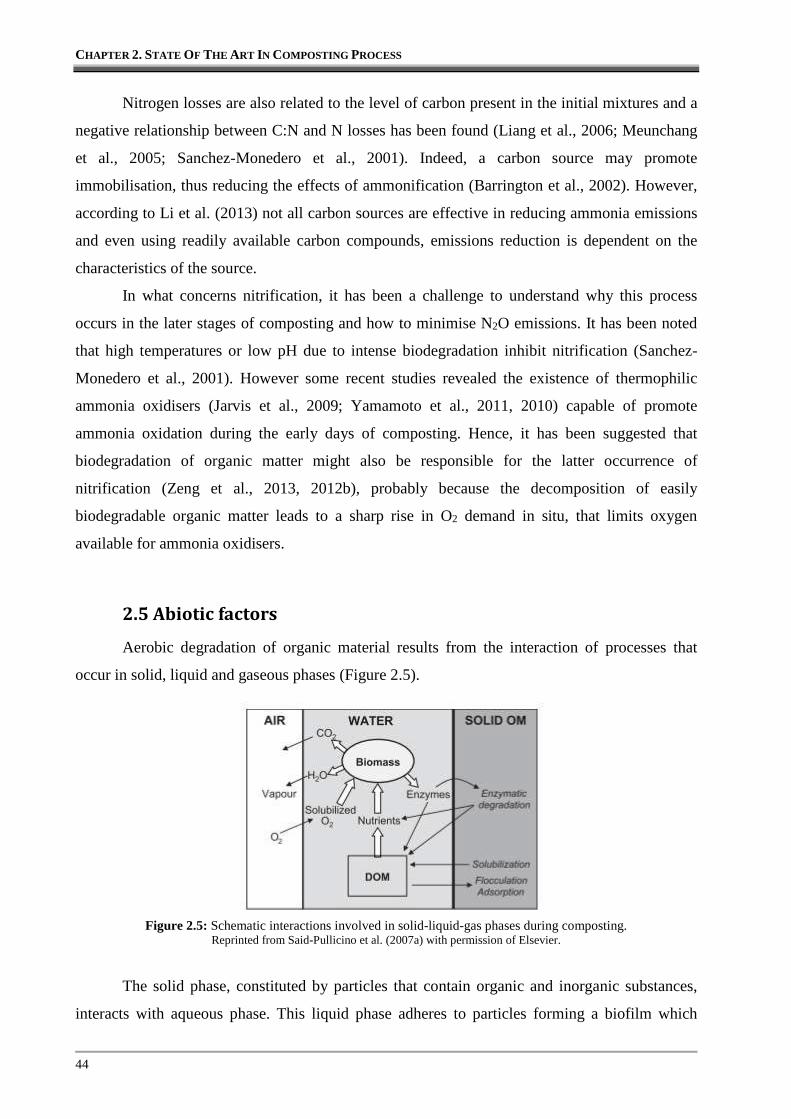
Figure 2.5: Schematic interactions involved in solid-liquid-gas phases during composting… 44
Figure 2.6: Schematic representation of volume fractions in a composting matrix…………. 47
Figure 2.7: Simple representation of air picnometer..……………………………………….. 48
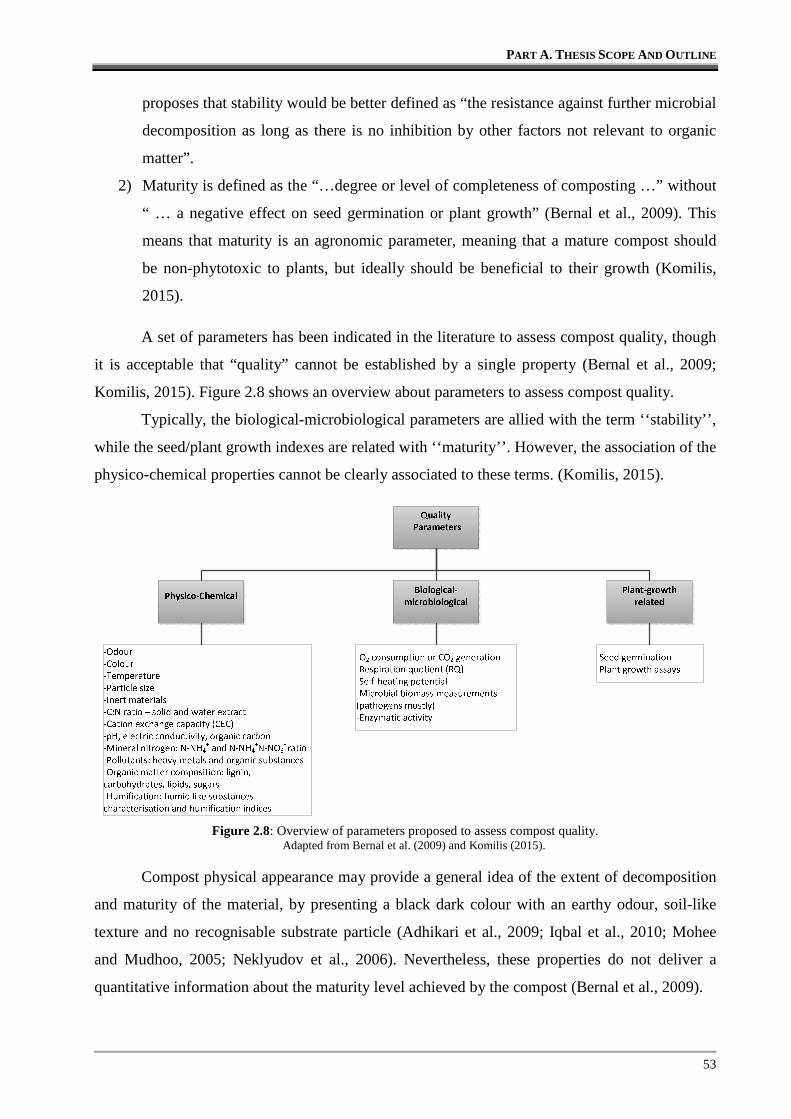
Figure 2.8: Overview of parameters proposed to assess compost quality....………………… 53
Figure 2.9: Composting end-products use for soil application..……………………………... 59
Figure 3.1: Mixtures tested according to a simplex-centroid mixture design (values in brackets represent blend order preparation and analysis). ……………………….
77
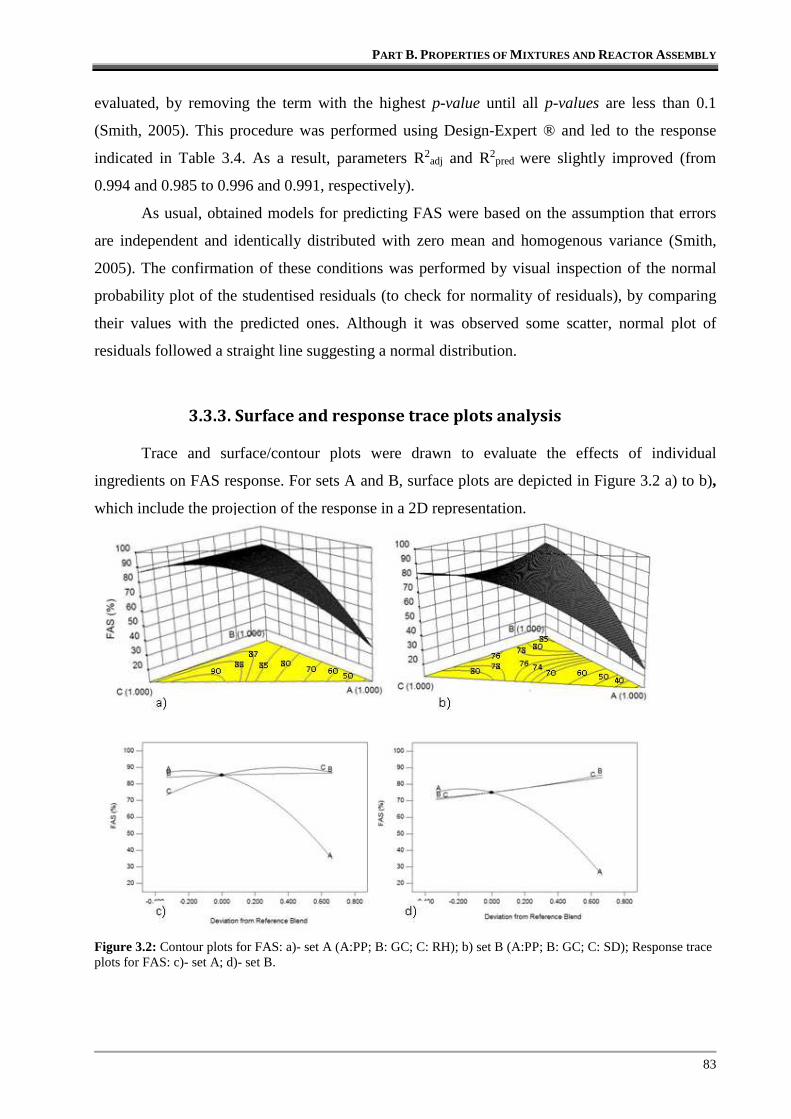
Figure 3.2: Contour plots for FAS: a)- set A (A:PP; B: GC; C: RH); b) set B (A:PP; B: GC; C: SD); Response trace plots for FAS: c)- set A; d)- set B………………………
83
Figure 3.3: Contour and response trace plots for FAS for: a) set A (A:PP; B: GC; C: RH), RH1-RH3 are the validating mixtures; b) set B (A:PP; B: GC; C: SD), SD1-SD3 are the validating mixtures..………………………………………………...
85
Figure 3.3: Comparison between FAS predictions Error bars indicate prediction intervals with a significance of 95%.....................…………………………………………
87
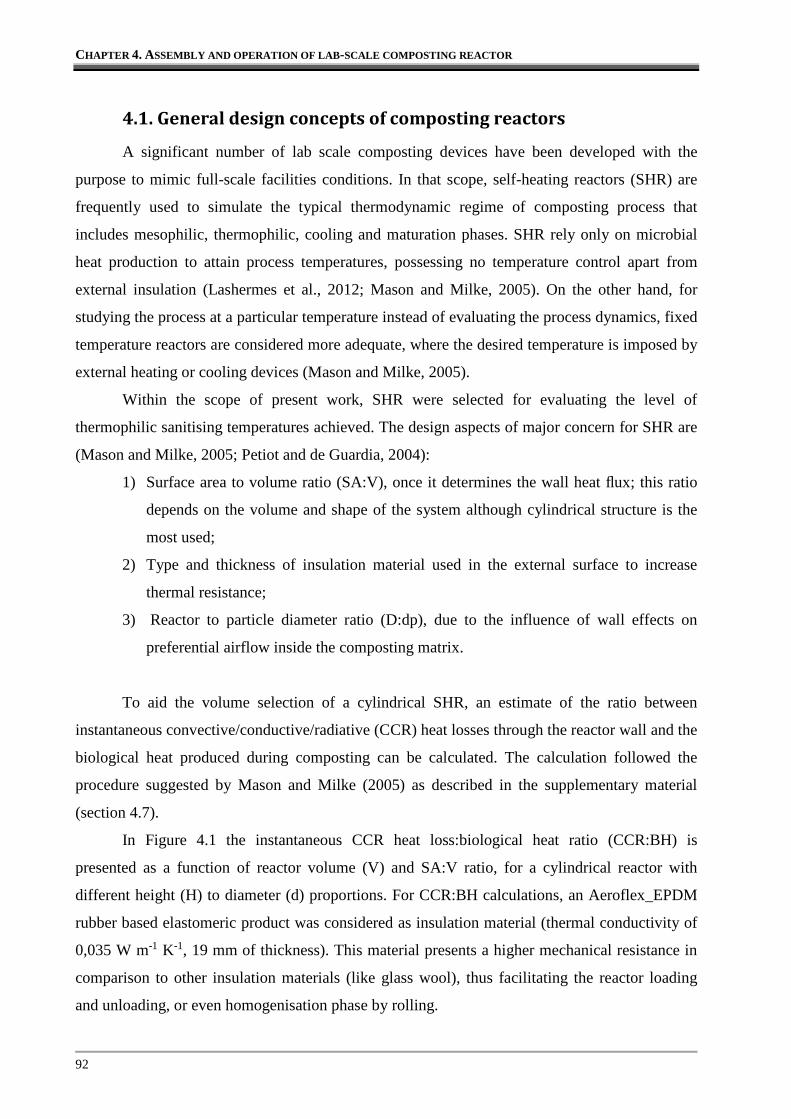
Figure 4.1: Influence of a) the volume of a cylindrical self-heating reactor, b) SA:V in CCR heat loss:BH.……………………………………………………………………...
93
Figure 4.2: Experimental setup overview of the SHR used in this work…………………….. 94
Figure 4.3: Overall view of the components from the temperature monitoring system……... 95
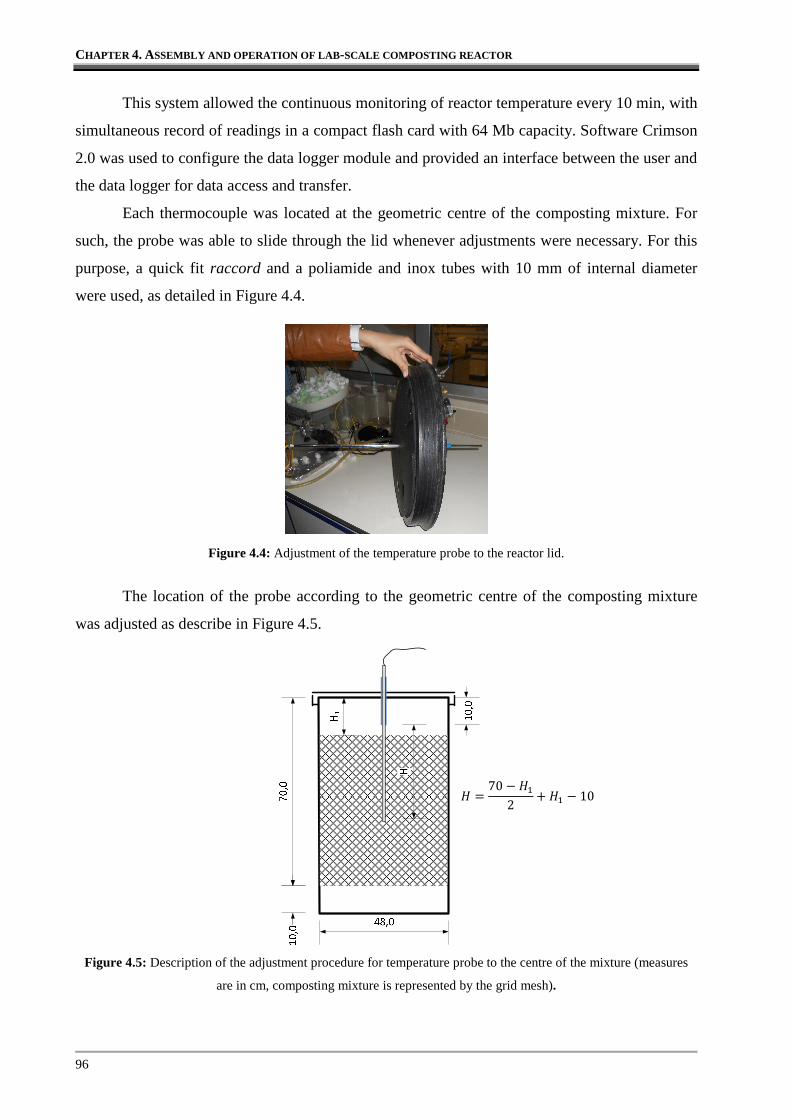
Figure 4.4: Adjustment of the temperature probe to the reactor lid.………………………… 96
Figure 4.5: Description of the adjustment procedure for temperature probe to the centre of the mixture..………………………………………………………………………
96
Figure 4.6: a) Air flow measuring system, b) home-made wet air flow meter………………. 97
Figure 4.7: a) Water trap for the oxygen measuring system; b) oxygen gas sensor and measuring cell…………………………………………………………………….
97
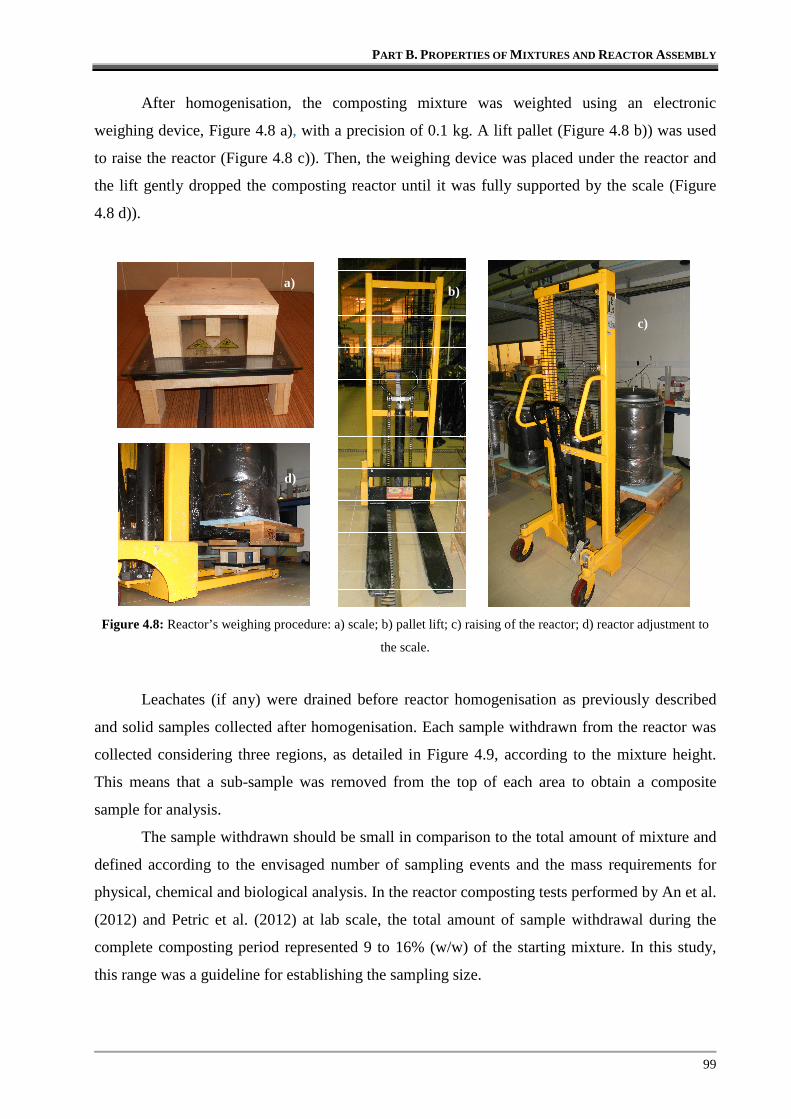
Figure 4.8: Reactor’s weighing procedure: a) scale; b) pallet lift; c) raising of the reactor; d) reactor adjustment to the scale..…………………………………………………..
99
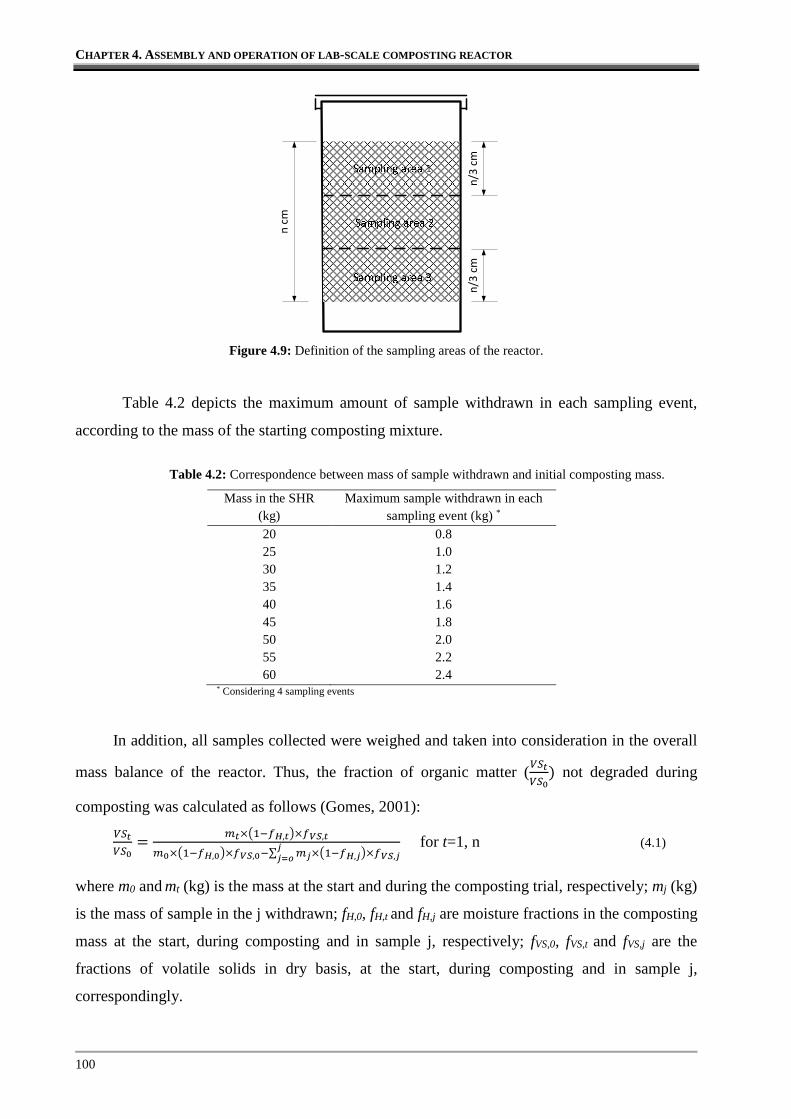
Figure 4.9: Definition of the sampling areas of the reactor..………………………………… 100
x
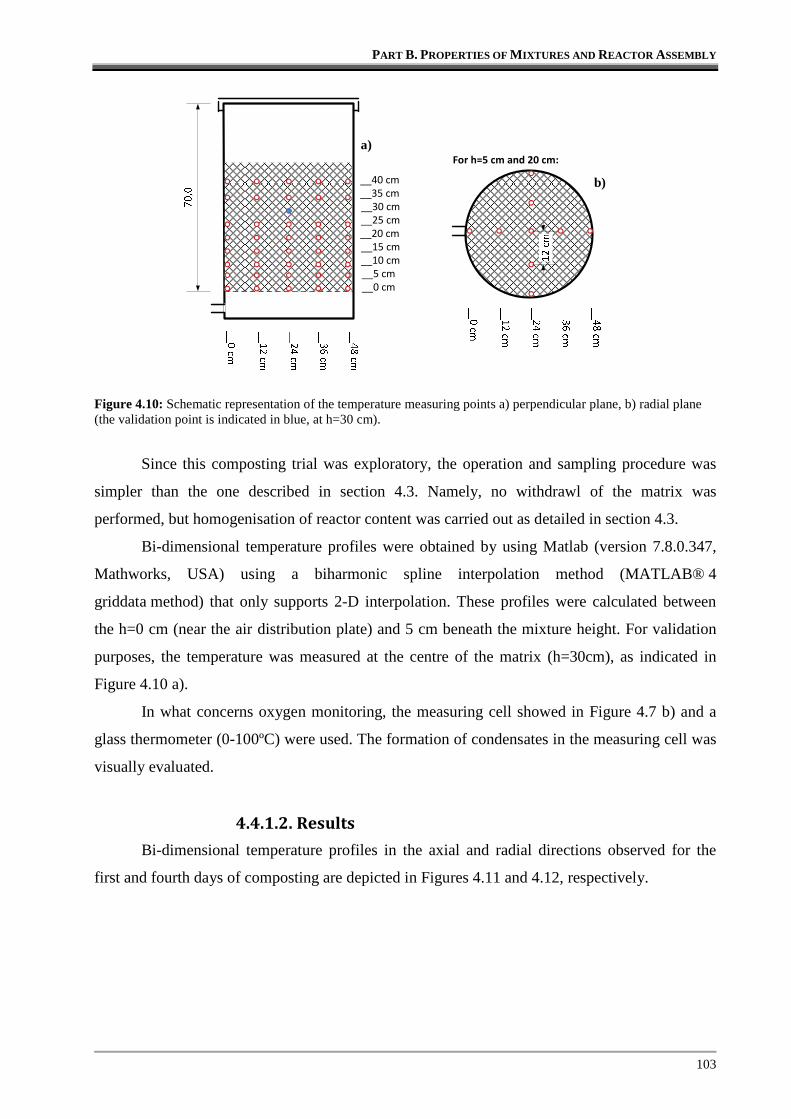
Figure 4.10: Schematic representation of the temperature measuring points a) perpendicular plane, b) radial plane..…………………………………………………………….
103
Figure 4.11: Bi-dimensional temperature profiles for the 1st day of composting (inlet air temperature: 17ºC)..………………………………………………………………
104
Figure 4.12: Bi-dimensional temperature profiles for the 4th day of composting (inlet air temperature: 17ºC). ………………………………………………………………
104
Figure 4.13: Temperature profiles during five days of composting at the mixture centre, exit gases, O2 measuring system and ambient.………………………………...…
106
Figure 5.1: Evolution of (a) temperature and airflow rate and (b) OUR for SHR1 to SHR3 reactors.…………………………………………………………………………...
118
Figure 5.2: Evolution of FAS during composting of SHR1, SHR2, SHR3 a) by Eq (3.6) b) by Eq (3.10).……………………………………………………………………...
120
Figure 5.3: Evolution of (a) temperature and airflow rate and (b) OUR composting for SHR2 and SHR2 +0%ES………………………………………………………….
121
Figure 5.4: Evolution of temperature and air flow rate, during composting of SHR2 with 0 and 30% ES (w/w).…..…………………………………………………………...
122
Figure 6.1: Evolution of core centre and ambient temperatures of mixtures a) M1 and b) M2, during first 25 days of composting..……………………………………………...
132
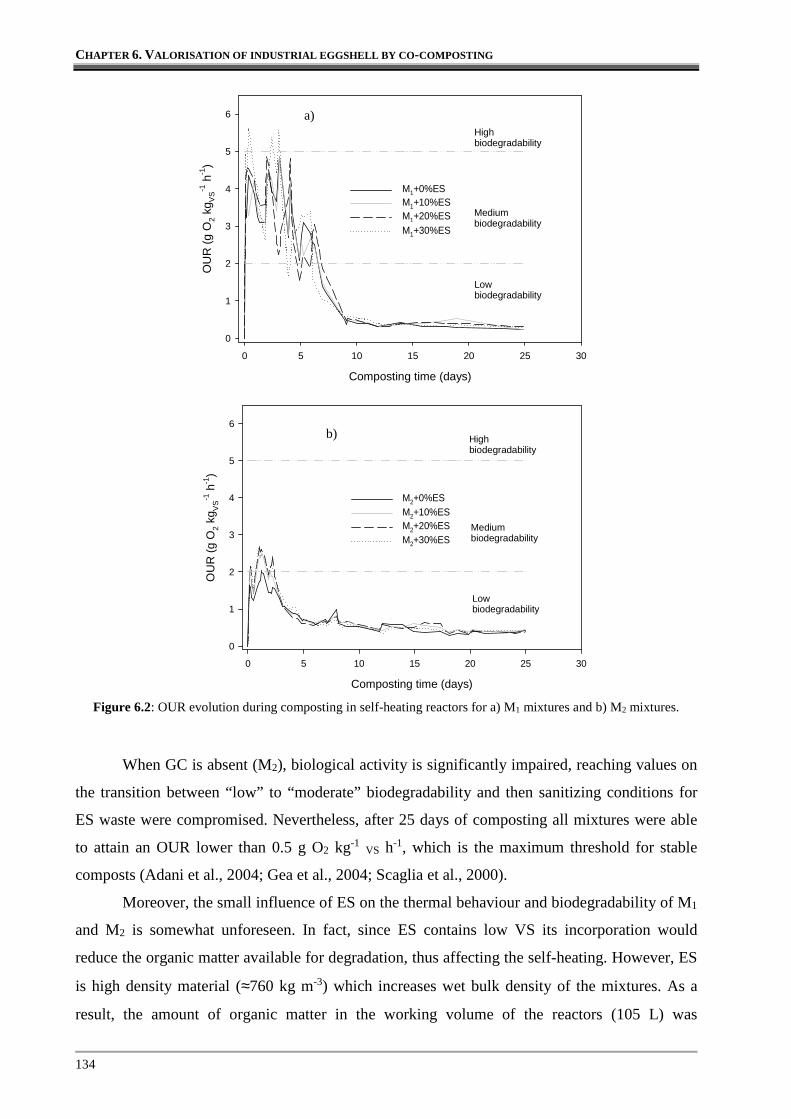
Figure 6.2: OUR evolution during composting in self-heating reactors for a) M1 mixtures and b) M2 mixtures..……………………………………………………………...
134
Figure 6.3: Influence of GC in organic matter conversion and total oxygen consumption by unit of organic matter degraded…...……………………………………………...
135
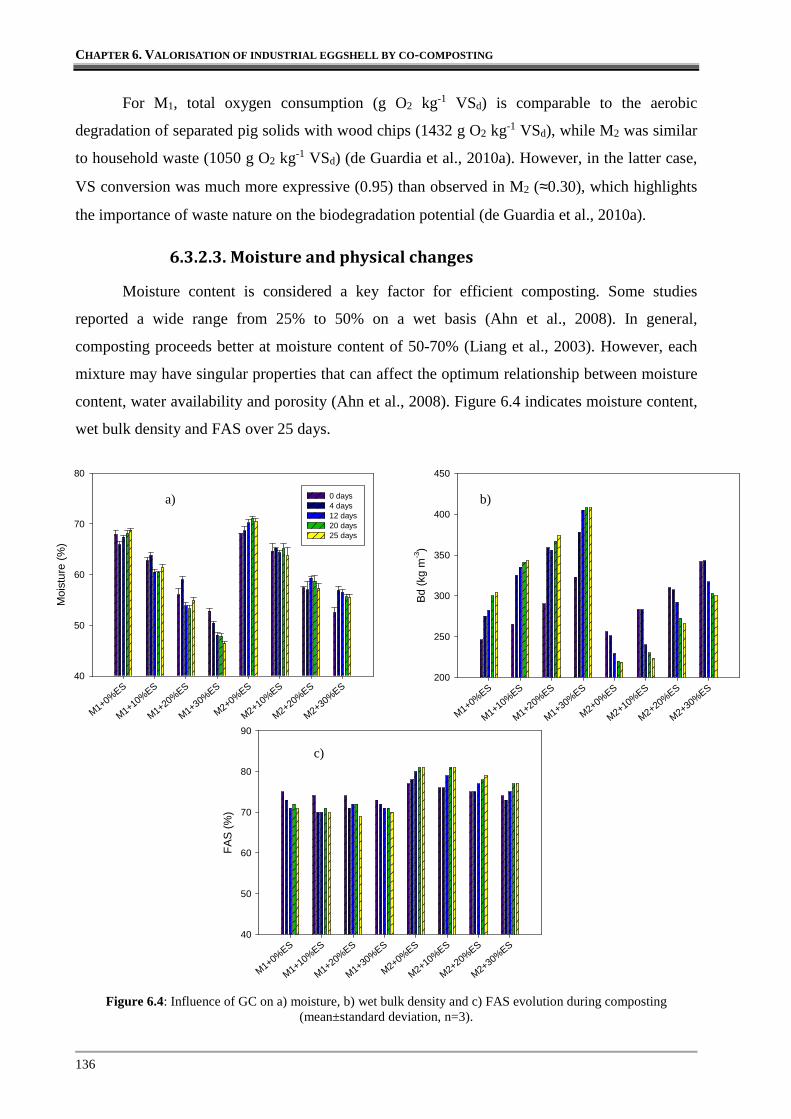
Figure 6.4: Influence of GC on a) moisture, b) wet bulk density and c) FAS evolution during composting...……………………………………………………………...
136
Figure 6.5: Ammonification and N pool for M1 and M2 mixtures during 25 days of composting………………………………………………………………………..
138
Figure 6.6: Evolution of mineral N for M1 and M2 during 25 days of composting (error bars indicate standard deviation, n=3): a) 0% ES, b) 10% ES, c) 20% ES, d) 30% ES………………………………………………………………………………....
139
Figure S6.1: Aeration rate and oxygen levels during composting in self-heating reactors: a) M1 mixtures; b) M2 mixtures...…………………………………………………...
148
Figure S6.2: Profile of organic matter mineralisation and cumulative O2 consumption for M1 and M2 mixtures with a) 0%ES, b) 10%ES...………………………………...
149
Figure S6.3: Profile of organic matter mineralisation and cumulative O2 consumption for M1 and M2 mixtures with a) 20%ES, b) 30%ES.………………………………...
150
Figure S6.4: Relation between cumulative O2 consumption and VS degraded for M1 and M2
mixtures with a) 0%ES, b) 10%ES..……………………………………………...
151
Figure S6.5: Relation between cumulative O2 consumption and VS degraded for M1 and M2
mixtures with a) 20%ES, b) 30%ES……………………………………………...
152
Figure S6.6: FTIR spectra for a) M1+0%ES, b) M2+0%ES, c) M1+10%ES………………… 153
Figure S6.7: FTIR spectra for a) M2+10%ES, b) M1+20%ES, c) M2+20%ES……………… 154
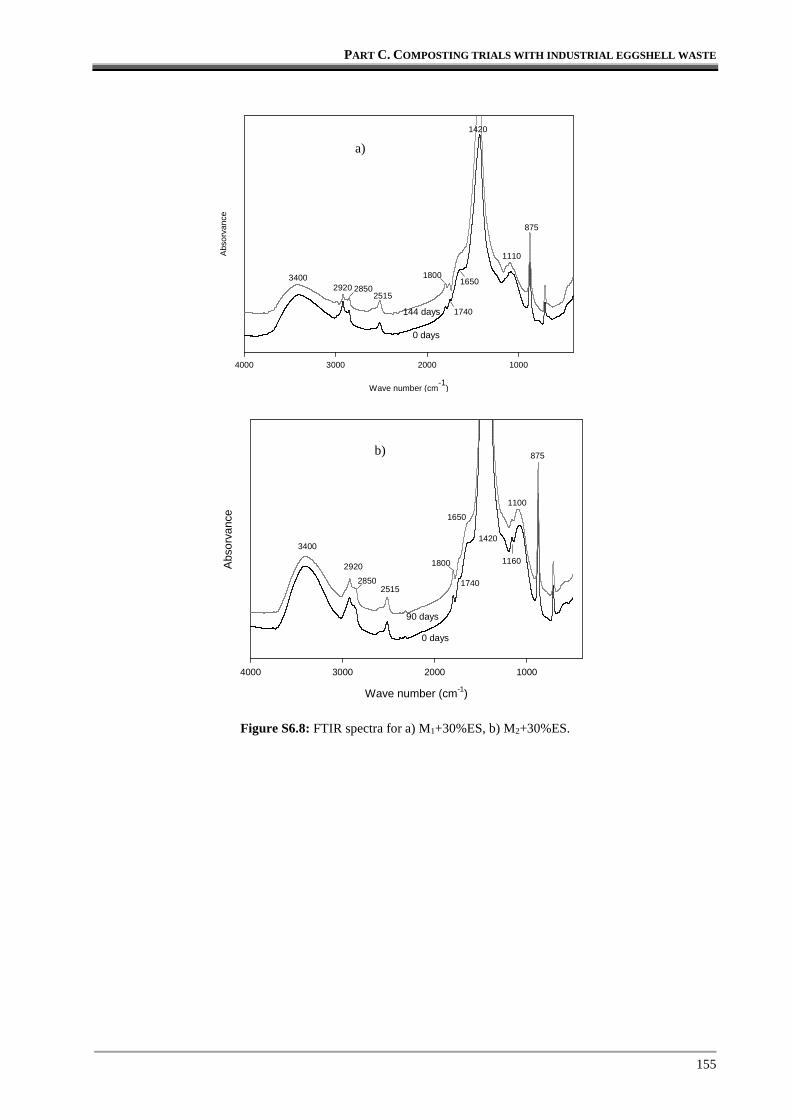
Figure S6.8: FTIR spectra for a) M1+30%ES, b) M2+30%ES………………………………. 155
Figure 7.1: Evolution of core centre temperature of mixtures M2+0%ES to M2+60%ES, over 25 days of composting….…………………………………………………...
165
Figure 7.2: a) OUR evolution during composting in self-heating reactors, b) Relationship
xi
between O2 consumption and VS degradation…………………………………... 166
Figure 7.3: Influence of ES on moisture during composting………………………………… 167
Figure 7.4: Influence of ES on wet bulk density evolution during composting……………... 167
Figure 7.5: Influence of ES on FAS evolution during composting………………………….. 168
Figure 7.6: Effect of ES incorporation on volatile solids decay……………………………... 169
Figure 7.7: Effect of ES incorporation on Corg:N evolution………………………………... 170
Figure 7.8: Effect of ES incorporation on nitrate formation during composting……………. 170
Figure 7.9: Effect of ES incorporation on germination index……………………………….. 171
Figure 7.10: Effect of ES incorporation on pH during composting…………………………. 171
Figure 7.11: Eigenvalues profile for the PCA analysis of all ES mixtures during composting (0-25 days)...………………………………………………………...
173
Figure 7.12: a) Time-series plots of the scores for the first principal component (PC1), stratified by %ES; b) Scatter plot for the first two scores (PC1 vs PC2), stratified by %ES (colour of the bubbles) and time (size of the bubbles)………..
174
Figure 7.13: Loadings for the a) first principal component (PC1), b) second principal component (PC2)….……………………………………………………………...
176
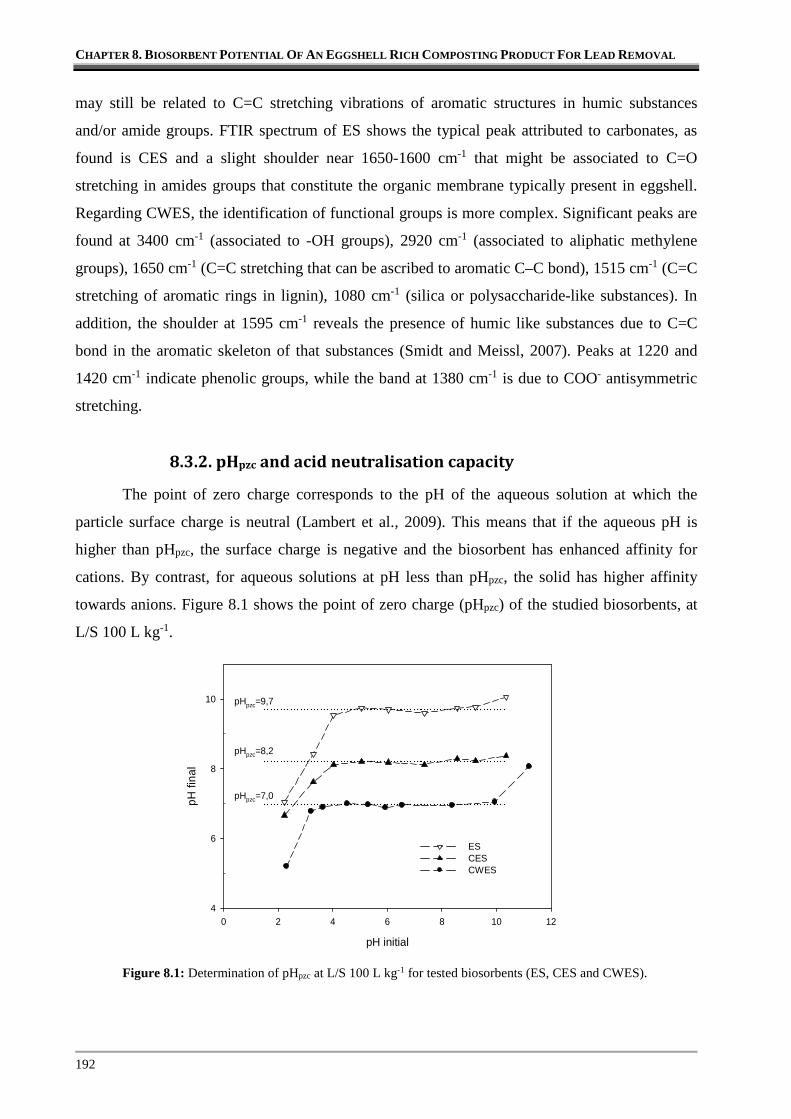
Figure 8.1: Determination of pHpzc at L/S= 100 L kg-1 for tested biosorbents (ES, CES and CWES)………….………………………………………………………………...
192
Figure 8.2: Determination of ANC for tested biosorbents (ES, CES and CWES)…………... 193
Figure 8.3: Kinetic behavior of Pb(II) uptake by CES, ES and CWES (L/S 100 L kg-1, [Pb(II)]initial = 500 mg L-1, 25ºC, pH=5.0)……………………………………...
194
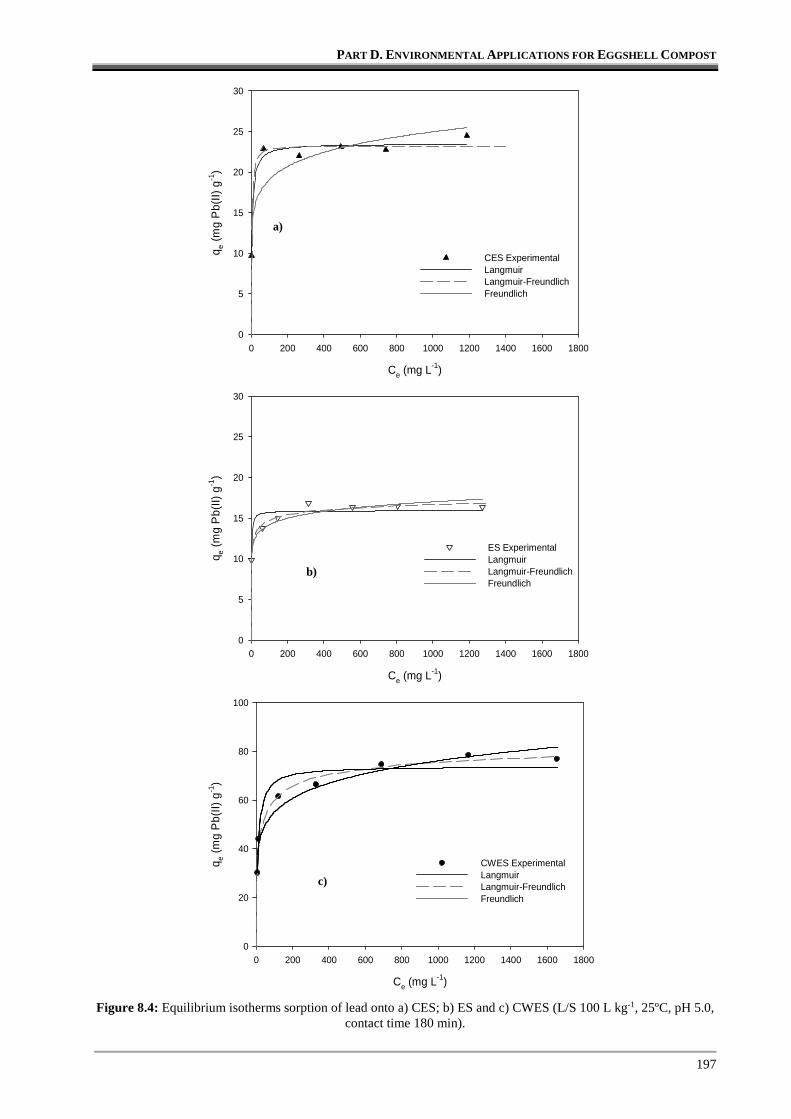
Figure 8.4: Equilibrium isotherms sorption of lead onto a) CES; b) ES and c) CWES (L/S 100 L kg-1, 25ºC, pH 5.0, contact time 180 min).………………………………...
197
Figure 8.5: Effect of initial pH on equilibrium pH (initial concentration 500 mg Pb(II) L-1, L/S 100 L kg-1, contact time 180 min, 25ºC)…...………………………………...
200
Figure 8.6: Effect of initial pH on lead removal (initial concentration 500 mg Pb(II) L-1, L/S 100 L kg-1, contact time 180 min, 25ºC)…...………………………………...
201
Figure 8.7: Influence of initial concentration of Pb(II) on a) metal removal and b) uptake from aqueous solution (L/S 100 L kg-1, 25ºC, pH 5.0, contact time 180 min)…..
202
Figure S8.1: Percentage of Pb(OH)2 for different Pb(II) concentrations, considering an aqueous solution prepared by dissolving lead nitrate salt (simulations from Visual Minteq v3.0)….…………………………………………………………...
207
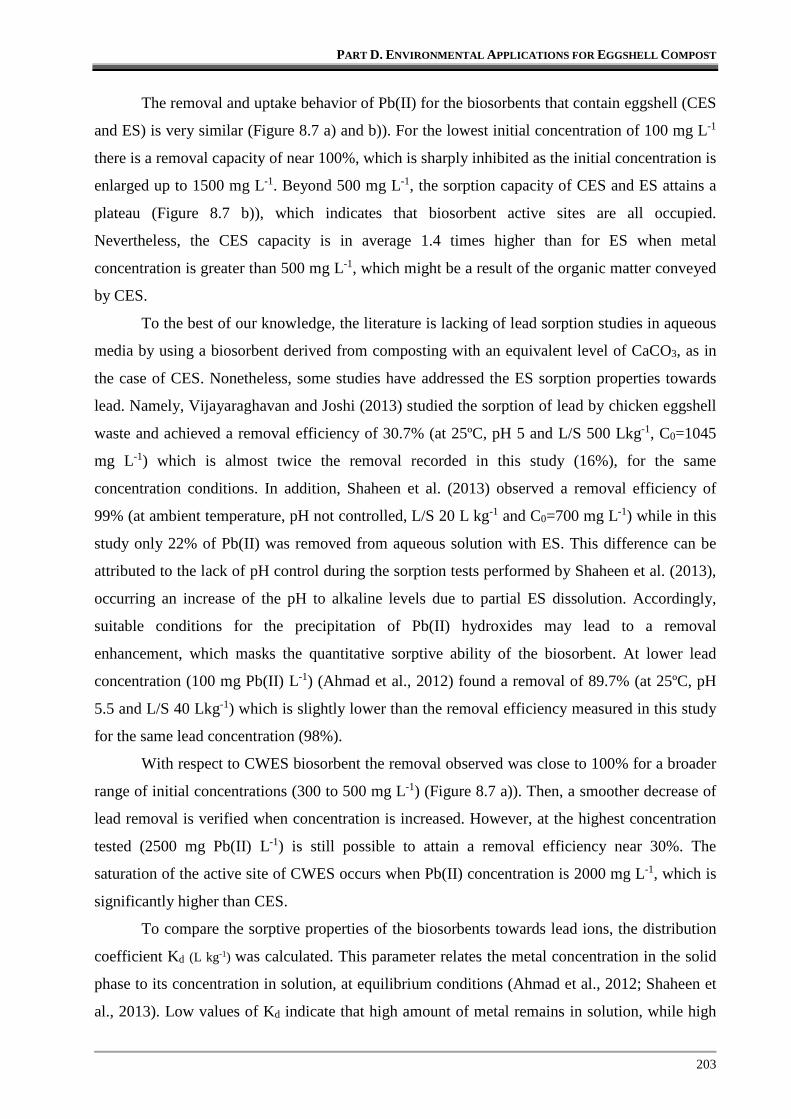
Figure S8.2: FTIR spectra of the tested biosorbents: a) CES and ES, b) CWES……………. 208
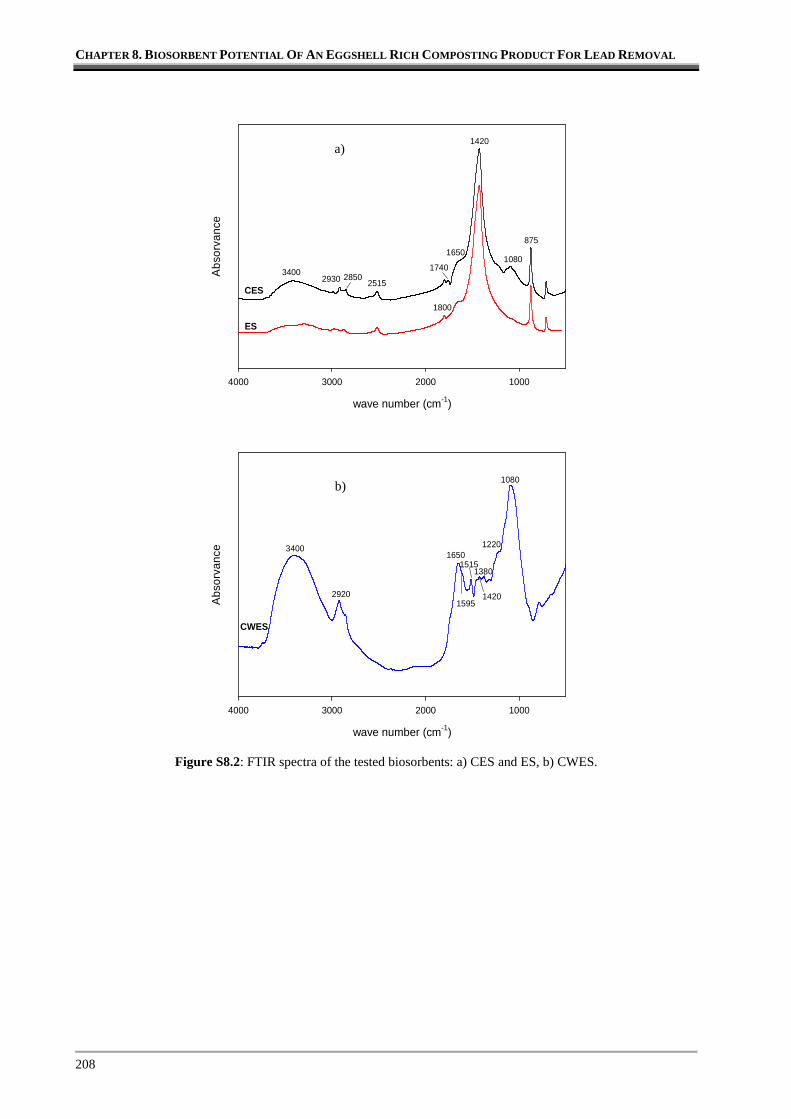
Figure S8.3: EDX spectra and elemental composition of CES surface: a) before, b) after sorption…………………………………………………………………………...
209
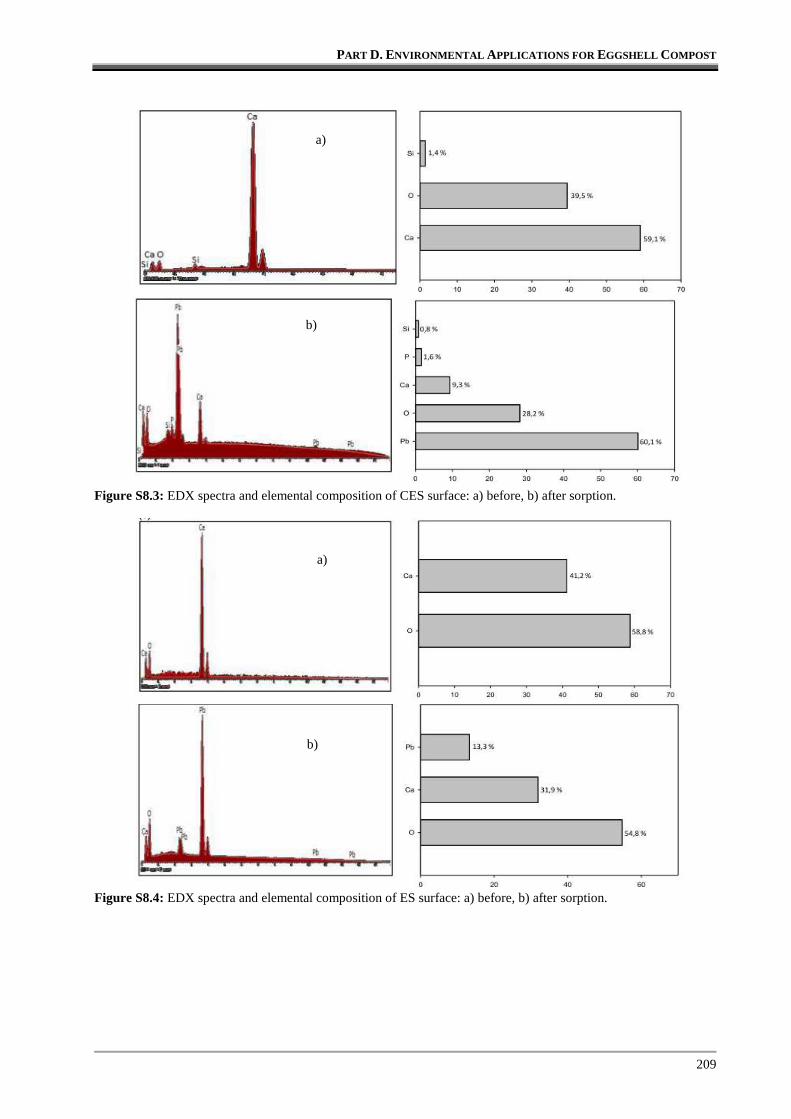
Figure S8.4: EDX spectra and elemental composition of ES surface: a) before, b) after sorption…………………………………………………………………………...
209
Figure S8.5: EDX spectra and elemental composition of CWES surface: a) before, b) after sorption…………………………………………………………………………...
210
Figure 9.1: Soil pH at the end of 94 days of incubation after treatment with CWES, CES and ES…..………………………………………………………………………...
219
Figure 9.2: Influence of amendments on heavy metal availability (Pb and Zn) in soil, after 94 days of incubation (mean±standard deviation): a) mobile fraction; b)
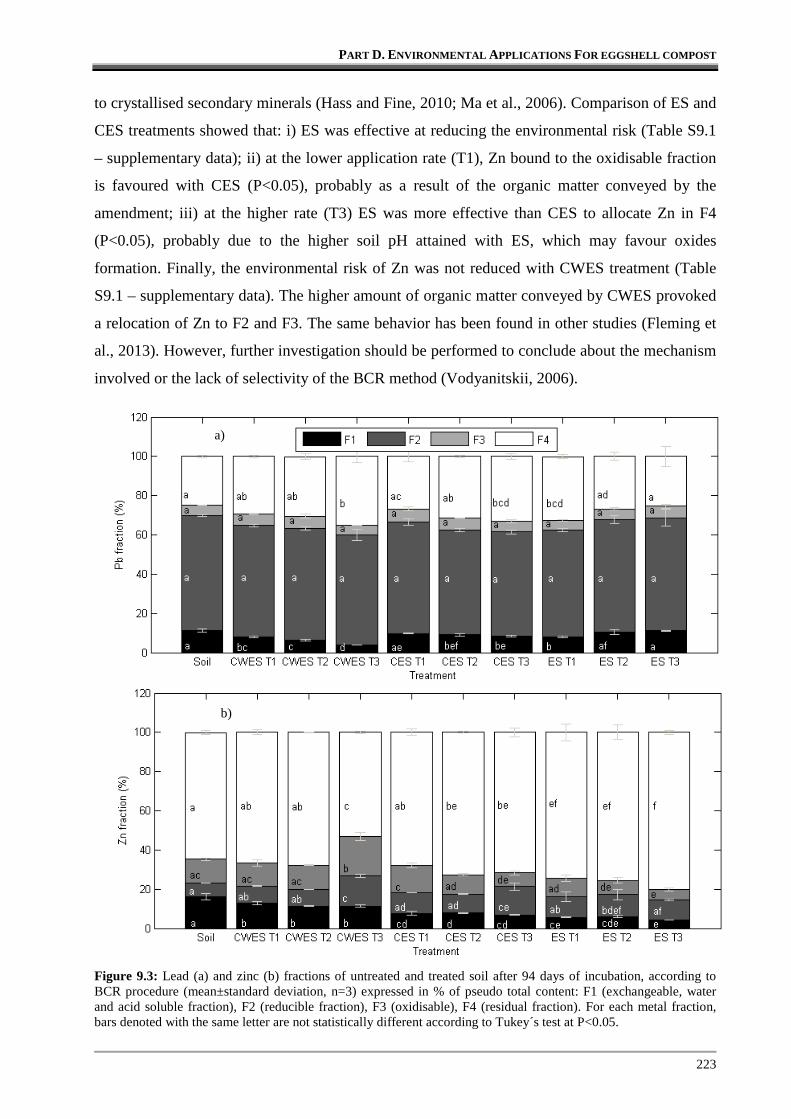
Figure 9.3: Lead (a) and zinc (b) fractions of untreated and treated soil after 94 days of incubation, according to BCR procedure (mean±standard deviation, n=3) expressed in % of pseudo total content: F1 (exchangeable, water and acid soluble fraction), F2 (reducible fraction), F3 (oxidisable), F4 (residual fraction)..
223
Figure 9.4: (a) Total CO2 release at the end of incubation; (b) Cumulative CO2-C release during incubation tests of soil treated with CES_T3 and ES_T3………………...
226
Figure S9.1: Soil characteristics after 94 days of incubation, with tested amendments: electrical conductivity…………………………………………………………….
231
xiii
LIST OF TABLES
Table 1.1: Estimated annual ES production by the hen egg processing industry, in 2011, for some countries……..………………………………………………………..
7
Table 1.2: Summary of eggshell application as operating supply for sorption purposes….. 15
Table 1.2: Alternative methods applicable to eggshell product-specific waste, according to EU regulations…..…………………………………………………………...
20
Table 2.1: Pathogenic microorganisms isolated from soils urban wastes and sewage sludge and diseases induced to humans and animals…………………………...
35
Table 2.2: Pathogen destruction by thermal inactivation in sewage sludge: Temperature and time relations……………………………………………………………….
35
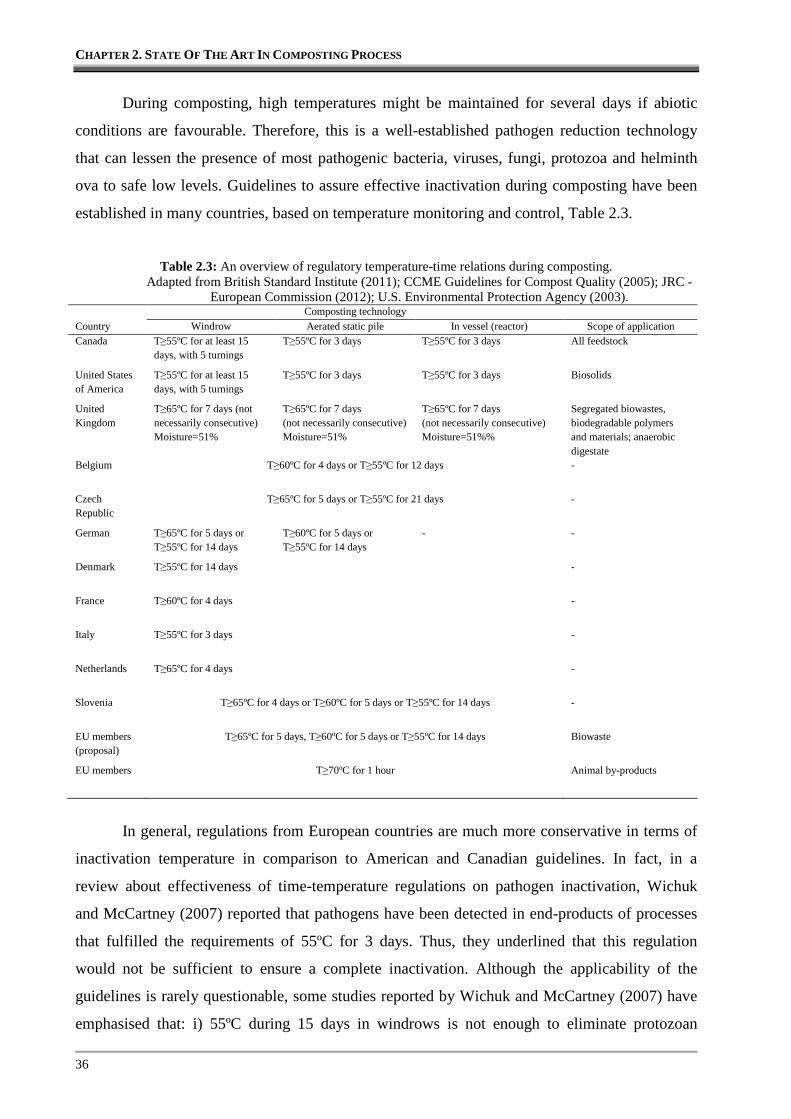
Table 2.3: An overview of regulatory temperature-time relations during composting……. 36
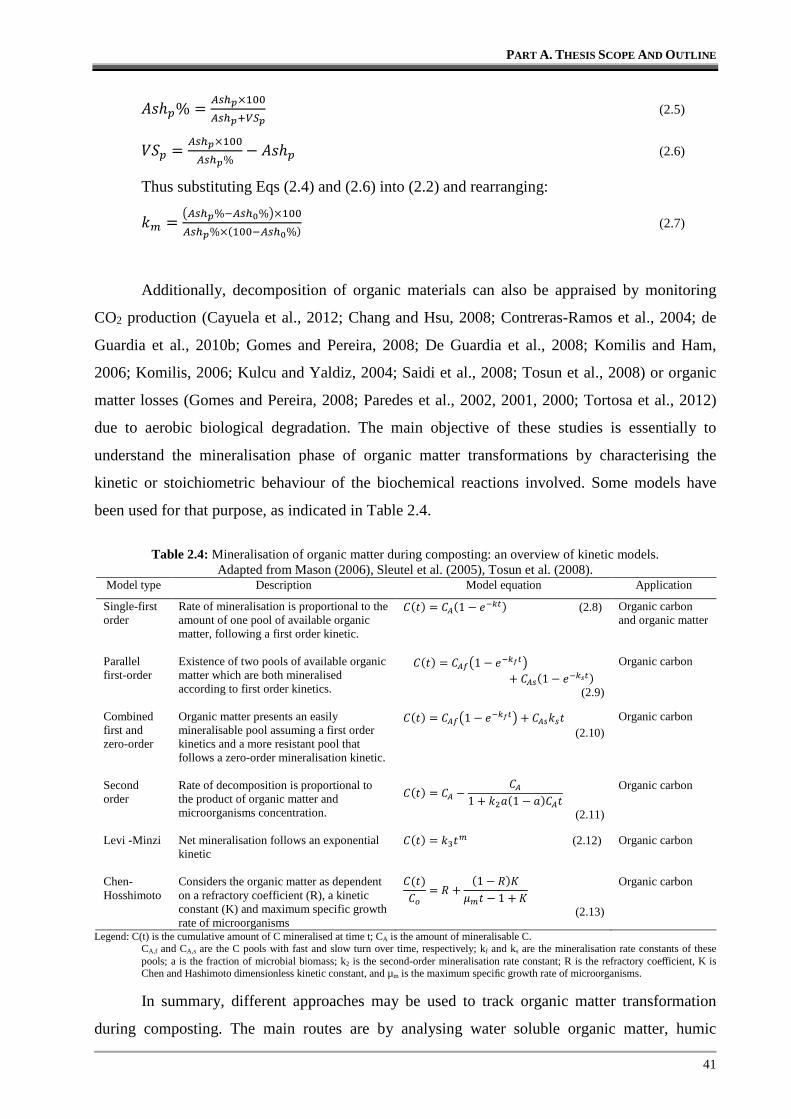
Table 2.4: Mineralisation of organic matter during composting: an overview of kinetic models...………………………………………………………………………...
41
Table 2.5: Overview of theoretical and empirical relationships used for FAS determination…………………………………………………………………...
49
Table 2.6: Brief description of control systems to regulate aeration rate in composting….. 51
Table 2.7: Humification indexes for evaluation of compost maturity degree……………… 55
Table 2.8: Relationship between respirometric tests………………………………………. 55
Table 2.9: European proposed quality criteria for composting end-products……………… 58
Table 3.1: Physical and chemical properties of individual mixture components………….. 80
Table 3.2: Experimental response values of FAS for set A (with RH) and B (with SD) (n=3)……………………………………………………………………………
81
Table 3.3: Model regression statistics for set A (with RH) and B (with SD)……………… 82
Table 3.4: Regression coefficients of the quadratic model for predicting FAS of set A (with RH) and B (with SD)……………………………………………………..
82
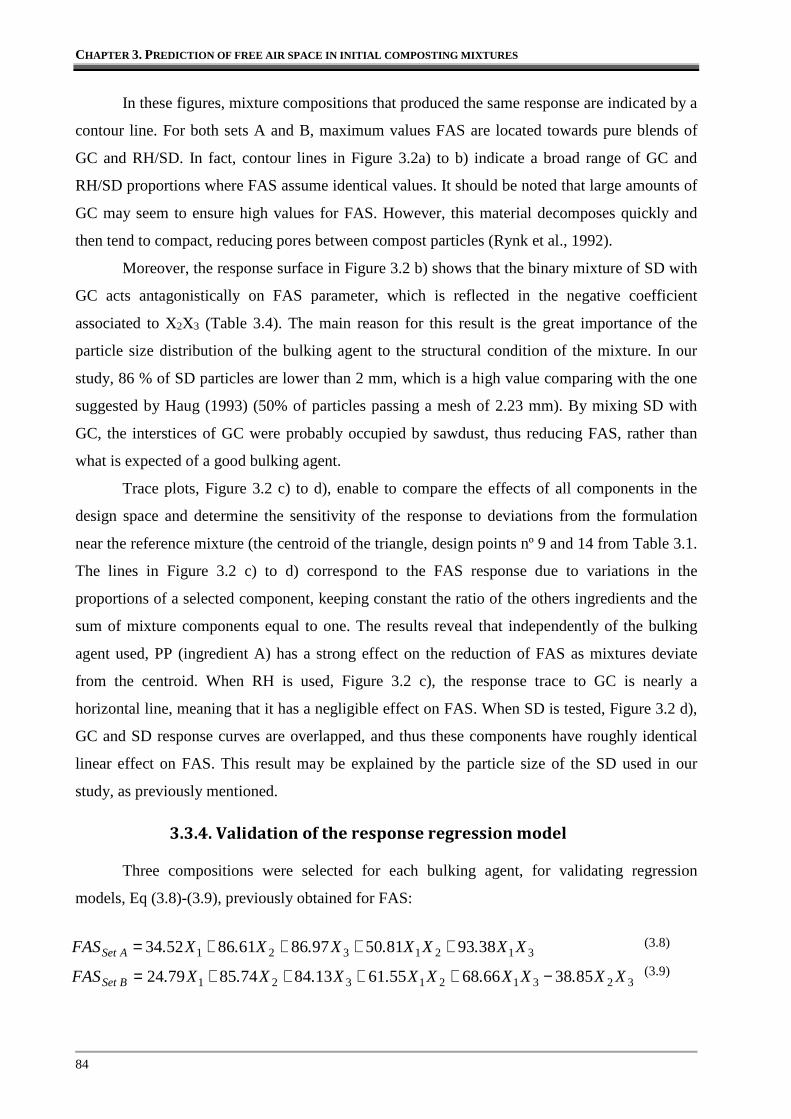
Table 3.5: Experimental conditions tested and validation results…………………………. 86
Table 4.1: Temperature monitoring system: components’ description……………………. 95
Table 4.2: Correspondence between mass of sample withdrawn and initial composting mass…...………………………………………………………………………...
100
Table 4.3: Composting mixture properties and reactor operating conditions……………… 102
Table 4.4: Radial temperature gradients found for the self-heating reactor……………….. 105
Table 4.5: Composting mixture properties and reactor operating conditions……………… 107
Table S4.1: Data used for estimation of CCR losses and biological heat production on a cylindrical self-heating composting reactor…………………………………….
110
Table S4.2: Experimental results of ash conservation for SHR……………………………. 110
xiv
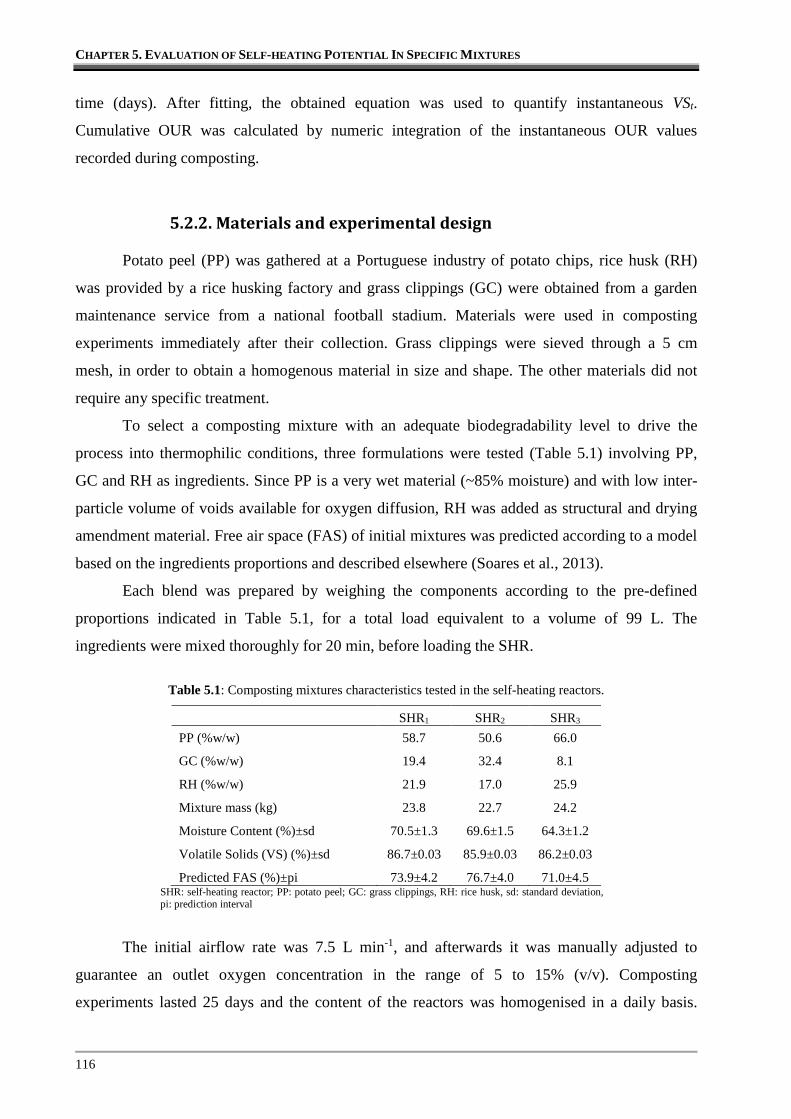
Table 5.1: Composting mixtures characteristics tested in the self-heating reactors……….. 116
Table 6.1: Composition of mixtures and composting experimental conditions……………. 127
Table 6.2: Interpretation of Dewar self-heating test...……………………………………... 129
Table 6.3: Properties of the starting composting mixtures…………………………………. 131
Table 6.4: Influence of GC in thermal parameters of composting trials…………………… 132
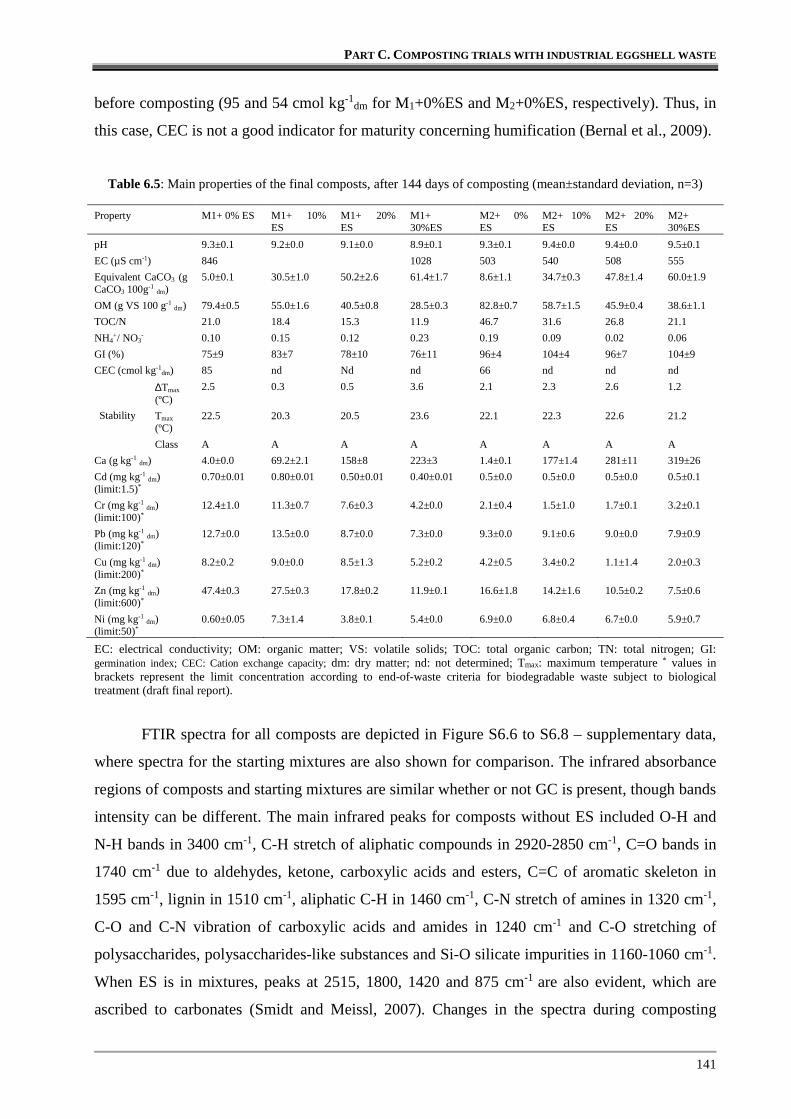
Table 6.5: Main properties of the final composts, after 144 days of composting………….. 141
Table S6.1: General properties of the composting ingredients used for mixtures M1 and M2...……………………………………………………………………………..
146
Table S6.1: Main infrared absorption bands of waste materials and composting end-products….……………………………………………………………………...
147
Table S6.3: Linear relation between cumulative oxygen consumed (y, in g) and cumulative VS degraded (x, in kg) for the first 25 days of composting………..
147
Table S6.4: Intermediate calculations for quantification of ammonification rate and N pool...………………………………………………………………………....
147
Table S6.5: Ratio of peaks 1650/2920 and 1650/2850 for FTIR spectra from M1 and M2 mixtures….……………………………………………………………………...
148
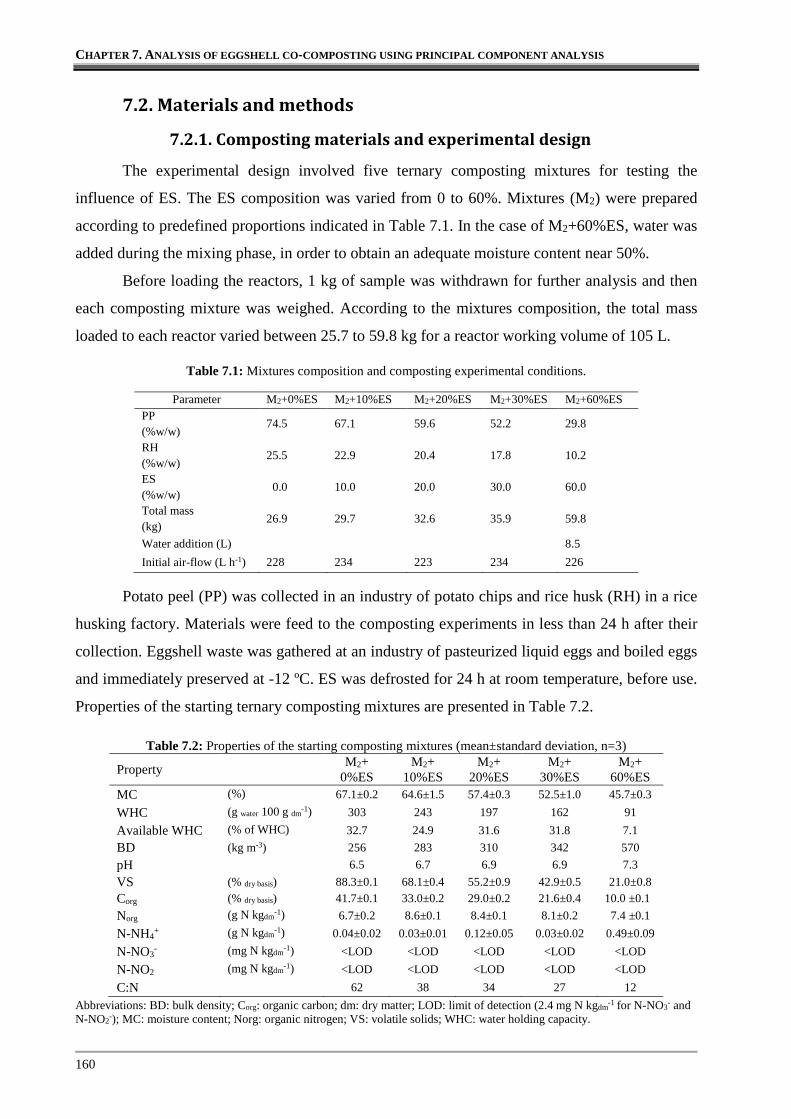
Table 7.1: Mixtures composition and composting experimental conditions………………. 160
Table 7.2: Properties of the starting composting mixtures…………………………………. 160
Table 7.3: Influence of ES percentage in some thermal parameters of composting process. 165
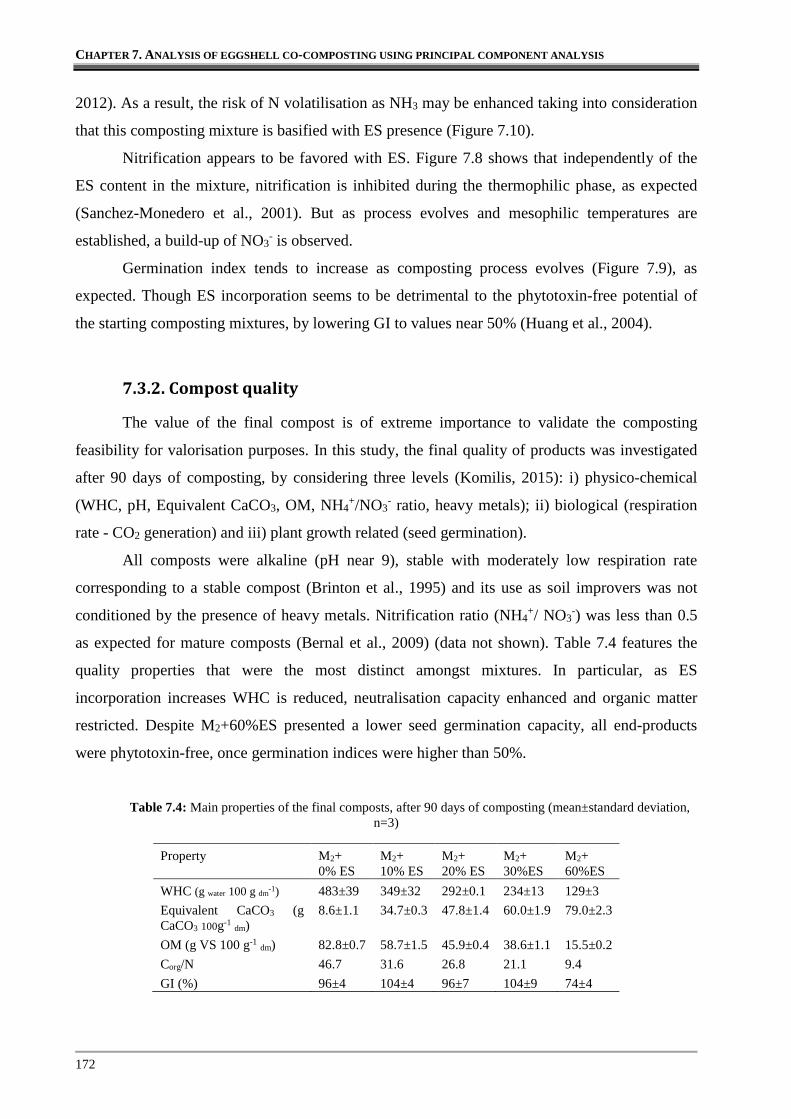
Table 7.4: Main properties of the final composts, after 90 days of composting…………… 172
Table 8.1: Main properties of the biosorbents tested………………………………………. 191
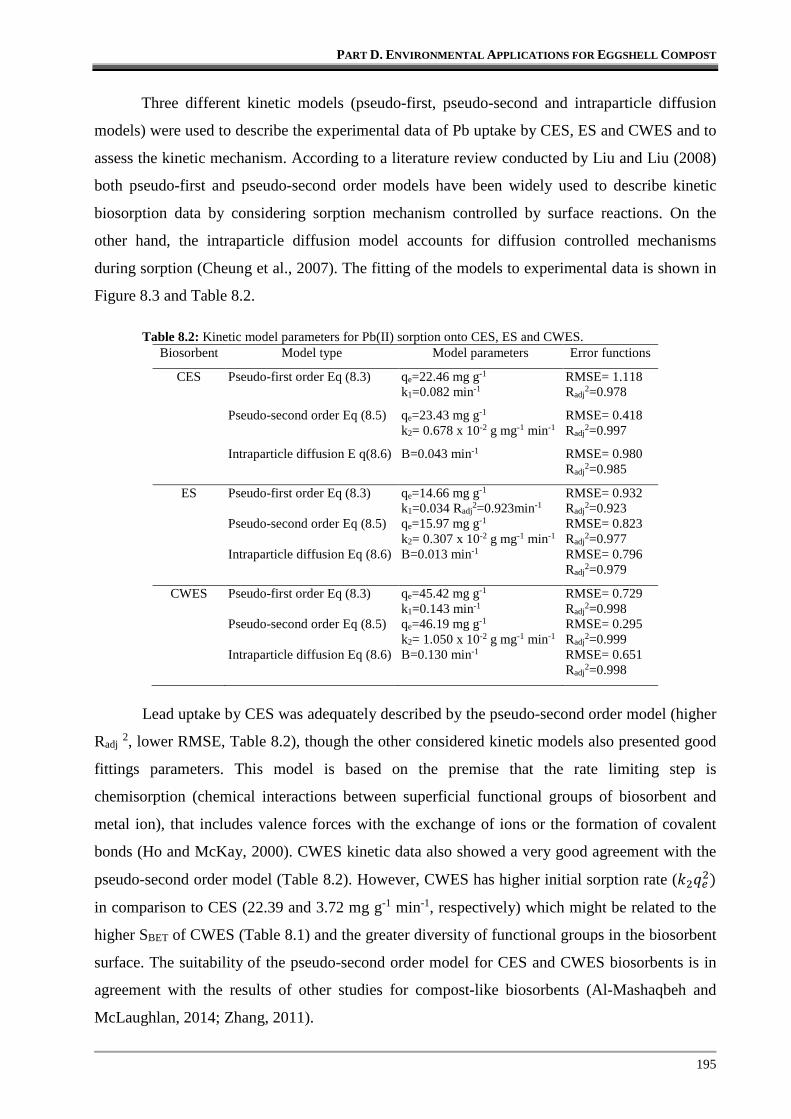
Table 8.2: Kinetic model parameters for Pb(II) sorption onto CES, ES and CWES………. 195
Table 8.3: Parameters of lead sorption isotherm models onto CES, ES and CWES biosorbents……………………………………………………………………...
198
Table 8.4: Sorption capacity of several biosorbents for Pb(II)...…………………………... 199
Table 8.5: Distribution coefficient (L kg-1) for CES, ES and CWES biosorbents to different initial Pb concentrations……….……………………………………...
204
Table 9.1: Main features of BCR three-step sequential extraction method………………... 215
Table 9.2: Main properties of the soil and amendments used in the experiment…………... 218
Table 9.3: Results from bioassays in extracts from untreated and treated soil…………….. 224
Table 9.4: Kinetic parameters of the studied models, half-life time and initial potential emission for each CO2-C pool...………………………………………………...
227
Table S9.1: Environmental risk of lead and zinc according to risk assessment code……… 230
xv
ACRONYMS
ABP Animal by product
ANC Acid neutralisation capacity
B Biodegradable fraction of volatile solids
BD Bulk density
BET Brunauer- Emmett - Teller
BH Biological heat
C:N Carbon to nitrogen ratio
CCR Convective/conductive/radiative heat losses
CEC Cationic exchange capacity
CES Compost derived from eggshell co-composting
CFA Coal fly ashes
CWES Mature compost without eggshell
D Diameter
DEFRA Department for environment food and rural affair
DM Dry matter
DP Particle diameter
EC European comission
EDX Energy dispensive X ray analysis
ES Eggshell
EU European union
FAAS Flame atomic absorption spectrometry
FAO Food and Agriculture Organization of the United Nations
FAS Free air space
FTIR Fourier transform infrared
GC Grass clippings
GI Germination index
L/S Liquid to solid ratio
MC Moisture content
MEDA Multivariate exploratory data analysis
OM Organic matter
OVR Oxygen uptake rate
PCA Principal components analysis
PD Particle density
PP Potato peel
PVC Polyvinyl chloride
PZC poin of zero charge
RAC Risk assessment code
RH Rice husks
RMSE Relative mean square error
RRG Relative root growth
RSG Relative seed growth
SA Surface area
SD Sawdust
SEM Scanning electron microscopy
SHR Self heating reactor
VS Volatile solids
WAC Water absorption capacity
WHC Water holding capacity
xvi
This Page Intentionally Left Blank
1
Part A. Thesis Scope and Outline
The first part of this thesis presents the framework of composting as a valorisation
technology for the management of eggshell, which is the main by-product from the egg
processing industry.
In the first chapter, eggshell production, properties and applications are revised, along
with the legal framework that requires eggshell sanitisation prior to its use. In this scope,
composting process is pointed out as a sound solution to promote eggshell sanitisation, thus
obtaining an eggshell-rich compost with environmental applications. This issue is the motivation
and scope of the doctoral work. The outline of the thesis closes the first chapter.
The second chapter summarises the background work collected along the development of
this study enabling to review the main features associated to the composting process, compost
quality and utilisation.
2
This Page Intentionally Left Blank
PART A. THESIS SCOPE AND OUTLINE
3
1. Introduction The first chapter of this thesis addresses the challenges that the egg1 processing industry
faces towards promoting the adequate management of eggshell, which is a product-specific
waste from egg breaking operations, from an environmental and economical point of view.
In this ambit, possible valorisation options are addressed, taking into consideration the
properties of eggshell waste and the legal constraints associated to its use and/or disposal.
Among these valorisation alternatives, composting is highlighted encompassing the motivation
and scope of this work.
The information presented in this chapter was partially published upon the following publication:
Soares, M.A.R., Quina M.J., Quinta-Ferreira R., 2014. An overview of eggshell waste potential for
sorptive and catalytic processes, presented at CHEMPOR’2014 10-12th September, in Book of Abstracts, Pg 9-49 to
9-51, Porto, Portugal (oral communication).
1 Eggs from other birds (geese, ducks, plovers, sea- gulls, quails) are of lesser significance in egg market, therefore the term “egg”, without a prefix is related to chicken eggs and is so considered in this thesis.
CHAPTER 1. INTRODUCTION
4
1.1. The egg processing sector and eggshell production
Hen eggs constitute one of the most important food resources in the framework of world-
wide feeding. They are an important source of essential nutrients to human diet providing
proteins, fat-soluble vitamins (A, D, E and K) and trace-minerals like iron and zinc (Pirvutoiu
and Popescu, 2012; Roberts et al., 2005). According to FAO (2012), in 2009 global consumption
of eggs rose to 8.9 kg/capita/year (167 eggs2 consumed per person on an annual basis) which
corresponds to an increase of 41% in comparison to the consumption registered in 1990. As a
result of such rise, the egg sector has rapidly expanded, and nowadays the worldwide egg
production reaches 6.5 ×10⁷ ton/year, representing 185% of the egg produced in 1990 (FAO,
2012).
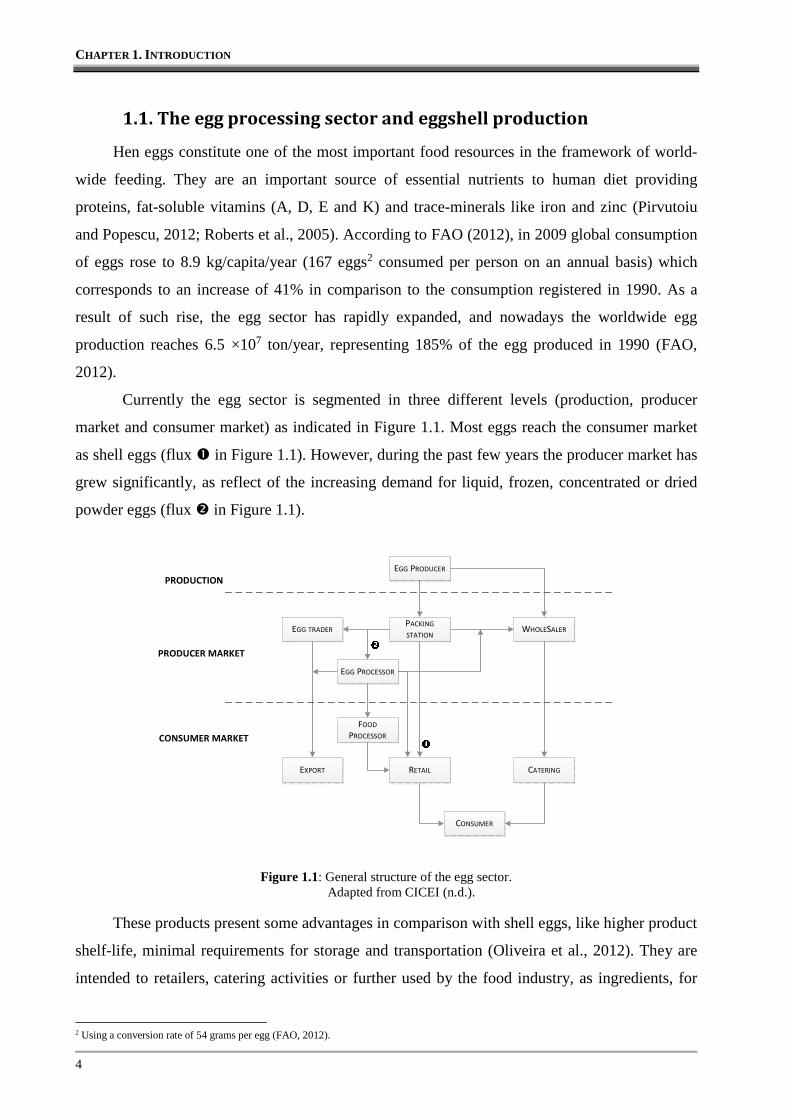
Currently the egg sector is segmented in three different levels (production, producer
market and consumer market) as indicated in Figure 1.1. Most eggs reach the consumer market
as shell eggs (flux � in Figure 1.1). However, during the past few years the producer market has
grew significantly, as reflect of the increasing demand for liquid, frozen, concentrated or dried
powder eggs (flux � in Figure 1.1).
Figure 1.1: General structure of the egg sector. Adapted from CICEI (n.d.).
These products present some advantages in comparison with shell eggs, like higher product
shelf-life, minimal requirements for storage and transportation (Oliveira et al., 2012). They are
intended to retailers, catering activities or further used by the food industry, as ingredients, for
2 Using a conversion rate of 54 grams per egg (FAO, 2012).
EGG PRODUCER
EGG TRADERPACKING
STATIONWHOLESALER
EGG PROCESSOR
FOOD
PROCESSOR
RETAILEXPORT CATERING
CONSUMER
PRODUCTION
PRODUCER MARKET
CONSUMER MARKET
PART A. THESIS SCOPE AND OUTLINE
5
manufacturing processed products with added value, like cooked eggs, bakery products, egg
mayonnaise, energetic drinks, etc. (Roberts et al., 2005).
The first step of processing consists in receiving carton packages from the distributors
(packing station of Figure 1.1) and storing them in a cool humid atmosphere for preservation
until utilisation. After unpacking, visual inspection is performed to detect leaking broken shells
and eggs of poor interior quality (e.g. developed embryos, etc.). Washing is performed with
detergents and defoaming agents to remove egg solids and adhering foreign material from shell
surface and then washed eggs are rinsed with a sanitising agent (Cotterill and McBee, 1995). Egg
breaking and separation of shell from liquid content is performed by automated machines and
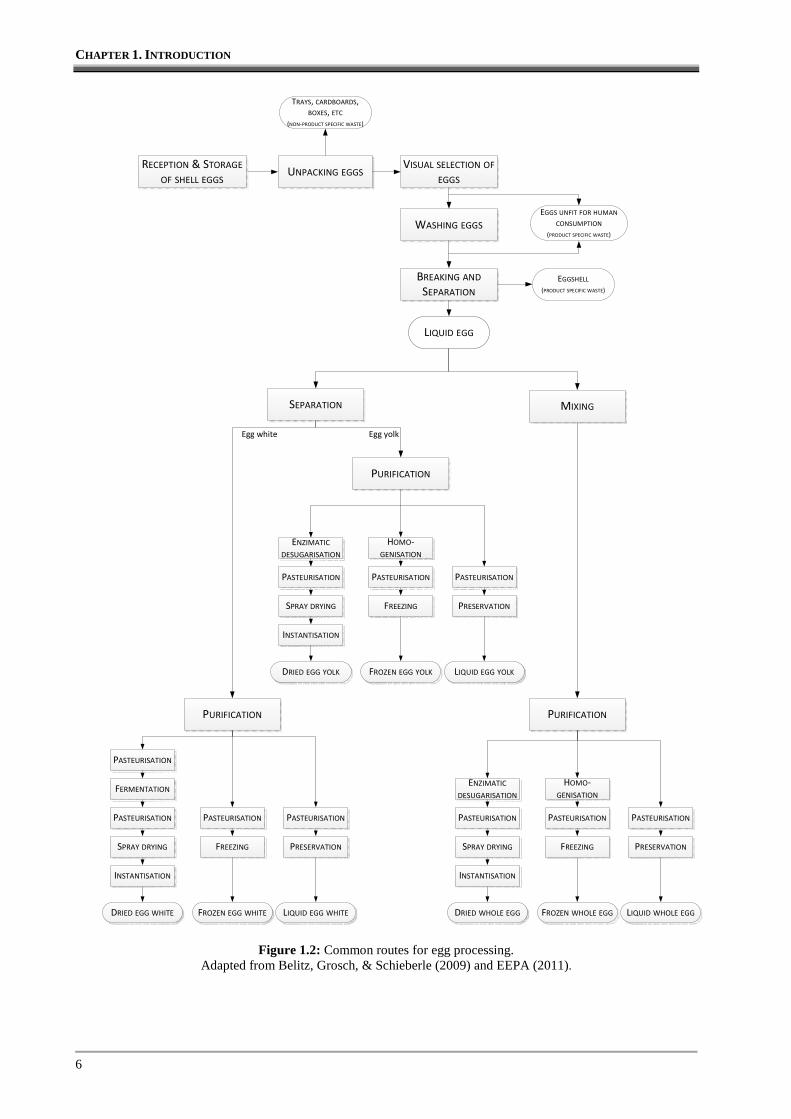
further processing phases of the liquid egg depend on the desired final product, as detailed in
Figure 1.2.
In terms of waste generation in egg breaking operations, eggshell (ES) obtained from
processing the raw material (shell eggs) is identified as the main process by-product, regardless
of the egg product obtained. In the literature, some data are available to quantify the specific
waste index of ES. Russ and Pittroff (2004) for example indicate that ES represents 3 to 12% of
the egg mass product obtained, depending on the egg shell properties (size and shell thickness).
In addition, Jewell et al. (1975) have monitored waste and wastewater production in an
American egg breaking industry during three days, and again concluded that ES may represent
13% of edible egg product output.
Nevertheless, nowadays annual industrial production is estimated because data of ES are
scarce. Table 1.1 presents information about ES production in Canada, China, United States of
America, Portugal and some European Union member states where the largest egg processors are
located, namely France, Germany, Italy and Spain (Agra CEAS Consulting Ltd, 2008). In fact,
significant amounts of eggshell waste are potentially derived from egg breaking industries.
Particularly in Europe, the EU countries considered in Table 1.1 contribute with 34% to the total
value estimated for eggshell production. Portugal is the less expressive contributor due to its
lower egg production capacity.
CHAPTER 1. INTRODUCTION
6
Figure 1.2: Common routes for egg processing. Adapted from Belitz, Grosch, & Schieberle (2009) and EEPA (2011).
UNPACKING EGGSVISUAL SELECTION OF
EGGS
WASHING EGGS
BREAKING AND
SEPARATION
LIQUID EGG
TRAYS, CARDBOARDS,
BOXES, ETC
(NON-PRODUCT SPECIFIC WASTE)
EGGS UNFIT FOR HUMAN
CONSUMPTION
(PRODUCT SPECIFIC WASTE)
EGGSHELL
(PRODUCT SPECIFIC WASTE)
RECEPTION & STORAGE
OF SHELL EGGS
SEPARATION
PURIFICATION
PURIFICATION
PURIFICATION
Egg white Egg yolk
PASTEURISATION
FERMENTATION
PASTEURISATION
SPRAY DRYING
INSTANTISATION
DRIED EGG WHITE
PASTEURISATION PASTEURISATION
FREEZING
FROZEN EGG WHITE
PRESERVATION
LIQUID EGG WHITE
ENZIMATIC
DESUGARISATION
PASTEURISATION
SPRAY DRYING
INSTANTISATION
DRIED EGG YOLK
PASTEURISATION PASTEURISATION
FREEZING
FROZEN EGG YOLK
PRESERVATION
LIQUID EGG YOLK
HOMO-
GENISATION
ENZIMATIC
DESUGARISATION
PASTEURISATION
SPRAY DRYING
INSTANTISATION
DRIED WHOLE EGG
PASTEURISATION PASTEURISATION
FREEZING
FROZEN WHOLE EGG
PRESERVATION
LIQUID WHOLE EGG
HOMO-
GENISATION
MIXING
PART A. THESIS SCOPE AND OUTLINE
7
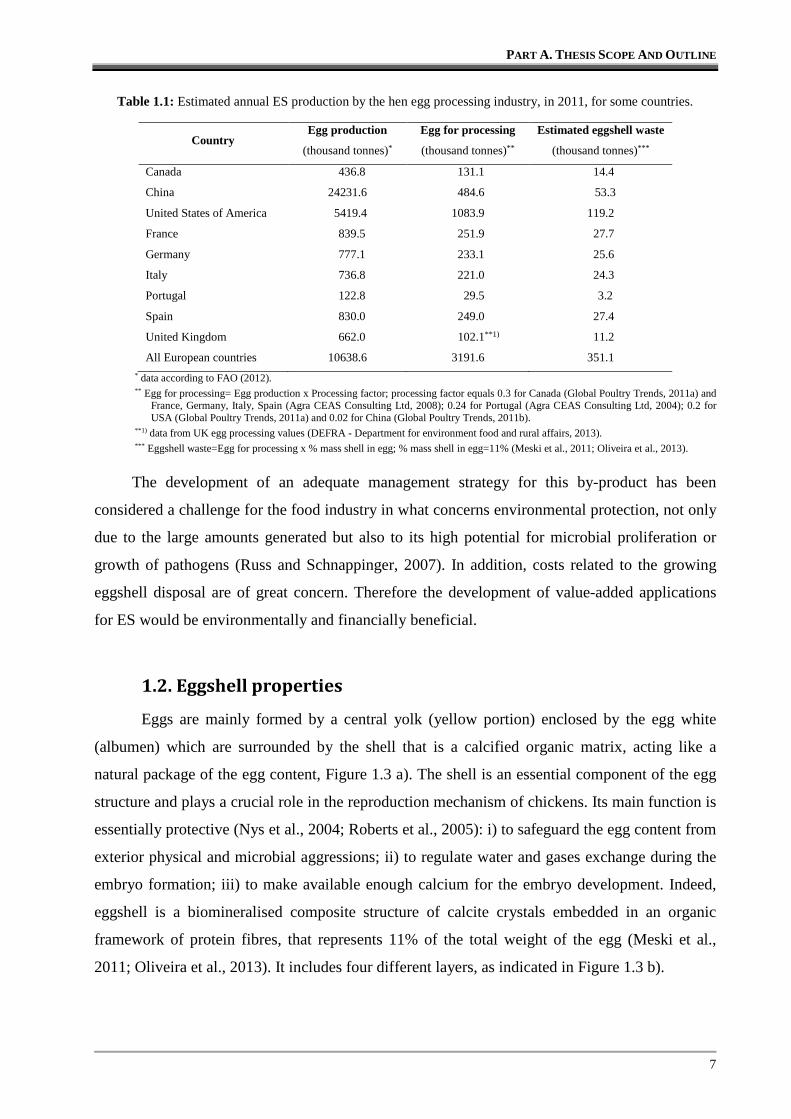
Table 1.1: Estimated annual ES production by the hen egg processing industry, in 2011, for some countries.
Country Egg production
(thousand tonnes)*
Egg for processing
(thousand tonnes)**
Estimated eggshell waste
(thousand tonnes)***
Canada 436.8 131.1 14.4
China 24231.6 484.6 53.3
United States of America 5419.4 1083.9 119.2
France 839.5 251.9 27.7
Germany 777.1 233.1 25.6
Italy 736.8 221.0 24.3
Portugal 122.8 29.5 3.2
Spain 830.0 249.0 27.4
United Kingdom 662.0 102.1**1) 11.2
All European countries 10638.6 3191.6 351.1
* data according to FAO (2012).
** Egg for processing= Egg production x Processing factor; processing factor equals 0.3 for Canada (Global Poultry Trends, 2011a) and France, Germany, Italy, Spain (Agra CEAS Consulting Ltd, 2008); 0.24 for Portugal (Agra CEAS Consulting Ltd, 2004); 0.2 for USA (Global Poultry Trends, 2011a) and 0.02 for China (Global Poultry Trends, 2011b).
**1) data from UK egg processing values (DEFRA - Department for environment food and rural affairs, 2013).
*** Eggshell waste=Egg for processing x % mass shell in egg; % mass shell in egg=11% (Meski et al., 2011; Oliveira et al., 2013).
The development of an adequate management strategy for this by-product has been
considered a challenge for the food industry in what concerns environmental protection, not only
due to the large amounts generated but also to its high potential for microbial proliferation or
growth of pathogens (Russ and Schnappinger, 2007). In addition, costs related to the growing
eggshell disposal are of great concern. Therefore the development of value-added applications
for ES would be environmentally and financially beneficial.
1.2. Eggshell properties
Eggs are mainly formed by a central yolk (yellow portion) enclosed by the egg white
(albumen) which are surrounded by the shell that is a calcified organic matrix, acting like a
natural package of the egg content, Figure 1.3 a). The shell is an essential component of the egg
structure and plays a crucial role in the reproduction mechanism of chickens. Its main function is
essentially protective (Nys et al., 2004; Roberts et al., 2005): i) to safeguard the egg content from
exterior physical and microbial aggressions; ii) to regulate water and gases exchange during the
embryo formation; iii) to make available enough calcium for the embryo development. Indeed,
eggshell is a biomineralised composite structure of calcite crystals embedded in an organic
framework of protein fibres, that represents 11% of the total weight of the egg (Meski et al.,
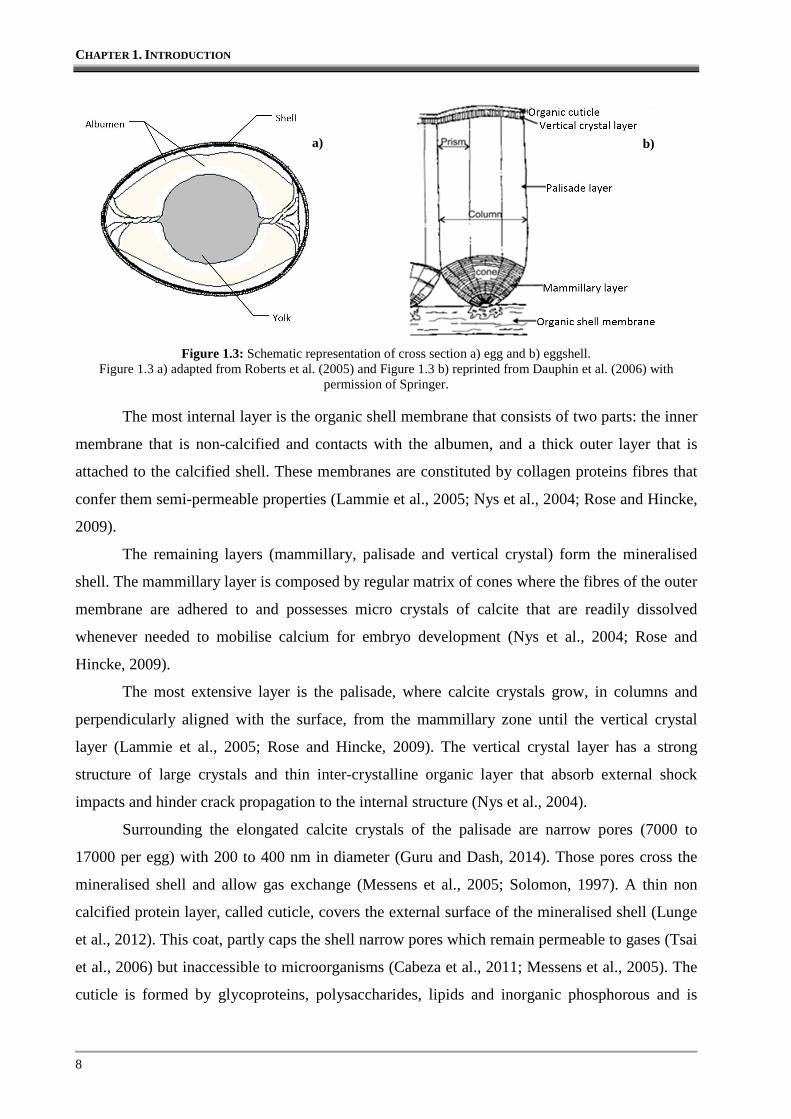
2011; Oliveira et al., 2013). It includes four different layers, as indicated in Figure 1.3 b).
CHAPTER 1. INTRODUCTION
8
Figure 1.3: Schematic representation of cross section a) egg and b) eggshell. Figure 1.3 a) adapted from Roberts et al. (2005) and Figure 1.3 b) reprinted from Dauphin et al. (2006) with
permission of Springer.
The most internal layer is the organic shell membrane that consists of two parts: the inner
membrane that is non-calcified and contacts with the albumen, and a thick outer layer that is
attached to the calcified shell. These membranes are constituted by collagen proteins fibres that
confer them semi-permeable properties (Lammie et al., 2005; Nys et al., 2004; Rose and Hincke,
2009).
The remaining layers (mammillary, palisade and vertical crystal) form the mineralised
shell. The mammillary layer is composed by regular matrix of cones where the fibres of the outer
membrane are adhered to and possesses micro crystals of calcite that are readily dissolved
whenever needed to mobilise calcium for embryo development (Nys et al., 2004; Rose and
Hincke, 2009).
The most extensive layer is the palisade, where calcite crystals grow, in columns and
perpendicularly aligned with the surface, from the mammillary zone until the vertical crystal
layer (Lammie et al., 2005; Rose and Hincke, 2009). The vertical crystal layer has a strong
structure of large crystals and thin inter-crystalline organic layer that absorb external shock
impacts and hinder crack propagation to the internal structure (Nys et al., 2004).
Surrounding the elongated calcite crystals of the palisade are narrow pores (7000 to
17000 per egg) with 200 to 400 nm in diameter (Guru and Dash, 2014). Those pores cross the
mineralised shell and allow gas exchange (Messens et al., 2005; Solomon, 1997). A thin non
calcified protein layer, called cuticle, covers the external surface of the mineralised shell (Lunge
et al., 2012). This coat, partly caps the shell narrow pores which remain permeable to gases (Tsai
et al., 2006) but inaccessible to microorganisms (Cabeza et al., 2011; Messens et al., 2005). The
cuticle is formed by glycoproteins, polysaccharides, lipids and inorganic phosphorous and is
a) b)
PART A. THESIS SCOPE AND OUTLINE
9
important to regulate water exchange mechanism of egg, by repelling or retaining water (Rose
and Hincke, 2009).
Some studies have been dedicated to evaluate the physical and chemical properties of
eggshell, especially in the powder form. Tsai et al. (2006) studied the physical characteristics of
eggshell (ES) and eggshell membranes powders. They concluded that these materials present
macropores or open voids with a total volume of 0.006 cm3 g-1. In addition, BET surface area for
both materials is in the range of 1.0±0.3 to 1.3±0.4 m2 g-1. Likewise, Gao and Xu (2012) and
Ehrampoush et al (2011) reported BET surface area of 0.84 and 1.2 m2 g-1, respectively, for
natural eggshell.
In terms of chemical composition, X-ray diffraction patterns of ES show diffraction peaks
characteristic of calcite that represents the only crystalline species detected (Freire and Holanda,
2006; Park et al., 2007; Rivera et al., 1999; Witoon, 2011). Actually, mineralised shell presents
about 92 to 96% of CaCO3 (Hincke et al., 2010; Lunge et al., 2012; Ok et al., 2011; Tsai et al.,
2008). Minor quantities of P2O5, Na2O, SrO, SiO2, MgO, Cl, Al2O3, Fe2O and NiO have been
reported by Freire and Holanda (2006) amounting to 1.5% of eggshell composition. In addition,
Fourier transform infrared (FTIR) spectra of ES also confirms the presence of CaCO3, showing
significant bands at 1450-1500 cm-1, corresponding to carbonate (C=O) asymmetric stretching
vibration, 870 cm-1 and 710 cm-1 (Ahmad et al., 2012b; Tsai et al., 2006; Witoon, 2011). On the
other hand, amides and amines in the eggshell membrane, that contains positively charged
functional groups (-NH3+ and –CO-N+H2-) are reported by Tsai et al. (2006), due to significant
peaks of spectra at 3200-3500 cm-1, 1651 cm-1, 1538 cm-1 and 1384 cm-1. In fact, according to
(Baláž, 2014) the eggshell membrane contains more than 62 proteins.
Organic matter content of ES is stated to fluctuate between 2% (Hincke et al., 2010) and
4-5% (Freire and Holanda, 2006; Tsai et al., 2006) and its main constituents are proteins,
glycoproteins and proteoglycans (Cordeiro and Hincke, 2011).
1.3. Potential valorisation options for eggshell
Aiming to promote eggshell valorisation taking into consideration its characteristics,
some technological options have been explored to obtain added-value products from ES that can
be grouped in two main categories (Figure 1.4): raw materials for new products manufacture and
operating supplies for sorptive and catalytic applications.
CHAPTER 1. INTRODUCTION
10
Figure 1.4: Classification of potential uses for ES.
1.3.1. Eggshell utilisation as raw material
The utilisation of ES as raw material is a valorisation option, applicable to food product
specific wastes, which make use of the bulk properties of the residues (Kosseva, 2009;
Laufenberg et al., 2003). For the egg processing industry, options for ES utilisation as raw
material include production of food additive, soil fertilizer, purified calcium carbonate, cosmetic
products and biomaterial composites as detailed in Figure 1.4.
Food additive for human feed
Eggshell contains high levels of calcium (about 39% w/w) and low levels of toxic
elements like Pb, Al, Cd, and Hg and thus can be used in humans, as a dietary supplement. In
fact, Schaafsma and co-workers (2000) reported that chicken eggshells present a large store of
waste calcium that can be tailored to suppress human needs for this nutrient, especially in the
cases of osteoporosis. However, calcium in the carbonate form is less bioavailable than in other
forms like citrate (Hanzlik et al., 2005; Nicar and Pak, 1985). Calcium citrate obtained from ES
requires a detailed chemical process that involves sequential steps of centrifugation, reaction
Eggshell
Raw material
Cosmetics
Food additive
Soil fertilizer
Biomaterial
composites
Catalysts
Sorbent
Biodiesel production
Lactose
isomerisation
Dimethyl-carbonate
synthesis
Soil heavy metal
immobilisation
Water and
wastewater
pollutant removal
CO2 capture
Purified CaCO3
Operating
supply
PART A. THESIS SCOPE AND OUTLINE
11
with citric acid, filtration, washing with ethanol and drying. The overall yield of the process is
about 64%, mainly due to the low reaction conversion of CaCO3 to calcium citrate (67%)
(Oliveira et al., 2013) .
The eggshell membrane obtained from the calcium citrate production process can be used
as dietary ingredient, since it contains glycosaminoglycans and proteins (important to preserve
healthy joints and connective tissues). Protein hydrolysates can be also obtained from eggshell
membrane to be further used as food supplement (Oliveira et al., 2013). Toxicological tests
performed to eggshell membrane suggested that it can be used for human consumption at levels
up to 500 mg per day (Ruff et al., 2012).
Food additive for animal feed
ES powder has been employed as a calcium source for laying hens (Cordeiro and Hincke,
2011; Khadka and Subba, 2010). Improved egg production and feed utilisation were obtained in
comparison to ground lime (Sim et al., 1983). In fact, ES has been accepted by the Association
of American Feed Control Officials as a feed additive for both companion and livestock animals
(Ruff et al., 2012).
Eggshell transformation in powder requires drying at 80ºC for moisture removal and
microbial inactivation followed by crushing and milling (Rivera, 1999). This is a simple process
with minimal losses (about 1%) (Oliveira et al., 2013) and the powder obtained contains the
whole eggshell matrix (calcium and proteins from the membrane).
Soil fertilizer
Soil nutrient availability is dependent on soil solution pH. In particular, when soils acidity
is high (pH<4.5), calcium levels are low and its bioaccessibility is impaired, affecting the normal
development of plants (de Varennes, 2003).
Eggshell properties are reported as being potentially acceptable for suppressing soil needs
in terms of calcium (Cordeiro and Hincke, 2011; Elwakeel and Yousif, 2010; Tsai et al., 2008;
Yoo et al., 2009) due to the high concentrations of CaCO3. Additionally, its carbonate content
favours acidic soils pH adjustment (usually called “liming” that consists in applying alkalizing
products to raise soil pH). According to Oliveira et al. (2012) ES preparation to soil
incorporation follows the procedure previously presented for ES utilisation in animal feed
additives. Nevertheless, to the author’s best knowledge, studies available in the literature
focusing on understanding the effect of eggshell application on acid soil calcium availability for
plants are scarce.
CHAPTER 1. INTRODUCTION
12
Purified CaCO3
Pure calcium carbonate has many applications in industrial activities. For example, it may
be used in the construction sector, as a building material and as an ingredient of cement and
mortar3. In paper industry, it is also utilised as filler to give brightness and smoothness to paper.
Other possibility is as raw material in glass. Application for paints and dyes manufacture has
also been reported (Kirboga and Öner, 2013).
To obtain purified CaCO3 (free of organic matrix) from ES, the most efficient method
involves a calcination step at 900ºC, to promote organic matter thermal oxidation and carbonate
conversion to oxide (Oliveira et al., 2013). Then, water addition in a CO2 rich environment
promotes CaO carbonation and a CaCO3 rich suspension is obtained, which is further centrifuged
for water removal and drying. The overall efficiency of this process rounds 80%. This
valorisation strategy neglects the potential value of one of the components of eggshell, which is
the shell membrane.
A study performed by Yoo et al. (2009) evaluated the utilisation of calcium carbonate
from eggshells as a coating pigment for ink-jet printing paper, with additional recovery of shell
membrane. A dissolved air flotation (DAF) separation unit was developed. An air/water mixture
was introduced at the bottom of the separation vessel and shell membrane was separated from
eggshell due to density difference between the two components: membrane floated up and shell
particles settled down at bottom. Process efficiency attained 96% recovery of shell membrane
and 99% of eggshell particles rich in CaCO3. However, a posterior calcination step at 600ºC for
2 h was required to obtain organic free particles, since the cuticle layer of ES was only
successfully removed by thermal oxidation.
In summary, for applications where CaCO3 purity grade is determinant, eggshell should
be submitted to thermal processes for removal of the organic matrix, which increases energy cost
of eggshell valorisation.
Cosmetics
Collagen is a fibrous protein that plays a relevant role in supporting tissue and structuring
proteins and cells, therefore is one of the ingredients of many cosmetics that prevent skin
wrinkles and improve its elasticity and thickness (Cordeiro and Hincke, 2011).
Eggshell membrane is rich in collagen protein fibers, so it can be used as a source of
collagen to enhance the efficiency of cosmetic products. Furthermore, some studies have
reported that collagen obtained from ES is safe to use, since it presents low autoimmune and
3 paste used to bind construction blocks together and fill the gaps between them.
PART A. THESIS SCOPE AND OUTLINE
13
allergic reactions in comparison with collagen extracted from other sources (Zhao and Chi,
2009).
Separation methods of membrane from shell may include dissolution of the membrane
with consequent solubilisation of collagen in acids, bases, salts, by enzymatic digestion (e.g
pepsine digestion) or by fermentation with bacteria, yeast or mold (Vladimir Vlad, 2007; Zhao
and Chi, 2009). Additionally systems that apply cavitation (Vlad, 2009) or dissolved air flotation
(Yoo et al., 2009) are also referred to thereby separate membrane from shell.
Moreover, shell particles are also indicated as good facial cleansers for skin sebum and
dust removal (Cordeiro and Hincke, 2011).
Biomaterials composites
Hydroxyapatite Ca10(PO4)6(OH)2 is a material with a chemical structure similar to the
mineral components found in bones and teeth. It offers an exceptional compatibility with
biological systems, especially human soft tissues and therefore can be used in orthopaedic and
dental implants. Application of hydroxyapatite may be performed in powder, porous block or
composite materials to correct bone or dental deficiencies (Gergely et al., 2010; Rivera et al.,
1999).
Synthesis reaction of hydroxyapatite may be described by Eq. (1.1) or (1.2) depending on
Amongst raw materials used to provide CaO or Ca(OH)2 for the reaction, eggshells have
been highlighted (Gergely et al., 2010; Kumar et al., 2012; Prabakaran and Rajeswari, 2009;
Rivera et al., 1999; Zhou and Lee, 2011). A prior calcination step at 900ºC for at least 3 h is
required to remove the organic matrix of ES and to convert CaCO3 into CaO. When phosphoric
acid is used (Eq. 1.2) an additional step is required to endorse CaO hydration (Oliveira et al.,
2013).
1.3.2. Eggshell utilisation as operating supplies
Some environmental and chemical applications have been studied for using ES as
operating supply. Efforts in utilising ES as catalyst or sorbent are reported in the literature with
twofold purposes: to promote valorisation of ES (reducing its environmental impacts) and to
decrease operational costs by using low-cost supplies.
CHAPTER 1. INTRODUCTION
14
As previously presented in Figure 1.4, ES utilisation as operating supply encompasses
use as catalyst in biodiesel production, lactose isomerisation or dimethyl carbonate synthesis and
as sorbent for pollutant removal or immobilisation in liquid, soil or gaseous emissions.
Eggshell potential for catalysis is mainly allied to base-catalysed reactions. One of the
main active phase of this catalyst is the CaO obtained from ES calcination, which has proved
activity towards transesterification reactions that occur in biodiesel production (Boey et al.,
2011; Boro et al., 2012; Sharma et al., 2011; Wei et al., 2009) or dimethyl carbonate synthesis
(Gao and Xu, 2012). In lactose isomerisation, calcium carbonate from ES has also been indicated
as a good catalyst in the conversion of lactose in lactulose (Montilla et al., 2005; Paseephol et al.,
2008) with the advantage of not requiring significant pre-treatment (only washing and drying) to
present potential value as catalytic agent.
Eggshell is mainly composed by calcium carbonate, thus it is expected to behave as a
calcite-like sorbent (Guru and Dash, 2014). The presence of proteins in its porous structure
endows ES with additional sorptive capacities, reason why some research has been focusing on
using ES for organic and inorganic pollutants removal from water, wastewater, soils or gas
effluents.
Table 1.2 lists environmental applications of ES as operating supply for sorptive
purposes, giving special focus to the pre-treatment required for application as sorbent.
Furthermore, sorption capacities are reported for each specific pollutant.
For water treatment, ES usage as sorbent has been mainly related to fluoride and
phosphate removal. In this case, ES is pre-treated (calcination and/or additive incorporation) to
enhance selectivity and sorption capacity towards the pollutant. Fluoride sorption by ES-based
sorbent is well described by the Langmuir isotherm model (Bhaumik et al., 2012; Lunge et al.,
2012), while for phosphate uptake, Freundlich (Köse and Kıvanç, 2011) or Langmuir-Freundlich
(Mezenner and Bensmaili, 2009) models are more adequate. Chemisorption is indicated as the
main sorption mechanism (Bhaumik et al., 2012; Mezenner and Bensmaili, 2009).
The interest upon the capacity of ES for removal of organic pollutants has been
exclusively associated to dyes from wastewaters of the textile industry. Podstawczyk et al.
(2014) investigated the sorption of malachite green and concluded that physical adsorption and
microprecipitation were the main mechanisms involved. Additionally, equilibrium studies
regarding the dyes listed in Table 1.2 pointed out that experimental data were in good agreement
with Langmuir models. Nevertheless, Freundlich isotherm was also suitable in some cases
(Chowdhury and Das, 2011; Ehrampoush et al., 2011; W. Tsai et al., 2008).
PART A. THESIS SCOPE AND OUTLINE
15
Table 1.2: Summary of eggshell application as operating supply for sorption purposes.
Eggshell pre-treatment
Application Pollutant Water Washing
Membrane manual removal
Drying 50-110ºC
Grounding and sieving
Calcination 800-950ºC
Others Sorption capacity
Reference
Water Fluoride Synthesis of eggshell composite using shell, membrane and aluminum sulphate, by calcination at 450ºC , 6 h
37 mg g-1
(30ºC)
Lunge et al. (2012)
Water Fluoride X X X - 1.1 mg g-1
(30ºC)
Bhaumik et al. (2012)
Water Phosphate X X X X - 23 mg g-1
(25ºC)
Köse and Kıvanç (2011)
Water Phosphate X X X Sorbent previously submitted to iron adsorption
10.6 mg g-1
(25ºC)
Mezenner and Bensmaili (2009)
Wastewater Malachite green (dye)
X X X - 56.8 mg g-1
(30ºC)
Chowdhury and Das (2011)
Wastewater Reactive red 123 (dye)
X X X - 1.26 mg g-1
(25ºC)
Ehrampoush et al. (2011)
Wastewater Brilliant green (dye)
X X X - 44.7 mg g-1
(30ºC)
Kobiraj et al. (2012)
Wastewater Remazol reactive red 198 (dye)
X X X X Immobilization with a polymer mixture of alginate and polyvinyl alcohol to obtain biocomposite sorbent
47 mg g-1
(22ºC)
Elkady et al. (2011)
Wastewater Acid orange 51 (Dye)
X X X X - 114 mg g-1
(25ºC)
Tsai et al. (2008)
Wastewater Reactive yellow 205 (dye)
X X X - 31 mg g-1
(35ºC)
Pramanpol and Nitayapat (2006)
Wastewater Cu (II) X X X Reaction with FeSO4.7H2O and NaOH to obtain iron oxide coated eggshell powder
45 mg g-1
(30ºC)
Ahmad et al. (2010)
Wastewater Radio Co (II)
Convertion to hydroxyapatite by calcination at 900ºC and reaction with PO43- compound
3.6x10⁻⁴ mol g-1
(30ºC)
Zhang et al. (2010)
Wastewater Radio Co (II)
Convertion to magnetite/hydroxyapatite by calcination at 900ºC and in situ precipitation with Fe3O4
6.7x10⁻⁴ mol g-1
(30ºC)
Hongqin et al. (2011)
CHAPTER 1. INTRODUCTION
16
Table 1.2: Summary of eggshell application as operating supply for sorption purposes (continued).
Eggshell pre-treatment
Application Pollutant Water Washing
Membrane manual removal
Drying 50-110ºC
Grounding and sieving
Calcination 800-950ºC
Others Sorption capacity Reference
Wastewater Pb (II), Cu (II)
X X Boiling in 1M NaOH to remove impurities and membrane; reaction with FeCl2.4H2O to obtain Fe3O4 eggshell powder
263 mg g-1 (Pb) 250 mg g-1 (Cu) (25ºC)
Ren et al. (2012)
Wastewater Pb, Zn, Cu, Cd, Ni
X X Separation of liquid fraction
Total metal uptake:3.8x10⁻² mEqg-1 (25ºC)
De Paula et al. (2008)
Wastewater Pb (II) X X X - 154 mg g-1
(25ºC) Vijayaraghavan and Joshi (2013)
Wastewater Pb (II) Reaction of eggshell with H3PO4 to obtain carbonate hydroxyapatite
500 mg g-1
(25ºC) Meski et al. (2011)
Wastewater Pb (II) Reaction with H3PO4 at 30-40ºC for 24 h and pH=1-3, to obtain carbonate hydroxyapatite
94 mg g-1 (25ºC) Liao et al. (2010)
Wastewater Cd (II), Cu (II)
Reaction with H3PO4 at 30-40ºC for 24 h and pH=1-3, to obtain carbonate hydroxyapatite
111 mg g-1 (Cd); 143 mg g-1 (Cu)
Zheng et al. (2007)
Wastewater Cr(III) X X X - 160 mg g-1 (20ºC)
Chojnacka (2005)
Wastewater Pb,Cd, Cr
X X X X - - Park et al. (2007)
Soil Pb X X X X - - (Ahmad et al., 2012a; Ok et al., 2011)
Gaseous effluents
CO2 X X X X - - Castilho et al. (2013); Mohammadi et al. (2014); Olivares-Marín et al. (2012); Witoon (2011)
Within the removal of inorganic pollutants from wastewaters, uptake of heavy metals
have been exclusively appraised by performing tests in simulated aqueous media (Table 1.2). In
that context, ES has been tested as sorbent or precursor of sorbents (carbonate hydroxyapatite or
other composites). Interest in ES as a sorbent is mainly associated to (Guru and Dash, 2014): i)
carbonate groups which have cation-exchange properties and by increasing pH, negative charge
PART A. THESIS SCOPE AND OUTLINE
17
density of the sorbent surface rise, thus prompting the attraction of metallic ions with positive
charge; ii) functional groups of proteins (carboxyl, amine and sulfate) can bind metal ions and
form ionic bonds, iii) ion exchange between metals and the Ca(II) at ES surface. Besides,
aqueous solutions equilibrated with ES become more basic, so that metals can precipitate and
deposit on ES surface. Nonetheless, carbonate hydroxyapatite also presents a high sorption
capacity for heavy metals, low water solubility, high stability and can be synthesised from ES.
These features justify the reason for several studies are addressing the usage of ES as precursor
for sorptive purposes.
In soils remediation, eggshell has been indicated as immobilising agent for heavy metals,
to reduce its solubility and bioavailability (Guru and Dash, 2014). ES incorporation in soil may
enhance soil Pb immobilisation via formation of Pb(OH)2, adsorption on aluminium containing
minerals and co-precipitation in carbonate form (Ahmad et al., 2012a).
ES waste has been also highlighted as a competitive sorbent alternative for CO2 capture,
in comparison to commercial materials. In fact, some investigations showed eggshell derived
CaO is promising for sorption of anthropogenic CO2 capture. Experimental results have
demonstrated that after commercial CaO, the highest CO2 uptake was attained with eggshell
derived CaO (Olivares-Marín et al., 2012). Carbonation conversion of calcined eggshell was
higher than the one observed for calcined commercially available calcium carbonate (Witoon,
2011).
1.4. European legal framework
The European Union (EU) has paid special attention to the disposal and use of animal by-
products that correspond to entire bodies or parts of animals, products of animal origin or other
products obtained from animals that are not intended for human consumption. These by-products
may be a potential source of risks to public and animal health and to avoid any threat of
pathogens and disease dispersion, health rules were laid down by Regulation (EC) Nº 1774/2002
of the European Parliament and of the Council of 3 October 2002 that was more recently
repealed by Regulation (EC) Nº 1069/2009 of the European Parliament and of the Council of 21
October 2009. Implementation methods defined by this Regulation now in force were formerly
concretised by Commission Regulation (EU) Nº142/2011. The level of risk that arises from
animal by-products can fall into three categories from 1 (highest risk) to 3 (lowest risk).
ES is a product-specific waste of egg processing industry that is classified as animal by-
product and falls into the Category 3, and alternatives for disposal/use are established to reduce
spreading risk of pathogens into environment and human health. The different authorised options
CHAPTER 1. INTRODUCTION
18
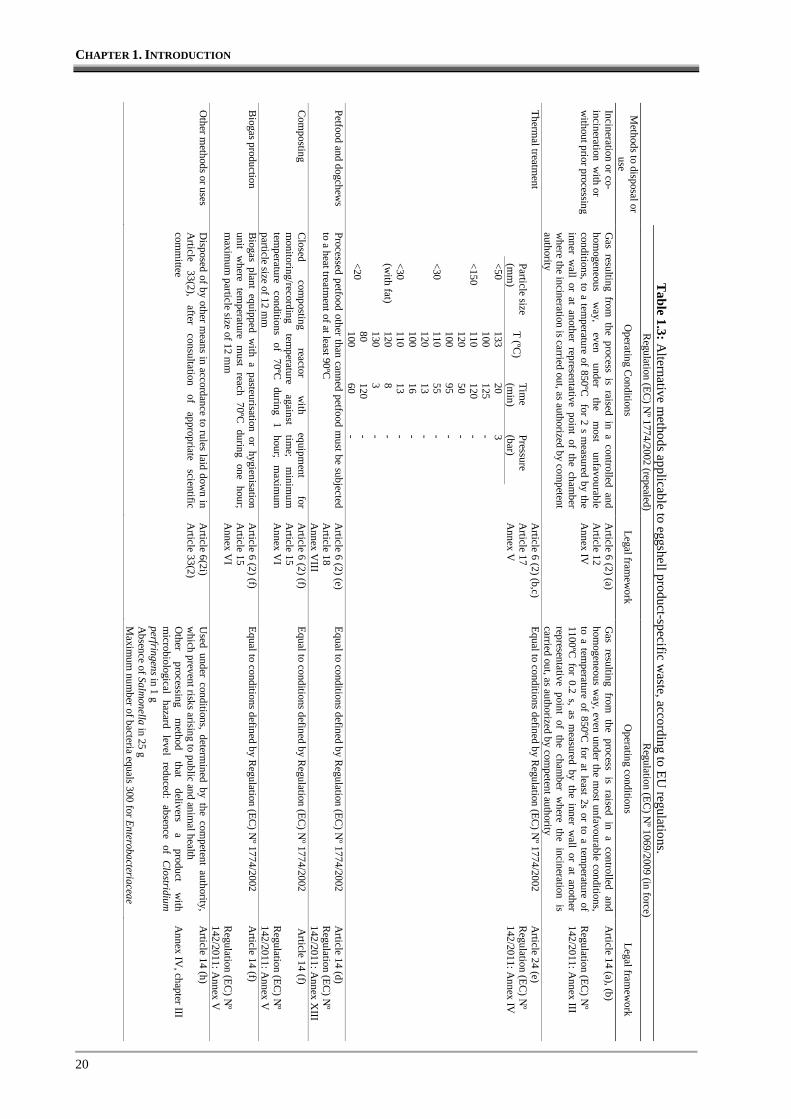
for disposal or use of eggshells are listed in Table 1.3, where a comparison between legislation
repealed and now in force is also presented. Since it is a low-risk material, ES options for use
and disposal are much wider in comparison to higher risk animal by-products and enclose
incineration, thermal processing, production of petfood, composting, transformation into biogas,
fuel combustion (although the calorific value of ES is low) or used/disposed by any other method
that prevents biological hazard. Some operating conditions for these legal options are also
detailed in Table 1.3.
It should be underlined that EU legal restrictions do not make impractical the full scale
implementation of some of the valorisations options detailed in section 1.3. Indeed they became
complementary, since legal constrains make valorisation options of ES more safe in terms of
environmental and public health, for example:
i) Incineration enables ES conversion to CaO for catalytic application in biodiesel
production or dimethyl-carbonate synthesis or for hydroxyapatite manufacture;
ii) Thermal processing allows further application as food additive, soil amendment and/or
operating supply for sorption purposes;
iii) Biological treatment by composting yields a final product for soil amending or
improvement. However, in this process, one must have into consideration that the level of
organic matter available in ES for biodegradation represents a small fraction. Thus,
mixing it with other organic wastes with higher self-heating ability, may be necessary to
achieve the temperature-time requirements imposed.
Since Regulation (EC) Nº 1069/2009 is in force, ES utilisation without any pre-treatment
became possible, under conditions determined by competent authorities, and some EU members
have taken advantage of this measure. In fact, United Kingdom has allowed eggshell waste
application to land, without prior treatment provided that registration and tracking of
microbiological safety is performed (DEFRA - Department for environment food and rural
affairs, 2011). Additionally, this EU member has stated to review this measure frequently and in
case of suspicion or confirmation of an outbreak of relevant disease or infection this permission
may be repealed. In Spain, according to the legal decree 1528/2012, the direct application of ES
to soil as fertilizer or amendment is allowed, whenever there is no doubt of disease transmission
risk to human, animal and environment. Nevertheless, this measure may have a transitory
application if microbiological safety becomes questionable, and in that case other options for
use/disposal must be rightly implemented.
From the list of alternatives available, composting presents itself an attractive pre-
treatment, because it consists in a biological decomposition and stabilisation of organic subtracts,
PART A. THESIS SCOPE AND OUTLINE
19
under aerobic conditions that allow development of thermophilic temperatures as result of
biologically produced heat (Haug, 1993). This process fulfils the temperature-time constraint for
sanitisation of ES, without requiring an external pasteurisation/sanitation unit. This means that
energy costs to sanitise ES could be significantly reduced, by taking advantage of the biological
heat produced during the process.
CHAPTER 1. INTRODUCTION
20
2
0
Table 1.3: A
lterna
tive m
etho
ds a
pp
licab
le to
eggshe
ll pro
duct-sp
ecific w
aste
, acco
rding to
EU
regula
tions.
R
egula
tion (EC
) Nº 1
774/2
002 (rep
ealed)
Regu
lation (E
C) N
º 1069
/2009
(in force)
Meth
ods to disp
osal or
use
Op
eratin
g Con
ditions
Lega
l fram
ew
ork
Op
eratin
g conditions
Lega
l fram
ew
ork
Incin
eration
or co-incin
eration
with
or w
ithou
t prior p
rocessing
Ga
s resultin
g from th
e process is ra
ised in
a controlled
an
d h
omogen
eous
wa
y, even
u
nder
the
most
unfa
vourab
le con
ditions, to a tem
pera
ture of 8
50ºC
for 2 s m
easu
red b
y the
inner w
all or a
t an
other rep
resenta
tive point of th
e cha
mb
er w
here th
e incin
eration
is carried
out, a
s auth
orized b
y comp
etent
auth
ority
Article 6
(2) (a
) A
rticle 12
A
nn
ex IV
Ga
s resu
lting
from
the
process
is ra
ised in
a
controlled
a
nd h
omogen
eous w
ay, e
ven u
nder th
e most un
favou
rable con
ditions,
to a tem
pera
ture of 8
50ºC
for at lea
st 2s or to a temp
eratu
re of 1
100ºC
for 0.2
s, as m
easu
red b
y the inn
er wa
ll or a
t anoth
er rep
resenta
tive p
oint
of th
e cha
mb
er w
here
the
incin
eration
is
carried
out, a
s auth
orized b
y comp
etent au
thority
Article 1
4 (a
), (b)
Regu
lation (E
C) N
º 1
42/20
11: A
nn
ex III
Th
erma
l treatm
ent
P
article size
(mm
) T
(ºC)
Tim
e (m
in)
Pressu
re (b
ar)
<50
133
20
3
<15
0 1
00
110
1
20
125
1
20
50
- - -
<30
100
1
10
120
95
5
5
13
- - -
<30
(w
ith fa
t)
100
1
10
120
1
30
16
1
3
8
3
- - - -
<20
80
1
00 1
20
60
- -
Article 6
(2) (b,c)
Article 1
7
An
nex V
Equ
al to cond
itions defin
ed b
y Regu
lation
(EC
) Nº 17
74/20
02 A
rticle 24
(e) R
egula
tion (EC
) Nº
142
/2011
: An
nex IV
Petfood
and
dogch
ews
Processed
petfood
other th
an
cann
ed p
etfood m
ust b
e subjected
to a h
eat trea
tment of at lea
st 90ºC
A
rticle 6 (2
) (e) A
rticle 18
A
nn
ex VIII
Equ
al to cond
itions defin
ed b
y Regu
lation
(EC
) Nº 17
74/20
02 A
rticle 14
(d)
Regu
lation (E
C) N
º 1
42/20
11: A
nn
ex XIII
Com
postin
g C
losed
comp
osting
reactor
with
eq
uipm
ent for
mon
itoring/record
ing
temp
eratu
re a
gain
st tim
e; m
inim
um
tem
pera
ture
condition
s of
70ºC
du
ring
1
hou
r; m
axim
um
pa
rticle size of 12 m
m
Article 6
(2) (f)
Article 1
5
An
nex V
I
Equ
al to cond
itions defin
ed b
y Regu
lation
(EC
) Nº 17
74/20
02 A
rticle 14
(f) R
egula
tion (EC
) Nº
142
/2011
: An
nex V
B
iogas p
roduction
Bioga
s plan
t equip
ped
with
a p
asteurisation
or hygien
isation
unit
wh
ere tem
pera
ture
mu
st rea
ch 7
0ºC
durin
g on
e h
our;
ma
ximum
pa
rticle size of 12 m
m
Article 6
(2) (f)
Article 1
5
An
nex V
I
Equ
al to cond
itions defin
ed b
y Regu
lation
(EC
) Nº 17
74/20
02 A
rticle 14
(f) R
egula
tion (EC
) Nº
142
/2011
: An
nex V
O
ther m
ethod
s or uses
Disp
osed of b
y other m
ean
s in a
ccordan
ce to rules la
id d
own
in A
rticle 3
3(2
), a
fter con
sulta
tion
of a
pp
ropria
te scientific
comm
ittee
Article 6
(2i)
Article 3
3(2
) U
sed u
nder con
dition
s, determ
ined
by th
e comp
etent a
uthority,
wh
ich p
revent risks a
rising to pub
lic and an
ima
l hea
lth O
ther
processin
g m
ethod
th
at d
elivers a
p
rodu
ct w
ith m
icrobiological
ha
zard
leve
l red
uced
: a
bsen
ce of
Clostridium
perfringens in
1 g
Ab
sence of Salm
onella in 25
g M
axim
um
num
ber of b
acteria
equals 3
00 for E
nterobacteriaceae
Article 1
4 (h
) A
nn
ex IV, ch
apter III
PART A. THESIS SCOPE AND OUTLINE
21
1.5. Work motivation and scope
Eggshell is a product-specific waste from the egg processing industry that is classified as
an animal by-product, for which specific uses or disposal methods are legally established by
European regulations.
Composting has been identified as an environmentally sound option in waste valorisation
(Schaub and Leonard, 1996), which can promote sanitation of the materials used and transform
organic matter into a humus-like product, to be further used as soil improver or amendment
material. However, to successfully achieve pathogen elimination during composting, the starting
composting mixture must contain enough available energy (easy biodegradable organic matter)
to drive the process into thermophilic temperatures. Since ES is mainly an inorganic material
with about 94% (w/w) CaCO3, several questions may arise, namely:
“Is composting a feasibility process for ES pre-treatment, when large amount of this
waste is incorporated in the starting mixture?”
“What is the maximum amount of ES that can be introduced in a composting system, to
attain sanitation conditions?”
“Is the evolution of composting significantly affected when ES is used as an ingredient?”
“At what level is the final quality of the compost obtained influenced by ES presence?”
“Which is the added value that an ES rich compost may present”?
To the author best knowledge, eggshell waste composting has been scarcely addressed
and the answers to these questions have been set aside by the literature. The only study found in
the literature addressing eggshell composting, used microbial inoculants to aid in the humus
build-up (Kemper and Goodwin, 2009).
In this context, the main goals of this work are to:
i) define/select organic materials with enough biodegradability to attain the desired
temperature;
ii) establish the maximum incorporation of ES in the starting mixture, without compromise
sanitation conditions and adequate evolution of the microbial degradation/transformation
of organic matter;
iii) appraise the quality of final products, in terms of physical, chemical and biological
properties, regarding the influence of ES incorporation;
iv) evaluate the added-value of eggshell rich compost, by focusing on its application for
environmental purposes, namely immobilisation of heavy metals in contaminated soils
and their removal from liquid environmental matrices.
CHAPTER 1. INTRODUCTION
22
1.6. Thesis structure
This thesis is structured in five Parts (A to E) as indicated in Figure 1.5.
Figure 1.5: Thesis organisation in five parts.
The Part A of this document joins together the initial two chapters of the thesis. Chapter 1
comprehends the introduction of the thesis which provides a contextualisation upon the origin,
properties, valorisation and legal framework associate to eggshell from the egg processing
industry. The role of composting in the valorisation of eggshell is also addressed, covering the
scope of this work. In Chapter 2, a review of the abiotic and biotic aspects that influence the
PART A. THESIS SCOPE AND OUTLINE
23
composting process is presented. Additionally, the current understanding about organic matter
and nitrogen biological transformations that occur during composting are explored and issues
related to the quality of composts are also discussed. The potential of composting end-products
for environmental applications is also reviewed.
Part B comprises two chapters. In Chapter 3 the properties of the feed stocks primarily
selected for this study are addressed, with special focus on the use of experimental mixture
design to predict the initial free air space of a composting mixture, which is a physical property
that plays an important role in composting. Chapter 4 is devoted to the assembly and
experimental validation of the laboratorial composting reactors used for the purpose of this
study.
Part C includes all the research on eggshell co-composting. Aiming to evaluate the features
of eggshell co-composting, firstly the self-heating ability of some starting composting mixtures
is addressed in Chapter 5. Then, the influence of a N-rich material in the physical and chemical
changes occurring during co-composting of ES is discussed in Chapter 6. Chapter 7 is focused
on evaluating the effect of high levels of ES (60% w/w) on composting evolution by using
proper multivariate data analysis techniques and informative visualisation tools.
Part D deals with the application of an eggshell rich-compost for environmental
applications, namely removal of lead and zinc from aqueous and solid matrices. Specifically in
Chapter 8, compost derived from eggshell waste co-composting was evaluated as a biosorbent
for Pb(II) uptake from aqueous medium and for comparison purposes, mature compost without
eggshell and natural eggshell were tested as well. Chapter 9 focus on evaluating the feasibility of
using the eggshell-rich compost as a soil amendment for immobilisation of Pb and Zn in an
acidic contaminated mining soil, by evaluating the environmental availability of metals, toxicity
reduction and variation of CO2 efflux from soil, due to the incorporation of a carbonate rich
amendment.
Finally, the most relevant conclusions from this work are resumed in Part E along with
further recommendations on future work (Chapter 10).
The experimental methodologies linked to laboratorial tests and analytical techniques are
not included as an independent part of the thesis, but are described in each chapter of Part B and
C, together with the presentation of the experimental results. This option is believed to be most
useful for the reader, since each chapter describes the relevant experimental methodologies used
to the issues studied.
CHAPTER 1. INTRODUCTION
24
The overall information delivered by this thesis has been published or submitted in the
following scientific publications (international articles with peer review and communications in
international conferences):
Soares, M.A.R., Quina, M.J., Quinta-Ferreira, R., 2013. Co-composting of eggshell waste in self-heating reactors: Monitoring and end product quality. Bioresour. Technol. 148, 293–301.
Soares, M.A.R., Quina, M.J., Quinta-Ferreira, R., 2013. Prediction of free air space in initial composting mixtures by a statistical design approach. J. Environ. Manage. 128, 75–82.
Soares, M.A.R., Quina, M.J., Quinta-Ferreira, R., 2015.Immobilisation of lead and zinc in contaminated soil by using compost derived from industrial eggshell. J. Environ. Manage. 164, 137–145.
Soares, M.A.R., Marto, S., Quina, M.J., Gando-Ferreira, L., Quinta-Ferreira, R.. Biosorbent potential of an eggshell rich composting product for lead removal from aqueous solutions. Submitted to Ecological Engineering, in March 2015.
Soares, M.A.R., Quina, M.J., Quinta-Ferreira, R.. Influence of N-rich material in valorisation of industrial eggshell by co-composting. Submitted to Environmental Technology, in October 2015.
Soares, M.A.R., Quina, M.J., Reis, M.S., Quinta-Ferreira, R.. Assessing the impact of using high levels of industrial eggshell in co-composting with agro-wastes, in preparation.
Soares, M.A.R., Quina M.J., Quinta-Ferreira R., 2014. An overview of eggshell waste potential for sorptive and catalytic processes, presented at CHEMPOR’2014 10-12th September, in Book of Abstracts, Pg 9-49 to 9-51, Porto, Portugal (oral communication).
Soares, M.A.R., Quina, M.J., Gando-Ferreira, L., Quinta-Ferreira, R., 2014. Removal of Pb (II) from aqueous solutions using eggshell composting products, presented at Athens’2014- 2nd International Conference on Sustainable Solid Waste Management, 12-14th June, In Proceedings, Athens, Greece. (oral communication).
Soares, M.A.R.; Quina, M.J.; Quinta-Ferreira, R, 2013. Use of mature organic composts as immobilising agents of Pb and Zn in a mine soil, presented at Proc. WASTES’2013- 2nd International Conference Wastes: Solutions, Treatments and Opportunities, 11-13th September, In Proceedings pg.267-268, Braga, Portugal. (oral communication).
Soares, M.A.R.; Quina, M.J.; Quinta-Ferreira, R, 2012. Selection of organic materials for co-composting industrial eggshell waste, presented at WasteEng2012- 4th International Conference on Engineering for Waste and Biomass Valorisation, 10-13th September, In Proceedings, Vol.2, pg 604-609, Porto, Portugal. (oral communication).
Soares, M.A.R.; Quina, M.J.; Quinta-Ferreira, R, 2012. Industrial potato peel composting: blend formulation using mixture design analysis, presented at ORBIT’2012 – Global assessment for organic resources and waste management, 12-15th June, In Proceedings, pg 5a-190 to 5a-197, Rennes, France. (oral communication).
PART A. THESIS SCOPE AND OUTLINE
25
1.7. References
Agra CEAS Consulting Ltd, 2004. Study on the socio-economic implications of the various systems to production.
Agra CEAS Consulting Ltd, 2008. The EU egg production sector.
Ahmad, M., Hashimoto, Y., Moon, D.H., Lee, S.S., Ok, Y.S., 2012a. Immobilization of lead in a Korean military shooting range soil using eggshell waste: an integrated mechanistic approach. J. Hazard. Mater. 209-210, 392–401.
Ahmad, M., Usman, A.R. a., Lee, S.S., Kim, S.-C., Joo, J.-H., Yang, J.E., Ok, Y.S., 2012b. Eggshell and coral wastes as low cost sorbents for the removal of Pb2+, Cd2+ and Cu2+ from aqueous solutions. J. Ind. Eng. Chem. 18, 198–204.
Ahmad, R., Kumar, R., Haseeb, S., 2010. Adsorption of Cu2+ from aqueous solution onto iron oxide coated eggshell powder: Evaluation of equilibrium, isotherms, kinetics, and regeneration capacity. Arab. J. Chem.
Baláž, M., 2014. Eggshell membrane biomaterial as a platform for applications in materials science. Acta Biomater. 10, 3827–3843.
Belitz, H.-D., Grosch, W., Schieberle, P., 2009. Eggs, in: Food Chemistry. Springer-Verlag, p. 1070.
Bhaumik, R., Mondal, N.K., Das, B., Roy, P., Pal, K.C., Das, C., Baneerjee, a., Datta, J.K., 2012. Eggshell Powder as an Adsorbent for Removal of Fluoride from Aqueous Solution: Equilibrium, Kinetic and Thermodynamic Studies. E-Journal Chem. 9, 1457–1480.
Boey, P.-L., Maniam, G.P., Hamid, S.A., 2011. Performance of calcium oxide as a heterogeneous catalyst in biodiesel production: A review. Chem. Eng. J. 168, 15–22.
Boro, J., Deka, D., Thakur, A.J., 2012. A review on solid oxide derived from waste shells as catalyst for biodiesel production. Renew. Sustain. Energy Rev. 16, 904–910.
Cabeza, M.C., Cambero, M.I., de la Hoz, L., García, M.L., Ordóñez, J.A., 2011. Effect of the thermoultrasonic treatment on the eggshell integrity and their impact on the microbial quality. Innov. Food Sci. Emerg. Technol. 12, 111–117.
Castilho, S., Kiennemann, A., Costa Pereira, M.F., Soares Dias, A.P., 2013. Sorbents for CO2 capture from biogenesis calcium wastes. Chem. Eng. J. 226, 146–153.
Chojnacka, K., 2005. Biosorption of Cr(III) ions by eggshells. J. Hazard. Mater. 121, 167–173.
Chowdhury, S., Das, P., 2011. Utilization of a domestic waste—Eggshells for removal of hazardous Malachite Green from aqueous solutions. Environ. Prog. Sustain. Energy 31, 415–425.
Cordeiro, C.M.M., Hincke, M.T., 2011. Recent patents on eggshell: shell and membrane applications. Recent Pat. Food. Nutr. Agric. 3, 1–8.
Cotterill, O.J., McBee, L.E., 1995. Egg breaking, in: Stadelman, W.J., Cotterill, O. (Eds.), Egg Science and Technology. Haworth Press, Inc, New York.
Dauphin, Y., Cuif, J.-P., Salomé, M., Susini, J., Williams, C.T., 2006. Microstructure and chemical composition of giant avian eggshells. Anal. Bioanal. Chem. 386, 1761–71.
CHAPTER 1. INTRODUCTION
26
De Paula, H.A., Becker, J.G., Davis, A.P., 2008. Characterization of the Uptake of Divalent Metal Ions by a Hatchery Residual. Environ. Eng. Sci. 25, 737–746.
De Varennes, A., 2003. Produtividade dos solos e ambiente, 1st ed. Escolar Editora, Lisboa, Portugal.
DEFRA - Department for environment food and rural affairs, 2011. Controls on animal by-products - Guidance on Regulation (EC) 1069/2009 and accompanying implementing Regulation (EC) 142/2011, enforced in England by the Animal ByProducts (Enforcement) (England) Regulations 2011. Department for Environment Food & Rural Affairs - United Kingdom Government, England.
DEFRA - Department for environment food and rural affairs, 2013. UK egg processing data [WWW Document]. URL https://www.gov.uk/government/uploads/system/uploads/attachment_data/file/451601/eggs-statsnotice-07may15.pdf (accessed 4-6-2015).
EEPA, 2011. Guide to good manufacturing practice for liquid, concentrated, frozen and dried egg products used as food ingredients. European Egg Processors Association. Brugge, Belgium.
Ehrampoush, M., Ghanizadeh, G., Ghaneian, M., 2011. Equilibrium and kinetics study of reactive red 123 dye removal from aqueous solution by adsorption on eggshell. Iranian J. Environ. Health Sci. Eng. 8, 101–108.
Elkady, M.F., Ibrahim, A.M., El-Latif, M.M.A., 2011. Assessment of the adsorption kinetics, equilibrium and thermodynamic for the potential removal of reactive red dye using eggshell biocomposite beads. Desalination 278, 412–423.
Elwakeel, K.Z., Yousif, A.M., 2010. Adsorption of malathion on thermally treated egg shell material. Water Sci. Technol. 61, 1035–41.
Freire, M.N., Holanda, J.N.F., 2006. Characterization of avian eggshell waste aiming its use in a ceramic wall tile paste ( Caracterização de resíduo de casca de ovo visando seu. Cerâmica 52, 240–244.
Gao, Y., Xu, C., 2012. Synthesis of dimethyl carbonate over waste eggshell catalyst. Catal. Today 190, 107–111.
Gergely, G., Wéber, F., Lukács, I., Tóth, A.L., Horváth, Z.E., Mihály, J., Balázsi, C., 2010. Preparation and characterization of hydroxyapatite from eggshell. Ceram. Int. 36, 803–806.
Global Poultry Trends, 2011a. New Products Will Boost Sales of Egg Products in the Americas [WWW Document]. Poult. Site. URL http://www.thepoultrysite.com/articles/2000/global-poultry-trends-new-products-will-boost-sales-of-egg-products-in-the-americas (accessed 4-6-2013).
Global Poultry Trends, 2011b. Processed Egg Gains in Importance in Asia [WWW Document]. Poult. Site. URL http://www.thepoultrysite.com/articles/1914/global-poultry-trends-processed-egg-gains-in-importance-in-asia (accessed 4-6-2013).
Guru, P.S., Dash, S., 2014. Sorption on eggshell waste--a review on ultrastructure, biomineralization and other applications. Adv. Colloid Interface Sci. 209, 49–67.
Hanzlik, R., Fowler, S., Fisher, D., 2005. Relative bioavailability of calcium from calcium formate, calcium citrate, and calcium carbonate. J. Pharmacol. Exp. Ther. 313, 1217–1222.
Haug, R.T., 1993. The practical handbook of compost engineering. CRC-Press, Boca Raton, Florida, USA.
Hincke, M., Nys, Y., Gautron, J., 2010. The role of matrix proteins in eggshell formation. J. Poult. Sci. 47, 208–219.
PART A. THESIS SCOPE AND OUTLINE
27
Hongqin, X., Duilin, W., Zhe, J., Xiaowei, L., Shouwei, Z., Yan, L., Cheng, C., 2011. Kinetic and thermodynamic sorption study of radiocobalt by magnetic hydroxyapatite nanoparticles. J. Radioanal. Nucl. Chem. 292, 637–647.
Jewell, W.J., Davis, H.R., Loehr, R.C., Siderewicz, W., Zall, R.R., 1975. Egg breaking and processing waste control and treatment. New York.
Kemper, N.P., Goodwin, H.L., 2009. Feasibility and production costs of composting breeder and pullet litter with eggshell waste. J. Appl. Poult. Res. 18, 172–184.
Khadka, D.B., Subba, D., 2010. Utilization of Hatchery by-products as Feed ingredients in Broiler Chicken Feed. J. Solid Waste Technol. Manag. 36, 1072.
Kirboga, S., Öner, M., 2013. Application of experimental design for the precipitation of calcium carbonate in the presence of biopolymer. Powder Technol. 249, 95–104.
Kobiraj, R., Gupta, N., Kushwaha, K., Chattopadhyaya, M., 2012. Determination of equilibrium, kinetic and thermodynamic parameters for the adsorption of Brilliant Green dye from aqueous solutions onto eggshell powder. Indian J. Chem. Technol. 19, 26–31.
Köse, T.E., Kıvanç, B., 2011. Adsorption of phosphate from aqueous solutions using calcined waste eggshell. Chem. Eng. J. 178, 34–39.
Kosseva, M.R., 2009. Processing of food wastes, in: Taylor, S. (Ed.), Advances in Food and Nutrition Research. Academic Press, Burlington, pp. 57–136.
Kumar, G.S., Thamizhavel, A., Girija, E.K., 2012. Microwave conversion of eggshells into flower-like hydroxyapatite nanostructure for biomedical applications. Mater. Lett. 76, 198–200.
Lammie, D., Bain, M.M., Wess, T.J., 2005. Microfocus X-ray scattering investigations of eggshell nanotexture. J. Synchrotron Radiat. 12, 721–6.
Laufenberg, G., Kunz, B., Nystroem, M., 2003. Transformation of vegetable waste into value added products: (A) the upgrading concept; (B) practical implementations. Bioresour. Technol. 87, 167–98.
Liao, D., Zheng, W., Li, X., Yang, Q., Yue, X., 2010. Removal of lead (II) from aqueous solutions using carbonate hydroxyapatite extracted from eggshell waste. J. Hazard. Mater. 177, 126–130.
Lunge, S., Thakre, D., Kamble, S., Labhsetwar, N., Rayalu, S., 2012. Alumina supported carbon composite material with exceptionally high defluoridation property from eggshell waste. J. Hazard. Mater. 237-238, 161–9.
Meski, S., Ziani, S., Khireddine, H., Yataghane, F., Ferguene, N., 2011. Elaboration of the hydroxyapatite with different precursors and application for the retention of the lead. Water Sci. Technol. 63, 2087.
Messens, W., Grijspeerdt, K., Herman, L., 2005. Eggshell penetration by Salmonella: a review. Worlds Poult. Sci. J. 61, 71–85.
Mezenner, N.Y., Bensmaili, A., 2009. Kinetics and thermodynamic study of phosphate adsorption on iron hydroxide-eggshell waste. Chem. Eng. J. 147, 87–96.
Mohammadi, M., Lahijani, P., Mohamed, A., 2014. Refractory dopant-incorporated CaO from waste eggshell as sustainable sorbent for CO2 capture: Experimental and kinetic studies. Chem. Eng. J. 243, 455–464.
Montilla, A., Castillo, M., Sanz, M., Olano, A., 2005. Egg shell as catalyst of lactose isomerisation to lactulose. Food Chem. 90, 883–890.
Nicar, M., Pak, C., 1985. Calcium bioavailability from calcium carbonate and calcium citrate. J. Clin. Endocrinol. Metab. 61, 391–393.
Ok, Y.S., Lee, S.S., Jeon, W.-T., Oh, S.-E., Usman, A.R. a, Moon, D.H., 2011. Application of eggshell waste for the immobilization of cadmium and lead in a contaminated soil. Environ. Geochem. Health 33, 31–9.
Olivares-Marín, M., Cuerda-Correa, E.M., Nieto-Sánchez, A., Garcia, S., Pevida, C., Román, S., 2012. Influence of morphology, porosity and crystal structure of CaCO3 precursors on the CO2 capture performance of CaO-derived sorbents. Chem. Eng. J. 217, 71–81.
Oliveira, D.A., Benelli, P., Amante, E.R., 2013. A literature review on adding value to solid residues: egg shells. J. Clean. Prod. 46, 42–47.
Park, H.J., Jeong, S.W., Yang, J.K., Kim, B.G., Lee, S.M., 2007. Removal of heavy metals using waste eggshell. J. Environ. Sci. 19, 1436–1441.
Paseephol, T., Small, D.M., Sherkat, F., 2008. Lactulose production from milk concentration permeate using calcium carbonate-based catalysts. Food Chem. 111, 283–290.
Pirvutoiu, I., Popescu, A., 2012. Research on the Major Trends in the Romanian Egg Market. Bull. Univ. Agric. Sci. Vet. 69, 229–238.
Podstawczyk, D., Witek-Krowiak, A., Chojnacka, K., Sadowski, Z., 2014. Biosorption of malachite green by eggshells: mechanism identification and process optimization. Bioresour. Technol. 160, 161–165.
Prabakaran, K., Rajeswari, S., 2009. Spectroscopic investigations on the synthesis of nano-hydroxyapatite from calcined eggshell by hydrothermal method using cationic surfactant as template. Spectrochim. Acta. A. Mol. Biomol. Spectrosc. 74, 1127–34.
Pramanpol, N., Nitayapat, N., 2006. Adsorption of reactive dye by eggshell and its membrane. Kasetsart J. 40, 192–197.
Ren, J., Bopape, M., Setshedi, K., Kitinya, J., Onyango, M., 2012. Sorption of Pb(II) and Cu(II) by low-cost magnetic eggshells-Fe3O4 powder. Chem. Ind. Chem. Eng. Q. 18, 221–231.
Rivera, E., 1999. Synthesis of hydroxyapatite from eggshells. Mater. Lett. 41, 128–134.
Rivera, E.M., Araiza, M., Brostow, W., Castano, V.M., Hernandez, R., Rodrıguez, J.R., 1999. Synthesis of hydroxyapatite from eggshells. Mater. Lett. 128–134.
Russ, W., Meyer-Pittroff, R., 2004. Utilizing waste products from the food production and processing industries. Crit. Rev. Food Sci. Nutr. 44, 57–62.
Russ, W., Schnappinger, M., 2007. Waste Related to the Food Industry: A Challenge in Material Loops, in: Oreopoulou, V., Russ, W. (Eds.), Utilization of By-Products and Treatment of Waste in the Food Industry. Springer Science Business Media, New York, pp. 1–13.
PART A. THESIS SCOPE AND OUTLINE
29
Schaafsma, A., Pakan, I., Hofstede, G.J., Muskiet, F.A., Van Der Veer, E., De Vries, P.J., 2000. Mineral, amino acid, and hormonal composition of chicken eggshell powder and the evaluation of its use in human nutrition. Poult. Sci. 79, 1833–8.
Schaub, S.M., Leonard, J.J., 1996. Composting: an alternative waste management option for food processing industries. Trends Food Sci. Technol. 7, 263–268.
Sharma, Y.C., Singh, B., Korstad, J., 2011. Latest developments on application of heterogenous basic catalysts for an efficient and eco friendly synthesis of biodiesel: A review. Fuel 90, 1309–1324.
Sim, J.S., Aw-Yong, L.M., Bragg, D.B., 1983. Utilization of Egg Shell Waste by the Laying Hen. Poult. Sci. 62, 2227–2229.
Tsai, W., Hsien, K., Hsu, H., Lin, C., 2008. Utilization of ground eggshell waste as an adsorbent for the removal of dyes from aqueous solution. Bioresour. Technol. 99, 1623–1629.
Tsai, W.-T., Yang, J.-M., Hsu, H.-C., Lin, C.-M., Lin, K.-Y., Chiu, C.-H., 2008. Development and characterization of mesoporosity in eggshell ground by planetary ball milling. Microporous Mesoporous Mater. 111, 379–386.
Tsai, W.T., Yang, J.M., Lai, C.W., Cheng, Y.H., Lin, C.C., Yeh, C.W., 2006. Characterization and adsorption properties of eggshells and eggshell membrane. Bioresour. Technol. 97, 488–93.
Vijayaraghavan, K., Joshi, U.M., 2013. Chicken Eggshells Remove Pb(II) Ions from Synthetic Wastewater. Environ. Eng. Sci. 30, 67–73.
Vlad, V., 2009. Eggshell membrane separation method. United States Pat.
Vladimir Vlad, 2007. Avian eggshell membrane polypeptide extraction via fermentation process. United States Pat.
Wei, Z., Xu, C., Li, B., 2009. Application of waste eggshell as low-cost solid catalyst for biodiesel production. Bioresour. Technol. 100, 2883–5.
Witoon, T., 2011. Characterization of calcium oxide derived from waste eggshell and its application as CO2 sorbent. Ceram. Int. 37, 3291–3298.
Yoo, S., Hsieh, J.S., Zou, P., Kokoszka, J., 2009. Utilization of calcium carbonate particles from eggshell waste as coating pigments for ink-jet printing paper. Bioresour. Technol. 100, 6416–21.
Zhang, S., Guo, Z., Xu, J., Niu, H., Chen, Z., Xu, J., 2010. Effect of environmental conditions on the sorption of radiocobalt from aqueous solution to treated eggshell as biosorbent. J. Radioanal. Nucl. Chem. 288, 121–130.
Zhao, Y., Chi, Y., 2009. Characterization of collagen from eggshell membrane. Biotechnology 8, 254–258.
Zheng, W., Li, X., Yang, Q., Zeng, G., Shen, X., Zhang, Y., Liu, J., 2007. Adsorption of Cd(II) and Cu(II) from aqueous solution by carbonate hydroxylapatite derived from eggshell waste. J. Hazard. Mater. 147, 534–539.
Zhou, H., Lee, J., 2011. Nanoscale hydroxyapatite particles for bone tissue engineering. Acta Biomater. 7, 2769–81.
CHAPTER 1. INTRODUCTION
30
This Page Intentionally Left Blank
PART A. THESIS SCOPE AND OUTLINE
31
2. State of the art in composting process
This chapter describes main theoretical concepts associated to the composting process.
The temperature dependent phases through which the process evolves, as well as the main biotic
aspects and sanitising conditions are firstly tackled. Afterwards, organic matter and nitrogen
biological transformations that occur during composting are also explored. Special attention is
given to abiotic aspects that influence the reactions attained during aerobic degradation of
organic matter. In the last sections of this chapter, issues related to the quality of composting
end-products for soil application are discussed too.
CHAPTER 2. STATE OF THE ART IN COMPOSTING PROCESS
32
2.1. Introduction
Composting may be defined as a process of biological decomposition and stabilisation of
organic substrates, under aerobic conditions, that allows development of thermophilic
temperatures, as a result of biologically produced heat (Haug, 1993). Due to the metabolic
activity of successive microbial populations, the process allows the conversion of organic matter,
from animal or vegetal origin, into a final product that should be stable, humus like, free of
pathogens and plant seeds (Pare et al., 1998; Shilev and Naydenov, 2007). A generalised
equation of composting follows (Peigné and Girardin, 2004):
+ O2 + CO2+H2O+Energy (heat) + other gases (2.1)
Composting is an ancient practice that has been used through centuries by nature and
man, especially for farming, as a mean of recycling organic matter to improve soil physical and
chemical properties (Rynk et al., 1992). Nowadays, there is a renewed attention concerning
composting and its application is not limited to farm context but has been broadened to
municipal and industrial frameworks.
Indeed in many nations, legal constrains are reinforcing the waste management hierarchy
based on prevention, re-use, recycling and other forms of recovery depreciating disposal in
landfills. In addition, mandatory targets have been limiting the amount of biodegradable waste
consigned to landfilling, promoting the retrieval of the waste organic matter and nutrients that
can be tailored to energy recovery or supress soil deficiencies. In this scope, composting has
been identified as an environmentally sound alternative (Chroni et al., 2012; Farrell and Jones,
2009; Gajalakshmi and Abbasi, 2008; Sharma et al., 1997; Tuomela et al., 2000).
Composting has been used to recycle wastes such as municipal solid wastes (Castaldi et
al., 2005; Gestel et al., 2003; Kumar and Goel, 2009), sewage sludges (Kang et al., 2011;
Manios, 2004; Paredes et al., 2005; Wei and Liu, 2005), agro-food residues (Grigatti et al., 2011;
Pepe et al., 2013; Sellami et al., 2008) and many others. In addition, aerobic conversion is
reported to be useful in the remediation of soils contaminated with some chemical pollutants like
aromatic hydrocarbons, pesticides or chlorophenols (Houot et al., 2012; Semple et al., 2001).
2.2. Temperature-dependent phases and general biotic aspects
Temperature plays a determinant role in the evolution of composting since it dictates the
phases through which the process evolves. Under adequate abiotic conditions for microbial
metabolism
microbial
Stabilised organic material (compost)
Fresh organic matter
PART A. THESIS SCOPE AND OUTLINE
33
development (namely moisture, pH, oxygen, nutrients and porosity) composting process can be
divided into four phases (Fogarty and Tuovinen, 1991; Ryckeboer et al., 2003), as detailed in
During composting, high temperatures might be maintained for several days if abiotic
conditions are favourable. Therefore, this is a well-established pathogen reduction technology
that can lessen the presence of most pathogenic bacteria, viruses, fungi, protozoa and helminth
ova to safe low levels. Guidelines to assure effective inactivation during composting have been
established in many countries, based on temperature monitoring and control, Table 2.3.
Table 2.3: An overview of regulatory temperature-time relations during composting. Adapted from British Standard Institute (2011); CCME Guidelines for Compost Quality (2005); JRC -
European Commission (2012); U.S. Environmental Protection Agency (2003). Composting technology Country Windrow Aerated static pile In vessel (reactor) Scope of application Canada T≥55ºC for at least 15
days, with 5 turnings T≥55ºC for 3 days T≥55ºC for 3 days All feedstock
United States of America
T≥55ºC for at least 15 days, with 5 turnings
T≥55ºC for 3 days T≥55ºC for 3 days Biosolids
United Kingdom
T≥65ºC for 7 days (not necessarily consecutive) Moisture=51%
T≥65ºC for 7 days (not necessarily consecutive) Moisture=51%
T≥65ºC for 7 days (not necessarily consecutive) Moisture=51%%
Segregated biowastes, biodegradable polymers and materials; anaerobic digestate
Belgium T≥60ºC for 4 days or T≥55ºC for 12 days -
Czech Republic
T≥65ºC for 5 days or T≥55ºC for 21 days -
German T≥65ºC for 5 days or T≥55ºC for 14 days
T≥60ºC for 5 days or T≥55ºC for 14 days
- -
Denmark T≥55ºC for 14 days -
France T≥60ºC for 4 days -
Italy T≥55ºC for 3 days -
Netherlands T≥65ºC for 4 days -
Slovenia T≥65ºC for 4 days or T≥60ºC for 5 days or T≥55ºC for 14 days -
EU members (proposal)
T≥65ºC for 5 days, T≥60ºC for 5 days or T≥55ºC for 14 days Biowaste
EU members T≥70ºC for 1 hour Animal by-products
In general, regulations from European countries are much more conservative in terms of
inactivation temperature in comparison to American and Canadian guidelines. In fact, in a
review about effectiveness of time-temperature regulations on pathogen inactivation, Wichuk
and McCartney (2007) reported that pathogens have been detected in end-products of processes
that fulfilled the requirements of 55ºC for 3 days. Thus, they underlined that this regulation
would not be sufficient to ensure a complete inactivation. Although the applicability of the
guidelines is rarely questionable, some studies reported by Wichuk and McCartney (2007) have
emphasised that: i) 55ºC during 15 days in windrows is not enough to eliminate protozoan
PART A. THESIS SCOPE AND OUTLINE
37
parasites; ii) some virus inactivation was not possible at 55ºC during 3 days; Salmonella may
survive at 60ºC for 5 days in biosolids composting.
It should be pointed out that the criteria reported in Table 2.3 presume that all particles
reach these conditions. So, cooler zones inside the matrix where pathogen may survive and the
use of discrete temperature measurements at fixed locations of the mixture are the main reasons
to fail pathogen inactivation (Wichuk and McCartney, 2007). Therefore, the establishment of
time-temperature regulations have tended to be more conservative.
2.4. Organic matter and nitrogen transformations
Organic matter constituted by lignin, carbohydrates (including cellulose, hemicellulose,
starch, monosaccharides and oligosaccharides), proteins and lipids suffers mineralisation,
transformation and stabilisation along several biochemical pathways that are catalysed by
enzymes, throughout composting (Tuomela et al., 2000). As result, changes in carbon and
nitrogen content occur as composting evolves. Carbon is used mainly as energy source for the
microorganisms and may also be incorporated into their cells (at lower extents). Nitrogen is a
constituent of enzymes, co-enzymes, proteins and nucleic acids that have a determinant role in
cell growth and maintenance. In the following sections, an overview of the transformation of
organic matter and nitrogen during the main stages of composting is presented.
2.4.1. Organic matter dynamics
During the active phase of composting, organic matter mineralisation prevails with quick
degradation of more labile compounds like simple carbohydrates, fats and amino acids forming
carbon dioxide, water and ammonia (Amir et al., 2010; Bernal et al., 2009). As available organic
substances become scarce, degradation rates decrease and resistant organic substrate such as
cellulose, hemicellulose and lignin start to be partially degraded. Then, aliphatic compounds and
phenols of low structural complexity are released and further degraded by microbial activity or
transformed into new complex and polymerized compounds with similar properties to humic
substances1 found in soil (Sánchez–Monedero and Roig, 1999).
1 Humic substances are considered to be a series of relatively high-molecular-weight substances, yellow to black coloured organic substances formed by secondary synthesis reactions in soils (Harrison, 2008)
CHAPTER 2. STATE OF THE ART IN COMPOSTING PROCESS
38
On the latter stages of composting (maturation), the transformations processes prevail
over mineralisation and organic compounds with high stabilisation degree remain (Bernal et al.,
2009). These organic substances are generally characterised by small particle size, dark colour,
with a complex chemical structure rich in phenolic, carboxylic and amine functional groups
(Harrison, 2008).
Several studies in the literature have been dedicated to track the fate of organic matter
substances during composting for better understanding biochemical mechanisms that lead to
composts with high level of stability. Some works focus on evaluating water soluble organic
substances (Castaldi et al., 2005; Charest, 2004; Said-Pullicino and Gigliotti, 2007; Said-
Pullicino et al., 2007a, 2007b; Sánchez–Monedero and Roig, 1999) since organic matter
degradation and transformation occurs at the liquid biofilm surrounding the solid particles, when
organic compounds are depolymerised by enzymatic activities, into smaller molecules water
soluble and consequently assimilated by the microorganisms (Gajalakshmi and Abbasi, 2008).
For this reason, water-soluble substances have been considered to reflect the biochemical
alterations of organic matter during composting, allowing the assessment of compost
stabilisation (Bernal et al., 2009; Castaldi et al., 2005).
On the other hand, monitoring humic substances is also of interest to understand the
mechanisms of polymerisation and transformation of humic compounds during composting.
Humic substances are heterogeneous mixture of organic molecules that can be fractioned
according to its solubility at specific pH into fulvic acids, humic acids and humin (as detailed in
Figure 2.2 a)). Although these fractions present chemical and physical differences, it does not
indicate the existence of three distinct types of organic molecules (Sutton and Sposito, 2005).
The chemical structure for humic substances is not well defined, since a number of
precursors and possible combinations between them is extremely wide. However, the final
mature compost is believed to contain large organic molecules with aromatic COOH, aliphatic
COOH, phenolic OH, H-bonded phenolic OH, saccharide, quinone, peptide and cyclic N units
(Harrison, 2008; Stevenson, 1994). Therefore, most of the studies focusing on humic substances
evolution throughout composting are based on identifying the presence of these characteristic
chemical groups or by fractioning and purifying humic substances according to its pH solubility
(Figure 2.2 a)) (Amir et al., 2010; Barje et al., 2012; Droussi et al., 2009; Lhadi et al., 2006;
Zbytniewski and Buszewski, 2005).
PART A. THESIS SCOPE AND OUTLINE
39
Figure 2.2: Humic substances: a) classification and chemical properties, b) proposed formation mechanisms. Adapted from Stevenson (1994).
Despite significant interest in the biochemical features of humic substances formation,
this issue is still considered one of the less understood aspects of humus chemistry. According to
Stevenson (1994) four mechanisms may be considered (Figure 2.2 b)) where amino compounds
synthesised by microorganisms are perceived to react with modified lignins (pathway �),
quinones (pathways � and �) and reducing sugars (pathway �) to form complex dark-coloured
polymers by polymerisation and condensation reactions (Harrison, 2008). Indeed, the exact
mechanism of breakdown and formation of humic substances during composting is not
consensus (Barje et al., 2012; Harrison, 2008) and it is likely that the prevalence of one or more
of the mechanisms here indicated (or other yet not understood) is dependent on the nature of the
feedstocks' organic matter and on the composting conditions.
Humic
Substances
Soluble under
all pH conditions
Insoluble under acidic conditions
(pH < 2)
Soluble at higher at pH>2
Insoluble under
All pH conditions
Fulvic
Acids
Humic
Acids
Humin
Increase degree of polymerization
Increase in molecular weight
Increase in carbon content
Increase oxygen content
RESIDUES
TRANSFORMATION BY
MICROORGANISMS
AMINO
COMPOUNDS
Modified
lignins
HUMIC SUBSTANCES
Lignin decomposition
products
QuinonesQuinones
PolyphenolsSugars
a)
b)
CHAPTER 2. STATE OF THE ART IN COMPOSTING PROCESS
40
The fate of organic matter substances during aerobic conversion may also be tracked by
following the evolution of polysaccharides and lignin concentration (Alburquerque et al., 2009;
Charest, 2004; Francou et al., 2008; Lashermes et al., 2012; Lhadi et al., 2006; Paradelo et al.,
2013). In fact, since these substances are considered to undergo biodegradation and not synthesis
in the course of composting, variations in their concentration are regarded to be better indicators
of organic matter evolution in comparison to other organic matter fractions (Paradelo et al.,
2013).
Furthermore, mineralisation of organic matter can be quantified based upon the ash
conservation principle, which assumes that ash of a composting matrix remains constant
throughout the process (Figure 2.3).
Despite nitrification (that will be presented in section 2.4.2) can slightly increase the ash
fraction due to nitrite and nitrate formation, this contribution is considered negligible in
comparison to the overall content (Himanen and Hänninen, 2011).
Figure 2.3: Generalised bar diagram showing VS and ash components for starting composting mixture and compost product. Ash fraction is conservative. Adapted from Haug (1993).
Thus, the mineralisation during composting can be defined as (Haug, 1993):
�� = ����������
(2.2)
The percentage of ash in feed (Ash0%) can be determined as:
ℎ�% = ����×�����������
(2.3)
Then,
��� = ����×�������% − ℎ� (2.4)
Similary, Ashp% and VSp can be determined as:
VSo: volatile solids of the feed mixture,
as fraction of TS (total solids);
VSp: volatile solids of the product, as
fraction of TS;
Asho: ash of the feed mixture, as
fraction of TS;
Ashp: ash of the product, as fraction of
TS.
VS
o-V
Sp
PART A. THESIS SCOPE AND OUTLINE
41
ℎ�% = ����×�����������
(2.5)
��� = ����×�������% − ℎ� (2.6)
Thus substituting Eqs (2.4) and (2.6) into (2.2) and rearranging:
�� = �����%�����%��������%���������%� (2.7)
Additionally, decomposition of organic materials can also be appraised by monitoring
CO2 production (Cayuela et al., 2012; Chang and Hsu, 2008; Contreras-Ramos et al., 2004; de
Guardia et al., 2010b; Gomes and Pereira, 2008; De Guardia et al., 2008; Komilis and Ham,
2006; Komilis, 2006; Kulcu and Yaldiz, 2004; Saidi et al., 2008; Tosun et al., 2008) or organic
matter losses (Gomes and Pereira, 2008; Paredes et al., 2002, 2001, 2000; Tortosa et al., 2012)
due to aerobic biological degradation. The main objective of these studies is essentially to
understand the mineralisation phase of organic matter transformations by characterising the
kinetic or stoichiometric behaviour of the biochemical reactions involved. Some models have
been used for that purpose, as indicated in Table 2.4.
Table 2.4: Mineralisation of organic matter during composting: an overview of kinetic models.
Adapted from Mason (2006), Sleutel et al. (2005), Tosun et al. (2008). Model type Description Model equation Application
Single-first order
Rate of mineralisation is proportional to the amount of one pool of available organic matter, following a first order kinetic.
Existence of two pools of available organic matter which are both mineralised according to first order kinetics.
���� = ��"�1 − �� #!�+ ����1 − �� %!�
(2.9)
Organic carbon
Combined first and zero-order
Organic matter presents an easily mineralisable pool assuming a first order kinetics and a more resistant pool that follows a zero-order mineralisation kinetic.
���� = ��"�1 − �� #!� + ������ (2.10)
Organic carbon
Second order
Rate of decomposition is proportional to the product of organic matter and microorganisms concentration.
���� = �� − ��1 + �&'�1 − '����
(2.11)
Organic carbon
Levi -Minzi Net mineralisation follows an exponential kinetic
���� = �(�� (2.12) Organic carbon
Chen-Hosshimoto
Considers the organic matter as dependent on a refractory coefficient (R), a kinetic constant (K) and maximum specific growth rate of microorganisms
�����)
= * + �1 − *�+,�� − 1 + +
(2.13)
Organic carbon
Legend: C(t) is the cumulative amount of C mineralised at time t; CA is the amount of mineralisable C. CA,f and CA,s are the C pools with fast and slow turn over time, respectively; kf and ks are the mineralisation rate constants of these pools; a is the fraction of microbial biomass; k2 is the second-order mineralisation rate constant; R is the refractory coefficient, K is Chen and Hashimoto dimensionless kinetic constant, and µm is the maximum specific growth rate of microorganisms.
In summary, different approaches may be used to track organic matter transformation
during composting. The main routes are by analysing water soluble organic matter, humic
CHAPTER 2. STATE OF THE ART IN COMPOSTING PROCESS
42
substances or carbon/organic matter mineralisation. However, it is noteworthy that organic
matter dynamics is highly dependent on factors like nature of organic feedstocks and operating
conditions, which determine the microorganisms’ development and succession with further
implications on organic matter transformation and stabilisation.
2.4.2. Nitrogen dynamics
Nitrogen dynamics during composting are complex and follow a set of successive
processes that can be summarised in ammonification, nitrification, immobilisation and
denitrification, as detailed in Figure 2.4.
Ammonification (also called mineralisation) corresponds to the conversion of organic
nitrogen (proteins, aminoacids, urea, etc.) into free ammonium (NH4+/NH3) and this
transformation occurs concurrently with organic matter biodegradation throughout composting.
Thus, NH4+/NH3 formed during ammonification is added to initial content present in feedstock
and constitutes a single pool. Then, nitrogen can be transferred to leachates, emitted as ammonia
by stripping, immobilised in turn to organic form by microbial synthesis, directly accumulated in
composting end-product or oxidised to NO3- by a two-step biological process called nitrification
(de Guardia et al., 2010b; Zeng et al., 2012a).
Figure 2.4: Schematic representation of nitrogen transformations and transfer throughout composting. Reprinted from Zeng et al., (2012a) with permission of Elsevier.
Nitrification occurs during the maturation stage of composting. Firstly, ammonia is
biological oxidised to nitrite (NO2-) (nitritation) by ammonia-oxidising bacteria and then
converted to nitrate NO3- (nitratation) by nitrite-oxidising bacteria. Nitritation is considered the
rate-limiting step of nitrification and N2O is a by-product of NH4+/NH3 oxidation (Sánchez-
Monedero et al., 2010). Then, the pool of NO3-/NO2
- (NOx-) can be transformed by microbial
PART A. THESIS SCOPE AND OUTLINE
43
activity to N2 via denitrification, with N2O gas emission, or suffer immobilisation. Main transfer
routes for NOx- are leaching and accumulation in composting end-product (De Guardia et al.,
2010b; Zeng et al., 2012b).
Therefore during aerobic degradation of organic solids, N can be exported in the form of
leachates or gaseous emissions characterised by ammonia, nitrous oxide and N2. These gas
emissions are of environmental concern. Ammonia (NH3) contributes to eutrophication and acid
rain (Colón et al., 2010) and nitrous oxide is a greenhouse gas molecule whose contribution to
global warming is even more significant than CH4 or CO2 (Shen et al., 2011). Accordingly, one
of the major challenges regarding N transfer and transformation processes is how to minimise
the loss of nitrogen during composting, in order to preserve the agronomic value of the
composting end-product and to avoid environmental problems associated to N losses (Hubbe et
al., 2010). Several studies in literature have addressed this issue in order to minimise N export
from compost.
Pagans et al. (2006) studied the influence of temperature in ammonia emissions during
composting of several wastes (organic fraction of municipal solid wastes, dewatered raw sludge
and anaerobically digested sludge, animal by-products from slaughterhouses and hydrolysed hair
from the leather production industry). They concluded that ammonia emissions exhibited a
similar pattern to temperature profile that means an exponential correlation during thermophilic
stage and a linear relationship during the final mesophilic stage.
De Guardia et al. (2008) evaluated the influence of aeration on N dynamics during
composting of wastewater sludge with wood chips and concluded that ammonification, ammonia
emissions and nitrification are controlled by this parameter. In fact, higher aeration rate induced
ammonia emissions, decreased nitrogen losses by leaching and increased the concentrations of
total ammoniacal nitrogen in the composting mixture. Furthermore, a proportional relationship
was found between nitrification rate and the mean content of NH4+/NH3 in the mixture.
Additionally, De Guardia et al. (2010) developed studies on ammonification,
accumulation, stripping and conversion of NH4+/NH3 and highlighted the significance of organic
mineralisation in N losses due to an increase of ammonia emissions when organic nitrogen
(Nbio) content in the mixture was higher. Latter, Zeng et al. (2012a) proposed a correlation to
estimate N losses from the initial NH4+/NH3 content of the composting mixture and the Nbio
where α3=0.213, β3=0.913, Nbio is the organic nitrogen decomposed (g N kg-1 VSinitial) and
(NH4+/NH3)initial is the ammonia content in the initial composting matrix (g N kg-1 VSinitial).
CHAPTER 2. STATE OF THE ART IN COMPOSTING PROCESS
44
Nitrogen losses are also related to the level of carbon present in the initial mixtures and a
negative relationship between C:N and N losses has been found (Liang et al., 2006; Meunchang
et al., 2005; Sanchez-Monedero et al., 2001). Indeed, a carbon source may promote
immobilisation, thus reducing the effects of ammonification (Barrington et al., 2002). However,
according to Li et al. (2013) not all carbon sources are effective in reducing ammonia emissions
and even using readily available carbon compounds, emissions reduction is dependent on the
characteristics of the source.
In what concerns nitrification, it has been a challenge to understand why this process
occurs in the later stages of composting and how to minimise N2O emissions. It has been noted
that high temperatures or low pH due to intense biodegradation inhibit nitrification (Sanchez-
Monedero et al., 2001). However some recent studies revealed the existence of thermophilic
ammonia oxidisers (Jarvis et al., 2009; Yamamoto et al., 2011, 2010) capable of promote
ammonia oxidation during the early days of composting. Hence, it has been suggested that
biodegradation of organic matter might also be responsible for the latter occurrence of
nitrification (Zeng et al., 2013, 2012b), probably because the decomposition of easily
biodegradable organic matter leads to a sharp rise in O2 demand in situ, that limits oxygen
available for ammonia oxidisers.
2.5 Abiotic factors
Aerobic degradation of organic material results from the interaction of processes that
occur in solid, liquid and gaseous phases (Figure 2.5).
Figure 2.5: Schematic interactions involved in solid-liquid-gas phases during composting. Reprinted from Said-Pullicino et al. (2007a) with permission of Elsevier.
The solid phase, constituted by particles that contain organic and inorganic substances,
interacts with aqueous phase. This liquid phase adheres to particles forming a biofilm which
PART A. THESIS SCOPE AND OUTLINE
45
hosts biomass (microorganisms) and the biological processes of organic matter transformation.
The biofilm contains soluble substrate that is oxidised by biomass in the presence of O2 provided
by gaseous phase (Petric and Selimbasic, 2008; Said-Pullicino et al., 2007a). The equilibrium
between the reactions in each phase depends upon a set of abiotic factors, namely substrate
biodegradability, moisture, free air space, nutrients, oxygen and pH.
2.5.1. Substrate biodegradability
Organic matter present in composting mixture is the main source of substrate to the
microorganisms. Its properties determines the biological reactions rate (Berthe et al., 2007), and
thus the length of the composting temperature-dependent phases.
In particular, the biodegradable organic matter content is of most importance, once it
influences the self-heating capacity of the mixture to attain thermophilic conditions necessary for
sanitising (Barrena et al., 2011; Ponsá et al., 2010). To categorise the potential biodegradability
of organic wastes (to compare potential self-heating capacity), Barrena et al., (2011) proposed
three main categories based on the measurement of the respiration activity expressed as the rate
where VS represents the volatile solids in the mixture.
In addition, biodegradability of a mixture has been related to its lignin content (Komilis
and Ham, 2003; López et al., 2010; Vikman et al., 2002). Lignin is known to hinder the
biodegradation of cellulose, by preventing ready access of microorganisms to this substrate. This
aspect has implications in terms of composting process evolution namely thermophilic
temperatures, reactions rates and time of composting. A correlation for biodegradable fraction of
volatile solids (B) of a composting mixture has been formulated by Komilis and Ham (2003) as
follows:
LB ×±−±= )003.0(010.0)084.0(850.0 (2.15)
where B represents the biodegradable fraction of VS (in %) and L is the initial lignin content (as
% VS) ranging from 10 to 55%.
In other studies, the cellulose to lignin ratio (C/L) has been used to assess the biological
stability of organic mixtures (Paradelo et al. 2013). In case of C/L is up to 4, this indicates the
organic matter is still potentially biodegradable, but values of 0.5 or less are indicative of
biologically stable substrates (Komilis and Ham, 2003).
CHAPTER 2. STATE OF THE ART IN COMPOSTING PROCESS
46
2.5.2. Moisture
Moisture content is considered as a key factor for successful composting. The main role
of this parameter in the process is to host the biomass activity, by providing a medium for
transport of organic substrate and oxygen diffusion required for metabolic reactions of
microorganisms (Haug, 1993; Hubbe et al., 2010).
High moisture contents may fill the pores between particles, inducing a higher biofilm
thickness that constrains oxygen permeability and diffusion, therefore enhancing anaerobic
clumps (Liang et al., 2003). Contrarily, low moisture conditions can restrict the activities of
microorganisms due to dehydration and provide a physically stable but biological unstable
compost (Bertoldi et al., 1983).
In the literature, there is a wide range of reported moisture values that covers from 25%
to 80% on a wet basis (Ahn et al., 2008a). But the most recommended values are between 50-
70% (Haug, 1993; Liang et al., 2003; Richard and Hamelers, 2002).
Nevertheless, Ahn et al. (2008a) have pointed out that each material has singular
physical, chemical and biological properties that can affect the relationship between moisture
content and the water availability, particle size, porosity, and permeability of the overall
composting mixture. In fact, Richard et al. (2004) verified that in manure-straw composting
mixtures, gas permeability was augmented by increasing the moisture content from 50% to 79%,
apparently due to the aggregations of fines resulting in an increasing proportion of large pores. In
addition, an optimum moisture content was suggested to be 60-80% of the material water
holding capacity (Ahn et al., 2008a).
Moisture regulation of a starting composting mixture is considered to be a simple task,
requiring water addition, when overall moisture is low, or amendment with drying agents when
excessive water is present.
2.5.3. Free air space and particle size
Free air space (FAS) is defined as the ratio of gas filled pore volume (Vg) to total
compost mixture volume (Vt), as indicated in Figure 2.6. However, the total air void volume can
be fractioned into inter-particle and intra-particle volumes. Usually, the voids inside the particle
are considered inaccessible to microorganisms (Alburquerque et al., 2008; Ruggieri et al., 2009).
Nevertheless, in practice the distinction between these two fractions is difficult to establish and
thus the total air void fraction (here assumed as FAS) is the parameter considered (Alburquerque
et al., 2008).
PART A. THESIS SCOPE AND OUTLINE
47
Figure 2.6: Schematic representation of volume fractions in a composting matrix. Adapted from Haug, (1993).
FAS is a physical property that may play an important role during composting, because it
determines not only the air quantity throughout the mixture, but also the mass and heat transport
mechanisms that intrinsically regulate microbial kinetics (Agnew and Leonard, 2003; Richard et
al., 2004).
Suitable FAS is necessary to maintain aerobic conditions and compensate oxygen
depletion that results from substrate degradation. Optimum values for FAS may be in the range
of 30-60% (Ruggieri et al., 2009). Lack of air voids can increase the length of the composting
time and lead to anaerobic conditions. However, excessive FAS allows significant heat and
moisture losses which can also hinder microbial reaction rates. Nevertheless, references to FAS
as high as 85-90% without significant negative impact are reported by Ahn et al. (2008b).
FAS depends not only on the moisture content, as previously stated in section 2.5.2, but
also on the structural characteristics of the materials used such as bulk density (BD) and particle
size. BD represents the mass of material within a given volume and a decrease of air voids
volume is in general associated to high BD. Particle size determines the availability of substrate
in biofilms that host microbial activity and a maximum accessibility is attained with smaller
particle sizes. However, smaller particles reduce FAS and therefore a balance between these two
properties must be found for successful composting (Rynk et al., 1992).
Air picnometry is considered to be the most adequate methodology to quantify FAS. The
air volume of a mixture is determined by applying the Boyle’s Law to an air picnometer
constituted by two chambers (Figure 2.7).
Vt: total compost mixture volume;
Vg: gas filled pore volume;
Vw: water filled volume;
Vs: volume of solids.
CHAPTER 2. STATE OF THE ART IN COMPOSTING PROCESS
48
Figure 2.7: Simple representation of air picnometer. Adapted from Agnew et al. (2003).
Those chambers are connected with a valve, so the compressed air vessel with known
volume (Vgc) can be isolated. The sample is placed in the sample vessel and the air vessel is
pressurised to a set pressure (P1). When both chambers are connected in closed system, the air
pressure is allowed to equilibrate (P2). By assuming that in a closed system with moderate
pressures the temperature remains constant, then the term nRT of the ideal gas law remains
constant (Agnew et al., 2003). Boyle’s law can be used to derive the general equation for the
pressure–volume relationships under these two pressure regimes, by assuming that relative
pressure in the reservoir chamber is initially zero:
.��/0 = .&�! (2.16)
where Vt, volume of overall system (compressed air chamber, air volume in sample chamber,
pipes and fittings). By ignoring the air volume of fittings and pipes, Eq (2.16) results in:
�/ = �12�13�13
�/0 (2.17)
where Vg is the volume of gas air voids in the sample.
FAS can be expressed as the ratio of gas filled pore volume of the sample (Vg) to total
sample volume (Vs),
4� = �12�13��5613�%
(2.18)
The unavailability of commercial picnometers with adequate volume to analyse this type
of solid matrices can be a drawback in quantifying FAS. Thus many researchers have been using
self-made picnometers with 1 to 25 L of capacity (Agnew et al., 2003; Ahn et al., 2008b; Berthe
et al., 2007; Richard et al., 2004). Additionally, some theoretical and empirical correlations have
been proposed in the literature to quantify FAS, as detailed in Table 2.5.
PART A. THESIS SCOPE AND OUTLINE
49
Table 2.5: Overview of theoretical and empirical relationships used for FAS determination. Adapted from Alburquerque et al., (2008); Ruggieri et al., (2009).
Equation Reference Observations
The
oret
ical
4� = 1 − 789 :��;<;=
+ ;<×><1;?@
+ ;<���><�1;A%B
C (2.19) Richard et al. (2004) More adequate when bulk densities are higher than 400 kg m-3.
4� = 1 − 789 :<D;=
+ ���<D�1; C (2.20) Agnew and Leonard (2003) -
4� = 1 − :E;=×;<FG×�F=
C − HE;=×���;<��F=
I (2.21)
With �
FG= ><
�F?@+ ���><�
�FA%B
Haug (1993) -
4� = :1 − E;=1;=
C (2.22) Adhikari et al. (2009) -
Em
piri
cal
4� �%� = 100 − 0.0889 × 789 (2.23) Agnew and Leonard (2003) Applicable for high-moisture and/or low density mixtures
4� �%� = 101.84 − 0.0922789 (2.25) Mohee and Mudhoo (2005) Applicable for high-moisture and/or low density mixtures
4� �%� = 91.558 − 0.171378Y (2.26) Mohee and Mudhoo (2005) Applicable for high-moisture and/or low density mixtures
BDd: dry bulk density; BDw: wet bulk density; DM: dry matter fraction; Dw: water density (1000 kg m-3); MC: moisture fraction; OM: organic matter fraction; PD: particle density; PDw: wet particle density; PDOM: organic matter particle density (1600 kgm-3); PDash: ash particle density (2500 kgm-3); SGw: water specific gravity; SGOM: organic matter specific gravity (1.0); SGash: ash specific gravity (2.5).
According to Ruggieri et al., (2009) when air picnometry to FAS quantification is not
possible, equations (2.19), (2.23) and (2.25) are considered to be adequate alternatives, taking
into account the observations indicated in Table 2.5.
2.5.4. C:N ratio
Carbon and nitrogen are the most important nutrients for microbial decomposition.
Carbon is the main energy source and the basic building block for growth, while nitrogen is a
key element of proteins, amino acids and enzymes necessary for cell synthesis and function
(Haug, 1993; Rynk et al., 1992).
Therefore, composting is mainly dependent on the relative proportion of carbon and
nitrogen (C:N ratio) in a starting mixture. If nitrogen is limiting (high C:N ratio), development of
microbial populations will be impaired and the available carbon will be slowly decompose, thus
extending the needed composting period. On the other hand, excess nitrogen (low C:N ratio) will
allow that available carbon to be fully used, without complete nitrogen stabilisation. In these
conditions, nitrogen losses by volatilisation or leaching may be enhanced (Gajalakshmi and
Abbasi, 2008).
CHAPTER 2. STATE OF THE ART IN COMPOSTING PROCESS
50
An initial C:N ratio ranging from 25-30 is often considered optimum for composting
evolution (Abdullah and Chin, 2010; Hamoda et al., 1998; Huang et al., 2006). Although C:N
ratios from 20 to 40 are also considered adequate (Rynk et al., 1992).
These ratios are established assuming that both carbon and nitrogen are relatively
biodegradable. However in practice, C and N content are quantified by chemical analysis, which
does not necessarily reflect the bioavailable content of these elements. According to Haug (1993)
most of nitrogen is relatively biodegradable, since it is mainly present in the form of proteins. On
the contrary, carbon bioavailability is dependent on the nature of bounds in the different
compounds, which in certain cases can be highly resistant to biological degradation.
For the formulation of balanced mixtures that can potentiate nitrogen preservation during
composting, C:N ratio must be based on aerobic biodegradable carbon (Sánchez, 2007). In fact,
De Guardia et al. (2010a) concluded that chemical C:N ratio may not allow to predict the amount
of organic matter biodegradable during composting.
A methodology to determine aerobic biodegradable organic carbon (BOC) has been
proposed by Puyuelo et al. (2011) by studying sixteen organic solid wastes from different origins
(manures, municipal solid wastes and their organic fraction, sludge and pruning wastes). BOC
determination consisted in a small scale respirometric test (150 g of sample) where CO2 liberated
during aerobic degradation of organic matter was monitored and assumed to be a direct measure
of the aerobic biodegradable carbon. Results indicated that all samples presented BOC:N ratios
significantly lower that C:N values (representing 6 to 60% of the C:N ratio based on total
organic carbon (TOC) measure) which supported the recommendations to use BOC:N, instead of
C:N. In practice, differences between BOC:N and C:N can justify the fact that a higher C:N ratio
does not always indicate prevention of N loss during composting of organic wastes (Liang et al.,
2006). Nevertheless, the time of essay necessary to quantify BOC can be long (25 days or more)
which represents a drawback in comparison to TOC determination. Therefore, an alternative
method to estimate BOC in a short period of time is still necessary.
2.5.5. Aeration
In aerobic processes, oxygen concentration is a critical factor that influences microbial
growth, maintenance and synthesis (Garcia-Ochoa et al., 2010). During composting, air must be
provided not only to satisfy the oxygen demand for organic matter oxidation, but also to ensure
oxygen does not become limiting leading to anaerobic conditions (Kulcu and Yaldiz, 2004).
PART A. THESIS SCOPE AND OUTLINE
51
Stoichiometric oxygen demand may vary between 1.2 to 4.0 g of O2 per gram of
biodegradable volatile solids and a pore space minimum oxygen concentration of 5% (v/v) is
necessary to assure aerobic conditions (Haug, 1993).
In addition, aeration removes heat, water vapour and other gases from the composting
matrix. Heat removal can be necessary to prevent high temperatures that hamper biological
activity. Moisture removal, by means of evaporative cooling, is also required to avoid water
accumulation between pore space, which constrains oxygen permeability and diffusion.
Nevertheless, the balance between the aeration rate and water/heat removal is not an easy task
and depends on the stage of composting. The initial stages are characterised by high oxygen
consumption (high aeration rates), while during maturation phase air flow rate can be much
smaller.
Main aerations methods are based on natural convection or forced aeration (Haug, 1993)
and different control strategies have been used/tested to regulate the aeration rate throughout the
composting process, as indicated in Table 2.6.
According to Papadimitriou et al. (2010), aeration rate is the most significant manipulated
parameter in composting, since it directly affects a wide number of parameters such as
temperature gradients, water availability, O2 concentration, reaction rate and moisture gradient.
Table 2.6: Brief description of control systems to regulate aeration rate in composting. Aeration rate controlling strategies
Description References
Feedback control based on O2 content
Control signal is provided by oxygen sensors to adjust inlet airflow rate and maintain a set point for O2. Several set point ranges have been recommended: 10-18%, 15-20%. Also, outlet oxygen gas levels between 5-15% are suggested.
de Bertoldi et al. (1988); Ekinci et al. (2006); Magalhães et al. (1993); Puyuelo et al. (2010)
Feedback control based on temperature
If temperature exceeds the set point, aeration rates are increased to maintain a desired temperature. On the other hand, when temperature is lower than set point, air flow rates are reduced or air can be provided in an on/off sequence. Usual threshold lays between 50-60ºC.
Bari and Koenig (2001); Bari et al. (2000); Ekinci et al. (2006)
Feedback control based on oxygen uptake rate
Biological activity is evaluated through the continuous measure of the oxygen uptake rate (OUR). The control loop determines variations between consecutive OUR measures and evaluates if those variations are associated with an increase, decrease or constant airflow.
Puyuelo et al. (2010)
2.5.6. pH
pH of the substrate matrix may change as result of the several biochemical
transformations to which organic matter is exposed. These alterations may affect the type and
activity of the microorganisms involved (Gajalakshmi and Abbasi, 2008). Bacteria prefer pH
near neutrality (6-7.5) and fungi develop better in slightly acidic environments although, they are
CHAPTER 2. STATE OF THE ART IN COMPOSTING PROCESS
52
more tolerable to a wider range of pH (5.5-8.0) than bacteria (Bertoldi et al., 1983; Zorpas et al.,
2003).
Starting from a neutral mixture (pH 7), normal evolution of pH during composting is
reported to present an initial drop to acidic values, as consequence of volatile fatty acids (VFA)
formation and poor buffer properties of the mixture. However, the presence of VFA is transitory,
since as the process evolves they are then consumed and ammonification increases. So, usually
pH rises towards 8 or even 9 (Gajalakshmi and Abbasi, 2008; Rynk et al., 1992). While pH
remains acidic, a reduction on the degradations rates and delay of the thermophilic phase are
observed. On the other hand, when pH reaches alkaline values, conditions for ammonia
volatilisation are favoured if organic matrix temperatures are thermophilic (Pagans et al., 2006).
In some studies lime was added to starting mixtures for preventing initial drop of pH to
acidic values (Fang and Wong, 1999; Gabhane et al., 2012; Singh and Kalamdhad, 2013; Wong
et al., 2009) which enhanced degradation rates. Nevertheless, this strategy must be cautiously
used, since it can directly affect the acid-base equilibrium that regulate nitrogen conservation by
increasing ammonia losses. Therefore, in practice pH control is not an easy task.
2.6. Compost quality criteria
Final composting products may offer many potential benefits, including soil amendment
and other environmental applications. Indeed, compost is commonly used to improve physical,
biological and chemical soil properties, because it can increase soil organic matter, reduce
erosion, enhance water retention capacity and pH buffer capacity. In addition, compost may also
In this scope, the main question is “what defines the quality of composting end-product
for soil amendment and which are the parameters that reflect that quality?”
According to Bernal et al. (2009) composting end-products must present “…a high
degree of stability or maturity, which implies a stable OM content and the absence of phytotoxic
compounds and plant or animal pathogens”. Nevertheless stability and maturity are two distinct
concepts:
1) Stability refers to “…the extent to which readily biodegradable organic matter has
decomposed…” (Adani et al., 2006; Komilis, 2015; Wichuk and McCartney, 2010) and
is determined by indices of microbial activity. However, microbial decomposition can be
inhibited by other factors than low amount of biodegradable organic material, like lack of
nutrients, low moisture content or even inhibitory substances. Therefore, Komilis (2015)
PART A. THESIS SCOPE AND OUTLINE
53
proposes that stability would be better defined as “the resistance against further microbial
decomposition as long as there is no inhibition by other factors not relevant to organic
matter”.
2) Maturity is defined as the “…degree or level of completeness of composting …” without
“ … a negative effect on seed germination or plant growth” (Bernal et al., 2009). This
means that maturity is an agronomic parameter, meaning that a mature compost should
be non-phytotoxic to plants, but ideally should be beneficial to their growth (Komilis,
2015).
A set of parameters has been indicated in the literature to assess compost quality, though
it is acceptable that “quality” cannot be established by a single property (Bernal et al., 2009;
Komilis, 2015). Figure 2.8 shows an overview about parameters to assess compost quality.
Typically, the biological-microbiological parameters are allied with the term ‘‘stability’’,
while the seed/plant growth indexes are related with ‘‘maturity’’. However, the association of the
physico-chemical properties cannot be clearly associated to these terms. (Komilis, 2015).
Figure 2.8: Overview of parameters proposed to assess compost quality. Adapted from Bernal et al. (2009) and Komilis (2015).
Compost physical appearance may provide a general idea of the extent of decomposition
and maturity of the material, by presenting a black dark colour with an earthy odour, soil-like
texture and no recognisable substrate particle (Adhikari et al., 2009; Iqbal et al., 2010; Mohee
and Mudhoo, 2005; Neklyudov et al., 2006). Nevertheless, these properties do not deliver a
quantitative information about the maturity level achieved by the compost (Bernal et al., 2009).
CHAPTER 2. STATE OF THE ART IN COMPOSTING PROCESS
54
Chemical properties are widely taken into consideration for establishing compost
maturity degree, namely C:N ratio, cation exchange capacity, mineral nitrogen and humic
substances (Bernal et al., 2009).
C: N ratio is frequently stated as a maturity parameter, because it is used to evaluate the
progress of composting, and it should decline as process evolves. In that scope, starting from a
C:N balanced mixture, the final composting end-product should exhibit a C:N ratio less than 20
or even between 10 to15, which is the value for stable soil organic matter (de Varennes, 2003;
Gajalakshmi and Abbasi, 2008). In fact, when an immature compost with a higher C:N ratio is
added to soil, the microorganisms will appropriate some of the soil available nitrogen to
transform the organic carbon of the compost, which may cause a plant nitrogen deficit.
Nevertheless, some studies refer that C:N is not an adequate indicator of maturity (Goyal et al.,
2005; Komilis, 2015), since C:N ratio of the mature compost is greatly affected by
characteristics of the mixture, namely in terms of carbon biodegradability, as stated in section
2.5.4 and no limit value can be defined for general application. Goyal et al. (2005) emphasised
that the decrease of C:N ratio along with other chemical properties of the composts, can be taken
as a reliable parameter for compost maturity assessment.
Cation exchange capacity (CEC) represents the maximum quantity of total cations that a
matrix can adsorb or exchange at a given pH. As composting progresses and organic matter is
humified, more carboxyl and phenolic functional groups are formed and CEC is increased.
Minimum values of CEC for mature composts are described to be 60 to 67 cmol kg-1 on a dry
ash free basis (Harada and Inoko, 1980; Jiménez and García, 1992).
The ratio between the mineral forms of nitrogen has been also used as a maturity criteria.
In fact, during the early stages of composting, ammonium is released by ammonification and
then through the maturation phase it can be nitrified to nitrate. Therefore, immature composting
products can present high N-NH4+:N-NO3
- ratio, while as maturation proceeds there is a sink of
N-NH4+ with a parallel increase of nitrate and consequent depletion of N-NH4+:N-NO3
-. A value
of 0.16 has been established by Bernal et al. (1998) to describe a mature compost. However, this
ratio is only useful when the amount of available nitrogen is high and thus a limit of
concentration for nitrate of 50 mg NO3- kg -1 fresh weight has been suggested (Wichuk and
McCartney, 2010). Additionally, the individual concentration of NH4+ has been indicated as a
maturity index and a limit value of 400 mg N-NH4+ was proposed by Zuconni and de Bertoldi
(1987).
The degree of organic matter humification is considered to be an important criterion of
maturity and stability. For that purpose, humification indexes associated to humic substances
PART A. THESIS SCOPE AND OUTLINE
55
quantities and fractioning have been established and are summarised in Table 2.7. Nevertheless,
these indexes are not useful for all composts, since their final values depend on the properties of
the materials used in the starting composting mixture (Bernal et al., 2009). In particular, some
wastes like manure (Bernal et al., 1998; Bustamante et al., 2008b; Paredes et al., 2000) or
anaerobic digestates (Bustamante et al., 2012) present humification indexes, at the beginning of
the composting, higher than the limits indicated in Table 2.7 and therefore maturity can be
established using these guidelines. As alternative, evolution of humification parameters during
composting (that are expected to increase) is considered a good indicator of organic matter
stabilisation and maturation, but a single value cannot be defined (Bernal et al., 2009; Wichuk
and McCartney, 2010).
Table 2.7: Humification indexes for evaluation of compost maturity degree. Adapted from Jiménez and García (1992); Liu and Hue (1995).
Humification index Calculation expression Optimal value for acceptable degree of maturity
Humification ratio – HR Z* = D[\]^>D × 100 (2.27)
Humification index – HI Z_ = D`a^>D × 100 (2.28) >13%
Percentage of humic acids – PHA .Z = D`aD[\]
× 100 (2.29) >62%
Polimerisation degree – DP 8. = D`aDba
(2.30) >1.6
Fulvic acid concentration - CFA - ≤12.5 g kg-1
Extractable carbon - Cext - ≤60 g kg-1 ≥6 g g-1 water soluble organic carbon
Cext – NaOH extractable carbon; CHA – carbon associated to extractable humic acids; CFA – carbon associated to extactable fulvic acids; TOC – total organic carbon in solid sample.
Biological tests are also considered important for estimating quality of composting end-
products. Aerobic respiration rates have been widely used for assessing compost stability and
biological activity. They are based on assessing the heat released (self-heating test) or on
determining either the O2 uptake or the CO2 production from the biological and chemical activity
of a compost sample (Gómez et al., 2006). An equivalency between CO2 production and self-
heating test is presented in Table 2.8.
Table 2.8: Relationship between respirometric tests. Adapted from Gómez et al. (2006).
CO2 production (mg CO2 g-1 C d-1) Respiration rate Self-heating grade
equivalent Material status
0-2 Very slow V Stable
2-8 Moderately slow IV-III Stable
8-15 Medium II-I Fresh
15-25 Medium-high I Fresh
>25 High I Raw
CHAPTER 2. STATE OF THE ART IN COMPOSTING PROCESS
56
Concerning O2 consumption tests, values less than 0.5 mg O2 g-1 VS h-1 are referred to
stable materials (Gómez et al., 2006). These tests are indicative of the biodegradability level of
organic matter still present in the final compost and which is inversely associated to the stability
level (Bernal et al., 2009; Wichuk and McCartney, 2010).
Biochemical reactions during composting are catalysed by enzymes and their activity can
be related with the level of organic matter stability (Gajalakshmi and Abbasi, 2008; Wichuk and
McCartney, 2010). In this scope, dehydrogenases (DH) are involved in the oxidation of glucose
and the measurement of its activity has been used to assess the microbial activity, due to DH role
in the microbial respiratory chain (Tiquia et al., 2002). The dehydrogenase activity is considered
to be a general index of biological activity (Vargas-García et al., 2010) which is expected to
decrease as organic matter is transformed into more stable forms. Although enzymatic activity is
a relatively simple and fast determination, Wichuk and McCartney (2010) pointed out that
enzymatic activities in stable composts are dependent of the feedstock’s origin, thus making
difficult to set a limiting value.
Phytotoxicity tests are also used to appraise compost maturity degree. Phytotoxicity is
associated with the phenomenon of accumulation in plant tissues of potentially harmful
that might impair normal growth and development (Tiquia et al., 1996).
Phytotoxicity assays are classified into germination and growth tests (Bernal et al., 2009).
Germination tests are capable of providing information about the presence or not of significant
quantities of phytotoxins in a compost, are rapid to perform (48-76 hours) and widely used
(Gajalakshmi and Abbasi, 2008). On the other hand, plant growth essays provide information
about compost effect after the development of plant (roots and elongation). But these tests are
more time consuming (10-12 days). In general, through phytotoxicity tests is not possible to
identify the specific substance that is present in final compost, and only information about the
overall acceptability of the compost is obtained. Germination index (GI) is a lumped parameter
often used to evaluate phytotoxicity and values greater than 50% are indicative of a phytotoxin-
free compost (Bernal et al., 2009). But other values are reported for safe soil application, namely
60% (Gómez-Brandón et al., 2008) and 80% (Tiquia and Tam, 1998).
Biological tests may also encompass sanitation degree of final compost by evaluating the
presence of pathogens. Salmonella spp and E. coli are the indirect indicator species mostly
determined. E.coli is usually investigated when faecal materials are used in the starting mixture.
Salmonella may be present in food wastes and in raw materials with an animal origin
(Bustamante et al., 2008a). It is generally accepted that in mature composts, Salmonella spp.
PART A. THESIS SCOPE AND OUTLINE
57
must be absent in 25 g of compost and E. coli must not exceed 1000 colony forming unit (cfu)
per g of compost (Noble et al., 2009).
In summary, the establishment of the compost quality is of utmost importance to
potentiate composting end-products value for soil application. In practice, despite the recognised
importance, there is still lacking an adequate integration of the more reliable parameters for
quality classification (Komilis, 2015). Nevertheless, quality standards are being defined.
According to technical proposal of the end-of-waste criteria, in Europe, on biodegradable waste
subject to biological treatment (JRC - European Commission, 2014) there are several national
compost quality standards, but a harmonisation of the criteria established is still required. In fact,
there are some European countries where the compost quality assurance is required or promoted
by legislation or regulatory authorities (Luxemburg, Spain and Belgium), whilst in others
countries quality declaration is purely voluntary or even inexistent. In general, compost quality
regulations or schemes include minimum quality requirements for achieving desired levels of
health and environmental protection, like:
1) minimum organic matter content, to ensure basic usefulness and to prevent dilution
with inorganic materials;
2) sufficient stability/maturity;
3) absence of certain pathogens that pose health risks;
4) limited amount of macroscopic impurities (as a basic requirement for usefulness and to
limit the risks of injuries);
5) concentrations of pollutants (mainly heavy metals and specific organic pollutants).
Nevertheless, the limits set for each requirement differ from country to country, as well
as the guidelines for compliance testing (namely number of tests, protocols for sampling,
analysis, etc). In this scope, efforts to establish an European harmonised standard for composting
end-product quality are ongoing and to the author’s best knowledge the lasted proposed criteria
for compost quality are the ones presented in Table 2.9.
CHAPTER 2. STATE OF THE ART IN COMPOSTING PROCESS
58
Table 2.9: European proposed quality criteria for composting end-products.
Adapted from JRC - European Commission (2014). Parameter Value Comment Minimum organic content 15% (dry weight basis) Minimum content after composting phase
and prior to any mixing with other materials; limit established to prevent dilution with mineral components like sand or soil
Stability -Respirometirc index of maximum 25 mmol O2 kg-1 organic matter h-1, measured according to EN 16087-1; -Minimum Rottegrad III, IV or V (self-heating test temperature rise of maximum 30ºC above ambient temperature) measured according to EN 16087-2
A minimum stability should avoid unwanted emissions during transport and storage and prevent materials from entering the market without proper treatment.
Pathogens content No Salmonella spp in 25g sample Maximum 1000 CFU of E. Coli in 1g of fresh sample
Requirement to be complemented with process temperature-time criteria (as detailed in Table 2.3).
Viable weeds and plant propagules
2 viable weed seeds L-1 of compost Requirement to be complemented with process temperature-time criteria (as detailed in Table 2.3).
Macroscopic impurities > 2 mm
0.5 % (dry weight basis) There is a need to distinguish natural impurities from man-made impurities (glass, metal and plastics).
Maximum content after composting phase and prior to any mixing with other materials
Organic pollutants PAH 16
6 mg kg-1 dry weight basis
Maximum content after composting phase and prior to any mixing with other materials
PAH16: sum of 16 US EPA priority list polycyclic aromatic hydrocarbons
2.7. Compost utilisation
Composting of organic wastes is an important beneficial recycling method and the soil
application of compost end-product can assume different suitable uses. Figure 2.9 provides an
overview of compost use in Europe.
By far, agriculture and landscaping are the main application areas for compost. The
potential of final compost to enhance soil quality in terms of physical, chemical and biological
characteristics makes composting end-products attractive for these uses.
PART A. THESIS SCOPE AND OUTLINE
59
Figure 2.9: Composting end-products use for soil application. Adapted from JRC - European Commission (2014).
Nevertheless, several authors highlight that compost concentration in some nutrients,
especially nitrogen, cannot be sufficient to provide a complete nutritional support for crops
(Gajalakshmi and Abbasi, 2008; Hargreaves et al., 2008; Iglesias-Jimenez and Alvarez, 1993)
because the N fraction that is available for plants is relative small in comparison with mineral
fertilisers. Therefore, the use of compost with a suitable and controller supplement of N
fertilisers are recommend with beneficial effects for soil-plant system (Iglesias-Jimenez and
Alvarez, 1993).
Application of composting end-products in the landscaping represents also an important
use. In particular for the remediation of brownfield areas that exhibit very degraded top soils,
compost incorporation is considered to provide finely texture particles capable of retaining water
and nutrients (Jones et al., 2009).
In addition to heavy metals contaminated sites for which remediation strategies are
generally based on the extraction or stabilisation of the pollutants (Cunha-Queda et al., 2010;
Farrell and Jones, 2009), special attention has been focused on the approaches that promote the
stabilisation of the contaminants, since they are less onerous and do not affect soil structure as
extraction methods do (Mench et al., 2003).
In this context, composts obtained from several organic wastes have been studied and
considered for heavy-metal immobilisation in soils, by inducing metal precipitation at alkaline
pH level or by promoting metals sorption into the organic matter matrix (Cunha-Queda et al.,
2010; Farrell and Jones, 2009; Paradelo et al., 2011; Park et al., 2011; Tandy et al., 2009;
Theodoratos et al., 2000). For example, soil application of poultry compost decreased Cd uptake
of plants by 56-62.5% and green waste compost reduced Cd and Zn leaching from soil by 48%
(Park et al., 2011).
CHAPTER 2. STATE OF THE ART IN COMPOSTING PROCESS
60
2.8. References
Abdullah, N., Chin, N.L., 2010. Simplex-centroid mixture formulation for optimised composting of kitchen waste. Bioresour. Technol. 101, 8205–10.
Adani, F., Ubbiali, C., Generini, P., 2006. The determination of biological stability of composts using the Dynamic Respiration Index: the results of experience after two years. Waste Manag. 26, 41–8.
Adhikari, B.K., Barrington, S., Martinez, J., King, S., 2009. Effectiveness of three bulking agents for food waste composting. Waste Manag. 29, 197–203.
Agnew, J., Leonard, J., 2003. The physical properties of compost. Compost Sci. Util. 11, 238–264.
Agnew, J., Leonard, J., Feddes, J., Feng, Y., 2003. A modified air pycnometer for compost air volume and density determination. Can. Biosyst. Eng. 45, 6.27–6.35.
Agnolucci, M., Cristani, C., Battini, F., Palla, M., Cardelli, R., Saviozzi, A., Nuti, M., 2013. Microbially-enhanced composting of olive mill solid waste (wet husk): bacterial and fungal community dynamics at industrial pilot and farm level. Bioresour. Technol. 134, 10–16.
Ahn, H., Richard, T., Glanville, T., 2008b. Laboratory determination of compost physical parameters for modeling of airflow characteristics. Waste Manag. 28, 660–670.
Alburquerque, J., Gonzálvez, J., Tortosa, G., Baddi, G., Cegarra, J., 2009. Evaluation of “alperujo” composting based on organic matter degradation, humification and compost quality. Biodegradation 20, 257–70.
Alburquerque, J., Mccartney, D., Yu, S., Brown, L., Leonard, J., 2008. Air Space in Composting Research: A Literature Review. Compost Sci. Util. 16, 159–170.
Amir, S., Jouraiphy, A., Meddich, A., 2010. Structural study of humic acids during composting of activated sludge-green waste: Elemental analysis, FTIR and 13 C NMR. J. Hazard. Mater. 177, 524–529.
Bari, Q., Koenig, A., 2001. Effect of air recirculation and reuse on composting of organic solid waste. Resour. Conserv. Recycl. 33, 93–111.
Bari, Q.H., Koenig, A., Guihe, T., 2000. Kinetic analysis of forced aeration composting -I. Reaction rates and temperature. Waste Manag. Res. 18, 303–312.
Barje, F., El Fels, L., El Hajjouji, H., Amir, S., Winterton, P., Hafidi, M., 2012. Molecular behaviour of humic acid-like substances during co-composting of olive mill waste and the organic part of municipal solid waste. Int. Biodeterior. Biodegradation 74, 17–23.
Barje, F., El Fels, L., El Hajjouji, H., Winterton, P., Hafidi, M., 2013. Biodegradation of organic compounds during co-composting of olive oil mill waste and municipal solid waste with added rock phosphate. Environ. Technol. 1–11.
Barrena, R., Gea, T., Ponsá, S., Ruggieri, L., Artola, A., Font, X., Sánchez, A., 2011. Categorizing Raw Organic Material Biodegradability Via Respiration Activity Measurement : A Review. Compost Sci. Util. 19, 105–113.
Barrington, S., Choinière, D., Trigui, M., Knight, W., 2002. Effect of carbon source on compost nitrogen and carbon losses. Bioresour. Technol. 83, 189–194.
Bernal, M.P., Alburquerque, J.A., Moral, R., 2009. Composting of animal manures and chemical criteria for compost maturity assessment . A review. Bioresour. Technol. 100, 5444–5453.
PART A. THESIS SCOPE AND OUTLINE
61
Bernal, M.P., Paredes, C., Sánchez-Monedero, M.A., Cegarra, J., 1998. Maturity and stability parameters of composts prepared with a wide range of organic wastes. Bioresour. Technol. 63, 91–99.
Berthe, L., Druilhe, C., Massiani, C., Tremier, a., de Guardia, a., 2007. Coupling a respirometer and a pycnometer, to study the biodegradability of solid organic wastes during composting. Biosyst. Eng. 97, 75–88.
Bertoldi, M., Vallini, G., Pera, A., 1983. The biology of composting: a review. Waste Manag. Res. 1, 157–176.
British Standard Institute, 2011. Specification for composted materials. United Kingdom.
Bustamante, M., Alburquerque, J., Restrepo, A., de la Fuente, C., Paredes, C., Moral, R., Bernal, M., 2012. Co-composting of the solid fraction of anaerobic digestates, to obtain added-value materials for use in agriculture. Biomass and Bioenergy 43, 26–35.
Bustamante, M., Moral, R., Paredes, C., Vargas-Gárcia, M., Suárez-Estrella, F., Moreno, J., 2008a. Evolution of the pathogen content during co-composting of winery and distillery wastes. Bioresour. Technol. 99, 7299–7306.
Bustamante, M., Paredes, C., Marhuenda-Egea, F., Pérez-Espinosa, A., Bernal, M., Moral, R., 2008b. Co-composting of distillery wastes with animal manures: carbon and nitrogen transformations in the evaluation of compost stability. Chemosphere 72, 551–557.
Castaldi, P., Alberti, G., Merella, R., Melis, P., 2005. Study of the organic matter evolution during municipal solid waste composting aimed at identifying suitable parameters for the evaluation of compost maturity. Waste Manag. 25, 209–13.
Cayuela, M.L., Sánchez-Monedero, M.A., Roig, A., Sinicco, T., Mondini, C., 2012. Biochemical changes and GHG emissions during composting of lignocellulosic residues with different N-rich by-products. Chemosphere 88, 196–203.
CCME Guidelines for Compost Quality, 2005. Guidelines for Compost Quality. Canada.
Chang, J.I., Hsu, T.-E., 2008. Effects of compositions on food waste composting. Bioresour. Technol. 99, 8068–74.
Charest, M., 2004. Dynamics of water-soluble carbon substances and microbial populations during the composting of de-inking paper sludge. Bioresour. Technol. 91, 53–67.
Chroni, C., Kyriacou, A., Lasaridi, K., 2012. Abiotic parameters and microbial counts as stability indicators during composting of organic waste, in: Orbit - Global Assessment for Organic Resources and Waste Management. Rénnes, pp. 55–61.
Colón, J., Martínez-Blanco, J., Gabarrell, X., Artola, A., Sánchez, A., Rieradevall, J., Font, X., 2010. Environmental assessment of home composting. Resour. Conserv. Recycl. 54, 893–904.
Contreras-Ramos, S.M., Alvarez-Bernal, D., Trujillo-Tapia, N., Dendooven, L., 2004. Composting of tannery effluent with cow manure and wheat straw. Bioresour. Technol. 94, 223–8.
Cunha-Queda, C., Alvarenga, P., Nobre, A., Varennes, A. de, 2010. Effect of Municipal Solid Waste Compost on Mine Soils As Evaluated by Chemical, Biological And Biochemical Properties of Soil. Compost Sci. Util. 18, 89–96.
De Bertoldi, M., Rutili, A., Citterio, B., Civilini, M., 1988. Composting Management: a New Process Control Through O2 Feedback. Waste Manag. Res. 6 , 239–259.
De Guardia, A., Mallard, P., Teglia, C., 2010a. Comparison of five organic wastes regarding their behaviour during composting: Part 1, biodegradability, stabilization kinetics and temperature rise. Waste Manag. 30, 402–414.
CHAPTER 2. STATE OF THE ART IN COMPOSTING PROCESS
62
De Guardia, A., Mallard, P., Teglia, C., Marin, A., Le Pape, C., Launay, M., Benoist, J.C., Petiot, C., 2010b. Comparison of five organic wastes regarding their behaviour during composting: part 2, nitrogen dynamic. Waste Manag. 30, 415–25.
De Guardia, A., Petiot, C., Rogeau, D., Druilhe, C., 2008. Influence of aeration rate on nitrogen dynamics during composting. Waste Manag. 28, 575–87.
De Varennes, A., 2003. Produtividade dos solos e ambiente, 1st ed. Escolar Editora, Lisboa, Portugal.
Droussi, Z., D’orazio, V., Provenzano, M., Hafidi, M., Ouatmane, A., 2009. Study of the biodegradation and transformation of olive-mill residues during composting using FTIR spectroscopy and differential scanning calorimetry. J. Hazard. Mater. 164, 1281–1285.
Echeverria, M.C., Cardelli, R., Bedini, S., Colombini, A., Incrocci, L., Castagna, A., Agnolucci, M., Cristani, C., Ranieri, A., Saviozzi, A., Nuti, M., 2012. Microbially-enhanced composting of wet olive husks. Bioresour. Technol. 104, 509–517.
Ekinci, K., Keener, H.M., Akbolat, D., 2006. Effects of feedstock, airflow rate, and recirculation ratio on performance of composting systems with air recirculation. Bioresour. Technol. 97, 922–32.
Fang, M., Wong, J.W.C., 1999. Effects of lime amendment on availability of heavy metals and maturation in sewage sludge composting. Environ. Pollut. 106, 83–89.
Farrell, M., Jones, D., 2009. Critical evaluation of municipal solid waste composting and potential compost markets. Bioresour. Technol. 100, 4301–4310.
Fogarty, a M., Tuovinen, O.H., 1991. Microbiological degradation of pesticides in yard waste composting. Microbiol. Rev. 55, 225–33.
Francou, C., Linères, M., Derenne, S., Villio-Poitrenaud, M. Le, Houot, S., 2008. Influence of green waste, biowaste and paper-cardboard initial ratios on organic matter transformations during composting. Bioresour. Technol. 99, 8926–34.
Gabhane, J., William, S.P.M.P., Bidyadhar, R., Bhilawe, P., Anand, D., Vaidya, A.N., Wate, S.R., 2012. Additives aided composting of green waste: effects on organic matter degradation, compost maturity, and quality of the finished compost. Bioresour. Technol. 114, 382–8.
Gajalakshmi, S., Abbasi, S. a., 2008. Solid Waste Management by Composting: State of the Art. Crit. Rev. Environ. Sci. Technol. 38, 311–400.
Garcia-Ochoa, F., Gomez, E., Santos, V.E., Merchuk, J.C., 2010. Oxygen uptake rate in microbial processes: An overview. Biochem. Eng. J. 49, 289–307.
Gestel, K. Van, Mergaert, J., Swings, J., Coosemans, J., Ryckeboer, J., 2003. Bioremediation of diesel oil-contaminated soil by composting with biowaste. Environ. Pollut. 125, 361–368.
Gomes, A.P., Pereira, F.A., 2008. Mathematical modelling of a composting process, and validation with experimental data. Waste Manag. Res. 26, 276–287.
Gómez, R.B., Lima, F. V, Ferrer, A.S., 2006. The use of respiration indices in the composting process: a review. Waste Manag. Res. 24, 37–47.
Gómez-Brandón, M., Lazcano, C., Domínguez, J., 2008. The evaluation of stability and maturity during the composting of cattle manure. Chemosphere 70, 436–44.
Goyal, S., Dhull, S.K., Kapoor, K.K., 2005. Chemical and biological changes during composting of different organic wastes and assessment of compost maturity. Bioresour. Technol. 96, 1584–91.
PART A. THESIS SCOPE AND OUTLINE
63
Grigatti, M., Cavani, L., Ciavatta, C., 2011. The evaluation of stability during the composting of different starting materials: comparison of chemical and biological parameters. Chemosphere 83, 41–8.
Grinhut, T., Hadar, Y., Chen, Y., 2007. Degradation and transformation of humic substances by saprotrophic fungi: processes and mechanisms. Fungal Biol. Rev. 21, 179–189.
Guardia, A. De, Petiot, C., Rogeau, D., 2008. Influence of aeration rate and biodegradability fractionation on composting kinetics. Waste Manag. 28, 73–84.
Hachicha, R., Rekik, O., Hachicha, S., Ferchichi, M., Woodward, S., Moncef, N., Cegarra, J., Mechichi, T., 2012. Co-composting of spent coffee ground with olive mill wastewater sludge and poultry manure and effect of Trametes versicolor inoculation on the compost maturity. Chemosphere 88, 677–82.
Hamoda, M., Abuqdais, H., Newham, J., 1998. Evaluation of municipal solid waste composting kinetics. Resour. Conserv. Recycl. 23, 209–223.
Hansgate, A.M., Schloss, P.D., Hay, A.G., Walker, L.P., 2005. Molecular characterization of fungal community dynamics in the initial stages of composting. FEMS Microbiol. Ecol. 51, 209–14.
Harada, Y., Inoko, A., 1980. The measurement of the cation- exchange capacity of composts for the estimation of the degree of maturity. Soil Sci. Plant Nutr. 26, 127–134.
Hargreaves, J., Adl, M., Warman, P., 2008. A review of the use of composted municipal solid waste in agriculture. Agric. Ecosyst. Environ. 123, 1–14.
Harrison, R., 2008. Composting and formation of humic substances, in: Jorgensen, S.E., Fath, B. (Eds.), Encyclopedia of Ecology. Academic Press, Oxford, pp. 713–719.
Haug, R.T., 1993. The practical handbook of compost engineering. CRC-Press, Boca Raton, Florida, USA.
Himanen, M., Hänninen, K., 2011. Composting of bio-waste, aerobic and anaerobic sludges--effect of feedstock on the process and quality of compost. Bioresour. Technol. 102, 2842–52.
Houot, S., Verge-Leviel, C., Poitrenaud, M., 2012. Potential Mineralization of Various Organic Pollutants During Composting. Pedosphere 22, 536–543.
Huang, G.F., Wu, Q.T., Wong, J.W.C., Nagar, B.B., 2006. Transformation of organic matter during co-composting of pig manure with sawdust. Bioresour. Technol. 97, 1834–42.
Hubbe, M., Nazhad, M., Sánchez, C., 2010. Composting as a way to convert cellulosic biomass and organic waste into high-value soil amendments: a review. BioResources 5, 2808–2854.
Iglesias-Jimenez, E., Alvarez, C.E., 1993. Apparent availability of nitrogen in composted municipal refuse. Biol. Fertil. Soils 16, 313–318.
Iqbal, M.K., Shafiq, T., Ahmed, K., 2010. Effect of different techniques of composting on stability and maturity of municipal solid waste compost. Environ. Technol. 31, 205–214.
Jarvis, A., Sundberg, C., Milenkovski, S., Pell, M., Smårs, S., Lindgren, P.-E., Hallin, S., 2009. Activity and composition of ammonia oxidizing bacterial communities and emission dynamics of NH3 and N2O in a compost reactor treating organic household waste. J. Appl. Microbiol. 106, 1502–11.
Jiménez, E.I., García, V.P., 1992. Determination of maturity indices for city refuse composts. Agric. Ecosyst. Environ. 38, 331–343.
Jones, D.L., Chesworth, S., Khalid, M., Iqbal, Z., 2009. Assessing the addition of mineral processing waste to green waste-derived compost: an agronomic, environmental and economic appraisal. Bioresour. Technol. 100, 770–7.
CHAPTER 2. STATE OF THE ART IN COMPOSTING PROCESS
64
JRC - European Commission, 2012. End-of-waste criteria on Biodegradable waste subject to biological treatment (3rd draft).
JRC - European Commission, 2014. End-of-waste criteria on Biodegradable waste subject to biological treatment (technical proposal).
Kang, J., Zhang, Z., Wang, J.J., 2011. Influence of humic substances on bioavailability of Cu and Zn during sewage sludge composting. Bioresour. Technol. 102, 8022–6.
Komilis, D.P., 2006. A kinetic analysis of solid waste composting at optimal conditions. Waste Manag. 26, 82–91.
Komilis, D.P., 2015. Compost quality: Is research still needed to assess it or do we have enough knowledge? Waste Manag. 38, 1–2.
Komilis, D.P., Ham, R.K., 2003. The effect of lignin and sugars to the aerobic decomposition of solid wastes. Waste Manag. 23, 419–23.
Komilis, D.P., Ham, R.K., 2006. Carbon dioxide and ammonia emissions during composting of mixed paper , yard waste and food waste. Waste Manag. 26, 62–70.
Kulcu, R., Yaldiz, O., 2004. Determination of aeration rate and kinetics of composting some agricultural wastes. Bioresour. Technol. 93, 49–57.
Kumar, K.N., Goel, S., 2009. Characterization of Municipal Solid Waste (MSW) and a proposed management plan for Kharagpur, West Bengal, India. Resour. Conserv. Recycl. 53, 166–174.
Lashermes, G., Barriuso, E., 2012. Composting in small laboratory pilots: Performance and reproducibility. Waste Manag. 32, 271–277.
Lhadi, E., Tazi, H., Aylaj, M., Genevini, P., Adani, F., 2006. Organic matter evolution during co-composting of the organic fraction of municipal waste and poultry manure. Bioresour. Technol. 97, 2117–2123.
Lhadi, E.K., Tazi, H., Aylaj, M., Genevini, P.L., Adani, F., 2006. Organic matter evolution during co-composting of the organic fraction of municipal waste and poultry manure. Bioresour. Technol. 97, 2117–23.
Li, Y., Li, W., Liu, B., Wang, K., Su, C., Wu, C., 2013. Ammonia emissions and biodegradation of organic carbon during sewage sludge composting with different extra carbon sources. Int. Biodeterior. Biodegradation 1–7.
Liang, C., Das, K., McClendon, R., 2003. The influence of temperature and moisture contents regimes on the aerobic microbial activity of a biosolids composting blend. Bioresour. Technol. 86, 131–7.
Liang, Y., Leonard, J.J., Feddes, J.J.R., McGill, W.B., 2006. Influence of carbon and buffer amendment on ammonia volatilization in composting. Bioresour. Technol. 97, 748–761.
Liu, J., Xu, X., Li, H., Xu, Y., 2011. Effect of microbiological inocula on chemical and physical properties and microbial community of cow manure compost. Biomass and Bioenergy 35, 3433–3439.
López, M., Huerta-Pujol, O., Martínez-Farré, F.X., Soliva, M., 2010. Approaching compost stability from Klason lignin modified method: Chemical stability degree for OM and N quality assessment. Resour. Conserv. Recycl. 55, 171–181.
Magalhães, A.M.T., Shea, P.J., Jawson, M.D., Wicklund, E.A., Nelson, D.W., 1993. Practical Simulation Of Composting In The Laboratory. Waste Manag. Res. 11, 143–154.
PART A. THESIS SCOPE AND OUTLINE
65
Manios, T., 2004. The composting potential of different organic solid wastes: experience from the island of Crete. Environ. Int. 29, 1079–89.
Mason, I.G., 2006. Mathematical modelling of the composting process : A review. Waste Manag. 26, 3–21.
Mench, M., Bussi, S., Boisson, J., Castaing, E., Ruttens, A., Koe, T. De, Bleeker, P., Assunção, A., Manceau, A., 2003. Progress in remediation and revegetation of the barren Jales gold mine spoil after in situ treatments. Plant Soil 249, 187–202.
Meunchang, S., Panichsakpatana, S., Weaver, R., 2005. Co-composting of filter cake and bagasse; by-products from a sugar mill. Bioresour. Technol. 96, 437–42.
Mohee, R., Mudhoo, a, 2005. Analysis of the physical properties of an in-vessel composting matrix. Powder Technol. 155, 92–99.
Nakasaki, K., Sasaki, M., Shoda, M., Kubota, H., 1985. Change in microbial numbers during thermophilic composting of sewage sludge with reference to CO2 evolution rate. Appl. Environ. Microbiol. 49, 37–41.
Neklyudov, A.D., Fedotov, G.N., Ivankin, A.N., 2006. Aerobic processing of organic waste into composts. Appl. Biochem. Microbiol. 42, 341–353.
Noble, R., Elphinstone, J.G., Sansford, C.E., Budge, G.E., Henry, C.M., 2009. Management of plant health risks associated with processing of plant-based wastes: a review. Bioresour. Technol. 100, 3431–46.
Noble, R., Roberts, S.J., 2004. Eradication of plant pathogens and nematodes during composting : a review. Plant Pathol. 548– 568.
Pagans, E., Barrena, R., Font, X., Sánchez, A., 2006. Ammonia emissions from the composting of different organic wastes. Dependency on process temperature. Chemosphere 62, 1534–42.
Papadimitriou, E.K., Bidlingmaier, W., Gea, T., 2010. Fundamentals in Selecting Input and Output Variables for Composting Process Automatic Controllers. Compost Sci. Util. 18, 6–21.
Paradelo, R., Moldes, A., Barral, M., 2013. Evolution of organic matter during the mesophilic composting of lignocellulosic winery wastes. J. Environ. Manage. 116, 18–26.
Paradelo, R., Villada, A., Barral, M.T., 2011. Reduction of the short-term availability of copper , lead and zinc in a contaminated soil amended with municipal solid waste compost. J. Hazard. Mater. 188, 98–104.
Pare, T., Dinel, H., Schnitzer, M., Dumontet, S., 1998. Transformations of carbon and nitrogen during composting of animal manure and shredded paper. Biol. Fertil. Soils 26, 173–178.
Paredes, C., Bernal, M.P., Cegarra, J., Roig, A., 2002. Bio-degradation of olive mill wastewater sludge by its co-composting with agricultural wastes. Bioresour. Technol. 85, 1–8.
Paredes, C., Bernal, M.P., Roig, a, Cegarra, J., 2001. Effects of olive mill wastewater addition in composting of agroindustrial and urban wastes. Biodegradation 12, 225–34.
Paredes, C., Cegarra, J., Bernal, M.P., Roig, a, 2005. Influence of olive mill wastewater in composting and impact of the compost on a Swiss chard crop and soil properties. Environ. Int. 31, 305–12.
Paredes, C., Roig, A., Bernal, M., Sánchez–Monedero, M., Cegarra, J., 2000. Evolution of organic matter and nitrogen during co-composting of olive mill wastewater with solid organic wastes. Biol. Fertil. Soils 32, 222–227.
Park, J.H., Lamb, D., Paneerselvam, P., Choppala, G., Bolan, N., Chung, J.-W., 2011. Role of organic amendments on enhanced bioremediation of heavy metal(loid) contaminated soils. J. Hazard. Mater. 185, 549–74.
Pepe, O., Ventorino, V., Blaiotta, G., 2013. Dynamic of functional microbial groups during mesophilic composting of agro-industrial wastes and free-living (N2)-fixing bacteria application. Waste Manag.
Petric, I., Selimbasic, V., 2008. Development and validation of mathematical model for aerobic composting process. Chem. Eng. J. 139, 304–317.
Ponsá, S., Gea, T., Sánchez, A., 2010. Different Indices to Express Biodegradability in Organic Solid Wastes. J. Environ. Qual. 39, 706–712.
Puyuelo, B., Gea, T., Sánchez, A., 2010. A new control strategy for the composting process based on the oxygen uptake rate. Chem. Eng. J. 165, 161–169.
Puyuelo, B., Ponsá, S., Gea, T., Sánchez, A., 2011. Determining C/N ratios for typical organic wastes using biodegradable fractions. Chemosphere 85, 653–9.
Richard, T., Veeken, A., de Wilde, V., Hamelers, H., 2004. Air-Filled Porosity and Permeability Relationships during Solid-State Fermentation. Biotechnol. Prog. 20, 1372–1381.
Ruggieri, L., Gea, T., Artola, A., Sánchez, A., 2009. Air filled porosity measurements by air pycnometry in the composting process: a review and a correlation analysis. Bioresour. Technol. 100, 2655–66.
Ryckeboer, J., Cops, S., Coosemans, J., 2002. The fate of plant pathogens and seeds during backyard composting of vegetables, fruit and garden wastes, in: Insam, H., Riddech, N., Klammer, S. (Eds.), Microbiology of Composting. Springer-Verlag, Berlin, p. 632.
Ryckeboer, J., Mergaert, J., Vaes, K., Klammer, S., Clercq, D., Coosemans, J., Insam, H., Swings, J., 2003. A survey of bacteria and fungi occurring during composting and self-heating processes. Ann. Microbiol. 53, 349–410.
Rynk, R., Kamp, M. van de, Willson, G.B., Singley, M.E., Richard, T.L., Kolega, J.J., Gouin, F.R., Lucien Laliberty, J., Kay, D., Murphy, D.W., Hoitink, H.A.J., Brinton, W.F., 1992. On-farm composting handbook. Northeast Regional Agricultural Engineering Service, Ithaca.
Saidi, N., Cherif, M., Jedidi, N., Mahrouk, M., 2008. Evolution of Biochemical Parameters During Composting of Various Wastes Compost. Am. J. Environ. Sci. 4, 332–341.
Said-Pullicino, D., Erriquens, F.G., Gigliotti, G., 2007a. Changes in the chemical characteristics of water-extractable organic matter during composting and their influence on compost stability and maturity. Bioresour. Technol. 98, 1822–31.
Said-Pullicino, D., Gigliotti, G., 2007. Oxidative biodegradation of dissolved organic matter during composting. Chemosphere 68, 1030–40.
Said-Pullicino, D., Kaiser, K., Guggenberger, G., Gigliotti, G., 2007b. Changes in the chemical composition of water-extractable organic matter during composting: distribution between stable and labile organic matter pools. Chemosphere 66, 2166–76.
Sánchez, A., 2007. A kinetic analysis of solid waste composting at optimal conditions . Waste Manag. 27, 854–855.
Sánchez–Monedero, M., Roig, A., 1999. Relationships between water-soluble carbohydrate and phenol fractions and the humification indices of different organic wastes during composting. Bioresour. Technol. 70, 193–201.
PART A. THESIS SCOPE AND OUTLINE
67
Sanchez-Monedero, M., Roig, A., Paredes, C., Bernal, M., 2001. Nitrogen transformation during organic waste composting by the Rutgers system and its effects on pH, EC and maturity of the composting mixtures. Bioresour. Technol. 78, 301–308.
Sánchez-Monedero, M., Serramiá, Civanto, C., Fernández-Hernández, A., Roig, A., 2010. Greenhouse gas emissions during composting of two-phase olive mill wastes with different agroindustrial by-products. Chemosphere 81, 18–25.
Sellami, F., Jarboui, R., Hachicha, S., Medhioub, K., Ammar, E., 2008. Co-composting of oil exhausted olive-cake, poultry manure and industrial residues of agro-food activity for soil amendment. Bioresour. Technol. 99, 1177–88.
Semple, K.T., Reid, B.J., Fermor, T.R., 2001. Impact of composting strategies on the treatment of soils contaminated with organic pollutants. Environ. Pollut. 112, 269–283.
Sharma, V.K., Canditelli, M., Fortuna, F., Cornacchia, G., 1997. Processing of urban and agro-industrial residues by aerobic composting: Review. Energy Convers. Manag. 38, 453–478.
Shen, Y., Ren, L., Li, G., Chen, T., Guo, R., 2011. Influence of aeration on CH4, N2O and NH3 emissions during aerobic composting of a chicken manure and high C/N waste mixture. Waste Manag. 31, 33–8.
Shilev, S., Naydenov, M., 2007. Composting of Food and Agricultural Wastes, in: Oreopoulou, V., Russ, W. (Eds.), Utilization of By-Products and Treatment of Waste in the Food Industry. Springer Science Business Media, New York, pp. 283–301.
Singh, J., Kalamdhad, A., 2013. Effects of lime on bioavailability and leachability of heavy metals during agitated pile composting of water hyacinth. Bioresour. Technol. 138, 148–55.
Sleutel, S., De Neve, S., Prat Roibas, M.R., Hofman, G., 2005. The influence of model type and incubation time on the estimation of stable organic carbon in organic materials. Eur. J. Soil Sci. 56, 505–514.
Stevenson, F.J., 1994. Humus chemistry: genesis, composition, reactions, 2nd ed. John Wiley and Sons.
Strom, P.F., 1985. Identification of thermophilic bacteria in solid-waste composting. Appl. Environ. Microbiol. 50, 906–13.
Sutton, R., Sposito, G., 2005. Critical Review Molecular Structure in Soil Humic Substances : The New View. Environ. Sci. Technol. 39, 9009–9015.
Tandy, S., Healey, J.R., Nason, M.A., Williamson, J.C., Jones, D.L., 2009. Remediation of metal polluted mine soil with compost: co-composting versus incorporation. Environ. Pollut. 157, 690–7.
Theodoratos, P., Moirou, A., Xenidis, A., Paspaliaris, I., 2000. The use of municipal sewage sludge for the stabilization of soil contaminated by mining activities. J. Hazard. Mater. 77, 177–191.
Tian, Y., Chen, L., Gao, L., Michel, F., Wan, C., Li, Y., Dick, W., 2012. Composting of waste paint sludge containing melamine resin as affected by nutrients and gypsum addition and microbial inoculation. Environ. Pollut. 162, 129–137.
Tiquia, S., Tam, N., Hodgkiss, I., 1996. Effects of composting on phytotoxicity of spent pig-manure sawdust litter. Environ. Pollut. 93, 249–256.
Tiquia, S.M., Tam, N.F.Y., 1998. Elimination of phytotoxicity during co-composting of spent pig-manure sawdust litter and pig sludge. Bioresour. Technol. 65, 43–49.
Tiquia, S.M., Wan, J.H.C., Tam, N.F.Y., 2002. Dynamics of yard trimmings composting as determined by dehydrogenase activity, ATP content, arginine ammonification, and nitrification potential. Process Biochem. 37, 1057–1065.
CHAPTER 2. STATE OF THE ART IN COMPOSTING PROCESS
68
Tortosa, G., Alburquerque, J., Ait-Baddi, G., Cegarra, J., 2012. The production of commercial organic amendments and fertilisers by composting of two-phase olive mill waste (“alperujo”). J. Clean. Prod. 26, 48–55.
Tosun, I., Gönüllü, M., Arslankaya, E., Günay, A., 2008. Co-composting kinetics of rose processing waste with OFMSW. Bioresour. Technol. 99, 6143–6149.
Tuomela, M., Vikman, M., Hatakka, A., Itavaara, M., 2000. Biodegradation of lignin in a compost environment : a review. Bioresour. Technol. 72, 169–183.
U.S. Environmental Protection Agency, 2003. Control of Pathogens and Vector Attraction in Sewage Sludge. United States of America.
Uao, P.H., Vizcarra, A.T., Chen, A., Lo, K. V, 1993. Composting of separated solid swine manure. J. Environ. Sci. Heal. . Part A Environ. Sci. Eng. Toxicol. 28, 1889–1901.
Vargas-García, M.C., Suárez-Estrella, F., López, M.J., Moreno, J., 2010. Microbial population dynamics and enzyme activities in composting processes with different starting materials. Waste Manag. 30, 771–8.
Vikman, M., Karjomaa, S., Kapanen, A., Wallenius, K., Itävaara, M., 2002. The influence of lignin content and temperature on the biodegradation of lignocellulose in composting conditions. Appl. Microbiol. Biotechnol. 59, 591–598.
Vinnerås, B., Björklund, A., Jönsson, H., 2003. Thermal composting of faecal matter as treatment and possible disinfection method--laboratory-scale and pilot-scale studies. Bioresour. Technol. 88, 47–54.
Wang, H., Fan, B., Hu, Q., Yin, Z., 2011. Effect of inoculation with Penicillium expansum on the microbial community and maturity of compost. Bioresour. Technol. 102, 11189–11193.
Wei, Y., Liu, Y., 2005. Effects of sewage sludge compost application on crops and cropland in a 3-year field study. Chemosphere 59, 1257–65.
Wichuk, K., Tewari, J., McCartney, D., 2011. Plant Pathogen Eradication During Composting: A Literature Review. Compost Sci. Util. 19, 244–266.
Wichuk, K.M., McCartney, D., 2007. A review of the effectiveness of current time-temperature regulations on pathogen inactivation during composting. J. Environ. Eng. Sci. 6, 573–586.
Wichuk, K.M., McCartney, D., 2010. Compost stability and maturity evaluation — a literature review. Can. J. Civ. Eng. 37, 1505–1523.
Wong, J.W.-C., Fung, S.O., Selvam, A., 2009. Coal fly ash and lime addition enhances the rate and efficiency of decomposition of food waste during composting. Bioresour. Technol. 100, 3324–31.
Xi, B., He, X., Wei, Z., Jiang, Y., Li, M., Li, D., 2012. Effect of inoculation methods on the composting efficiency of municipal solid wastes. Chemosphere 88, 744–750.
Yamamoto, N., Asano, R., Yoshii, H., Otawa, K., Nakai, Y., 2011. Archaeal community dynamics and detection of ammonia-oxidizing archaea during composting of cattle manure using culture-independent DNA analysis. Appl. Microbiol. Biotechnol. 90, 1501–10.
Yamamoto, N., Otawa, K., Nakai, Y., 2010. Diversity and abundance of ammonia-oxidizing bacteria and ammonia-oxidizing archaea during cattle manure composting. Microb. Ecol. 60, 807–815.
Zbytniewski, R., Buszewski, B., 2005. Characterization of natural organic matter (NOM) derived from sewage sludge compost. Part 1: chemical and spectroscopic properties. Bioresour. Technol. 96, 471–478.
Zeng, Y., De Guardia, A., Daumoin, M., Benoist, J., 2012a. Characterizing the transformation and transfer of nitrogen during the aerobic treatment of organic wastes and digestates. Waste Manag. 32, 2239–2247.
PART A. THESIS SCOPE AND OUTLINE
69
Zeng, Y., De Guardia, A., Ziebal, C., De Macedo, F., Dabert, P., 2012b. Nitrification and microbiological evolution during aerobic treatment of municipal solid wastes. Bioresour. Technol. 110, 144–52.
Zeng, Y., Guardia, A., Ziebal, C., Macedo, F., Dabert, P., 2013. Impact of biodegradation of organic matters on ammonia oxidation in compost. Bioresour. Technol. 136, 49–57.
Zorpas, A., Arapoglou, D., Panagiotis, K., 2003. Waste paper and clinoptilolite as a bulking material with dewatered anaerobically stabilized primary sewage sludge (DASPSS) for compost production. Waste Manag. 23, 27–35.
Zuconni, F., de Bertoldi, M., 1987. Compost specifications for the production and characterization of compost from municipal solid wastes, in: de Bertoldi, M., Ferranti, M.P., Hermite, P.L., Zucconi, F. (Eds.), Compost: Production, Quality and Use. Elsevier Applied Science, London, pp. 30–50.
70
This Page Intentionally Left Blank
71
Part B. Properties of mixtures and
reactor assembly
This second part of the thesis includes two studies that precede the composting
experimental tests.
Firstly in Chapter 3, statistical mixture design tools are applied to predict and understand
the influence of a mixture proportion on free air space. In Chapter 4, special attention is given to
the definition and operational testing of an experimental apparatus for monitoring the
composting process.
72
This Page Intentionally Left Blank
PART B. PROPERTIES OF MIXTURES AND REACTOR ASSEMBLY
73
3. Prediction of free air space in initial composting mixtures by
a statistical design approach*
Free air space (FAS) is a physical parameter that can play an important role in
composting processes to maintain favorable aerobic conditions. Aiming to predict the FAS of
initial composting mixtures, specific materials proportions ranged from 0 to 1 were tested for a
case study comprising industrial potato peel waste characterized by low air void volume, thus
requiring additional components for its composting.
The characterization and prediction of FAS for initial mixtures involving potato peel,
grass clippings and rice husks (set A) or sawdust (set B) was accomplished by means of an
augmented simplex-centroid mixture design approach. The experimental data were fitted to
second order Scheffé polynomials. Synergistic or antagonistic effects of mixture proportions in
the FAS response were identified from the surface and response trace plots in the FAS response.
Moreover, a good agreement was achieved between the model predictions and supplementary
experimental data. In addition, theoretical and empirical approaches for estimating FAS available
in literature were compared with the predictions generated by the mixture design approach.
This study demonstrated that the mixture design methodology can be a valuable tool to
predict the initial FAS of composting mixtures, specifically in making adjustments to improve
mixture design analysis, presented at ORBIT’2012 – Global assessment for organic resources and waste
management, 12-15th June, In Proceedings, pg 5a-190 to 5a-197, Rennes, France (oral communication).
CHAPTER 3. PREDICTION OF FREE AIR SPACE IN INITIAL COMPOSTING MIXTURES
74
3.1. Introduction
Potato peel (PP) waste is a by-product from the processed potato products industries such
as French fries, chips and puree. Although PP is a zero value waste for those plants, disposal,
sanitation, and environmental problems must be overcome (Arapoglou et al., 2010). During the
processing of potatoes at industrial level, depending on the technology used (steam, abrasion or
lye peeling) losses caused by potato peeling can reach 15 to 40% of the total raw materials
(Schieber et al., 2001).
Though the food industry manages PP waste as a non-valuable by-product, its
composition may be suitable for several applications such as dietary fibre for baking products
and animal feeding (Djomo et al., 2008), biohydrogen and ethanol production (Arapoglou et al.,
2010; Djomo et al., 2008; Mars et al., 2010), source of natural antioxidants (Al-Weshahy et al.,
2010; Schieber et al., 2001; Wijngaard et al., 2012) and bio-methane production (Kaparaju and
Rintala, 2005; Kryvoruchko et al., 2009; Parawira et al., 2004). Our study addressed the PP
valorisation through composting. This process may be defined as the biological decomposition
and stabilization of organic subtracts, under aerobic conditions that allow development of
thermophilic temperatures as result of biologically generated heat, to obtain a final product that
is stable, free of pathogens and plant seeds that can be beneficially applied to land (Haug, 1993).
It should be noted that PP valorisation by composting can be quite interesting for the food
industry, given that a volume reduction of by-products up to 40% can be achieved (Schaub and
Leonard, 1996). Nevertheless, to the best of our knowledge, PP composting has been scarcely
addressed in literature. PP waste is usually characterised by high interparticle water content
which might hinder composting evolution, due to higher oxygen diffusion resistance in pores
between particles. Therefore, its valorisation may require previous mixture with other materials,
aiming to reach an adequate formulation for composting.
Mixture formulations for composting are often based on physical and chemical properties
of the wastes (Barrena et al., 2011) in order to adjust moisture content and C:N ratio to optimal
values and favourable to the growth and activity of microbial populations. Indeed, it is well
known that one of the most important factors for thermophilic composting is the carbon to
nitrogen ratio (C:N) with optimum values around 25-30:1 (Abdullah and Chin, 2010; Hamoda et
al., 1998; Huang et al., 2006) and moisture content in the range of 50-65% (Abdullah and Chin,
2010; Liang et al., 2003).
However, more recently the free air space (FAS) of a mixture has also been indicated as
a physical property that may play an important role during composting (Agnew et al., 2003;
PART B. PROPERTIES OF MIXTURES AND REACTOR ASSEMBLY
75
Barrena et al., 2011; Eftoda and McCartney, 2004; Richard et al., 2004; Ruggieri et al., 2009).
This parameter is defined as the ratio of gas filled pore volume to total compost mixture volume
and it determines the air quantity and movement inside the process, as well as the intrinsic air
content, carbon dioxide, moisture and heat removal from the system (Richard et al., 2004;
Ruggieri et al., 2009). FAS depends on the structural characteristics of the materials used such as
bulk density, particle density and water content. A minimum value of 30% is usually required to
ensure aerobic condition in the composting mixture (Haug, 1993), and optimum values for FAS
may be in the range of 60%. In literature there are references to FAS as high as 85 to 90%
without significant negative impact (Ahn et al., 2008; Ruggieri et al., 2009). To quantify FAS for
a given composting mixture, some theoretical empirical correlations have been developed
(Agnew et al., 2003; Haug, 1993; Oppenheimer et al., 1997; Richard et al., 2004). Moreover,
experimental procedures by using air pycnometry have been studied and compared (Ruggieri et
al., 2009). But so far, the study of an approach able to predict FAS for a given mixture based on
its individual components proportions has been seldom addressed (Soares et al., 2012).
Mixture design is a statistical technique associated to the concept of planning and
execution of informative experiments concerning a mixture of different components, and it has
been widely used to establish formulations in chemical, pharmaceutical and food industries
(Eriksson et al., 1998). The method consists in varying the proportions of two or more
ingredients of the mixture and studying the influence of the independent variables (proportions
of different components) into the measured response, which is dependent on the ingredient
composition (Akalin et al., 2010).
In this scope, the present work aims to use the mixture design approach to understand and
predict the influence of each component, on the FAS of an initial mixture containing primarily
potato peel waste (PP) for further composting. Rice husk (RH) or sawdust (SD) were selected as
bulking agents, and grass clippings (GC) as nitrogen source.
3.2. Materials and methods
3.2.1. Composting materials
The materials used were collected from different sources: potato peel (PP) is from a
national industry of potato chips, rice husk (RH) was provided by a rice husking factory, sawdust
(SD) is from a local pine sawmill, and grass clippings (GC) were obtained from a national
football stadium. Grass clippings were sieved through a 5 cm mesh to obtain a homogeneous
material in size and shape. The other materials did not require any specific treatment. The
CHAPTER 3. PREDICTION OF FREE AIR SPACE IN INITIAL COMPOSTING MIXTURES
76
characterisation of the each material was carried out using a composite sample of 25 L obtained
from five individual samples of 5 L taken from the initial laboratory samples of about 120 L.
Then, each composite sample of 25 L was homogenised and divided into four parts, with one
being eliminated. This procedure was repeated until samples of about 1-2 L were obtained for
further analysis.
3.2.2. Mixture design establishment and validation
The mixtures tested in this study were grouped in two sets (Set A and Set B) according to
the type of bulking agent used. Each set comprised three mixture factors or ingredients (set A:
PP + GC + RH; set B: PP + GC + SD) and their mixing proportions were individually allowed to
range from 0 to 1.
Therefore, a regular and triangular experimental design region is expected for each set,
with the constraint that the sum of all feedstock’s proportions must be 1. Vertices of the design
region correspond to the formulations that are pure blends.
The main objective of this design was to predict the free air space (desired response) for
any mixture tested by modelling the mixing surface with mathematical equations. It was
assumed that the measured response was only dependent on the relative proportions of the
ingredients (considered as independent variables) but not on the amount of the mixture.
The models considered in this study were Scheffé canonical polynomials (Smith, 2005):
Linear:
( ) ∑=
=q
iii XYE
1
β (3.1)
Quadratic: :
( ) j
q
i
q
ijiij
q
iii XXXYE ∑∑∑
−
= +==
+=1
1 11
ββ (3.2)
Special cubic: ( ) ∑∑ ∑∑∑∑
−
=
−
+= +=
−
= +==
++=2
1
1
1 1
1
1 11
q
i
q
ij
q
jkkjiijkj
q
i
q
ijiij
q
iii XXXXXXYE βββ (3.3)
Full cubic:
( )
( )∑∑ ∑∑ ∑
∑∑∑−
= +=
−
=
−
+= +=
−
= +==
+−+
+=
1
1 1
2
1
1
1 1
1
1 11
q
i
q
ij
q
i
q
ij
q
jkkjiijkjijiij
j
q
i
q
ijiij
q
iii
XXXXXXX
XXXYE
βγ
ββ
(3.4)
PART B. PROPERTIES OF MIXTURES AND REACTOR ASSEMBLY
77
Special Quartic: ( )
( )
∑∑ ∑∑ ∑∑
∑∑ ∑∑ ∑
∑∑∑
−
=
−
+=
−
=
−
+= +=+=
−
= +=
−
=
−
+= +=
−
= +==
+
++−+
+=
2
1
1
1
2
1
1
1 1
2
1
2
1
1 1
2
1
1
1 1
2
1
1 11
q
i
q
ij
q
i
q
ij
q
jkkjiijk
q
jkkjiijk
q
i
q
ij
q
i
q
ij
q
jkkjiijkjijiij
j
q
i
q
ijiij
q
iii
XXXXXX
XXXXXXX
XXXYE
ββ
βγ
ββ
(3.5)
where E(Y) is the expected value of the output variable Y, X are the independent variables, β
corresponds to the polynomial coefficients, q is the number of components (in this case q=3).
Since the experimental mixture region is regular and constitutes a simplex shaped region,
an augmented simplex-centroid mixture design approach was used to define the number of
mixtures necessary to attain the desired response (FAS value). This approach allows to detect the
model curvature in the interior of the design region and it includes the points (mixtures)
indicated in Figure 3.1, namely pure mixtures (vertices of the triangle), binary mixtures
(midpoints at each side of the triangle), and mixtures involving three components.
Figure 3.1: Mixtures tested according to a simplex-centroid mixture design (values in brackets represent blend order preparation and analysis).
In the interior area of the triangle there is a mixture of one third each of all ingredients
(called centroid point) and three mixtures located midway between the centroid and each pure
material. The pure and centroid mixtures were analysed twice to detect possible lack of fit and
pure experimental error. According to this methodology, each set comprised 14 experiments.
Each mix was prepared, for a total load of 2 kg, by weighing the different components
and mixing them by hand during 10 min, according to the pre-defined proportions and random
sequential order indicated in Figure 3.1. Before mixture preparation, every single individual
Rice huskor
Sawdust
0,00 0,25 0,50 0,75 1,00
Potato peel
0,00
0,25
0,50
0,75
1,00
Grass clippings
0,00
0,25
0,50
0,75
1,00
(1;4)
(6;14)
(11)
(13)(2)
(5) (3)
(12) (8)(7;10)
CHAPTER 3. PREDICTION OF FREE AIR SPACE IN INITIAL COMPOSTING MIXTURES
78
ingredient was manually mixed to promote homogenisation prior to weighing. Design-Expert ®
version 8.0.4 was used to analyse experimental data and to evaluate of the model that best fits the
composition effects in the response variables.
Some extra mixtures were prepared and analysed to validate the response of the model.
This assessment was accomplished by comparing the model predictions and experimental FAS
values for these specific mixtures.
3.2.3. Analytical methods
The main response variable under analysis is FAS and was calculated according to Eq.
(3.6) (Adhikari et al., 2009):
100%PD
BDFAS ×
−= 1 (3.6)
where BD is the wet bulk density (kg m-3) and PD is the wet particle density of the mixture (kg
m-3).
The parameter BD was determined according to a standard procedure described
elsewhere (US Department of Agriculture and US Composting Council, 2001). Briefly the
procedure consisted in the following steps:
a) transfer a 600 cm3 aliquot of as-received compost into a 2000-mL graduated
beaker through the wide neck funnel. Promote uniform material packing by
allowing the beaker+material to fall freely onto a rubber mat once from height of
15 cm;
b) repeat the filling with 600 cm3 and free falling operation, two more times (three
times total). After the third free-fall drop, fill the graduated beaker to volume with
sample material, 1800 mL. Do not repeat free-fall drop after topping off. Topping
off should be limited to 2-3 cm;
c) weigh and record gross weight of 2000-mL graduated beaker containing 1800 cm3
of as-received material;
d) calculate BD from the mass of material recorded in step c) and the volume of
material used (1800 mL).
PD was estimated based on the procedure defined by Adhikari et al. (2009):
i) measuring the density of kerosene by adding a specific volume and weighing a
graduate cylinder of known mass;
PART B. PROPERTIES OF MIXTURES AND REACTOR ASSEMBLY
79
ii) adding a known mass of fresh composting mixture to another dry graduate
cylinder, previously weighed, and then adding kerosene until all the particles are
covered and free of air bubbles;
iii) recording the total volume of the cylinder content, as well as the weight of the its
content.
The volume of the particles is calculated by subtracting the total volume recorded in step
iii) from the volume of added kerosene (calculated from the density in step i) and the mass of
kerosene obtained in step ii). By knowing the mass of particles (from step ii)), one can calculate
the particle density.
Water absorption capacity (WAC) of the bulking agents tested was performed based on
the procedure described by Adhikari et al. (2008). A known mass of dry material (at 105ºC) was
soaked in distilled water for 24 h. Then water was drained off by gravity for 24 h under cover to
limit evaporation, and then weighed. The WAC (%) was computed as:
����%� =��� � ��� ����� � ���� �������� ���� ���
���� ���� ��� (3.7)
Moisture content of each fresh sample was determined by drying it in an oven at 105 ºC
until constant weight. Organic matter was measured as volatile solids (VS) by burning 2.5 g dry
sample in a muffle furnace at 550 ºC for 4 h (until constant weight). Total organic carbon (Corg)
was determined in a Carbon-Sulphur Analyzer (Leco Instruments, model SC-144 DR), where
carbon was oxidized to carbon dioxide by heating at 550 ºC. The total nitrogen content (N) was
quantified by elemental analysis (EA 1108 CHNS-O-Fisons). All determinations were performed
at least in triplicate.
3.3. Results and discussion
3.3.1. Characterisation of the composting materials
Physical and chemical parameters determined for the individual materials are shown in Table
3.1, where the results were reported by mean± standard deviation and the values in brackets
indicate the number of samples analysed.
These determinations show that the key component under analysis, PP, is characterized
by the highest moisture content and the lowest FAS. Indeed, although PP revealed a favourable
CHAPTER 3. PREDICTION OF FREE AIR SPACE IN INITIAL COMPOSTING MIXTURES
80
Corg:N ratio for microbial activity, its valorisation throughout composting may be hindered by
the low inter-particle volume of voids available for oxygen diffusion.
Table 3.1: Physical and chemical properties of individual mixture components.
Materials tested
Property PP GC RH SD
MC (%) 85.0±2.8
(n=8) 75.5±4.7
(n=4) 10.7±0.5
(n=6) 11.6±0.4
(n=9)
VS (%) 95.0±1.0
(n=7) 84.8±6.0
(n=3) 84.1±0.0
(n=3) 99.7±0.0
(n=6)
BD (kg m-3) 707±71 (n=8)
149±27
(n=3)
122±3
(n=6)
256±3
(n=6)
PD (kg m-3) 1016±21
(n=5) 1071±87
(n=3) 902±109
(n=6) 1525±243
(n=6)
FAS (%)(a) 30.0±7.0
(n=5) 85.7±1.6
(n=3) 86.3±1.7
(n=6) 85.0±3.3
(n=6)
Corg (%, dm) 47.0±4.6
(n=4) 50.0±18.2
(n=3) 46.3±1.1
(n=3) 52.1±0.2
(n=3)
N (%, dm) 1.9±0.4 (n=4)
4.5±3.4 (n=3)
0.8±0.1 (n=3)
0.3±0.1 (n=3)
Corg:N 25.6±2.5
(n=4) 11.4±2.7
(n=3) 57.6±8.5
(n=3) 159±42 (n=3)
WAC (%) n.d. n.d. 350 440
% particles retained in a 2mm sieve
(b) 76 47 14
Abbreviations: MC- moisture content; VS- volatile solids; BD- wet bulk density; FAS- free air space, Corg - organic carbon; WAC- Water absorption capacity, dm- dry matter, n.d.- not determined. (a)-Calculated by using Eq. (3.6); (b)-particles with dimensions less than 2 cm.
With respect to rice husks and sawdust both have been extensively used in composting as
structural or drying amendments to reduce bulk density and increase air voids of the mixture
(Chang et al., 1999; Chang and Hsu, 2008; Gao et al., 2010; Huang et al., 2006; Jolanun et al.,
2008; Nakasaki et al., 1989, 1986). In our study, these materials exhibited low moisture content
(less than 12%) and high water absorption capacity (440% for SD and 350% for RH) which are
compatible to the purpose of correcting moisture excess of PP. In addition, the high FAS of these
components (about 80%) indicates that they are able to maintain air spaces between particles in
the composting mixture with PP waste and ensure its proper aeration. With respect to GC, this
material also exhibits high FAS. However, in this case it decomposes rapidly during composting,
and thus it is not a good bulking agent for composting mixtures. On the other hand, its low
Corg:N ratio turns GC into a good nitrogen source whenever necessary. In summary, the
ingredients selected in this study seem to be adequate to obtain well balanced mixtures, since
their properties are complementary.
PART B. PROPERTIES OF MIXTURES AND REACTOR ASSEMBLY
81
3.3.2. Response regression model analysis
To evaluate how a specific composition determines the FAS for mixtures containing PP, GC
and RH or SD as bulking agents, experimental responses of FAS were obtained for each trial
listed in Table 3.2. Those responses were fitted to Eq. (3.1) to (3.3) by using Design-Expert ®.
Full cubic, Eq. (3.4), and special quartic, Eq. (3.5), models were excluded from the evaluation,
because the number of model terms should be less than to the number of unique points in the
design (10 in this experimental design).
Table 3.2: Experimental response values of FAS for set A (with RH) and B (with SD) (n=3).
Special Cubic 1.46 0.994 0.970 161.6 0.1256 0.2325
Among the regression models under consideration, the selection of the best one to predict
the experimental response was based on the following criteria:
i) Low standard deviation, high R2adj and R2
pred and low PRESS;
ii) Low probability of response improvement as additional terms are added (p-value in the
sequential model sum of squares less than 0.05);
iii) High p-value in the lack of fit test.
Therefore, for set A, special cubic model complies with criteria i) and iii); however, the
p-value associated to the sequential model sum of squares indicates that there is no significant
improvement of the model fit due to additional terms. Hence, a quadratic model was selected in
this case. For set B, criteria i) and iii) were fulfilled by quadratic and special cubic models.
Nevertheless, the probability of response improvement was low for the higher order model, and
thus the quadratic model was also selected.
The regression coefficients obtained for the selected models are shown in Table 3.4.
Table 3.4: Regression coefficients of the quadratic model for predicting FAS of set A (with RH) and B (with SD).
Set A Set A (reduced model) Set B Coefficient
value Independent
variable term p-value*
Coefficient value
Independent variable
Coefficient value
Independent variable
term p-value*
34.56 X1 34.52 X1 24.79 X1
86.40 X2 86.61 X2 85.74 X2
86.77 X3 86.97 X3 84.13 X3
50.41 X1X2 <0.0001 50.81 X1X2 61.55 X1X2 <0.0001
92.98 X1X3 <0.0001 93.38 X1X3 68.66 X1X3 <0.0001
3.24 X2X3 0.5351 - X2X3 -38.85 X2X3 0.0002 * If a term is not significant for the model, then p-value is >0.05 and model reduction should be evaluated.
The second order polynomial describing FAS response for mixtures with PP:GC:RH
presented a non-linear term (X2X3) that is not significant. Therefore, a reduced model was
PART B. PROPERTIES OF MIXTURES AND REACTOR ASSEMBLY
83
evaluated, by removing the term with the highest p-value until all p-values are less than 0.1
(Smith, 2005). This procedure was performed using Design-Expert ® and led to the response
indicated in Table 3.4. As a result, parameters R2adj and R2
pred were slightly improved (from
0.994 and 0.985 to 0.996 and 0.991, respectively).
As usual, obtained models for predicting FAS were based on the assumption that errors
are independent and identically distributed with zero mean and homogenous variance (Smith,
2005). The confirmation of these conditions was performed by visual inspection of the normal
probability plot of the studentised residuals (to check for normality of residuals), by comparing
their values with the predicted ones. Although it was observed some scatter, normal plot of
residuals followed a straight line suggesting a normal distribution.
3.3.3. Surface and response trace plots analysis
Trace and surface/contour plots were drawn to evaluate the effects of individual
ingredients on FAS response. For sets A and B, surface plots are depicted in Figure 3.2 a) to b),
which include the projection of the response in a 2D representation.
Figure 3.2: Contour plots for FAS: a)- set A (A:PP; B: GC; C: RH); b) set B (A:PP; B: GC; C: SD); Response trace plots for FAS: c)- set A; d)- set B.
CHAPTER 3. PREDICTION OF FREE AIR SPACE IN INITIAL COMPOSTING MIXTURES
84
In these figures, mixture compositions that produced the same response are indicated by a
contour line. For both sets A and B, maximum values FAS are located towards pure blends of
GC and RH/SD. In fact, contour lines in Figure 3.2a) to b) indicate a broad range of GC and
RH/SD proportions where FAS assume identical values. It should be noted that large amounts of
GC may seem to ensure high values for FAS. However, this material decomposes quickly and
then tend to compact, reducing pores between compost particles (Rynk et al., 1992).
Moreover, the response surface in Figure 3.2 b) shows that the binary mixture of SD with
GC acts antagonistically on FAS parameter, which is reflected in the negative coefficient
associated to X2X3 (Table 3.4). The main reason for this result is the great importance of the
particle size distribution of the bulking agent to the structural condition of the mixture. In our
study, 86 % of SD particles are lower than 2 mm, which is a high value comparing with the one
suggested by Haug (1993) (50% of particles passing a mesh of 2.23 mm). By mixing SD with
GC, the interstices of GC were probably occupied by sawdust, thus reducing FAS, rather than
what is expected of a good bulking agent.
Trace plots, Figure 3.2 c) to d), enable to compare the effects of all components in the
design space and determine the sensitivity of the response to deviations from the formulation
near the reference mixture (the centroid of the triangle, design points nº 9 and 14 from Table 3.1.
The lines in Figure 3.2 c) to d) correspond to the FAS response due to variations in the
proportions of a selected component, keeping constant the ratio of the others ingredients and the
sum of mixture components equal to one. The results reveal that independently of the bulking
agent used, PP (ingredient A) has a strong effect on the reduction of FAS as mixtures deviate
from the centroid. When RH is used, Figure 3.2 c), the response trace to GC is nearly a
horizontal line, meaning that it has a negligible effect on FAS. When SD is tested, Figure 3.2 d),
GC and SD response curves are overlapped, and thus these components have roughly identical
linear effect on FAS. This result may be explained by the particle size of the SD used in our
study, as previously mentioned.
3.3.4. Validation of the response regression model
Three compositions were selected for each bulking agent, for validating regression
models, Eq (3.8)-(3.9), previously obtained for FAS:
(3.8)
(3.9)
3121321 38938150978661865234 XX.XX.X.X.X.FAS A Set ++++=
323121321 853866685561138474857924 XX.XX.XX.X.X.X.FAS B Set −++++=
PART B. PROPERTIES OF MIXTURES AND REACTOR ASSEMBLY
85
The selection was based on the range of ingredients proportions that are favorable to
composting in what concerns MC, Corg:N and FAS. Restrictions imposed to Corg:N are in the
interval 20-40:1 (Rynk et al., 1992). The upper limit was slightly broadened for MC (55-75%)
due to the high absorption capacity of bulking agents involved (Barrena et al., 2011). Mixture
proportions that fulfilled the requirements for MC and Corg:N were calculated according to the
principle of mass conservation to a blend of PP, GC and RH or SD, whose characteristics were
listed in Table 3.1. FAS was allowed to vary between 60-85%. By combining the constraints of
the parameters MC, Corg:N and FAS, an interception area (shaded region in Figure 3.3) is defined
for selecting the mixtures RH1 to RH3 and SD1 to SD3, for FAS model validation.
Figure 3.3: Contour and response trace plots for FAS for: a) set A (A:PP; B: GC; C: RH), RH1-RH3 are the validating mixtures; b) set B (A:PP; B: GC; C: SD), SD1-SD3 are the validating mixtures.
a)
b)
CHAPTER 3. PREDICTION OF FREE AIR SPACE IN INITIAL COMPOSTING MIXTURES
86
The numerical results for validating the models, Eq.(3.8) and Eq (3.9) are shown in Table
3.5.
Table 3.5: Experimental conditions tested and validation results.
FAS (%) Mixt. Ref. X1
(PP) X2
(GC) X3 (RH or
SD) MC (%)
VS (%)
BD (kg m-3) Exp. result Model prediction Pred. Interval
Experimental results for FAS were found to be very close to the predictions of the
models, with relative errors ranging from -2.7 to 5.8%, but within the prediction intervals.
Therefore, the models developed by mixture design approach for predicting FAS, Eq.(3.8) to
(3.9), can be used to properly calculate the free air space of ternary mixtures of PP, GC, RH or
SD.
In this study FAS was quantified by using the simplest theoretical correlation available,
Eq.(3.6), although air pycnometry is pointed out as the most reliable technique for its
determination in composting matrices (Ruggieri et al., 2009). But the unavailability of
commercial picnometers for this type of solid material, conditioned the cross-confirmation of our
theoretical correlation based results.
In literature, FAS has been estimated by theoretical or empirical approaches
(Albuquerque et al., 2008). Figure 3.4 compares FAS predictions of the models developed in our
study, Eqs. (3.8)-(3.9), with the ones calculated by equations proposed by Richard et al. (2004),
Eq.(3.10), and Agnew et al. (2003), Eq.(3.11):
( )100%
PD
111FAS
ashR ×
−×+×+−×−= OMDM
PD
OMDM
D
DMBD
OMw (3.10)
BD0.0889-100FASAg ×= (3.11)
where BD is the wet bulk density (kg m-3), DM the fraction of dry matter, OM the fraction of
organic matter in dry basis, Dw the density of water (kg m-3), PDOM the particle density of
organic matter (1600 kg m-3) and PDash the particle density of ash (2500 kg m-3).
In general, for mixtures RH1 to RH3, FAS calculated by Eq.(3.10)-(11) are slightly
higher than the predicted by models of our study, Eq.(3.8)-(3.9). However, in the case of SD1 to
SD3 (sawdust as bulking agent), correlations values fitted inside the prediction intervals. These
differences might be related to the applicability conditions of theoretical and empirical
approaches for FAS quantification.
PART B. PROPERTIES OF MIXTURES AND REACTOR ASSEMBLY
87
Figure 3.4: Comparison between FAS predictions Error bars indicate prediction intervals with a significance of 95%.
According to Ruggieri et al. (2009), properties such as BD and MC have a strong
influence on FAS estimated by these correlations, and boundaries were established to its
application. Namely, FASR, Eq.(3.10), is limited for materials where BD is superior to
400 kg m -3; below this level FASR may lead to misleading values. Also FASAg, Eq.(3.11), seems
restricted only to high-moisture and/or low-density materials where FASR may provide
misleading values. In our study, mixtures with RH have low bulk densities (<245 kg m-3) and
FASR were the highest ones, over estimating FASmodel (relative error ranged from -4.2 to -
11.3%). FAS indicated by FASAg were also overestimated but within the relative errors (-3.8 to -
10.1%). For mixtures with SD, FASR and FASAg were equally consistent with FASmodel
predictions.
3.4. Conclusions
This study aimed to predict free air space of mixtures for further used in composting,
based on mixture design approach. The organic materials tested were potato peel (PP), grass
clippings (GC) and rice husks (RH) or sawdust (SD). The results proved that the mixture design
methodology led to reliable mathematical models for predicting FAS of mixtures containing
primarily PP. In particular, for mixtures with PP, GC and SD the FAS model pointed out the
antagonistic effect of the binary mixture of GC and SD to the overall property. Contour plots
Composting mixture
RH1 RH2 RH3 SD1 SD2 SD3
FA
S (
%)
40
50
60
70
80
FAS modelFASR
FASAg
CHAPTER 3. PREDICTION OF FREE AIR SPACE IN INITIAL COMPOSTING MIXTURES
88
revealed the occurrence of a wide range of GC and SD (bulking agent) proportions where FAS
assume identical values; nonetheless, large proportions of GC should be avoided.
As expected, response trace plots clearly indicated that independently of the bulking
agent used, the addition of potato peel has a strong effect on reducing the mixture air voids
volume.
The models obtained for predicting FAS were compared with theoretical and empirical
correlations proposed in literature which consider mixture properties like DM, OM and BD. For
formulations with SD, correlations are consistent with our model prediction. When RH was used
as bulking agent both literature correlations overestimated the FAS but even so the deviations
were low.
In summary, mixture design approach led to good results to estimate FAS of initial
mixtures with industrial potato peel waste, avoiding, this way, trial and error methods often used
to establish the ingredients proportions. By overlapping contour plots that describe the influence
of the mixture composition in FAS, it was possible to find a range that complies with
requirements in what concerns moisture content, C:N ratio and FAS.
Future studies should address how model predictions are affected by two aspects: 1)
variability of wet basis properties since they affect the surface areas of the feedstock particles
and pore space formation and 2) biodegradability of the mixture, because when the materials
decompose quickly, pores between particles are reduced and composting evolution may be
hindered.
3.5. References
Abdullah, N., Chin, N.L., 2010. Simplex-centroid mixture formulation for optimised composting of kitchen waste. Bioresour. Technol. 101, 8205–10.
Adhikari, B.K., Barrington, S., King, S., 2008. Characterization of food waste and bulking agents for composting. Waste Manag. 28, 795–804.
Adhikari, B.K., Barrington, S., Martinez, J., King, S., 2009. Effectiveness of three bulking agents for food waste composting. Waste Manag. 29, 197–203.
Agnew, J., Leonard, J., Feddes, J., Feng, Y., 2003. A modified air pycnometer for compost air volume and density determination. Can. Biosyst. Eng. 45, 6.27–6.35.
Akalin, O., Ulas, K., Sennaroglu, B., Tez, M., 2010. Chemometrics and Intelligent Laboratory Systems Optimization of chemical admixture for concrete on mortar performance tests using mixture experiments. Chemom. Intell. Lab. Syst. 104, 233–242.
PART B. PROPERTIES OF MIXTURES AND REACTOR ASSEMBLY
89
Al-Weshahy, A., El-Nokety, M., Bakhete, M., Rao, V., 2010. Effect of storage on antioxidant activity of freeze-dried potato peels. Food Res. Int. 10–15.
Arapoglou, D., Varzakas, T., Vlyssides, A., Israilides, C., 2010. Ethanol production from potato peel waste ( PPW ). Waste Manag. 30, 1898–1902.
Barrena, R., Turet, J., Busquets, A., Farrés, M., Font, X., Sánchez, A., 2011. Respirometric screening of several types of manure and mixtures intended for composting. Bioresour. Technol. 102, 1367–77.
Chang, J.I., Hsu, T.-E., 2008. Effects of compositions on food waste composting. Bioresour. Technol. 99, 8068–74.
Djomo, S., Humbert, S., Blumberga, D., 2008. Life cycle assessment of hydrogen produced from potato steam peels. Int. J. Hydrogen Energy 33, 3067–3072.
Eftoda, G., McCartney, D., 2004. Determining the Critical Bulking Agent Requirement For Municipal Biosolids Composting. Compost Sci. Util. 12, 208–218.
Eriksson, L., Johansson, E., Wikstrom, C., 1998. Mixture design — design generation , PLS analysis , and model usage. Chemom. Intell. Lab. Syst.
Gao, M., Li, B., Yu, A., Liang, F., Yang, L., Sun, Y., 2010. The effect of aeration rate on forced-aeration composting of chicken manure and sawdust. Bioresour. Technol. 101, 1899–903.
Hamoda, M., Abuqdais, H., Newham, J., 1998. Evaluation of municipal solid waste composting kinetics. Resour. Conserv. Recycl. 23, 209–223.
Haug, R.T., 1993. The practical handbook of compost engineering. CRC-Press.
Huang, G.F., Wu, Q.T., Wong, J.W.C., Nagar, B.B., 2006. Transformation of organic matter during co-composting of pig manure with sawdust. Bioresour. Technol. 97, 1834–42.
Jolanun, B., Towprayoon, S., Chart, C., 2008. Aeration improvement in fed batch composting of vegetable and fruit wastes. Environ. Prog. 27, 250–256.
Kaparaju, P., Rintala, J., 2005. Anaerobic co-digestion of potato tuber and its industrial by-products with pig manure. Resour. Conserv. Recycl. 43, 175–188.
Kryvoruchko, V., Machmüller, A., Bodiroza, V., Amon, B., Amon, T., 2009. Anaerobic digestion of by-products of sugar beet and starch potato processing. Biomass and Bioenergy 33, 620–627.
Liang, C., Das, K.C., Mcclendon, R.W., 2003. The influence of temperature and moisture contents regimes on the aerobic microbial activity of a biosolids composting blend. Bioresour. Technol. 86, 131–137.
Mars, A.E., Veuskens, T., Budde, M.A.W., van Doeveren, P.F.N.M., Lips, S.J., Bakker, R.R., de Vrije, T., Claassen, P.A.M., 2010. Biohydrogen production from untreated and hydrolyzed potato steam peels by the extreme thermophiles Caldicellulosiruptor saccharolyticus and Thermotoga neapolitana. Int. J. Hydrogen Energy 35, 7730–7737.
Nakasaki, K., Shoda, M., Kubota, H., 1986. Effects of a bulking agent on the reaction rate of thermophilic sewage sludge composting. J. Ferment. Technol. 64, 539–544.
Nakasaki, K., Shoda, M., Kubota, H., 1989. Nitrogen transformation during thermophilic composting. J. Ferment. Bioeng. 67, 57–61.
CHAPTER 3. PREDICTION OF FREE AIR SPACE IN INITIAL COMPOSTING MIXTURES
90
Oppenheimer, J.R., Martin, A., Walker, L.P., 1997. Measurements of air-filled porosity in unsaturated organic matrices using a pycnometer. Bioresour. Technol. 59, 241–247.
Parawira, W., Murto, M., Zvauya, R., Mattiasson, B., 2004. Anaerobic batch digestion of solid potato waste alone and in combination with sugar beet leaves. Renew. Energy 29, 1811–1823.
Richard, T., Veeken, A., de Wilde, V., Hamelers, H., 2004. Air-Filled Porosity and Permeability Relationships during Solid-State Fermentation. Biotechnol. Prog. 20, 1372–1381.
Ruggieri, L., Gea, T., Artola, A., Sánchez, A., 2009. Air filled porosity measurements by air pycnometry in the composting process: a review and a correlation analysis. Bioresour. Technol. 100, 2655–66.
Rynk, R., Kamp, M. van de, Willson, G.B., Singley, M.E., Richard, T.L., Kolega, J.J., Gouin, F.R., Lucien Laliberty, J., Kay, D., Murphy, D.W., Hoitink, H.A.J., Brinton, W.F., 1992. On-farm composting handbook. Northeast Regional Agricultural Engineering Service, Ithaca.
Schaub, S.M., Leonard, J.J., 1996. Composting: an alternative waste management option for food processing industries. Trends Food Sci. Technol. 7, 263–268.
Schieber, A., Stintzing, F.C., Carle, R., 2001. By-products of plant food processing as a source of functional compounds — recent developments. Trends Food Sci. Technol. 12, 401–413.
Smith, W.F., 2005. Experimental design for formulation. Society for Industrial and Applied Mathematics, Pittsford, New York.
Soares, M., Andrade, S., Martins, R., Quina, M., Quinta-Ferreira, R., 2012. Organic biowastes blend selection for composting industrial eggshell by-product: experimental and statistical mixture design. Water Sci. Technol. 65, 1939–1945.
US Department of Agriculture, US Composting Council, 2001. Test methods for the examination of composting and compost. Edaphos International, Houston.
Wijngaard, H.H., Ballay, M., Brunton, N., 2012. The optimisation of extraction of antioxidants from potato peel by pressurised liquids. Food Chem. 133, 1123–1130.
PART B. PROPERTIES OF MIXTURES AND REACTOR ASSEMBLY
91
4. Assembly and operation of lab-scale composting reactors
In this section the composting reactors lab-assembled are described and tested.
Firstly, some specific design criteria such as volume and shape definition are explored.
Monitoring systems were coupled to the reactors and detailed description is indicated. Then,
composting experimental procedures in terms of sampling, monitoring and homogenisation are
presented.
Finally, a set of exploratory tests are described. The main goal was to provide
information about the adequacy of the reactors and procedures to achieve the objective of this
thesis. Bi-dimensional temperature gradients were analysed to determine the hot-spot, as well as
the vertical and radial gradients. The capacity of the gas cooling system to meet the operating
conditions of the O2 sensor in terms of temperature and humidity is also explored in this section.
At last, the suitability of the composting procedure to the ash conservation principle was tackled.
CHAPTER 4. ASSEMBLY AND OPERATION OF LAB-SCALE COMPOSTING REACTOR
92
4.1. General design concepts of composting reactors
A significant number of lab scale composting devices have been developed with the
purpose to mimic full-scale facilities conditions. In that scope, self-heating reactors (SHR) are
frequently used to simulate the typical thermodynamic regime of composting process that
includes mesophilic, thermophilic, cooling and maturation phases. SHR rely only on microbial
heat production to attain process temperatures, possessing no temperature control apart from
external insulation (Lashermes et al., 2012; Mason and Milke, 2005). On the other hand, for
studying the process at a particular temperature instead of evaluating the process dynamics, fixed
temperature reactors are considered more adequate, where the desired temperature is imposed by
external heating or cooling devices (Mason and Milke, 2005).
Within the scope of present work, SHR were selected for evaluating the level of
thermophilic sanitising temperatures achieved. The design aspects of major concern for SHR are
(Mason and Milke, 2005; Petiot and de Guardia, 2004):
1) Surface area to volume ratio (SA:V), once it determines the wall heat flux; this ratio
depends on the volume and shape of the system although cylindrical structure is the
most used;
2) Type and thickness of insulation material used in the external surface to increase
thermal resistance;
3) Reactor to particle diameter ratio (D:dp), due to the influence of wall effects on
preferential airflow inside the composting matrix.
To aid the volume selection of a cylindrical SHR, an estimate of the ratio between
instantaneous convective/conductive/radiative (CCR) heat losses through the reactor wall and the
biological heat produced during composting can be calculated. The calculation followed the
procedure suggested by Mason and Milke (2005) as described in the supplementary material
(section 4.7).
In Figure 4.1 the instantaneous CCR heat loss:biological heat ratio (CCR:BH) is
presented as a function of reactor volume (V) and SA:V ratio, for a cylindrical reactor with
different height (H) to diameter (d) proportions. For CCR:BH calculations, an Aeroflex_EPDM
rubber based elastomeric product was considered as insulation material (thermal conductivity of
0,035 W m-1 K-1, 19 mm of thickness). This material presents a higher mechanical resistance in
comparison to other insulation materials (like glass wool), thus facilitating the reactor loading
and unloading, or even homogenisation phase by rolling.
PART B. PROPERTIES OF MIXTURES AND REACTOR ASSEMBLY
93
Figure 4.1: Influence of a) the volume of a cylindrical self-heating reactor, b) SA:V in CCR heat loss:BH. (Considerations: PVC cylindrical reactor, rubber based elastomeric insulation layer= 38 mm, ambient
where m0 and mt (kg) is the mass at the start and during the composting trial, respectively; mj (kg)
is the mass of sample in the j withdrawn; fH,0, fH,t and fH,j are moisture fractions in the composting
mass at the start, during composting and in sample j, respectively; fVS,0, fVS,t and fVS,j are the
fractions of volatile solids in dry basis, at the start, during composting and in sample j,
correspondingly.
n c
m
n/3
cm
n/3
cm
PART B. PROPERTIES OF MIXTURES AND REACTOR ASSEMBLY
101
Before each sampling event, the height of the mixture inside the reactor was recorded for
assessing the variation of mixture bulk density, along process evolution.
As the process evolved, the temperature sensor was repositioned inside the reactor to
follow the compression of the mixture, by measuring the mixture height inside the reactor
throughout the process, as detailed in Figure 4.5.
Composting reactor operation lasted until oxygen uptake rate (OUR) of the mixture
attains values of 0.5g O2 kg-1 VS h-1 which is the threshold for considering a composting mixture
as stable (Gómez et al., 2006). After that, materials concluded maturation phase in small piles at
room temperature, that were homogenised and moisture corrected, on a weekly basis.
4.4. Exploratory tests
As previously indicated, the goal of the exploratory tests conducted in SHR was to gain
insight about the performance of the reactors. Temperature profiles, oxygen monitoring and
application of ash mass balance were considered in these studies.
4.4.1. Temperature gradients and oxygen measuring system
An important aspect concerning temperature monitoring in composting process is the
position of sensors (Ekinci et al., 2004). In general, temperature measuring points are established
to obtain an overview of the temperature distribution (Papadimitriou et al., 2010). Central
readings seek for hot-spots and peripheral measurements provide information about air transport
throughout the solid matrix.
However in the case of unmixed SHR, the definition of an inner core volume where
temperature readings are taken maybe more adequate to assess process evolution (Mason and
Milke, 2005). That core volume is generally based upon the horizontal and vertical temperature
profiles.
Oxygen concentration is widely used to assess the degree of aerobiosis (Papadimitñou et
al., 2010). It is usually evaluated in the off gas from the composting system, though interstitial
O2 concentration can be measured depending on the available sensor technology.
Electrochemical sensors are cells mainly constituted by a Teflon membrane, anode, semi-
solid electrolyte paste and cathode. The oxygen enters the sensor through the membrane,
contacts with the cathode and is immediately reduced to hydroxyl ions. These ions migrate
through the electrolyte to the anode, generally constituted by lead. There, hydroxyl ions react
with the anode which is then oxidised to lead oxide. As reduction-oxidation reaction takes place,
CHAPTER 4. ASSEMBLY AND OPERATION OF LAB-SCALE COMPOSTING REACTOR
102
a current is generated which is proportional to O2 concentration, allowing a precise
quantification. These electrochemical cells are sensitive to temperature (which interferes with the
output signal) and excessive moisture in the gas (which restricts the gas permeability through the
membrane). Consequently, a working range in terms of temperature and moisture are generally
imposed for these types of sensors. In the case of the sensors used in this work (gas sensor,
XLS1047, XLlogger), operating conditions are restricted to 0-40ºC (with internal compensation
of the temperature) and gas humidity <95% (non condensing).
Thus, the following exploratory test has a two-fold objective: i) to confirm that the centre
temperature readings were acceptable to obtain a picture of the self-heating capacity of the
mixture, by obtaining bi-dimensional temperature profiles and ii) to evaluate if the cooling and
condensing system coupled to the reactors was able to fulfil the oxygen sensor requirements, in
terms of gas temperature and humidity.
4.4.1.1. Material and methods
This assessment was performed by mixing industrial PP from a national industry of
potato chips with grass clippings (GC). Wheat straw (WS) was used as amendments to moisture
and free air space correction of the composting mixture. These materials were blended according
to the formulation presented in Table 4.3. Operating conditions are also depicted in Table 4.3.
Air flow rate in these experiments was controlled in order to maintain the oxygen concentration
of the outlet gas in the range of 5 to 15% (v/v).
Table 4.3: Composting mixture properties and reactor operating conditions.
Composting mixture SHR Operating conditions
Reactor PP
(%w/w) GC
(%w/w) WS
(%w/w) C/N
Moisture content (%)
Initial composting mass (kg)
Inlet gas temp. (ºC)
Air flow rate
R3 52 30 18 24.9 67.2 29 17 Controlled to maintain 5%<[O2]oulet gas <15%
Temperature was recorded in the points indicated in Figure 4.10, after 10 min
stabilisation of the probe. These measurements were performed in the first and fourth days of
composting, and on average all measurements took about 2h30m to 3 h. During that period, the
lid of reactor was removed and a 15 cm in thickness polyurethane foam, perforated as detailed in
Figure 4.10 b), was placed on the surface of the mixture to minimize heat losses.
PART B. PROPERTIES OF MIXTURES AND REACTOR ASSEMBLY
103
Figure 4.10: Schematic representation of the temperature measuring points a) perpendicular plane, b) radial plane (the validation point is indicated in blue, at h=30 cm).
Since this composting trial was exploratory, the operation and sampling procedure was
simpler than the one described in section 4.3. Namely, no withdrawl of the matrix was
performed, but homogenisation of reactor content was carried out as detailed in section 4.3.
Bi-dimensional temperature profiles were obtained by using Matlab (version 7.8.0.347,
Mathworks, USA) using a biharmonic spline interpolation method (MATLAB® 4
griddata method) that only supports 2-D interpolation. These profiles were calculated between
the h=0 cm (near the air distribution plate) and 5 cm beneath the mixture height. For validation
purposes, the temperature was measured at the centre of the matrix (h=30cm), as indicated in
Figure 4.10 a).
In what concerns oxygen monitoring, the measuring cell showed in Figure 4.7 b) and a
glass thermometer (0-100ºC) were used. The formation of condensates in the measuring cell was
visually evaluated.
4.4.1.2. Results
Bi-dimensional temperature profiles in the axial and radial directions observed for the
first and fourth days of composting are depicted in Figures 4.11 and 4.12, respectively.
__0 cm
__5 cm
__10 cm
__15 cm
__20 cm
__25 cm
__35 cm
__40 cm
For h=5 cm and 20 cm:
__30 cm
a)
b)
CHAPTER 4. ASSEMBLY AND OPERATION OF LAB-SCALE COMPOSTING REACTOR
104
Figure 4.11: Bi-dimensional temperature profiles for the 1st day of composting (inlet air temperature: 17ºC).
Figure 4.12: Bi-dimensional temperature profiles for the 4th day of composting (inlet air temperature: 17ºC).
73.4ºC
77.6ºC
PART B. PROPERTIES OF MIXTURES AND REACTOR ASSEMBLY
105
During the first four days of composting, the hot-spot was located about 10 cm above the
geometrical centre of the matrix. However, the difference between hot-spot and temperatures
observed in the centre was only near to 3%. This indicates that measurements at the centre of the
matrix is a good strategy for determining the maximum temperature. Profiles calculated by using
the Matlab were in very good agreement with the measures in the validation point (relative errors
of 0.5% for day 1 and 0.9% for day 4, respectively).
As expected, temperatures near the air entrance were lower and the circular plots in
Figures 4.11 and 4.12 show that its influence extends to the reactors surface surroundings,
especially for 5 cm height. Maximum vertical temperature gradients were near 0.3 ºC cm-1,
considering the values recorded at 5 cm and 30 cm height and at the centre of the air entrance
plan. Schloss and Walker (2000) found similar vertical gradients (0.4-0.9ºC cm-1) in a
composting reactor with 30 cm of diameter and an initial mixture height of 47 cm.
Table 4.4 shows the maximum radial temperature profiles recorded for each height
indicated in Figure 4.10 a).
Table 4.4: Radial temperature gradients found for the self-heating reactor.
First day Fourth day Height (h) (cm) |Radial gradient| (ºC cm-1) Height (h) (cm) |Radial gradient| (ºC cm-1)
where mash,init,period i is the mass of ash at the beginning of period i, mash,fin,period i is the mass of ash
at the end of period i and period i represents the interval between sampling events (i=1 to 4).
Experimental results suggested that the mass balance closure for ash is in general
satisfactory giving rise to calculated values ranging from 95-107%, as indicated in Table S4.2
(supplementary material, section 4.7). Komilis et al. (2011) indicated values between 88-135%
closure for C-CO2 measurements in 100 L composting reactors with dewatered-sludge. Defaults
in those values were attributed to the inherent heterogeneity of the composting system and, in
some extent, to the analytical errors. In addition, moisture content determination is also pointed
out as an error income for ash mass balances (Zhang and Matsuto, 2010). In fact, by analysing
the standard deviation for moisture content in Table S.4.2 the values obtained were much higher
than for VS determination. For that reason it was decided that in future studies, moisture
determination would be based on five replicates and the mean value based upon the three more
consistent values.
4.5. General conclusions
Exploratory tests on a composting lab installation (with four SHR) indicated that its
operation was adequate, in particular with respect to the following aspects:
CHAPTER 4. ASSEMBLY AND OPERATION OF LAB-SCALE COMPOSTING REACTOR
108
i) temperature in the centre of the composting mixture was representative of the hot
spot;
ii) radial temperature gradients were more significant than in the axial direction;
iii) gas cooling and condensing apparatus allowed gas temperature and moisture to fit
within the operating conditions of the oxygen sensors;
iv) sampling procedure reasonably fulfilled the ash conservation, though analytical
error associated to the moisture determinations should be lessen by performing
more replicates.
4.6. References
An, C., Huang, G., Yao, Y., Sun, W., An, K., 2012. Performance of in-vessel composting of food waste in the presence of coal ash and uric acid. J. Hazard. Mater. 203-204, 38–45.
Doublet, J., Francou, C., Poitrenaud, M., Houot, S., 2011. Influence of bulking agents on organic matter evolution during sewage sludge composting; consequences on compost organic matter stability and N availability. Bioresour. Technol. 102, 1298–307.
Ekinci, K., Keener, H., Akbolat, D., 2004. Effect of Thermocouple Location on the Optimum Composting Rate. Biosyst. Eng. 89, 345–353.
Gomes, A.P., 2001. Fundamentos da compostagem de resíduos sólidos.
Gómez, R.B., Lima, F. V, Ferrer, A.S., 2006. The use of respiration indices in the composting process: a review. Waste Manag. Res. 24, 37–47.
Haug, R.T., 1993. The practical handbook of compost engineering. CRC-Press.
Komilis, D., Evangelou, A., Voudrias, E., 2011. Monitoring and optimizing the co-composting of dewatered sludge : A mixture experimental design approach. J. Environ. Manage. 1–9.
Lashermes, G., Barriuso, E., Le Villio-Poitrenaud, M., Houot, S., 2012. Composting in small laboratory pilots: performance and reproducibility. Waste Manag. 32, 271–7.
Lu, S.G., Imai, T., Li, H.F., Ukita, M., Sekine, M., Higuchi, T., 2001. Effect of Enforced Aeration on In-Vessel Food Waste Composting. Environ. Technol. 22, 1177–1182.
Mason, I.G., Milke, M.W., 2005. Physical modelling of the composting environment: a review. Part 1: Reactor systems. Waste Manag. 25, 481–500.
Papadimitñou, E.K., Bidlingmaier, W., Gea, T., 2010. Fundamentals in Selecting Input and Output Variables for Composting Process Automatic Controllers. Compost Sci. Util. 18, 6–21.
Papadimitriou, E.K., Bidlingmaier, W., Gea, T., 2010. Fundamentals in Selecting Input and Output Variables for Composting Process Automatic Controllers. Compost Sci. Util. 18, 6–21.
Petiot, C., de Guardia, A., 2004. Composting in a Laboratory Reactor: a review. Compost Sci. Util. 12, 69–79.
PART B. PROPERTIES OF MIXTURES AND REACTOR ASSEMBLY
109
Petric, I., Helić, A., Avdić, E.A., 2012. Evolution of process parameters and determination of kinetics for co-composting of organic fraction of municipal solid waste with poultry manure. Bioresour. Technol. 117, 107–16.
Petric, I., Šestan, A., Šestan, I., 2009. Influence of wheat straw addition on composting of poultry manure. Process Saf. Environ. Prot. 7, 206–212.
Puyuelo, B., Gea, T., Sánchez, A., 2010. A new control strategy for the composting process based on the oxygen uptake rate. Chem. Eng. J. 165, 161–169.
Saucedo-Castaneda, G., Gutierrez-Rojas, M., Bacquet, G., Raimba ult, M., Viniegra-Gonzalez, G., 1990. Heat transfer simulation in solid substrate fermentation. Biotechnol. Bioeng. 35, 802–808.
Schloss, P., Walker, L., 2000. Measurement of process performance and variability in inoculated composting reactors using ANOVA and power analysis. Process Biochem. 35, 931–942.
Schloss, P.D., Chaves, B., Walker, L.P., 2000. The use of the analysis of variance to assess the influence of mixing during composting. Process Biochem. 35, 675–684.
Zhang, H., Matsuto, T., 2010. Mass and element balance in food waste composting facilities. Waste Manag. 30, 1477–1485.
4.7. Supplementary material
According to Mason and Milke (2005), steady state heat transfer across a wall, Q (W),
maybe modeled by Eq (S4.1), which is equal to CCR(W):
B = C'�DE − D�� (S4.1)
For a cylinder with a two component wall, the term UA may be determines as follows:
�FG = �
HI3JK L,;+
MNO?P?J
QHIRSK +
MNO?T?P
QHIRUK + �
HI3PK� L, V ?� (S4.2)
where Q is the heat flux due to convective/conductive/radiative (CCR) heat transfer through the
reactor wall (W); U is the overall heat transfer coefficient (W m-2 .K-1); A is the surface area
(m2); T is the temperature (K); hc is the convective heat transfer coefficient (W m-2 .K-1); k is the
thermal conductivity (W m-1 .K-1); hr is the radiative heat transfer coefficient (W m-2 .K-1); r is
the radius (m); L is the height of cylinder (m); i,o refer to the inside and outside locations in the
bulk mixture immediately adjacent to the wall boundary layers; A, B represent different types of
materials (PVC and AeroFlex_EPDM ); 1,2,3 represent the inner to outer radii, respectively.
Biological heat (BH) is defined by:
W� = W�X × WY × "32�Z&53 (S4.3)
where BHO is the peak of biological heat output (W kg-1TS), BD is the dry mixture bulk density
(kgTS m-3), Vreactor is the volume of the reactor (m3) and TS represents the total solids in the
mixture. For estimating instant CCR and BH, data presented in Table S4.1 were assumed.
CHAPTER 4. ASSEMBLY AND OPERATION OF LAB-SCALE COMPOSTING REACTOR
110
Table S4.1: Data used for estimation of CCR heat losses and biological heat production on a cylindrical self-heating composting reactor. Adapted from Mason and Milke (2005).
Parameter Units Value Peak biological heat output (BH0) W kg-1
TS 28.0
Mixture bulk density (BD) kg m-3 250
Moisture content of mixture % 65
Compost temperature ºC 70
Ambient temperature ºC 25
PVC thermal conductivity W m-1 .K-1 0.092
Thickness of PVC mm 5
AeroFlex_EPDM thermal conductivity W m-1 .K-1 0.035
Thickness of AeroFlex_EPDM mm 36
Convective/radiative heat transfer coefficient
(hc, hr) W m-2 .K-1 10
Table S4.2 summarizes experimental results for analysing the ash balance closure (%),
which was calculated according to Eq.(4.3).
Table S4.2: Experimental results of ash conservation for SHR.
In the scope of this work, the selection of the initial mixture for subsequent composting
of eggshell was performed on a high self-heating based concept, meaning that finding the
composting mixture with higher oxygen consumption per unit of organic matter during
thermophilic activity was the prime goal.
CHAPTER 5. EVALUATION OF SELF-HEATING POTENTIAL IN SPECIFIC MIXTURES
118
For each mixture tested in the reactors SHR1 to SHR3, whose properties were indicated in
Table 5.1, Figure 5.1 a) shows the temperature and airflow profiles and Figure 5.1 b) depicts the
OUR evolution, over 25 days of composting trials.
Figure 5.1: Evolution of (a) temperature and airflow rate and (b) OUR for SHR1 to SHR3 reactors.
The results reveal that regardless of the mixture composition, temperature profiles have
the expected behaviour over time, where the three classic phases are well observed (Zhu, 2006).
Indeed, a short initial phase is visible due to the activity and growth of mesophilic organisms that
increase the temperature within the first 24 h of composting. Then, the thermophilic phase
(T>40ºC) was developed and lasted about 7 days, promoting degradation of materials, while
non-thermo-tolerant organisms were inhibited. Finally, the mesophilic activity arose once again
and determined the temperature profile, reflecting the depletion of readily biodegradable
Composting time (days)
0 5 10 15 20 25 30
Tem
pera
ture
(ºC
)
0,0
0,5
1,0
1,5
2,020,0
30,0
40,0
50,0
60,0
70,0A
ir flo
w
(L m
in-1
kg
VS
-1)
b)
a) SHR2SHR3SHR1
Composting time (days)
0 5 10 15 20 25 30
OU
R (
g O
2 . k
g-1 V
S h
-1)
0
1
2
3
4
5
6
7
8
SHR2SHR3SHR1
High biodegradability
Medium biodegradability
Low biodegradability
PART C. COMPOSTING TRIALS WITH INDUSTRIAL EGGSHELL WASTE
119
components. The maximum temperatures achieved were 61.9, 60.4 and 57.5ºC for SHR1 to
SHR3, respectively.
Differences between mixtures were also observed in terms of time/temperature relations
for thermal inactivation of pathogens. In accordance to Haug (1993), most common pathogens
and parasites present a minimum threshold of 55ºC during 10 to 60 min of exposure for thermal
inactivation. In this study, SHR3 presented a lower exposure period of 5 consecutive hours to
55ºC, while for SHR1 and SHR2 that period attained 81 and 68 hours, respectively. Nevertheless,
none of the mixtures tested attained the criteria of temperature exposure (70ºC for 1 h) imposed
by Commission Regulation (EU) Nº142/2011 now in force, which might be a consequence of
excessive aeration (high airflow rates).
However, according to Figure 5.1 a) the heat removal by convection may have been
lower for SHR3 in comparison with SHR1 and SHR2, because the air flow rate applied by kg of
VS was smaller in the former case. Therefore differences found in terms of time/temperature
exposure should be attributed to the biodegradability of the organic matter in the starting
material. The lower capacity of mixture SHR3 to achieve and maintain higher temperatures is
also observable in OUR profile. According to Figure 5.1 b) the maximum OUR reached in SHR3
ranged the interval characterized by moderate biodegradability as indicated by Barrena et al.
(2011), which points out a smaller availability of biodegradable organic matter. This is probably
due to the presence of higher amounts of rice husks that contain significant levels of recalcitrant
organic matter. In addition, also biodegradability of the potato peel may play a role owing to the
presence of compounds like lignin and phenolic substances (Ezekiel et al., 2013) that are rather
resistant to degradation and their rate of disappearance is not as fast as that of polysaccharides
(Said-Pullicino et al., 2007).
For the mixtures SHR1 and SHR2 the maximum OUR reached the level of “high
biodegradability”, but the OUR cumulative values for thermophilic phase (T>40ºC) were 432
and 624 g O2 kg-1 of organic matter for SHR1 and SHR2, respectively. This means that the SHR2
mixture is characterized by a higher thermal energy to drive the composting process into
thermophilic temperatures and induce pathogen elimination as required for eggshell recycling by
composting.
However, high biodegradable mixtures may impair composting because when materials
decompose quickly, pores between particles are reduced and gas transfer conditioned
(Alburquerque et al., 2008). Therefore, FAS was quantified according to Eq (3.6) and (3.10) and
pore space evolution during composting is presented in Figure 5.2.
CHAPTER 5. EVALUATION OF SELF-HEATING POTENTIAL IN SPECIFIC MIXTURES
120
Figure 5.2: Evolution of FAS during composting of SHR1, SHR2, SHR3 a) by Eq (3.6) b) by Eq (3.10) (measurements correspond to means of 3 replicates and error bars indicate standard deviation).
In general, FAS calculated by Eq. (3.6) is slightly lower than quantification provided by
the theoretical approach proposed by Richard et al. (2004), Eq. (3.10), with relative errors
ranging between -1.6 to -8.9%. Nevertheless, FAS evolution during composting was similarly
described by the two equations used in this study, and both emphasized that SHR2 undergoes a
more prominent reduction of FAS during the most active phase of biodegradation (the initial 7
days of compost). But the proportion of rice husk in mixture SHR2 allowed to maintain FAS far
above 30%, which is commonly considered to be the limiting value (Huet et al., 2012).
Thus, it was considered that the higher biodegradability of SHR2 places no restriction on
the pore volume. Therefore, the SHR2 mixture was considered for further experiments with
eggshell waste.
Composting time (days)
0 5 10 15 20 25 30
FA
S (
%)
60
65
70
75
80
85
SHR2
SHR3
SHR1
Composting time (days)
0 5 10 15 20 25 30
FA
S (
%)
60
65
70
75
80
85
SHR2
SHR3
SHR1
a)
b)
PART C. COMPOSTING TRIALS WITH INDUSTRIAL EGGSHELL WASTE
121
The effect of air flow on reaction temperatures of the SHR2 mixture was still evaluated.
In this experiment, the mixture formulation (SHR2+0%ES) was equal to SHR2, a working reactor
volume of 105 L was used, and the starting airflow was set to 3.5 L min-1, equivalent to
0.5 L min-1 kg-1 of initial organic matter. The air volumetric rate was adjusted over time, and
homogenisation and sampling procedures followed the methods aforementioned.
Figure 5.3 compares temperature, airflow rate and OUR observed in SHR2 and
SHR2+0%ES for 25 days of composting.
Figure 5.3: Evolution of (a) temperature and airflow rate and (b) OUR composting for SHR2 and SHR2 +0%ES.
By reducing the air flow initially fed to the mixture SHR2 from 1.3 to 0.5 L min-1 kg-1 of
initial organic matter, a significant increase in the maximum temperature was attained (from
60.4ºC to 72.8ºC, Figure 5.3 a)). These findings indicate that the mixture was sensitive to the air
flow rate with respect to heat removal by convection during composting.
Composting time (days)
0 5 10 15 20 25 30
Tem
pera
ture
(ºC
)
0,0
0,5
1,0
1,5
2,0
20,0
30,0
40,0
50,0
60,0
70,0
Air
flow
(L
min
-1 k
g V
S-1
)
Composting time (days)
0 5 10 15 20 25 30
OU
R (
g O
2 kg
VS
-1 h
-1)
0
1
2
3
4
5
6
7
8
SHR2+0%ESSHR2
b)
a) SHR2+0%ESSHR2
High biodegradability
Medium biodegradability
Low biodegradability
CHAPTER 5. EVALUATION OF SELF-HEATING POTENTIAL IN SPECIFIC MIXTURES
122
Regarding biodegradability, the maximum OUR reached was slightly reduced in the early
stage of the process (5.3 to 4.8 g O2 kg-1 VS h-1, Figure 5.3 b)), probably due to an initial
limitation in oxygen concentration during that stage, but that change was determinant to reduce
convective heat losses, and therefore attain the desired sanitation temperatures needed for ES
treatment. Nevertheless, seeding of the initial mixture would be a worthwhile option to evaluate
in further studies. In fact, the addition of adequate inoculants could enhance global
biotransformation (reaction rates) with consequent reduction of the mixture susceptibility to the
air convective effects (Nakasaki and Akiyama, 1988).
A preliminary experiment was performed to address the effect of eggshell (ES) waste on
composting process evolution. For this, two mixtures were tested: SHR2-0%ES and SHR2-
30%ES involving 30% (w/w) of ES and 70% (w/w) of a mixture equal to SHR2-0%ES. The
operating conditions were the ones previously described (105 L of reacting volume, airflow of
0.5 L min-1 kg-1 of initial organic matter) and homogenisation and sampling procedures followed
the aforementioned methods.
Profiles shown in Figure 5.4 reveal a rapid increase in temperature for both mixtures,
mainly due to microbial metabolism favoured by the presence of readily available organic
substances. The reaction temperature reached about 70ºC and remained above that value for 18
consecutive hours for SHR2+0% ES and 8.7 hours for SHR2+30% ES. Thus, the addition of 30%
of ES allows compliance with the minimum time and temperature sanitising requirements of 1 h
at 70ºC, proposed by Commission Regulation (EU) Nº142/2011.
Figure 5.4: Evolution of temperature and air flow rate, during composting of SHR2 with 0 and 30% ES (w/w).
Composting time (days)
0 5 10 15 20 25 30
Tem
pera
ture
(ºC
)
0,0
0,5
1,0
1,5
2,0
20,0
30,0
40,0
50,0
60,0
70,0
Air
flow
(L
min
-1 k
g V
S-1
)
SHR2 - 0%ES
SHR2 - 30%ES
PART C. COMPOSTING TRIALS WITH INDUSTRIAL EGGSHELL WASTE
123
5.4. Conclusions
The objective of this work was to select a mixture composition of potato peel (PP), grass
clippings (GC) and rice husks (RH) with self-heating potential enough to promote sanitation of
eggshell waste (ES). The composting experiments showed that the three organic mixtures tested
with PP, GC and RH ranged from moderate to highly biodegradable. The mixture with higher
content in RH and lower proportions of GC presented the smaller biological activity. In
opposition, upper GC fractions enhanced the self-heating potential, therefore SHR2 was
suggested for future experiments with ES. Results indicated the air flow rate may be controlled
to avoid excessive heat removal.
Preliminary experimental tests showed that ES incorporation did not affect significantly
the capacity of the composting mixture to reach sanitising conditions. Nevertheless, the higher
content of nitrogen in SHR2, due to the upper fraction of grass clippings, may arise some issues
regarding nitrogen conservation during composting that will be addressed in the next chapter.
5.5. References
Agra CEAS Consulting Ltd, 2008. The EU egg production sector.
Alburquerque, J.A., Mccartney, D., Yu, S., Brown, L., Leonard, J.J., 2008. Air Space in Composting Research : A Literature Review. Compost Sci. Util. 16, 159–170.
An, C., Huang, G., Yao, Y., Sun, W., An, K., 2012. Performance of in-vessel composting of food waste in the presence of coal ash and uric acid. J. Hazard. Mater. 203-204, 38–45.
Barrena, R., Canovas, C., Sánchez, a., 2006. Prediction of temperature and thermal inertia effect in the maturation stage and stockpiling of a large composting mass. Waste Manag. 26, 953–959.
Barrena, R., D’Imporzano, G., Ponsá, S., Gea, T., Artola, A., Vázquez, F., Sánchez, A., Adani, F., 2009. In search of a reliable technique for the determination of the biological stability of the organic matter in the mechanical–biological treated waste. J. Hazard. Mater. 162, 1065–1072.
Barrena, R., Gea, T., Ruggieri, L., 2011. Categorizing Raw Organic Material Biodegradability Via Respiration Activity Measurement: A Review. Compost Sci. Util. 19, 105–113.
Bustamante, M., Paredes, C., Marhuenda-Egea, F., Pérez-Espinosa, A., Bernal, M., Moral, R., 2008. Co-composting of distillery wastes with animal manures: carbon and nitrogen transformations in the evaluation of compost stability. Chemosphere 72, 551–557.
Ezekiel, R., Singh, N., Sharma, S., Kaur, A., 2013. Beneficial phytochemicals in potato — a review. Food Res. Int. 50, 487–496.
FAO, 2012. FAOSTAT [WWW Document]. URL http://faostat.fao.org/site/569/default.aspx#ancor (accessed at 4-6-2013)
CHAPTER 5. EVALUATION OF SELF-HEATING POTENTIAL IN SPECIFIC MIXTURES
124
Farrell, M., Jones, D.L., 2009. Critical evaluation of municipal solid waste composting and potential compost markets. Bioresour. Technol. 100, 4301–4310.
Haug, R.T., 1993. The practical handbook of compost engineering. CRC-Press.
Huet, J., Druilhe, C., Trémier, A., Benoist, J.C., Debenest, G., 2012. The impact of compaction, moisture content, particle size and type of bulking agent on initial physical properties of sludge-bulking agent mixtures before composting. Bioresour. Technol. 114, 428–36.
Meski, S., Ziani, S., Khireddine, H., Yataghane, F., Ferguene, N., 2011. Elaboration of the hydroxyapatite with different precursors and application for the retention of the lead. Water Sci. Technol. 63, 2087.
Nakasaki, K., Akiyama, T., 1988. Effects of seeding on thermophilic composting of household organic waste. J. Ferment. Technol. 66, 37–42.
Richard, T., Veeken, A., de Wilde, V., Hamelers, H., 2004. Air-Filled Porosity and Permeability Relationships during Solid-State Fermentation. Biotechnol. Prog. 20, 1372–1381.
Russ, W., Meyer-Pittroff, R., 2004. Utilizing waste products from the food production and processing industries. Crit. Rev. Food Sci. Nutr. 44, 57–62.
Said-Pullicino, D., Erriquens, F., Gigliotti, G., 2007. Changes in the chemical characteristics of water-extractable organic matter during composting and their influence on compost stability and maturity. Bioresour. Technol. 98, 1822–1831.
Soares, M.A.R., Quina, M.J., Quinta-Ferreira, R., 2013. Prediction of free air space in initial composting mixtures by a statistical design approach. J. Environ. Manage. 128, 75–82.
Tsai, W.-T., Hsien, K.-J., Hsu, H.-C., Lin, C.-M., Lin, K.-Y., Chiu, C.-H., 2008. Utilization of ground eggshell waste as an adsorbent for the removal of dyes from aqueous solution. Bioresour. Technol. 99, 1623–9.
Zhu, N., 2006. Composting of high moisture content swine manure with corncob in a pilot-scale aerated static bin system. Bioresour. Technol. 97, 1870–5.
PART C. COMPOSTING TRIALS WITH INDUSTRIAL EGGSHELL WASTE
125
6. Valorisation of industrial eggshell by co-composting:
influence of eggshell content and N-rich material*
Industrial eggshell (ES) is an animal by-product (ABP) involving some risk if not
properly managed. Composting is a possible treatment approved for its safe use. This study aims
to assess the influence of using N-rich material (grass clippings) to improve co-composting of
ES mixtures for reaching sanitising temperatures imposed by the animal by-product regulation
from the European Union.
Two sets of mixtures (M1 and M2) were investigated each containing industrial potato
peel waste, grass clippings and rice husks at 3:1.9:1 and 3:0:1 ratios by wet weight. In each set,
ES composition ranged from 0 to 30% (w/w). Composting trials were performed in self-heating
reactors for 25 days, followed by maturation in piles. Results showed that only M1 trials attained
temperatures higher than 70ºC for 9 consecutive hours, but N-losses by stripping on average
were 4 to 5-fold higher than M2.
In the absence of N-rich material, biodegradability of mixtures was “low” to “moderate”
and organic matter conversion was impaired. Physical, chemical and phytotoxic properties of
finished composts were suitable for soil improvement, but M1 took more 54 days to achieve
maturity. In conclusion, co-composting ES with N-rich materials is important to assure the
fulfilment of sanitising requirements, avoiding any additional thermal treatment.
Abbreviations: BD: bulk density; Corg: organic carbon; dm: dry matter LOD: limit of detection (2.4 mg N kgdm-1 for N-
NO3- and N-NO2
-); MC: moisture content; Norg: organic nitrogen; VS: volatile solids; VSsource: contribution of each material to VS in the mixture; WHC: water holding capacity.
6.3.2. Composting trials
6.3.2.1. Temperature profiles
Thermal inactivation is considered the main mechanism for pathogens suppression
throughout composting, important to obtain a hygienic and safe end-product (Farrell and Jones,
2009). Thermal exposure of the mixtures tested is illustrated in Figure 6.1 a) and b). Table 6.4
summarises the influence of GC incorporation in some parameters of the thermal pattern found
for each mixture. Throughout 25 days of composting in self-heating reactors, oxygen
concentrations (%v/v) depicted in Figure S6.1 (supplementary data) were comprised between 7
and 20 % (v/v) assuring aeration rate levels were adequate to maintain aerobic conditions
(Puyuelo et al., 2010).
CHAPTER 6. VALORISATION OF INDUSTRIAL EGGSHELL BY CO-COMPOSTING
132
Figure 6.1: Evolution of core centre and ambient temperatures of mixtures a) M1 and b) M2, during first 25 days of composting.
Table 6.4: Influence of GC in thermal parameters of composting trials.
Mixture Tmax
(ºC) tmax
(days)
Consecutive period with T>70ºC (h)
Consecutive period with T>55ºC (d)
Thermophilic period with T>40ºC (days)
M1+0%ES 72.8 0.7 18 6.0 7.7
M1+10%ES 72.3 0.7 16 5.4 7.7
M1+20%ES 72.3 0.8 18 5.2 7.8
M1+30%ES 72.0 1.1 9 4.8 6.9
M2+0%ES 58.4 1.5 0 1.8 6.8
M2+10%ES 60.1 1.5 0 1.8 5.9
M2+20%ES 62.5 1.5 0 2.2 5.4
M2+30%ES 62.4 1.5 0 2.5 5.9
Composting time (days)
0 5 10 15 20 25 30
Tem
pera
ture
(ºC
)
15
20
25
30
35
40
45
50
55
60
65
70
75
M1+0%ESM1+10%ESM1+20%ESM1+30%ES
Tamb
Composting time (days)
0 5 10 15 20 25 30
Tem
pera
ture
(ºC
)
15
20
25
30
35
40
45
50
55
60
65
70
75
M2+0%ESM2+10%ESM2+20%ESM2+30%ESTamb
Legal limit a)
b) Legal limit
PART C. COMPOSTING TRIALS WITH INDUSTRIAL EGGSHELL WASTE
133
Independently of the mixture composition, the typical temperature-dependent phases
were observed (Figure 6.1 a) and b)). Initially, a short mesophilic phase (less than 7 h in all
cases). Then a themophilic phase (T>40ºC) was developed, and finally another mesophilic phase
arose again indicating that thermotolerant organisms were inhibited due to the depletion of
readily available organic substances.
For all M1 mixtures, temperature reached 70ºC and remained above for 9 to 18
of a lag phase in the process, even when a rich N-source was absent (Figure S6.2 to S6.3-
supplementary data). In general, Figure 6.3 shows that incorporation of GC triggered an increase
of 45% in Xvs, which is reflected by an average upsurge of the same level (43%) in the total
oxygen consumed by unit of VS degraded. This behaviour has not been reported for other
composting mixtures. For example, GC incorporation (15% w/w) in a blend of sewage sludge
with wood chips and rape straw can impair VS conversion (lessening from 0.51 to 0.33) with
consequent reduction of temperatures (Kulikowska and Klimiuk, 2011).
Figure 6.3: Influence of GC in organic matter conversion and total oxygen consumption by unit of organic matter degraded.
M1_0%ES
M1_10%ES
M1_20%ES
M1_30%ESM2_0%ES
M2_10%ES
M2_20%ES
M2_30%ES0
20
40
1000
1250
1500 Total oxygen consumption (g O2 kg-1 VSd)
XVS (%)
CHAPTER 6. VALORISATION OF INDUSTRIAL EGGSHELL BY CO-COMPOSTING
136
For M1, total oxygen consumption (g O2 kg-1 VSd) is comparable to the aerobic
degradation of separated pig solids with wood chips (1432 g O2 kg-1 VSd), while M2 was similar
to household waste (1050 g O2 kg-1 VSd) (de Guardia et al., 2010a). However, in the latter case,
VS conversion was much more expressive (0.95) than observed in M2 (≈0.30), which highlights
the importance of waste nature on the biodegradation potential (de Guardia et al., 2010a).
6.3.2.3. Moisture and physical changes
Moisture content is considered a key factor for efficient composting. Some studies
reported a wide range from 25% to 50% on a wet basis (Ahn et al., 2008). In general,
composting proceeds better at moisture content of 50-70% (Liang et al., 2003). However, each
mixture may have singular properties that can affect the optimum relationship between moisture
content, water availability and porosity (Ahn et al., 2008). Figure 6.4 indicates moisture content,
wet bulk density and FAS over 25 days.
Figure 6.4: Influence of GC on a) moisture, b) wet bulk density and c) FAS evolution during composting (mean±standard deviation, n=3).
M1+0%ES
M1+10%ES
M1+20%ES
M1+30%ES
M2+0%ES
M2+10%ES
M2+20%ES
M2+30%ES
Moi
stur
e (%
)
40
50
60
70
80
0 days 4 days 12 days 20 days 25 days
M1+0%ES
M1+10%ES
M1+20%
ES
M1+30%ES
M2+0%
ES
M2+10%ES
M2+20%ES
M2+30%
ES
FA
S (
%)
40
50
60
70
80
90
M1+0%ES
M1+10%ES
M1+20%
ES
M1+30%ES
M2+0%ES
M2+10%ES
M2+20%ES
M2+30%ES
Bd
(kg
m-3
)
200
250
300
350
400
450
a) b)
c)
PART C. COMPOSTING TRIALS WITH INDUSTRIAL EGGSHELL WASTE
137
In M1 mixtures, moisture fluctuations over 25 days of composting were not very
expressive. Normally high thermophilic temperatures favor water evaporation and require
external water correction (Brito et al., 2012). But in the present study no correction was
necessary because part of the vapor was allowed to condensate and drop back to solid matrix.
Frequent mixing of the reactors redistributed condensed water in the composting matrix. Though
the initial available water capacity of M1 was between 12 and 19% of the maximum WHC
(Table 3) no leachates were formed, and composting evolved as expected. For M2 there is a
slight tendency to increase moisture, but it was probably damped due to the higher available
water capacity of the initial mixtures (25 to 32.2 % of maximum WHC) (Table 6.3).
As previously mentioned, ES incorporation affected the wet bulk density of the starting
mixtures, but during composting different trends for BD were observed, depending on the
proportion of GC used. While for M1 (with GC) BD increases as composting evolves, for M2
(without GC) the opposite was observed (Figure 6.4 b)). In the case of M1, a significant increase
was noticed during the first four days, which corresponds to the period of higher OUR (Figure
6.2 a)). This fast breakdown of organic matter provoked a sudden reduction of pores volume. In
fact, for ternary mixtures of PP:GC:RH, GC contributes to the increase of pore volume of a
blend (Soares et al., 2013b), but as it decomposes interparticle pore volume is reduced. As a
result, M1 suffered a small FAS reduction (Figure 6.4 c)). However, composting was not
hindered, since FAS was kept well above 30%, which is commonly considered the limiting value
(Huet et al., 2012). The reduction of BD for M2 as biodegradation progresses, highlights that RH
provided enough structure to support the solid matrix, as organic substrates were transformed in
a low to moderate rate, Figure 6.2 b). Consequently, FAS suffered a slight increase (Figure 6.4
c)).
6.3.2.4. Nitrogen transformation and estimation of N losses
Mechanism of nitrogen transformation and transfer during composting are complex and
may lead to significant N losses, thus affecting the agronomic value of the composting end-
product with a negative impact for the environment (Hubbe et al., 2010). During aerobic
degradation, ammonification corresponds to the transformation of organic nitrogen into
ammoniacal nitrogen. This fraction is added to the initial content, thus constituting a pool (N
pool) that can be either lost through leaching or released as ammonia by stripping. Recent studies
have shown that N pool is positively correlated to overall N losses during composting (Zeng et
al., 2012a) and ammonification is the most contributing process (de Guardia et al., 2010b; Zeng
et al., 2012a). Figure 6.5 presents the ammonification rate and N pool associated to N
CHAPTER 6. VALORISATION OF INDUSTRIAL EGGSHELL BY CO-COMPOSTING
138
transformation during composting of mixtures M1 and M2 for 25 days. Ammonification rate
(AR) was calculated as:
�� %) =∆ ���
���,�× 100% (6.3)
where ∆Norg corresponds to the mass of organic N removed during the first 25 days of
composting (g N) and Norg,0 is the mass of organic N in the starting mixture (g N).
The N pool was quantified as (de Guardia et al., 2010b):
� ���� = �-���,�� +
∆ ���
��� (6.4)
where N-NH+4,0 is the total ammoniacal nitrogen present in the starting composting mixture (gN
kg-1 VS0) and VS0 is the mass of volatile solids in the starting mixture. The parameters ∆Norg,
Norg,0 and VS0 were corrected with sample withdraws during process monitoring. Detailed
calculations are indicated in Table S6.4 – supplementary data. Figure 6.5 clearly illustrates that
the ammonification rate significantly differs between M1 and M2.
Figure 6.5: Ammonification and N pool for M1 and M2 mixtures during 25 days of composting (error bars standard deviation)
Thus, GC is the component whose biodegradation was responsible for the general
upsurge of the ammonification rate in M1. As a result, N pool is significantly higher and it can be
hypothesized that N losses by stripping (since no leachates were produced) were stimulated by
GC. In fact, M1 involved higher temperatures (Figure 6.1) and biodegradability (Figure 6.2) thus
creating operational conditions that favour ammonia removal through that route. The levels of
ammonification recorded for M1 are comparable to the ones obtained by de Guardia et al.
(2010b) for composting household waste (36-47%).
In addition, ES incorporation seems to affect in some extent the ammonification rate of
M2, thus leading to an increase of the N pool with the consequent slightly higher potential for N
losses, though this potential is always smaller than in the case of M1 (Figure 6.5). Supposing that
Mixture
M1+0%ES
M1+10%ES
M1+20%ES
M1+30%ES
M2+0%ES
M2+10%ES
M2+20%ES
M2+30%ES0
10
20
30
40
50
AR (%)Pool P (gN kg -1 VSo)
AR (%)N Pool (g N kg -1 VSo)
PART C. COMPOSTING TRIALS WITH INDUSTRIAL EGGSHELL WASTE
139
ammonification is associated to biodegradation (de Guardia et al., 2008) no alterations would be
recorded for M2, since biodegradation attained for that mixtures is quite similar, independently of
ES incorporation (Figure 6.3). On the other hand, Guardia et al. (2010) also showed that
ammonification ability differs significantly from one waste to another. Thus in this study, ES is
presented as an ingredient that alters the ammonification ability of M2, by contributing to an
increase of the amount of N ammonified per unit of organic carbon degraded. Nevertheless, the
understanding of the mechanisms behind this behaviour should be adequately evaluated in
further studies.
Figure 6.6 shows the evolution of mineral N during 90 days of composting. In general
terms, differences amongst mixtures are mainly related to the concentration of N species which
are higher when GC is present.
Figure 6.6: Evolution of mineral N during M1 and M2 for 90 days of composting (error bars indicate standard deviation, n=3): a) 0% ES, b) 10% ES, c) 20% ES, d) 30% ES.
Composting time (days)
0 20 40 60 80 100
Min
eral
N s
peci
es (
mg
N k
g-1)
0
1000
2000
3000
4000
N-NH4+ M1+0%ES
N-NH4+ M2+0%
N-NO3- M1+0%ES
N-NO3- M2+0%ES
Composting time (days)
0 20 40 60 80 100
Min
eral
N s
peci
es (
mg
N k
g-1)
0
1000
2000
3000
4000
N-NH4+ M1+10%ES
N-NH4+ M2+10%
N-NO3- M1+10%ES
N-NO3- M2+10%ES
Composting time (days)
0 20 40 60 80 100
Min
eral
N s
peci
es (
mg
N k
g-1)
0
1000
2000
3000
4000
N-NH4+ M1+20%ES
N-NH4+ M2+20%
N-NO3- M1+20%ES
N-NO3- M2+20%ES
Composting time (days)
0 20 40 60 80 100
Min
eral
N s
peci
es (
mg
N k
g-1)
0
1000
2000
3000
4000
N-NH4+ M1+30%ES
N-NH4+ M2+30%
N-NO3- M1+30%ES
N-NO3- M2+30%ES
a) b)
c) d)
CHAPTER 6. VALORISATION OF INDUSTRIAL EGGSHELL BY CO-COMPOSTING
140
In particular for M1, N-NH4+ values are significant, but as maturation evolves N-NH4
+
tend to 400 mg kg-1 which is the maximum recommended value for mature composts (Zuconni
and de Bertoldi, 1987). Regardless the mixture composition, nitrification seems to be inhibited
during the thermophilic phase, since temperatures higher than 40ºC impair the ammonia-
oxidizing bacteria responsible for nitrification (Sanchez-Monedero et al., 2001). Additionally,
those bacteria grow slowly and can be inhibited by the competitive activities of heterotrophic
microorganisms (Zeng et al., 2012b). Thus, little accumulation of N-NO3- was observed in the
early stages of M1 and M2 (Figure 6.6). However, as the process evolves to maturation phase
nitrification became significant with consequent build-up of NO3- in the compost.
6.3.3. Compost quality
The feasibility of composting as a waste management option for ES is also deeply
associated to the value of the final compost. The self-heating potential of the mixtures is of
special concern to meet European regulation, but the ability to obtain final compost with quality
level is also relevant. The main properties of the final composts obtained in this study are
indicated in Table 6.5. For mixtures with GC, a longer period of time of maturation was required
(144 days) since after 90 days composts were still phytotoxic (data not shown).
All composts revealed to be alkaline with a low electrical conductivity, despite composts
obtained from M1 presented a higher salinity. The neutralizing capacity (evaluated as equivalent
CaCO3) was not affected by the presence of GC, but this property was dose-responsive to ES in
the starting mixtures.
The resistance of composts against further microbial decomposition was high, as the
stability class of the obtained for end-products was A indicating cured composts (Tables 6.2 and
6.5). In addition, all end-products were phytotoxin-free and thus safe for soil application, since
germination indices were higher than 50% (Zuconni and de Bertoldi, 1987). Moreover, the use of
final composts as soil improvers was not conditioned by the presence of heavy metals, since
concentrations were small and beneath the limits imposed by the European proposed quality
criteria for composting products (Table 6.5).
Nitrification ratio (NH4+/ NO3
-) was less than 0.5 as expected from mature composts
(Bernal et al., 2009). Humification was indirectly assessed by CEC, by considering that humus
build-up increases the functional groups. However, that quantification was not possible for
composts with ES, since the carbonate present therein may undervalue that property. Both
M1+0%ES and M2+0%ES have a CEC higher than 60 cmol kg-1dm which is indicative of
maturity (Harada and Inoko, 1980), but this limit was already reached by the starting mixtures
PART C. COMPOSTING TRIALS WITH INDUSTRIAL EGGSHELL WASTE
141
before composting (95 and 54 cmol kg-1dm for M1+0%ES and M2+0%ES, respectively). Thus, in
this case, CEC is not a good indicator for maturity concerning humification (Bernal et al., 2009).
Table 6.5: Main properties of the final composts, after 144 days of composting (mean±standard deviation, n=3)
EC: electrical conductivity; OM: organic matter; VS: volatile solids; TOC: total organic carbon; TN: total nitrogen; GI: germination index; CEC: Cation exchange capacity; dm: dry matter; nd: not determined; Tmax: maximum temperature * values in brackets represent the limit concentration according to end-of-waste criteria for biodegradable waste subject to biological treatment (draft final report).
FTIR spectra for all composts are depicted in Figure S6.6 to S6.8 – supplementary data,
where spectra for the starting mixtures are also shown for comparison. The infrared absorbance
regions of composts and starting mixtures are similar whether or not GC is present, though bands
intensity can be different. The main infrared peaks for composts without ES included O-H and
N-H bands in 3400 cm-1, C-H stretch of aliphatic compounds in 2920-2850 cm-1, C=O bands in
1740 cm-1 due to aldehydes, ketone, carboxylic acids and esters, C=C of aromatic skeleton in
1595 cm-1, lignin in 1510 cm-1, aliphatic C-H in 1460 cm-1, C-N stretch of amines in 1320 cm-1,
C-O and C-N vibration of carboxylic acids and amides in 1240 cm-1 and C-O stretching of
polysaccharides, polysaccharides-like substances and Si-O silicate impurities in 1160-1060 cm-1.
When ES is in mixtures, peaks at 2515, 1800, 1420 and 875 cm-1 are also evident, which are
ascribed to carbonates (Smidt and Meissl, 2007). Changes in the spectra during composting
CHAPTER 6. VALORISATION OF INDUSTRIAL EGGSHELL BY CO-COMPOSTING
142
indicate that easily degradable organic constituents such as short aliphatic chains (bands at 2920-
2850 cm-1) and polysaccharides (bands at 1160-1060 cm-1) were biooxidised. In addition, the
peaks reduction at 1740 cm-1 and 1240 cm-1 for M1+0%ES and M2+0%ES are indicative that
early metabolic products like aldehydes, ketones and esters are also further biodegraded as well
as amides.
In particular for M1, organic constituents show a more intensive biodegradation of
aliphatic structures than M2 (higher reduction of peaks at 2920-2850 cm-1) which is consistent
with higher reaction temperatures and oxygen consumptions previously found for M1 (Figure 6.1
a) and 6.2 a)). The increase of aromatic C=C when compared to aliphatic carbon (illustrated by
ratio of peaks 1650/2920 and 1650/2850 (Ouatmane et al., 2000) in Table S6.5 – supplementary
data) reflects that final composts contained more aromatic structures of higher stability and
humification has occurred at some extent for all mixtures.
6.5. Conclusions
The influence of N- rich material in the physical and chemical changes taking place
during co-composting of eggshell waste (ES) with potato peel (PP) was considered in this study.
Grass clippings (GC) were selected as N-rich source and rice husks as bulking agent.
Experimental tests in self-heating reactors showed that GC were determinant to attain the
sanitizing conditions imposed by animal by-product regulation (T>70ºC for 1 h). Temperature
and instantaneous OUR revealed a positive correlation. M1 mixtures (with GC) remained near to
the high biodegradable level during the first 3 to 4 days of composting, while for M2 (without
GC) aerobic degradation was significantly impaired and OUR became “low” to “moderate”
biodegradability.
Physical changes during composting did not lessened the process evolution, though GC
may favour the reduction of the interparticle pore volume, as it decomposes.
For M1, organic matter biodegradation was enhanced and ammonification occurred in
higher extent, thus leading to a higher potential for N-losses. Mineral nitrogen transformations
were distinct in terms of concentration levels, but followed identical transformation routes.
End-product quality assessment evidenced that all composts obtained were stable and
mature, but pathogen inactivation was not assured when GC was absent. Nevertheless, maturity
achievement took longer for end-products with GC.
In summary, ES recycling through composting process is adequate for obtaining
neutralizing Ca-rich soil improver, but the presence of N-rich material may be a determinant
PART C. COMPOSTING TRIALS WITH INDUSTRIAL EGGSHELL WASTE
143
factor to reach pathogen-killing temperatures as legally required. Strategies to overcome the
potential of N-losses associated to M1 mixtures should be further investigated for optimising N
conservation.
6.6. References
Adani, F., Confalonieri, R., Tambone, F., 2004. Dynamic respiration index as a descriptor of the biological stability of organic wastes. J. Environ. Qual. 33, 1866–76.
Baláž, M., 2014. Eggshell membrane biomaterial as a platform for applications in materials science. Acta Biomater. 10, 3827–3843.
Barrena, R., Artola, A., Vázquez, F., Sánchez, A., 2009. The use of composting for the treatment of animal by-products: Experiments at lab scale. J. Hazard. Mater. 161, 380–6.
Barrena, R., Gea, T., Ruggieri, L., 2011. Categorizing Raw Organic Material Biodegradability Via Respiration Activity Measurement: A Review. Compost Sci. Util. 19, 105–113.
Benito, M., Masaguer, A., Moliner, A., Hontoria, C., Almorox, J., 2009. Dynamics of pruning waste and spent horse litter co-composting as determined by chemical parameters. Bioresour. Technol. 100, 497–500.
Bernal, M.P., Alburquerque, J.A., Moral, R., 2009. Composting of animal manures and chemical criteria for compost maturity assessment . A review. Bioresour. Technol. 100, 5444–5453.
Bijlsma, P.B., de Wit, D.H., Duindam, J.W., Elsinga, G.J., Elsinga, W., 2013. Spot test analysis of microbial contents during composting of kitchen- and garden biowaste: sampling procedures, bacterial reductions, time-temperature relationships, and their relevance for EU-regulations concerning animal by-products. J. Environ. Manage. 115, 198–205.
Brito, L., Mourão, I., Coutinho, J., Smith, S., 2012. Simple technologies for on-farm composting of cattle slurry solid fraction. Waste Manag. 32, 1332–1340.
Castaldi, P., Alberti, G., Merella, R., Melis, P., 2005. Study of the organic matter evolution during municipal solid waste composting aimed at identifying suitable parameters for the evaluation of compost maturity. Waste Manag. 25, 209–13.
Cayuela, M.L., Mondini, C., Insam, H., Sinicco, T., Franke-Whittle, I., 2009. Plant and animal wastes composting: effects of the N source on process performance. Bioresour. Technol. 100, 3097–106.
Cayuela, M.L., Sánchez-Monedero, M.A., Roig, A., Sinicco, T., Mondini, C., 2012. Biochemical changes and GHG emissions during composting of lignocellulosic residues with different N-rich by-products. Chemosphere 88, 196–203.
Chroni, C., Kyriacou, A., Lasaridi, K., 2012. Abiotic parameters and microbial counts as stability indicators during composting of organic waste, in: Orbit - Global Assessment for Organic Resources and Waste Management. Rénnes, pp. 55–61.
Cordeiro, C.M.M., Hincke, M.T., 2011. Recent patents on eggshell: shell and membrane applications. Recent Pat. Food. Nutr. Agric. 3, 1–8.
De Guardia, A., Mallard, P., Teglia, C., 2010a. Comparison of five organic wastes regarding their behaviour during composting: Part 1, biodegradability, stabilization kinetics and temperature rise. Waste Manag. 30, 402–414.
CHAPTER 6. VALORISATION OF INDUSTRIAL EGGSHELL BY CO-COMPOSTING
144
De Guardia, A., Mallard, P., Teglia, C., Marin, A., Le Pape, C., Launay, M., Benoist, J.C., Petiot, C., 2010b. Comparison of five organic wastes regarding their behaviour during composting: part 2, nitrogen dynamic. Waste Manag. 30, 415–25.
De Guardia, A., Petiot, C., Rogeau, D., Druilhe, C., 2008. Influence of aeration rate on nitrogen dynamics during composting. Waste Manag. 28, 575–87.
Farrell, M., Jones, D., 2009. Critical evaluation of municipal solid waste composting and potential compost markets. Bioresour. Technol. 100, 4301–4310.
Gajalakshmi, S., Abbasi, S. a., 2008. Solid Waste Management by Composting: State of the Art. Crit. Rev. Environ. Sci. Technol. 38, 311–400.
Gea, T., Barrena, R., Artola, A., Sa, A., 2004. Monitoring the Biological Activity of the Composting Process : Oxygen Uptake Rate ( OUR ), Respirometric Index ( RI ), and Respiratory Quotient ( RQ ). Agriculture.
Gestel, K. Van, Mergaert, J., Swings, J., Coosemans, J., Ryckeboer, J., 2003. Bioremediation of diesel oil-contaminated soil by composting with biowaste. Environ. Pollut. 125, 361–368.
Girovich, M.J., 1996. Biosolids Treatment and Management: Processes for Beneficial Use, Environmental Science & Pollution. Taylor & Francis.
Grigatti, M., Cavani, L., Ciavatta, C., 2011. The evaluation of stability during the composting of different starting materials: comparison of chemical and biological parameters. Chemosphere 83, 41–8.
Guru, P.S., Dash, S., 2014. Sorption on eggshell waste--a review on ultrastructure, biomineralization and other applications. Adv. Colloid Interface Sci. 209, 49–67.
Harada, Y., Inoko, A., 1980. The measurement of the cation- exchange capacity of composts for the estimation of the degree of maturity. Soil Sci. Plant Nutr. 26, 127–134.
Hubbe, M., Nazhad, M., Sánchez, C., 2010. Composting as a way to convert cellulosic biomass and organic waste into high-value soil amendments: a review. BioResources 5, 2808–2854.
Huet, J., Druilhe, C., Trémier, A., Benoist, J.C., Debenest, G., 2012. The impact of compaction, moisture content, particle size and type of bulking agent on initial physical properties of sludge-bulking agent mixtures before composting. Bioresour. Technol. 114, 428–36.
Ibrahim, A., Zhou, Y., Li, X., Chen, L., Hong, Y., Su, Y., Wang, H., Li, J., 2015. Synthesis of rod-like hydroxyapatite with high surface area and pore volume from eggshells for effective adsorption of aqueous Pb (II). Mater. Res. … 62, 132–141.
Kang, J., Zhang, Z., Wang, J.J., 2011. Influence of humic substances on bioavailability of Cu and Zn during sewage sludge composting. Bioresour. Technol. 102, 8022–6.
Kopčić, N., Domanovac, M. V, Kučić, D., Briški, F., 2014. Evaluation of laboratory-scale in-vessel co-composting of tobacco and apple waste. Waste Manag. 34, 323–328.
Kulikowska, D., Klimiuk, E., 2011. Organic matter transformations and kinetics during sewage sludge composting in a two-stage system. Bioresour. Technol. 102, 10951–10958.
Kumar, K.N., Goel, S., 2009. Characterization of Municipal Solid Waste (MSW) and a proposed management plan for Kharagpur, West Bengal, India. Resour. Conserv. Recycl. 53, 166–174.
Liang, C., Das, K.C., Mcclendon, R.W., 2003. The influence of temperature and moisture contents regimes on the aerobic microbial activity of a biosolids composting blend. Bioresour. Technol. 86, 131–137.
PART C. COMPOSTING TRIALS WITH INDUSTRIAL EGGSHELL WASTE
145
Lu, S.G., Imai, T., Li, H.F., Ukita, M., Sekine, M., Higuchi, T., 2001. Effect of Enforced Aeration on In-Vessel Food Waste Composting. Environ. Technol. 22, 1177–1182.
Manios, T., 2004. The composting potential of different organic solid wastes: experience from the island of Crete. Environ. Int. 29, 1079–89.
Mason, I., Milke, M., 2005. Physical modelling of the composting environment: a review. Part 1: reactor systems. Waste Manag. 25, 481–500.
McGinnis, M., Queen, J., Buchanan, M., Stokes, C., Cleveland, B., 2011. Waste and Compost Analysis Guide.
Ouatmane, A., Provenzano, M., Hafidi, M., 2000. Compost maturity assessment using calorimetry, spectroscopy and chemical analysis. Compost Sci. Util. 8, 124–134.
Pandey, A.K., Gaind, S., Ali, A., Nain, L., 2009. Effect of bioaugmentation and nitrogen supplementation on composting of paddy straw. Biodegradation 20, 293–306.
Paradelo, R., Moldes, A.B., González, D., Barral, M.T., 2012. Plant tests for determining the suitability of grape marc composts as components of plant growth media. Waste Manag. Res. 30, 1059–65.
Paredes, C., Cegarra, J., Bernal, M.P., Roig, a, 2005. Influence of olive mill wastewater in composting and impact of the compost on a Swiss chard crop and soil properties. Environ. Int. 31, 305–12.
Pepe, O., Ventorino, V., Blaiotta, G., 2013. Dynamic of functional microbial groups during mesophilic composting of agro-industrial wastes and free-living (N2)-fixing bacteria application. Waste Manag.
Puyuelo, B., Gea, T., Sánchez, A., 2010. A new control strategy for the composting process based on the oxygen uptake rate. Chem. Eng. J. 165, 161–169.
Rynk, R., Kamp, M. van de, Willson, G.B., Singley, M.E., Richard, T.L., Kolega, J.J., Gouin, F.R., Lucien Laliberty, J., Kay, D., Murphy, D.W., Hoitink, H.A.J., Brinton, W.F., 1992. On-farm composting handbook. Northeast Regional Agricultural Engineering Service, Ithaca.
Sanchez-Monedero, M., Roig, A., Paredes, C., Bernal, M., 2001. Nitrogen transformation during organic waste composting by the Rutgers system and its effects on pH, EC and maturity of the composting mixtures. Bioresour. Technol. 78, 301–308.
Sánchez-Monedero, M., Serramiá, Civanto, C., Fernández-Hernández, A., Roig, A., 2010. Greenhouse gas emissions during composting of two-phase olive mill wastes with different agroindustrial by-products. Chemosphere 81, 18–25.
Sellami, F., Jarboui, R., Hachicha, S., Medhioub, K., Ammar, E., 2008. Co-composting of oil exhausted olive-cake, poultry manure and industrial residues of agro-food activity for soil amendment. Bioresour. Technol. 99, 1177–88.
Sharma, V.K., Canditelli, M., Fortuna, F., Cornacchia, G., 1997. Processing of urban and agro-industrial residues by aerobic composting: Review. Energy Convers. Manag. 38, 453–478.
Smidt, E., Meissl, K., 2007. The applicability of Fourier transform infrared ( FT-IR ) spectroscopy in waste management. Waste Manag. 27, 268–276.
Soares, M.A.R., Quina, M.J., Quinta-Ferreira, R., 2013a. Co-composting of eggshell waste in self-heating reactors: Monitoring and end product quality. Bioresour. Technol. 148, 293–301.
CHAPTER 6. VALORISATION OF INDUSTRIAL EGGSHELL BY CO-COMPOSTING
146
Soares, M.A.R., Quina, M.J., Quinta-Ferreira, R., 2013b. Prediction of free air space in initial composting mixtures by a statistical design approach. J. Environ. Manage. 128, 75–82.
Tremier, A., De Guardia, A., Massiani, C., Paul, E., Martel, J.L., 2005. A respirometric method for characterising the organic composition and biodegradation kinetics and the temperature influence on the biodegradation kinetics, for a mixture of sludge and bulking agent to be co-composted. Bioresour. Technol. 96, 169–80.
Tsai, W.-T., Hsien, K.-J., Hsu, H.-C., Lin, C.-M., Lin, K.-Y., Chiu, C.-H., 2008. Utilization of ground eggshell waste as an adsorbent for the removal of dyes from aqueous solution. Bioresour. Technol. 99, 1623–9.
Tuomela, M., Vikman, M., Hatakka, A., Itavaara, M., 2000. Biodegradation of lignin in a compost environment : a review. Bioresour. Technol. 72, 169–183.
Wei, Y., Liu, Y., 2005. Effects of sewage sludge compost application on crops and cropland in a 3-year field study. Chemosphere 59, 1257–65.
Woods End Research Laboratory, 2005. Dewar self-heating test: instructions for use.
Zeng, Y., De Guardia, A., Daumoin, M., Benoist, J., 2012a. Characterizing the transformation and transfer of nitrogen during the aerobic treatment of organic wastes and digestates. Waste Manag. 32, 2239–2247.
Zeng, Y., De Guardia, A., Ziebal, C., De Macedo, F., Dabert, P., 2012b. Nitrification and microbiological evolution during aerobic treatment of municipal solid wastes. Bioresour. Technol. 110, 144–52.
Zuconni, F., de Bertoldi, M., 1987. Compost specifications for the production and characterization of compost from municipal solid wastes, in: de Bertoldi, M., Ferranti, M.P., Hermite, P.L., Zucconi, F. (Eds.), Compost: Production, Quality and Use. Elsevier Applied Science, London, pp. 30–50.
6.7. Supplementary material
Table S6.1: General properties of the composting ingredients used for mixtures set M1 and M2 (mean±standard deviation
PART C. COMPOSTING TRIALS WITH INDUSTRIAL EGGSHELL WASTE
167
7.3.1.2. Physical, chemical and phytotoxicological evolution
Some physical parameters of the composting matrix, directly influence the efficiency of
the composting process and the end-product quality (Mohee and Mudhoo, 2005). In particular,
the adequate relation between moisture content, water availability and porosity is depend upon
the ingredients used and their relative proportion within the blend (Ahn et al., 2008). Figures 7.3,
7.4 and 7.5 indicate moisture content, wet bulk density and FAS, respectively, over 25 days.
Figure 7.3: Influence of ES on moisture during composting (mean±standard deviation, n=3).
Figure 7.4: Influence of ES on wet bulk density evolution during composting (mean±standard deviation, n=3).
CHAPTER 7. ANALYSIS OF EGGSHELL CO-COMPOSTING USING PRINCIPAL COMPONENT ANALYSIS
168
Figure 7.5: Influence of ES on FAS evolution during composting (mean±standard deviation, n=3).
Moisture content of the starting composting mixtures was lowered by the incorporation of
ES (Figure 7.3). In addition, due to the inorganic nature of ES the water holding capacity was
also reduced (Table 7.2). ES is a dense material, thus its incorporation intensifies the wet bulk
density of the starting blend, thus lowering the available air voids (Figure 7.4 and 7.5).
As composting proceeds, there is a slight tendency to increase the moisture level (Figure
7.3) for mixtures with 0 to 30%ES, but the available water capacity of the initial mixtures (≈25
to 33% of maximum WHC) (Table 7.3) could endure that behavior. The most recommended
moisture levels are between 50-70%, (Liang et al., 2003) and the moisture content of 0-30%ES
mixtures fitted that interval without leachates formation, meaning that moisture provision was
adequate to maintain microbial activity throughout the composting process. However, for
M2+60%ES, the initial moisture level of 45.7% (wet basis) proved to be higher than the
necessary to support the increase of moisture during the biodegradation of organic matter. As a
result, leachates were formed and their drainage contributed to the decrease of the mixture
moisture content.
For mixtures 0%ES to 30%ES, bulk density evolution presented a tendency to be reduced
as biodegradation progresses. This aspects highlights that RH provided enough structure to
support the solid matrix, as organic substrates were transformed in a low to medium rate as it can
be found in Figure 7.2 c). Consequently, FAS suffered a slight increase.
More specifically, a significant rise in the bulk density to 630 kg m-3 was observed for
M2+60%ES, which was maintained for the rest of the composting period. Though that
PART C. COMPOSTING TRIALS WITH INDUSTRIAL EGGSHELL WASTE
169
compaction still allowed a FAS of near 60% it is believed that air permeability might have been
restricted. According to Das and Keener (1997) high moisture solid beds with high wet bulk
density can cause high compressive stresses. Additionally, the compaction of the matrix due to
its own weight can create vertical profiles of air permeability. Particle size distribution also plays
a role in air permeability. By increasing the particle dimensions, inter-particles spaces increase
and air permeability rises (Huet et al., 2012). In fact, in the present study for M2+60%ES mixture
it was visible that the center region of the bottom layer (20 cm) of the reactor was characterized
by crushed finer particles of eggshell. That probably resulted from the compressive stress that the
nearly 60 kg of material generated inside the reactor.
The impact of these aspects on air distribution should be further investigated, once the
effects of compaction on porosity and permeability have important implications on the design
and operation of a composting process (Richard et al., 2004).
Figures 7.6 to 7.10 present the evolution of chemical and phytotoxicological parameters.
Figure 7.6: Effect of ES incorporation on volatile solids decay (mean±standard deviation, n=3).
VS/V
S0
CHAPTER 7. ANALYSIS OF EGGSHELL CO-COMPOSTING USING PRINCIPAL COMPONENT ANALYSIS
170
Figure 7.7: Effect of ES incorporation on Corg/N evolution (mean±standard deviation, n=3).
Figure 7.8: Effect of ES incorporation on nitrate formation during composting (mean±standard deviation, n=3).
Co
rg /
N
0 10 20 30 60
%ES
Composting time (days)
0 10 20
0
100
200
300
400
500
600
700
0 10 20 0 10 20 0 10 20 0 10 20
NO
3- (
mg
N k
g-1
dm
)
PART C. COMPOSTING TRIALS WITH INDUSTRIAL EGGSHELL WASTE
171
Figure 7.9: Effect of ES incorporation on germination index (mean±standard deviation, n=3).
Figure 7.10: Effect of ES incorporation on pH during composting (mean±standard deviation, n=3).
As ES incorporation increases, the initial organic matter decay rate is more pronounced
(Figure 7.6) indicating a higher microbial activity in comparison to M2+0%ES. However, the
amount of VS converted at the end of 25 days was similar in all cases.
Figure 7.7 depicts C:N evolution along time. Although the initial ratio decreases as the
ES percentage increases, in all cases C:N tends to decline all along. However, M2+60%ES has a
low C:N ratio for effective retention of N released during microbial degradation (Brito et al.,
CHAPTER 7. ANALYSIS OF EGGSHELL CO-COMPOSTING USING PRINCIPAL COMPONENT ANALYSIS
172
2012). As a result, the risk of N volatilisation as NH3 may be enhanced taking into consideration
that this composting mixture is basified with ES presence (Figure 7.10).
Nitrification appears to be favored with ES. Figure 7.8 shows that independently of the
ES content in the mixture, nitrification is inhibited during the thermophilic phase, as expected
(Sanchez-Monedero et al., 2001). But as process evolves and mesophilic temperatures are
established, a build-up of NO3- is observed.
Germination index tends to increase as composting process evolves (Figure 7.9), as
expected. Though ES incorporation seems to be detrimental to the phytotoxin-free potential of
the starting composting mixtures, by lowering GI to values near 50% (Huang et al., 2004).
7.3.2. Compost quality
The value of the final compost is of extreme importance to validate the composting
feasibility for valorisation purposes. In this study, the final quality of products was investigated
after 90 days of composting, by considering three levels (Komilis, 2015): i) physico-chemical
(WHC, pH, Equivalent CaCO3, OM, NH4+/NO3
- ratio, heavy metals); ii) biological (respiration
rate - CO2 generation) and iii) plant growth related (seed germination).
All composts were alkaline (pH near 9), stable with moderately low respiration rate
corresponding to a stable compost (Brinton et al., 1995) and its use as soil improvers was not
conditioned by the presence of heavy metals. Nitrification ratio (NH4+/ NO3
-) was less than 0.5
as expected for mature composts (Bernal et al., 2009) (data not shown). Table 7.4 features the
quality properties that were the most distinct amongst mixtures. In particular, as ES
incorporation increases WHC is reduced, neutralisation capacity enhanced and organic matter
restricted. Despite M2+60%ES presented a lower seed germination capacity, all end-products
were phytotoxin-free, once germination indices were higher than 50%.
Table 7.4: Main properties of the final composts, after 90 days of composting (mean±standard deviation, n=3)
Property M2+ 0% ES
M2+ 10% ES
M2+ 20% ES
M2+ 30%ES
M2+ 60%ES
WHC (g water 100 g dm-1) 483±39 349±32 292±0.1 234±13 129±3
Equivalent CaCO3 (g CaCO3 100g-1 dm)
8.6±1.1 34.7±0.3 47.8±1.4 60.0±1.9 79.0±2.3
OM (g VS 100 g-1 dm) 82.8±0.7 58.7±1.5 45.9±0.4 38.6±1.1 15.5±0.2
Corg/N 46.7 31.6 26.8 21.1 9.4
GI (%) 96±4 104±4 96±7 104±9 74±4
PART C. COMPOSTING TRIALS WITH INDUSTRIAL EGGSHELL WASTE
173
7.3.3. Multivariate exploratory data analysis
In this section, a general Multivariate Exploratory Data Analysis (MEDA) of all the
parameters measured along the longitudinal studies, for different levels of incorporation eggshell
waste (%ES) is performed. From this analysis, the main patterns of variation are extracted and
commented for the first 25 days of composting. In particular, the dynamic of the observations are
analysed with resort to the PCA scores and the main associations are identified with the loadings
from this technique.
The collected data were arranged in a single data matrix Xn×m (with n=5 observations and
m=13 variables) and pre-processed in order to centre all variables to zero mean and scaled them
to unit variation. This transformation is called autoscaling, and is fundamental to avoid
distortions in the analysis due to the use of variables with different units (alternatively, one can
also base the PCA computations in the correlation matrix of X, instead of its covariance, which
would lead to the same final PCA model). The %ES was just used as an indicator variable for
stratifying the subsequent analysis, which was not incorporated in the PCA model.
Performing a PCA analysis over the experimental data obtained with all the ES mixtures,
results in the following outputs. In Figure 7.11 the eigenvalues profile is presented, where one
can see that 3 components are enough to explain approximately 78% of the variability of the
entire data set, half of it being explained by just the first principal component that explains
35.5% of the total variation in all the experiments.
Number Eigenvalue Percent
1 4.613 35.49
2 3.121 24.01
3 2.399 18.46
4 0.922 7.09
5 0.843 6.48
6 0.386 2.97
7 0.289 2.22
8 0.213 1.64
9 0.097 0.75
10 0.066 0.51
11 0.029 0.22
12 0.015 0.12
13 0.007 0.06
Figure 7.11: Eigenvalues profile for the PCA analysis of all ES mixtures during composting (0-25 days).
The central importance of the first component justifies that some attention be devoted to its
individual analysis, as it conveys a large portion of the total variability found in the data set.
Figure 7.12 a) depicts the time-series plots of the scores of this component, after separating the
CHAPTER 7. ANALYSIS OF EGGSHELL CO-COMPOSTING USING PRINCIPAL COMPONENT ANALYSIS
174
observations according to the %ES. This plot clearly indicates two important aspects: i) the
critical importance of the %ES in the variability of the scores (it basically sets the average level
for the different profiles); ii) the existence of similar dynamic patterns in the different profiles,
especially for %ES ≤ 30%.
Figure 7.12: a) Time-series plots of the scores for the first principal component (PC1), stratified by %ES; b) Scatter plot for the first two scores (PC1 vs PC2), stratified by %ES (color of the bubbles) and time (size of the bubbles).
0 10 20 30 60
%ES
Composting time (days)
0 10 20-4
-2
0
2
4
6
0 10 20 0 10 20 0 10 20 0 10 20
b)
a)
PART C. COMPOSTING TRIALS WITH INDUSTRIAL EGGSHELL WASTE
175
In fact, by analysing the first and the second principal components (Figure 7.12 b)), one
can verify that PC1 is essentially capturing the variability originated by %ES (colour
stratification in Figure 7.12 b)) whereas PC2 is explaining the time dynamics in each
longitudinal experiment (size stratification in Figure 7.12 b)). As PC1 and PC2 are also the
components explaining most of the variability of the experimental data (≈60%), one can also
conclude that these are the two main structural factors contributing to the observed variability of
the experimental results, with %ES having the primary role.
From these results, it would be suitable to find out which variables would be mostly
involved in the definition of these dynamic patterns found for PC1 and PC2. This can be
analysed through the loadings of the component (Figure 7.13 a) and b)). For PC1, one can find
out that at least four variables are highly associated with each other: BD, Corg:N, FAS and H
(Figure 7.13 a)).
Analysing the signals of the loadings, it is possible to infer that the former variable (BD)
presents a negative association with the last three and that these (Corg:N, FAS and H) are all
positively correlated with each other. This is indeed consistent with the mechanistic knowledge
of the composting process, since higher BD values are associated to a decrease of air voids
within the mixture, thus lowering the FAS. In addition, the relation between moisture content,
water and porosity depends upon the ingredients used and their relative proportion within the
blend (Ahn et al., 2008). Thus the positive relation between FAS and H found with PC1 may be
a consequence of that. For PC2, VS/VS0 was the most relevant variable (Figure 7.13b)) with the
higher loading value. In addition, four variables are highly interrelated, namely T, N-NO3-, pH
and GI (Figure 7.13 b)). This relation might be associated with the nitrification phenomena
typically occurring in composting process. When the thermophilic phase transits to mesophilic
temperatures, conditions are met to promote NH4+ conversion to NO3- with a consequent
increase in GI values, as previously reported.
CHAPTER 7. ANALYSIS OF EGGSHELL CO-COMPOSTING USING PRINCIPAL COMPONENT ANALYSIS
176
Figure 7.13: Loadings for the a) first principal component (PC1), b) second principal component (PC2).
7.4. Conclusions
The effect of incorporating high levels of industrial eggshell waste (until 60%ES) in an
organic composting mixture (potato peel and rice husk) was evaluated, by using multivariate
data analysis techniques and informative visualisation tools.
At the higher level of ES, the bulk density and lower water holding capacity of the
starting mixture were drawbacks to the development of an aerobic biological activity. Still,
pHH(%
)
Norg
(g N
/ kg
)
NH4+ (m
g N /k
g)
NO3 (m
g N/ k
g )
nitrif
icatio
n ind
ex
Corg/
N
GI (%
)
BD (kg
/m3)
FAS (%)
VS/VS0(
%)
T (º C
)OUR
PC
1
-1,2
-0,9
-0,6
-0,3
0,0
0,3
0,6
0,9
1,2
a)
b)
pHH(%
)
Norg (
gN kg
-1 )
NH4+ (m
g N kg
-1)
NO3 (m
g N kg
-1)
nitrif
icatio
n ind
ex
Corg/N
GI (%
)
BD (kg m
-3)
FAS (%)
VS/VS0(
%)
T (º ¯
OUR
PC
2
-1,2
-0,9
-0,6
-0,3
0,0
0,3
0,6
0,9
X Data
pHH(%
)
Norg
(g N
/ kg
)
NH4+ (m
g N /k
g)
NO3 (m
g N/ k
g )
nitrif
icatio
n ind
ex
Corg/
N
GI (%
)
BD (kg
/m3)
FAS (%)
VS/VS0(
%)
T (º C
)OUR
PART C. COMPOSTING TRIALS WITH INDUSTRIAL EGGSHELL WASTE
177
pathogen-killing temperatures were attained, possibly due to the lower free air space of the
matrix that retained convective heat losses.
Data visualisation allowed the recognition that ES co-composting was dependent on ES
content and time. PCA showed that two principal components are enough to explain
approximately 60% of the variability of the data set. PC1 captured the variability originated by
%ES, while PC2 is related with the time dependency of the process. Physical properties like free
air space, bulk density and moisture were indicated by the PCA as the process variables that
capture the variability due to ES content. Also, Corg/N may play a role on PC1. The loadings for
PC2 revealed that VS/VS0 is an important variable, as well as temperature, N-NO3- and pH.
In conclusion, valorisation of eggshell by co-composting is prone to be mostly influenced
by the physical properties of the mixtures, which has important implications on the design and
operation of the process.
7.5. References
Adani, F., Confalonieri, R., Tambone, F., 2004. Dynamic respiration index as a descriptor of the biological stability of organic wastes. J. Environ. Qual. 33, 1866–76.
Baláž, M., 2014. Eggshell membrane biomaterial as a platform for applications in materials science. Acta Biomater. 10, 3827–3843.
Barrena, R., Artola, A., Vázquez, F., Sánchez, A., 2009. The use of composting for the treatment of animal by-products: Experiments at lab scale. J. Hazard. Mater. 161, 380–6.
Barrena, R., Gea, T., Ruggieri, L., 2011. Categorizing Raw Organic Material Biodegradability Via Respiration Activity Measurement: A Review. Compost Sci. Util. 19, 105–113.
Benito, M., Masaguer, A., Moliner, A., Hontoria, C., Almorox, J., 2009. Dynamics of pruning waste and spent horse litter co-composting as determined by chemical parameters. Bioresour. Technol. 100, 497–500.
Bernal, M.P., Alburquerque, J.A., Moral, R., 2009. Composting of animal manures and chemical criteria for compost maturity assessment . A review. Bioresour. Technol. 100, 5444–5453.
Bijlsma, P.B., de Wit, D.H., Duindam, J.W., Elsinga, G.J., Elsinga, W., 2013. Spot test analysis of microbial contents during composting of kitchen- and garden biowaste: sampling procedures, bacterial reductions, time-temperature relationships, and their relevance for EU-regulations concerning animal by-products. J. Environ. Manage. 115, 198–205.
Brito, L., Mourão, I., Coutinho, J., Smith, S., 2012. Simple technologies for on-farm composting of cattle slurry solid fraction. Waste Manag. 32, 1332–1340.
Castaldi, P., Alberti, G., Merella, R., Melis, P., 2005. Study of the organic matter evolution during municipal solid waste composting aimed at identifying suitable parameters for the evaluation of compost maturity. Waste Manag. 25, 209–13.
CHAPTER 7. ANALYSIS OF EGGSHELL CO-COMPOSTING USING PRINCIPAL COMPONENT ANALYSIS
178
Cayuela, M.L., Mondini, C., Insam, H., Sinicco, T., Franke-Whittle, I., 2009. Plant and animal wastes composting: effects of the N source on process performance. Bioresour. Technol. 100, 3097–106.
Cayuela, M.L., Sánchez-Monedero, M.A., Roig, A., Sinicco, T., Mondini, C., 2012. Biochemical changes and GHG emissions during composting of lignocellulosic residues with different N-rich by-products. Chemosphere 88, 196–203.
Chroni, C., Kyriacou, A., Lasaridi, K., 2012. Abiotic parameters and microbial counts as stability indicators during composting of organic waste, in: Orbit - Global Assessment for Organic Resources and Waste Management. Rénnes, pp. 55–61.
Cordeiro, C.M.M., Hincke, M.T., 2011. Recent patents on eggshell: shell and membrane applications. Recent Pat. Food. Nutr. Agric. 3, 1–8.
De Guardia, A., Mallard, P., Teglia, C., 2010a. Comparison of five organic wastes regarding their behaviour during composting: Part 1, biodegradability, stabilization kinetics and temperature rise. Waste Manag. 30, 402–414.
De Guardia, A., Mallard, P., Teglia, C., Marin, A., Le Pape, C., Launay, M., Benoist, J.C., Petiot, C., 2010b. Comparison of five organic wastes regarding their behaviour during composting: part 2, nitrogen dynamic. Waste Manag. 30, 415–25.
De Guardia, A., Petiot, C., Rogeau, D., Druilhe, C., 2008. Influence of aeration rate on nitrogen dynamics during composting. Waste Manag. 28, 575–87.
Farrell, M., Jones, D., 2009. Critical evaluation of municipal solid waste composting and potential compost markets. Bioresour. Technol. 100, 4301–4310.
Gajalakshmi, S., Abbasi, S. a., 2008. Solid Waste Management by Composting: State of the Art. Crit. Rev. Environ. Sci. Technol. 38, 311–400.
Gea, T., Barrena, R., Artola, A., Sa, A., 2004. Monitoring the Biological Activity of the Composting Process : Oxygen Uptake Rate ( OUR ), Respirometric Index ( RI ), and Respiratory Quotient ( RQ ). Agriculture.
Gestel, K. Van, Mergaert, J., Swings, J., Coosemans, J., Ryckeboer, J., 2003. Bioremediation of diesel oil-contaminated soil by composting with biowaste. Environ. Pollut. 125, 361–368.
Girovich, M.J., 1996. Biosolids Treatment and Management: Processes for Beneficial Use, Environmental Science & Pollution. Taylor & Francis.
Grigatti, M., Cavani, L., Ciavatta, C., 2011. The evaluation of stability during the composting of different starting materials: comparison of chemical and biological parameters. Chemosphere 83, 41–8.
Guru, P.S., Dash, S., 2014. Sorption on eggshell waste--a review on ultrastructure, biomineralization and other applications. Adv. Colloid Interface Sci. 209, 49–67.
Harada, Y., Inoko, A., 1980. The measurement of the cation- exchange capacity of composts for the estimation of the degree of maturity. Soil Sci. Plant Nutr. 26, 127–134.
Hubbe, M., Nazhad, M., Sánchez, C., 2010. Composting as a way to convert cellulosic biomass and organic waste into high-value soil amendments: a review. BioResources 5, 2808–2854.
Huet, J., Druilhe, C., Trémier, A., Benoist, J.C., Debenest, G., 2012. The impact of compaction, moisture content, particle size and type of bulking agent on initial physical properties of sludge-bulking agent mixtures before composting. Bioresour. Technol. 114, 428–36.
Ibrahim, A., Zhou, Y., Li, X., Chen, L., Hong, Y., Su, Y., Wang, H., Li, J., 2015. Synthesis of rod-like hydroxyapatite with high surface area and pore volume from eggshells for effective adsorption of aqueous Pb (II). Mater. Res. … 62, 132–141.
PART C. COMPOSTING TRIALS WITH INDUSTRIAL EGGSHELL WASTE
179
Kang, J., Zhang, Z., Wang, J.J., 2011. Influence of humic substances on bioavailability of Cu and Zn during sewage sludge composting. Bioresour. Technol. 102, 8022–6.
Kopčić, N., Domanovac, M. V, Kučić, D., Briški, F., 2014. Evaluation of laboratory-scale in-vessel co-composting of tobacco and apple waste. Waste Manag. 34, 323–328.
Kulikowska, D., Klimiuk, E., 2011. Organic matter transformations and kinetics during sewage sludge composting in a two-stage system. Bioresour. Technol. 102, 10951–10958.
Kumar, K.N., Goel, S., 2009. Characterization of Municipal Solid Waste (MSW) and a proposed management plan for Kharagpur, West Bengal, India. Resour. Conserv. Recycl. 53, 166–174.
Liang, C., Das, K.C., Mcclendon, R.W., 2003. The influence of temperature and moisture contents regimes on the aerobic microbial activity of a biosolids composting blend. Bioresour. Technol. 86, 131–137.
Lu, S.G., Imai, T., Li, H.F., Ukita, M., Sekine, M., Higuchi, T., 2001. Effect of Enforced Aeration on In-Vessel Food Waste Composting. Environ. Technol. 22, 1177–1182.
Manios, T., 2004. The composting potential of different organic solid wastes: experience from the island of Crete. Environ. Int. 29, 1079–89.
Mason, I., Milke, M., 2005. Physical modelling of the composting environment: a review. Part 1: reactor systems. Waste Manag. 25, 481–500.
McGinnis, M., Queen, J., Buchanan, M., Stokes, C., Cleveland, B., 2011. Waste and Compost Analysis Guide.
Ouatmane, A., Provenzano, M., Hafidi, M., 2000. Compost maturity assessment using calorimetry, spectroscopy and chemical analysis. Compost Sci. Util. 8, 124–134.
Pandey, A.K., Gaind, S., Ali, A., Nain, L., 2009. Effect of bioaugmentation and nitrogen supplementation on composting of paddy straw. Biodegradation 20, 293–306.
Paradelo, R., Moldes, A.B., González, D., Barral, M.T., 2012. Plant tests for determining the suitability of grape marc composts as components of plant growth media. Waste Manag. Res. 30, 1059–65.
Paredes, C., Cegarra, J., Bernal, M.P., Roig, a, 2005. Influence of olive mill wastewater in composting and impact of the compost on a Swiss chard crop and soil properties. Environ. Int. 31, 305–12.
Pepe, O., Ventorino, V., Blaiotta, G., 2013. Dynamic of functional microbial groups during mesophilic composting of agro-industrial wastes and free-living (N2)-fixing bacteria application. Waste Manag.
Puyuelo, B., Gea, T., Sánchez, A., 2010. A new control strategy for the composting process based on the oxygen uptake rate. Chem. Eng. J. 165, 161–169.
Rynk, R., Kamp, M. van de, Willson, G.B., Singley, M.E., Richard, T.L., Kolega, J.J., Gouin, F.R., Lucien Laliberty, J., Kay, D., Murphy, D.W., Hoitink, H.A.J., Brinton, W.F., 1992. On-farm composting handbook. Northeast Regional Agricultural Engineering Service, Ithaca.
Sanchez-Monedero, M., Roig, A., Paredes, C., Bernal, M., 2001. Nitrogen transformation during organic waste composting by the Rutgers system and its effects on pH, EC and maturity of the composting mixtures. Bioresour. Technol. 78, 301–308.
Sánchez-Monedero, M., Serramiá, Civanto, C., Fernández-Hernández, A., Roig, A., 2010. Greenhouse gas emissions during composting of two-phase olive mill wastes with different agroindustrial by-products. Chemosphere 81, 18–25.
CHAPTER 7. ANALYSIS OF EGGSHELL CO-COMPOSTING USING PRINCIPAL COMPONENT ANALYSIS
180
Sellami, F., Jarboui, R., Hachicha, S., Medhioub, K., Ammar, E., 2008. Co-composting of oil exhausted olive-cake, poultry manure and industrial residues of agro-food activity for soil amendment. Bioresour. Technol. 99, 1177–88.
Sharma, V.K., Canditelli, M., Fortuna, F., Cornacchia, G., 1997. Processing of urban and agro-industrial residues by aerobic composting: Review. Energy Convers. Manag. 38, 453–478.
Smidt, E., Meissl, K., 2007. The applicability of Fourier transform infrared ( FT-IR ) spectroscopy in waste management. Waste Manag. 27, 268–276.
Soares, M.A.R., Quina, M.J., Quinta-Ferreira, R., 2013a. Co-composting of eggshell waste in self-heating reactors: Monitoring and end product quality. Bioresour. Technol. 148, 293–301.
Soares, M.A.R., Quina, M.J., Quinta-Ferreira, R., 2013b. Prediction of free air space in initial composting mixtures by a statistical design approach. J. Environ. Manage. 128, 75–82.
Tremier, A., De Guardia, A., Massiani, C., Paul, E., Martel, J.L., 2005. A respirometric method for characterising the organic composition and biodegradation kinetics and the temperature influence on the biodegradation kinetics, for a mixture of sludge and bulking agent to be co-composted. Bioresour. Technol. 96, 169–80.
Tsai, W.-T., Hsien, K.-J., Hsu, H.-C., Lin, C.-M., Lin, K.-Y., Chiu, C.-H., 2008. Utilization of ground eggshell waste as an adsorbent for the removal of dyes from aqueous solution. Bioresour. Technol. 99, 1623–9.
Tuomela, M., Vikman, M., Hatakka, A., Itavaara, M., 2000. Biodegradation of lignin in a compost environment : a review. Bioresour. Technol. 72, 169–183.
Wei, Y., Liu, Y., 2005. Effects of sewage sludge compost application on crops and cropland in a 3-year field study. Chemosphere 59, 1257–65.
Woods End Research Laboratory, 2005. Dewar self-heating test: instructions for use.
Zeng, Y., De Guardia, A., Daumoin, M., Benoist, J., 2012a. Characterizing the transformation and transfer of nitrogen during the aerobic treatment of organic wastes and digestates. Waste Manag. 32, 2239–2247.
Zeng, Y., De Guardia, A., Ziebal, C., De Macedo, F., Dabert, P., 2012b. Nitrification and microbiological evolution during aerobic treatment of municipal solid wastes. Bioresour. Technol. 110, 144–52.
Zuconni, F., de Bertoldi, M., 1987. Compost specifications for the production and characterization of compost from municipal solid wastes, in: de Bertoldi, M., Ferranti, M.P., Hermite, P.L., Zucconi, F. (Eds.), Compost: Production, Quality and Use. Elsevier Applied Science, London, pp. 30–50.
181
Part D. Environmental applications for
eggshell compost
The application of an eggshell rich-compost was envisaged for environmental
applications, namely removal of lead and zinc from aqueous and solid matrices. In Chapter 8,
compost derived from eggshell waste co-composting was evaluated as a biosorbent for Pb(II)
uptake from aqueous medium and for comparison purposes, mature compost without eggshell
and natural eggshell were tested as well.
This Parts ends up with the evaluation of using the eggshell-rich compost as a soil
amendment for immobilisation of Pb and Zn in an acidic contaminated mining soil, by
evaluating the environmental availability of metals, toxicity reduction and variation of CO2
efflux from soil, due to the incorporation of a carbonate rich amendment.
CHAPTER 8. BIOSORBENT POTENTIAL OF AN EGGSHELL RICH COMPOSTING PRODUCT FOR LEAD REMOVAL
182
This Page Intentionally Left Blank
PART D. ENVIRONMENTAL APPLICATIONS FOR EGGSHELL COMPOST
183
8. Biosorbent potential of an eggshell rich composting product
for lead removal from aqueous solutions*
Compost derived from eggshell co-composting (CES) was evaluated as a biosorbent for
Pb(II) uptake from aqueous medium. For comparison purposes, mature compost without eggshell
(CWES) and natural eggshell (ES) were also tested. Batch experiments indicated that maximum
sorption capacity of CES is 23 mg.g−1.
Sorption kinetics and equilibria data were fitted to pseudo-second order and Langmuir
model, respectively. From a kinetic point of view, lead sorption into CES was fast, attaining
equilibrium within less than 180 min. The sorption capacity CES was not significantly altered
when initial pH of aqueous medium ranged from 2-5.5. In comparison to ES, organic matter of
CES provided supplementary sites for lead sorption and an increase of 43% in the sorption
capacity was observed. Nevertheless, CWES was the biosorbent with higher sorption capacity.
Still, the study points out the potential of new use of CES as an effective biosorbent to
lead removal from aqueous matrices.
Keywords: eggshell compost, biosorbent, lead sorption
*The information presented in this chapter was based upon:
Soares, M.A.R., Quina, M.J., Gando-Ferreira, L., Quinta-Ferreira, R.. Biosorbent potential of an eggshell
rich composting product for lead removal from aqueous solutions. Submitted to Ecological Engineering, in March
2015.
Soares, M.A.R., Quina, M.J., Gando-Ferreira, L., Quinta-Ferreira, R., 2014. Removal of Pb (II) from
aqueous solutions using eggshell composting products, presented at Athens’2014- 2nd International Conference on
where qmodel, qexp and ��LM[[[[[[ (mg g-1) represent the model prediction, experimental value and mean
of all experimental values, respectively; n is the number of observations during experiments and
p the number of parameters of the model. The smaller value of RMSE and the higher values and
R2adj
indicate the best model fitting.
8.3. Results and discussion
8.3.1. Biosorbent properties
Table 8.1 addresses the main properties of the sorbents tested. The biosorbents obtained
through composting are characterized by alkaline pH, phytotoxin-free (germination indices close
to 80%) and stable (moderately slow respiration rates between 2-8 mg CO2 g-1 C d-1, (Gómez et
al., 2006). Industrial ES is also an alkaline material, with high content of CaCO3 and low
percentage of organic matter (close to 6% (w/w)). The total heavy metals concentration in
CWES, CES and ES is low in comparison to the levels present in other biosorbents obtained by
composting of source separated municipal solid waste mixed with green waste (50 mg kg-1, 62
mg kg-1 and 200 mg kg-1 for Cu, Pb and Zn, respectively) (Paradelo and Barral, 2012).
Regarding the specific surface area (SBET), there is a significant difference between the
tested biosorbents. CWES has the highest SBET (0.74 m2 g-1) and total pore volume (4.67 µL g-1),
while ES is the material with lower surface area (0.12 m2 g-1) and less pore volume (0.98 µL g-1).
Both SBET and total pore volume recorded for CWES are similar to other reported values for
garden organic composts (SBET=0.66 to 1.31 m2 g-1 and pore volume of 2.6 to 8 µL g-1) (Al-
PART D. ENVIRONMENTAL APPLICATIONS FOR EGGSHELL COMPOST
191
Mashaqbeh and McLaughlan, 2014, 2012) and composted cotton burr (SBET=0.86 m2 g-1) (Su
and Puls, 2007).
Table 8.1: Main properties of the biosorbents tested (mean±standard deviation). Biosorbent Parameters CWES CES ES SBET (m2 g-1) 0.74 0.42 0.12 Total pore volume (µL g-1) 4.67 3.00 0.98 pH 9.3 8.9 8.3 Equivalent CaCO3 (g CaCO3 100 g -1) 5.0±0.1 61.4±1.7 89.4±0.2 Organic matter (%) 79.4±0.5 28.5± 0.3 6.3± 0.1 TOC/TN 21 11.9 2.1 Respiration rate (mg C-CO2 g-1C d-1) 5.31±1.1 3.55±0.2 - Pb aqua regia (mg kg-1) 12.7±0.01 7.3±0.02 3.55±0.02 Cu aqua regia (mg kg-1) 8.2±0.2 5.2±0.2 - Zn aqua regia (mg kg-1) 47±0.3 11.9±0.1 4.95±0.1
CES: compost with industrial eggshell; CWES: compost without industrial eggshell; ES: industrial eggshell waste; SBET: surface area; TN: total nitrogen; TOC: total organic carbon; concentration units are presented in a dry weight basis.
On the other hand, the values of the ES physical properties found in this study are clearly
lower that the ones reported in the literature (SBET=0.49 to 21.2 m2 g-1 and pore volume of 4 to
86 µL g-1) (Tsai et al., 2008). Nevertheless, those literature values are referred to eggshell
stripped from its membrane and washed, which was not the preparation method followed for ES
in our study. Concerning CES physical properties, clearly this composting end-product presented
intermediate values for SBET and pore volume in comparison to CWES and ES.
The major functional groups of the biosorbents were identified using FTIR spectroscopy.
FTIR spectrum of the tested biosorbents are represented in Figure S8.2 - Supplementary
material. FTIR spectrum of CES is characterized by peaks at 2515, 1800, 1420 and 875 cm-1,
which are ascribed to carbonates (Smidt and Meissl, 2007) conveyed to CES by eggshell. A
broad and intense absorption peak around 3400 cm−1 is indicative of the existence of bounded
hydroxyl groups. The peak near 1080 cm-1 can be attributed to Si-O-Si stretching vibrations in
silica (Grube et al., 2006) which is typically present in rice husk (Yalçin and Sevinç, 2001) that
were used for obtaining CES. Nevertheless, peaks in the range of 1030-1080 cm-1, may also be
attributed to C–O stretching of polysaccharides or polysaccharide-like substances (Smidt and
Meissl, 2007). In addition, low intensity peaks at 1740 cm-1and 2930-2850 cm-1 are characteristic
of C=O vibrations (aldehydes, carboxylic acids or esters) and aliphatic compounds, respectively
(Smidt and Meissl, 2007).
Since CES was derived from composting processes, FTIR spectrum should present a
band at 1650 cm-1 and a weak band at 1595 cm-1 as result of humic like substances. However in
this case, the strong and broad peak at 1420 cm-1 (due to carbonates) alters the spectrum
resolution in that region. As a result, it is only visible a shoulder between 1650-1600 cm-1, which
CHAPTER 8. BIOSORBENT POTENTIAL OF AN EGGSHELL RICH COMPOSTING PRODUCT FOR LEAD REMOVAL
192
may still be related to C=C stretching vibrations of aromatic structures in humic substances
and/or amide groups. FTIR spectrum of ES shows the typical peak attributed to carbonates, as
found is CES and a slight shoulder near 1650-1600 cm-1 that might be associated to C=O
stretching in amides groups that constitute the organic membrane typically present in eggshell.
Regarding CWES, the identification of functional groups is more complex. Significant peaks are
found at 3400 cm-1 (associated to -OH groups), 2920 cm-1 (associated to aliphatic methylene
groups), 1650 cm-1 (C=C stretching that can be ascribed to aromatic C–C bond), 1515 cm-1 (C=C
stretching of aromatic rings in lignin), 1080 cm-1 (silica or polysaccharide-like substances). In
addition, the shoulder at 1595 cm-1 reveals the presence of humic like substances due to C=C
bond in the aromatic skeleton of that substances (Smidt and Meissl, 2007). Peaks at 1220 and
1420 cm-1 indicate phenolic groups, while the band at 1380 cm-1 is due to COO- antisymmetric
stretching.
8.3.2. pHpzc and acid neutralisation capacity
The point of zero charge corresponds to the pH of the aqueous solution at which the
particle surface charge is neutral (Lambert et al., 2009). This means that if the aqueous pH is
higher than pHpzc, the surface charge is negative and the biosorbent has enhanced affinity for
cations. By contrast, for aqueous solutions at pH less than pHpzc, the solid has higher affinity
towards anions. Figure 8.1 shows the point of zero charge (pHpzc) of the studied biosorbents, at
L/S 100 L kg-1.
Figure 8.1: Determination of pHpzc at L/S 100 L kg-1 for tested biosorbents (ES, CES and CWES).
pH initial
0 2 4 6 8 10 12
pH fi
nal
4
6
8
10 pHpzc=9,7
pHpzc=8,2
pHpzc=7,0
ES CESCWES
PART D. ENVIRONMENTAL APPLICATIONS FOR EGGSHELL COMPOST
193
The point of zero charge of CES is observed to pH 8.2 (Figure 8.1), and it is strongly
influenced by the presence of eggshell in this material, which explains the elevated value in
comparison to CWES (pHpzc=7). Above pH=8.2, CES exhibits a net negative surface charge that
enhances electrostatic attractions between Pb2+ and CES surface. ES is also characterized by a
high pHpzc (equal to 9.7) which is within the values reported in the literature for commercial
CaCO3 and calcite (8.9 and 10.1, respectively) (Kosmulski, 2011, 2009).
The quantification of ANC for the biosorbents is shown in Figure 8.2. This property
corresponds to the ability of a material to neutralise acids, due to any species that can accept and
neutralise protons (Quina et al., 2009) and reflects the overall buffering capacity of the material
against acidification.
Figure 8.2: Determination of ANC for tested biosorbents (ES, CES and CWES).
ANC curves for CES and ES are very similar, presenting a steep initial decline to pH near
6 followed by a plateau at pH=5-5.5. This plateau may be associated to the buffering effect
induced by the calcium carbonate in the biosorbents (Chen et al., 2009). For CWES, the ANC
profile shows a sharper negative slope from pH≈8 until pH≈2, which is related to the weak
ability of the biosorbent to resist to pH changes. In quantitative terms, the ANC was measured in
miliequivalents of acid required to reduce pH until a reference value (4 and/or 7). For the
biosorbents under analysis, ANCpH7 is very similar for CWES and CES (0.16 meq g-1) and
slightly higher for ES (0.52 meq g-1). In the case of ANCpH4, ES still shows the more pronounced
value (19.7 meq g-1) followed by CES and CWES with 18.2 and 0.64 meq g-1, respectively. To
the best of our knowledge, there are no studies addressing the ANC for biosorbents. Therefore,
ANC (meq g-1)
0 10 20 30 40
pH
0
2
4
6
8
10
ES CESCWES
CHAPTER 8. BIOSORBENT POTENTIAL OF AN EGGSHELL RICH COMPOSTING PRODUCT FOR LEAD REMOVAL
194
for the sake of comparison, air pollution control residues from municipal solid waste incineration
were taken into consideration. These residues are considered to have a considerable ANC
(ANCpH4 ≈11 meq g-1 (Quina et al., 2009)), which strengthen the idea that CES and ES present a
high ANC.
8.3.3. Kinetic studies
Figure 8.3 depicts the kinetic behavior of Pb uptake by the biosorbents tested, when the
initial concentration was 500 mg L-1. The kinetic experimental data followed a biphasic
evolution (Zhang, 2011), including a fast initial stage followed by a slower equilibrium period.
For CES, 80% of the maximum lead uptake capacity was attained in the first 30 min. In
opposition, ES accounted only for 61%, while CWES achieved 94%. The equilibrium state was
considered to be reached when changes in q are less than 5% during more than 5 h. Thus, in the
present study, for all tested biosorbents 180 min were enough to reach equilibrium conditions.
Therefore, further studies for the establishment of sorption lead uptake behavior were conducted
for 180 min of equilibrium time.
Figure 8.3: Kinetic behavior of Pb(II) uptake by CES, ES and CWES (L/S 100 L kg-1, [Pb(II)]initial = 500 mg L-1, 25ºC, pH=5.0).
In previous works, other authors assumed similar equilibration period for Pb uptake by
eggshell (Vijayaraghavan and Joshi, 2013), but longer contact time was considered by Zhang
(2011) for sorption studies using manure compost (4 h) and by Paradelo and Barral (2012) in the
case of municipal solid waste compost (16 h).
Time (min)
0 200 400 600
q P
b(II)
(m
g g-1
)
0
10
20
30
40
50
ESCESCWESpseudo first order modelpseudo second order modelIntraparticle diffusion (Crank) model
PART D. ENVIRONMENTAL APPLICATIONS FOR EGGSHELL COMPOST
195
Three different kinetic models (pseudo-first, pseudo-second and intraparticle diffusion
models) were used to describe the experimental data of Pb uptake by CES, ES and CWES and to
assess the kinetic mechanism. According to a literature review conducted by Liu and Liu (2008)
both pseudo-first and pseudo-second order models have been widely used to describe kinetic
biosorption data by considering sorption mechanism controlled by surface reactions. On the
other hand, the intraparticle diffusion model accounts for diffusion controlled mechanisms
during sorption (Cheung et al., 2007). The fitting of the models to experimental data is shown in
Figure 8.3 and Table 8.2.
Table 8.2: Kinetic model parameters for Pb(II) sorption onto CES, ES and CWES.
Biosorbent Model type Model parameters Error functions
CES Pseudo-first order Eq (8.3) qe=22.46 mg g-1 k1=0.082 min-1
RMSE= 1.118 Radj
2=0.978
Pseudo-second order Eq (8.5) qe=23.43 mg g-1 k2= 0.678 x 10⁻² g mg-1 min-1
RMSE= 0.418 Radj
2=0.997
Intraparticle diffusion E q(8.6) B=0.043 min-1 RMSE= 0.980 Radj
2=0.985
ES Pseudo-first order Eq (8.3) qe=14.66 mg g-1 k1=0.034 Radj
2=0.923min-1 RMSE= 0.932 Radj
2=0.923 Pseudo-second order Eq (8.5) qe=15.97 mg g-1
ES 5 25 100 100-1500 16.5 This study Nc- Not controlled; Nind- Not indicated
The EDX spectrum taken in spot profile for CES, confirmed as expected the presence of
Ca before sorption due to calcium carbonate., A strong peak of Pb and a minor peak intensity of
Ca (in comparison to the one before sorption) were observed after sorption. That might be a
result of i) occupation of Ca-sites by Pb ions at the surface of CES, which has been indicated for
calcite (Sturchio et al., 1997), ii) the acidic conditions (pH 5) imposed during sorption
experiment may lead to Ca leaching from the surface and incorporation of lead in carbonate-
based microprecipitates, as suggested by Vijayaraghavan and Joshi (2013). In addition, Pb(II)
may interact with negatively charged functional groups like carboxylic acids, hydroxyl existing
on CES, which might be reflected by the small reduction of oxygen content in CES surface. The
complexation of Pb with carbonyl groups has been reported in the literature (Ahmad et al., 2012;
Guru and Dash, 2014) for CaCO3 like materials and could occurred in CES. Indeed, due to the
complexity of CES in terms of organic and inorganic constituents, the above sorption
mechanisms may act simultaneously. EDX spectra for ES before and after sorption display a
behavior similar to CES. The same sorption mechanisms considered for CES may be associated
CHAPTER 8. BIOSORBENT POTENTIAL OF AN EGGSHELL RICH COMPOSTING PRODUCT FOR LEAD REMOVAL
200
to ES, by considering that ES contains an organic membrane with oxygenate groups with affinity
towards Pb ions.
Regarding CWES, EDX spectrum showed a high diversity of elements at the surface, but
oxygen appears in a high percentage (60%). After sorption, the percentage of oxygen was halved
and an increase of Pb in CWES surface was detected. This might indicate interactions between
lead and oxygen-based functional groups, like reported in other studies with composting derived
materials (Carrasquero-Durán and Flores, 2009). Furthermore, there is a significant reduction of
potassium in CWES surface, which may be indicative of an ion-exchange mechanism as reported
by Zhang (2011) for manure compost.
8.3.4.1. pH influence
The pH is an important parameter in sorption processes, not only due to the ability to alter
the surface properties (surface charge, degree of ionization and speciation of the surface
functional groups), but also because it dictates the speciation and availability of metals in
solution (Ozer, 2007). In this study, the effect of pH on the sorption of Pb (II) by CES, ES and
CWES was evaluated by varying the initial pH of a 500 mg Pb(II) L-1 solution from 2 to 5.5, and
keeping constant the other operating conditions. Figure 8.5 and Figure 8.6 illustrates the effect of
the initial pH on the equilibrium pH attained for the aqueous solution, and on the Pb (II)
removal.
Figure 8.5: Effect of initial pH on equilibrium pH (initial concentration 500 mg Pb(II) L-1, L/S 100 L kg-1, contact
time 180 min, 25ºC).
Initial pH
2 3 4 5 6
Equ
ilibr
ium
pH
2
3
4
5
6
7
ESCESCWES
PART D. ENVIRONMENTAL APPLICATIONS FOR EGGSHELL COMPOST
201
Figure 8.6: Effect of initial pH on lead removal (initial concentration 500 mg Pb(II) L-1, L/S 100 L kg-1, contact time 180 min, 25ºC).
The equilibrium pH attained at the end of 180 min is dependent on the type of biosorbent
tested (Figure 8.5). For CES and ES, regardless the initial pH, the equilibrium pH was relatively
constant (4.5-5.5), which may be attributed to the high ANC of the biosorbents (Figure 8.2)). In
the case of CWES, the equilibrium pH is near 5.5 if initial pH is 4 to 5.5, while more acidic
conditions (between 2.5 and 4.3) are reached to the initial pH 2 and 3. These results are in
agreement with the low ANC observed to CWES.
The percentage of Pb (II) removed by the biosorbents (Figure 8.6) reveals a similar
behavior to the equilibrium pH. In fact, CES and ES showed a removal yield of lead almost
independent from pH, though the average removal attained were 49% for CES and 35% for ES.
These results are related to physical properties of the biosorbents, namely smaller SBET for ES
and higher content of organic matter for CES (Table 8.1). Indeed, CES shows an intrinsic ability
to naturally enforce a proper pH to the aqueous solution without favoring precipitation of lead
hydroxides. Nevertheless, the precipitation mechanism could benefit the overall removal of lead,
if the sorptive process was conduct at pH>6, and it could be very interesting in a real application
point of view. In addition, higher pH would favor the presence of negative sites in the surface,
decreasing repulsions between the biosorbent and Pb(II).
Considering CWES removal efficiency towards Pb(II) (Figure 8.6), the smaller value
attained (25%) to pH 2 is a consequence of: i) the low ANC of CWES to overcome acidic
conditions (ANCpH4=0.64 meq g-1) and ii) the positive sites that dominate on the surface of the
biosorbent which enhances electrostatic repulsion between the surface and Pb(II) (pH< pHpzc;
pHpzc=7). In addition, the competition effect between H3O+ and Pb(II) promoted by the low
equilibrium pH (pH 2.5) also has an effect on the relative low removal yield. However, as the
equilibrium pH increases, that competition effect for biosorbent active sites is hindered and
Initial pH
2 3 4 5 6
Pb
(II)
rem
oval
(%
)
20
40
60
80
100
ESCESCWES
CHAPTER 8. BIOSORBENT POTENTIAL OF AN EGGSHELL RICH COMPOSTING PRODUCT FOR LEAD REMOVAL
202
Pb(II) removal is increased (Wang et al., 2010). As a result, for CWES the metal removal yield
reached 97% for equilibrium pH 5.5.This behavior may suggest that an ion-exchange mechanism
may be part of the overall sorption mechanism of Pb(II) by CWES (Wang et al., 2010).
Furthermore, higher pH values favor deprotonation of some chemical functional groups (like
hydroxyl, phenolic, carboxylic acids) increasing the negative charges of biosorbent
(Anastopoulos et al., 2013). Thus, the electrostatic attractions between Pb (II) and CWES may
also play a role, when the initial pH led to equilibrium pH near 5.5.
8.3.4.2. Concentration influence
Figure 8.7 illustrates the influence of the initial concentration from 100 to 2500 mg Pb(II)
L-1 on lead(II) removal for each biosorbent.
.
Figure 8.7: Influence of initial concentration of Pb(II) on a) metal removal and b) uptake from aqueous solution (L/S 100 L kg-1, 25ºC, pH 5.0, contact time 180 min).
Co (mg Pb(II) L-1)
0 500 1000 1500 2000 2500 3000
Pb(
II) r
emov
al (
%)
0
20
40
60
80
100
CES ES CWES
Co (mg Pb(II) L-1)
0 500 1000 1500 2000 2500 3000
q (m
g P
b(II)
L-1
)
0
20
40
60
80
CES ES CWES
a)
b)
PART D. ENVIRONMENTAL APPLICATIONS FOR EGGSHELL COMPOST
203
The removal and uptake behavior of Pb(II) for the biosorbents that contain eggshell (CES
and ES) is very similar (Figure 8.7 a) and b)). For the lowest initial concentration of 100 mg L-1
there is a removal capacity of near 100%, which is sharply inhibited as the initial concentration is
enlarged up to 1500 mg L-1. Beyond 500 mg L-1, the sorption capacity of CES and ES attains a
plateau (Figure 8.7 b)), which indicates that biosorbent active sites are all occupied.
Nevertheless, the CES capacity is in average 1.4 times higher than for ES when metal
concentration is greater than 500 mg L-1, which might be a result of the organic matter conveyed
by CES.
To the best of our knowledge, the literature is lacking of lead sorption studies in aqueous
media by using a biosorbent derived from composting with an equivalent level of CaCO3, as in
the case of CES. Nonetheless, some studies have addressed the ES sorption properties towards
lead. Namely, Vijayaraghavan and Joshi (2013) studied the sorption of lead by chicken eggshell
waste and achieved a removal efficiency of 30.7% (at 25ºC, pH 5 and L/S 500 Lkg-1, C0=1045
mg L-1) which is almost twice the removal recorded in this study (16%), for the same
concentration conditions. In addition, Shaheen et al. (2013) observed a removal efficiency of
99% (at ambient temperature, pH not controlled, L/S 20 L kg-1 and C0=700 mg L-1) while in this
study only 22% of Pb(II) was removed from aqueous solution with ES. This difference can be
attributed to the lack of pH control during the sorption tests performed by Shaheen et al. (2013),
occurring an increase of the pH to alkaline levels due to partial ES dissolution. Accordingly,
suitable conditions for the precipitation of Pb(II) hydroxides may lead to a removal
enhancement, which masks the quantitative sorptive ability of the biosorbent. At lower lead
concentration (100 mg Pb(II) L-1) (Ahmad et al., 2012) found a removal of 89.7% (at 25ºC, pH
5.5 and L/S 40 Lkg-1) which is slightly lower than the removal efficiency measured in this study
for the same lead concentration (98%).
With respect to CWES biosorbent the removal observed was close to 100% for a broader
range of initial concentrations (300 to 500 mg L-1) (Figure 8.7 a)). Then, a smoother decrease of
lead removal is verified when concentration is increased. However, at the highest concentration
tested (2500 mg Pb(II) L-1) is still possible to attain a removal efficiency near 30%. The
saturation of the active site of CWES occurs when Pb(II) concentration is 2000 mg L-1, which is
significantly higher than CES.
To compare the sorptive properties of the biosorbents towards lead ions, the distribution
coefficient Kd (L kg-1) was calculated. This parameter relates the metal concentration in the solid
phase to its concentration in solution, at equilibrium conditions (Ahmad et al., 2012; Shaheen et
al., 2013). Low values of Kd indicate that high amount of metal remains in solution, while high
CHAPTER 8. BIOSORBENT POTENTIAL OF AN EGGSHELL RICH COMPOSTING PRODUCT FOR LEAD REMOVAL
204
Kd means that the solid phase has high affinity to the metal. Table 8.5 summarises the Kd for
CES, ES and CWES according to the initial lead concentration.
Table 8.5: Distribution coefficient (L kg-1) for CES, ES and CWES biosorbents to different initial Pb
concentrations.
Initial Pb (II) concentration (mg L-1)
CES ES CWES
100 2796 5065 -
200 - 218 -
298 330 102 4360
483 83.5 53.6 3904
727 46.8 29.4 503
977 30.7 20.5 201
1435 20.6 12.8 108
1952 - - 67.1
2422 - - 46.5
At the lowest metal concentration, ES is the biosorbent that has the higher distribution
coefficient. These results indicate that ES might have a higher capacity to sorb Pb(II) than CES,
at concentration levels lower than 100 mg L-1. Though, when Pb(II) concentration is higher than
100 mg L-1, CES enhances the retention affinity towards lead in comparison to ES, while CWES
shows the highest affinity to retain lead.
8.4. Conclusions
The potential use of a compost derived from industrial eggshell co-composting (CES) as
a biosorbent for Pb(II) was evaluated. The sorption capacity was dependent on the initial metal
concentration, but almost independent on initial pH within 2-5.5. The sorption isotherms
followed the Langmuir model suggesting a monolayer sorption feature. EDX spectra reveal the
importance of Ca2+ in the sorption mechanism, but a better understanding of other functional
groups involvement is still need. This study illustrated that CES in comparison to ES is a better
alternative for lead removal in aqueous solutions, though optimisation of some operational
conditions (higher pH or L/S) should be addressed in further studies.
8.5. References
Ahmad, M., Usman, A.R. a., Lee, S.S., Kim, S.-C., Joo, J.-H., Yang, J.E., Ok, Y.S., 2012. Eggshell and coral wastes as low cost sorbents for the removal of Pb2+, Cd2+ and Cu2+ from aqueous solutions. J. Ind. Eng. Chem. 18, 198–204.
PART D. ENVIRONMENTAL APPLICATIONS FOR EGGSHELL COMPOST
205
Al-Mashaqbeh, O., McLaughlan, R., 2012. Non-equilibrium zinc uptake onto compost particles from synthetic stormwater. Bioresour. Technol. 123, 242–248.
Al-Mashaqbeh, O., McLaughlan, R., 2014. Effect of compost aging on zinc adsorption characteristics. J. Environ. Chem. Eng. 2, 392–397.
Anastopoulos, I., Massas, I., Ehaliotis, C., 2013. Composting improves biosorption of Pb2+ and Ni2+ by renewable lignocellulosic materials. Characteristics and mechanisms involved. Chem. Eng. J. 231, 245–254.
Anbia, M., Kargosha, K., Khoshbooei, S., 2015. Heavy metal ions removal from aqueous media by modified magnetic mesoporous silica MCM-48. Chem. Eng. Res. Des. 93, 779–788.
Bhatnagar, A., Sillanpää, M., 2010. Utilization of agro-industrial and municipal waste materials as potential adsorbents for water treatment—A review. Chem. Eng. J. 157, 277–296.
Carrasquero-Durán, A., Flores, I., 2009. Evaluation of lead(II) immobilization by a vermicompost using adsorption isotherms and IR spectroscopy. Bioresour. Technol. 100, 1691–4.
Chen, Q., Zhang, L., Ke, Y., Hills, C., Kang, Y., 2009. Influence of carbonation on the acid neutraliuzation capacity of cements and cement-solidified/stabilized electroplating sludge. Chemosphere 74, 758–764.
De Paula, H.A., Becker, J.G., Davis, A.P., 2008. Characterization of the Uptake of Divalent Metal Ions by a Hatchery Residual. Environ. Eng. Sci. 25, 737–746.
Fiol, N., Villaescusa, I., 2009. Determination of sorbent point zero charge: usefulness in sorption studies. Environ. Chem. Lett. 7, 79–84.
Foo, K., Hameed, B., 2010. Insights into the modeling of adsorption isotherm systems. Chem. Eng. J. 156, 2–10.
Fu, F., Wang, Q., 2011. Removal of heavy metal ions from wastewaters: a review. J. Environ. Manage. 92, 407–18.
Ghaedi, M., Hajati, S., Karimi, F., 2013. Equilibrium, kinetic and isotherm of some metal ion biosorption. J. Ind. Eng. Chem. 19, 987–992.
Gómez, R.B., Lima, F. V, Ferrer, A.S., 2006. The use of respiration indices in the composting process: a review. Waste Manag. Res. 24, 37–47.
Grube, M., Lin, J., Lee, P., Kokorevicha, S., 2006. Evaluation of sewage sludge-based compost by FT-IR spectroscopy. Geoderma 130, 324–333.
Guru, P.S., Dash, S., 2014. Sorption on eggshell waste--a review on ultrastructure, biomineralization and other applications. Adv. Colloid Interface Sci. 209, 49–67.
Hinz, C., 2001. Description of sorption data with isotherm equations. Geoderma 99, 225–243.
Ho, Y., 2006. Isotherms for the sorption of lead onto peat: comparison of linear and non-linear methods. Polish J. Environ. Stud. 15, 81–86.
Ho, Y., McKay, G., 2000. The kinetics of sorption of divalent metal ions onto sphagnum moss peat. Water Res. 34, 735–742.
Ho, Y.S., Ng, J.C.Y., McKay, G., 2000. Kinetics of Pollutant Sorption By Biosorbents: Review. Sep. Purif. Rev. 29, 189–232.
CHAPTER 8. BIOSORBENT POTENTIAL OF AN EGGSHELL RICH COMPOSTING PRODUCT FOR LEAD REMOVAL
206
Kosmulski, M., 2009. pH-dependent surface charging and points of zero charge. IV. Update and new approach. J. Colloid Interface Sci. 337, 439–448.
Kosmulski, M., 2011. The pH-dependent surface charging and points of zero charge: V. Update. J. Colloid Interface Sci. 353, 1–15.
Lambert, S., Job, N., D’Souza, L., Pereira, M., Pirard, R., Heinrichs, B., Figueiredo, J.L., Pirard, J., Regalbuto, J., 2009. Synthesis of very highly dispersed platinum catalysts supported on carbon xerogels by the strong electrostatic adsorption method. J. Catal. 261, 23–33.
Miretzky, P., Muñoz, C., Carrillo-Chávez, A., 2008. Experimental binding of lead to a low cost on biosorbent: Nopal (Opuntia streptacantha). Bioresour. Technol. 99, 1211–1217.
Moyo, M., Guyo, U., Mawenyiyo, G., 2015. Marula seed husk (Sclerocarya birrea) biomass as a low cost biosorbent for removal of Pb (II) and Cu (II) from aqueous solution. J. Ind. Eng. Chem.
Nwachukwu, O.I., Pulford, I.D., 2008. Comparative effectiveness of selected adsorbant materials as potential amendments for the remediation of lead-, copper- and zinc-contaminated soil. Soil Use Manag. 24, 199–207.
Ozer, A., 2007. Removal of Pb(II) ions from aqueous solutions by sulphuric acid-treated wheat bran. J. Hazard. Mater. 141, 753–761.
Paduraru, C., Tofan, L., Teodosiu, C., 2015. Biosorption of zinc (II) on rapeseed waste: equilibrium studies and thermogravimetric investigations. Process Saf. … 94, 18–28.
Paradelo, R., Barral, M.T., 2012. Evaluation of the potential capacity as biosorbents of two MSW composts with different Cu, Pb and Zn concentrations. Bioresour. Technol. 104, 810–3.
Park, H.J., Jeong, S.W., Yang, J.K., Kim, B.G., Lee, S.M., 2007. Removal of heavy metals using waste eggshell. J. Environ. Sci. 19, 1436–1441.
Pavasant, P., Apiratikul, R., Sungkhum, V., Suthiparinyanont, P., Wattanachira, S., Marhaba, T.F., 2006. Biosorption of Cu2+, Cd2+, Pb2+, and Zn2+ using dried marine green macroalga Caulerpa lentillifera. Bioresour. Technol. 97, 2321–2329.
Quina, M., Bordado, J., Quinta-Ferreira, R., 2009. The influence of pH on the leaching behaviour of inorganic components from municipal solid waste APC residues. Waste Manag. 29, 2483–2493.
Rangabhashiyam, S., 2014. Relevance of isotherm models in biosorption of pollutants by agricultural byproducts. J. Environ. Chem. Eng. 2, 398–414.
Rauret, G., López-Sánchez, J.-F., Sahuquillo, a., Barahona, E., Lachica, M., Ure, a. M., Davidson, C.M., Gomez, a., Lück, D., Bacon, J., Yli-Halla, M., Muntau, H., Quevauviller, P., 2000. Application of a modified BCR sequential extraction (three-step) procedure for the determination of extractable trace metal contents in a sewage sludge amended soil reference material (CRM 483), complemented by a three-year stability study of acetic acid . J. Environ. Monit. 2, 228–233.
Shaheen, S.M., Eissa, F., Ghanem, K.M., Gamal El-Din, H.M., Al Anany, F.S., 2013. Heavy metals removal from aqueous solutions and wastewaters by using various byproducts. J. Environ. Manage. 128, 514–521.
Smidt, E., Meissl, K., 2007. The applicability of Fourier transform infrared ( FT-IR ) spectroscopy in waste management. Waste Manag. 27, 268–276.
Soares, M.A.R., Quina, M.J., Quinta-Ferreira, R., 2013. Co-composting of eggshell waste in self-heating reactors: Monitoring and end product quality. Bioresour. Technol. 148, 293–301.
PART D. ENVIRONMENTAL APPLICATIONS FOR EGGSHELL COMPOST
207
Sturchio, N.C., Chiarello, R.P., Cheng, L., Lyman, P.F., Bedzyk, M.J., Qian, Y., You, H., Yee, D., Geissbuhler, P., Sorensen, L.B., Liang, Y., Baer, D.R., 1997. Lead adsorption at the calcite-water interface: Synchrotron X-ray standing wave and X-ray reflectivity studies. Geochim. Cosmochim. Acta 61, 251–263.
Su, C., Puls, R., 2007. Removal of added nitrate in cotton burr compost, mulch compost and peat: mechanisms and potential use of griundwater nitrate remediation. Chemosphere 66, 91–98.
Tsai, W.-T., Yang, J.-M., Hsu, H.-C., Lin, C.-M., Lin, K.-Y., Chiu, C.-H., 2008. Development and characterization of mesoporosity in eggshell ground by planetary ball milling. Microporous Mesoporous Mater. 111, 379–386.
Vijayaraghavan, K., Joshi, U.M., 2013. Chicken Eggshells Remove Pb(II) Ions from Synthetic Wastewater. Environ. Eng. Sci. 30, 67–73.
Wang, L., Zhang, J., Zhao, R., Li, Y., Li, C., Zhang, C., 2010. Adsorption of Pb(II) on activated carbon prepared from Polygonum orientale Linn.: kinetics, isotherms, pH, and ionic strength studies. Bioresour. Technol. 101, 5808–14.
Yalçin, N., Sevinç, V., 2001. Studies on silica obtained from rice husk. Ceram. Int. 27, 219–224.
Zhang, M., 2011. Adsorption study of Pb(II), Cu(II) and Zn(II) from simulated acid mine drainage using dairy manure compost. Chem. Eng. J. 172, 361–368.
8.6. Supplementary material
Figure S8.1: Percentage of Pb(OH)2 for different Pb(II) concentrations, considering an aqueous solution prepared by dissolving lead nitrate salt (simulations from Visual Minteq v3.0).
pH
2 4 6 8 10 12 14
% P
b(O
H) 2
(s)
0
20
40
60
80
100
5 mg L-1
50 mg L-1
500 mg L-1
2500 mg L-1
CHAPTER 8. BIOSORBENT POTENTIAL OF AN EGGSHELL RICH COMPOSTING PRODUCT FOR LEAD REMOVAL
208
Figure S8.2: FTIR spectra of the tested biosorbents: a) CES and ES, b) CWES.
wave number (cm-1)
1000200030004000
Abs
orva
nce 3400
2920
16501515
1595
1220
1080
1420
1380
CWES
wave number (cm-1)
1000200030004000
Abs
orva
nce
2515
1420
875
3400
1080
1800
1740
1650
2930 2850
CES
ES
a)
b)
PART D. ENVIRONMENTAL APPLICATIONS FOR EGGSHELL COMPOST
209
Figure S8.3: EDX spectra and elemental composition of CES surface: a) before, b) after sorption.
Figure S8.4: EDX spectra and elemental composition of ES surface: a) before, b) after sorption.
a)
b)
a)
b)
CHAPTER 8. BIOSORBENT POTENTIAL OF AN EGGSHELL RICH COMPOSTING PRODUCT FOR LEAD REMOVAL
210
Figure S8.5: EDX spectra and elemental composition of CWES surface: a) before, b) after sorption.
a)
b)
PART D. ENVIRONMENTAL APPLICATIONS FOR EGGSHELL COMPOST
211
9. Immobilisation of lead and zinc in contaminated soil using
compost derived from industrial eggshell*
This study aims to evaluate the capacity of a compost obtained by co-composting of
industrial eggshell (CES) to immobilise lead (Pb) and zinc (Zn) in an acidic soil contaminated
by mining activities. Mature compost without eggshell (CWES) and natural eggshell (ES)
were also tested as soil amendments for comparison purposes. Three different application
rates were used for each material, ensuring the same quantity in terms of neutralising
capacity. Incubation experiments were conducted under controlled conditions and CO2
emissions monitored for 94 days. The environmental availability of Pb and Zn in the amended
soil was assessed and bioassays were performed at the end of the incubation period.
When eggshells were present, the CES compost raised the soil pH to values higher
than 6 and reduced the soil mobile fraction for both Pb and Zn, in more than 95%. Soil
toxicity towards Vibrio fischeri was also suppressed and environmental risk decreased to “low
level”. However, the immobilisation in the acid insoluble soil component was significantly
achieved only for Zn. In addition, regarding soil carbon dynamics the CO2-C emissions were
enhanced, mainly in the case of the highest rate of amendment. Both first order-E and parallel
first order models may adequately describe the kinetic data of CO2-C cumulative release.
Without eggshells, the CWES compost revealed limited effect on heavy metals
immobilisation, likely due to its small capacity to correct soil acidity, at lower application
rates. Using solely eggshells, the ES waste had similar outcomes when compared with CES,
but at the higher application rate, CO2 emissions were enhanced with the eggshell compost
due to the contribution of biotic carbon present therein. Therefore, this study points out that
CES is an effective liming material and may be used for in situ remediation of contaminated
soil with Pb and Zn.
Keywords Eggshell compost; Soil remediation; Heavy metal; Environmental availability.
*This chapter is based upon the publications:
Soares, M.A.R., Quina, M.J., Quinta-Ferreira, R., 2015. Immobilisation of lead and zinc in contaminated soil by
using compost derived from industrial eggshell. J. Environ. Manage. 164, 137–145.
Soares, M.A.R.; Quina, M.J.; Quinta-Ferreira, R, 2013. Use of mature organic composts as immobilising agents
of Pb and Zn in a mine soil, presented at Proc. WASTES’2013- 2nd International Conference Wastes: Solutions,
Treatments and Opportunities, 11-13th September, In Proceedings pg.267-268, Braga, Portugal. (oral
communication).
CHAPTER 9. IMMOBILISATION OF LEAD AND ZINC IN CONTAMINATED SOIL
212
9.1. Introduction
Anthropogenic activities are considered to be the foremost responsible for soil
enrichment in toxic heavy metals, even though these pollutants may also be natural constituents
of the soil. Industrial processes, mining exploration, manufacturing and disposal of some waste
materials are examples of mankind actions that can introduce in the soil non-essential metals
with phytotoxic and zootoxic properties (Park et al., 2011; Wuana and Okieimen, 2011). The risk
that these contaminants pose to the environment and human health is directly related to their
bioavailability in soil.
Several studies have tested different type of materials as amendments for promoting
metals immobilisation in soil (Kumpiene et al., 2008). Both organic and inorganic materials such
as mature composts, biochar and phosphates, as well as calcium sources including lime, mineral
apatite and carbonates have been used (Janoš et al., 2010; Wuana and Okieimen, 2011). In
addition, composts enriched with minerals like zeolites, clays, oxides or carbonates have also
been addressed with the purpose of reducing the bioavailability of heavy metals in contaminated
soils (Gadepalle et al., 2009, 2008; Lagomarsino et al., 2011; Siebielec and Chaney, 2012; Van
Herwijnen et al., 2007). Furthermore, low-cost industrial residues have also been exploited for
heavy metals retention in soil (Garrido et al., 2005). This approach has additional environmental
benefits besides reducing waste disposal costs in landfill sites, is simultaneously able to tackle
soil remediation.
Efficiency of amendments on the rehabilitation of soil contaminated with heavy metals
may be addressed at chemical and ecotoxicological levels (Pardo et al., 2014). In this regard,
chemical extraction methods have been commonly used to assess their environmental availability
providing relevant information about the corresponding mobility (Pauget et al., 2011). On the
other hand, addition of amendments may affect the soil inorganic and organic carbon dynamics.
This influence can be observed through the rates of CO2 production due to organic carbon
mineralisation (biotic CO2) and/or resulting from correction of soil acidification with liming
materials (abiotic CO2 ) (Bertrand et al., 2007). Bioassays have been used to evaluate if toxicity
in the original soil was reduced after soil treatment in order to estimate if there is no longer risk
to humans, plants or animals (Park et al., 2011). Bioassays using luminescent bacteria Vibrio
fischeri allow the assessment of the eco-toxicity impact of soil composition on surface water and
groundwater (i.e. soil retention function) (Alvarenga et al., 2009).
Industrial eggshell (ES) is the main waste stream from egg processing industry and its
European production is about 350 thousand tonnes per year (Soares et al., 2013).
PART D. ENVIRONMENTAL APPLICATIONS FOR EGGSHELL COMPOST
213
Lee et al. (2013) evaluated the effect of eggshell waste, combined with a nitrogen,
phosphorous and potassium fertilizer, on Cd and Pb immobilisation in a neutral agricultural soil
nearby abandoned mines. Their study concluded that 80 days after incorporating 5% (w/w)
eggshell into soil, Cd and Pb concentrations extracted with acetic acid were reduced up to 68 and
93%, respectively. In addition, Ahmad et al. (2012) found that by adding 5% (w/w) of eggshell
to a neutral military shooting range soil, the Pb concentration extracted with acetic acid was
reduced by 68%, mainly due to pH increase with further lead immobilisation via formation of
Pb-hydroxide or lanarkite. On the other hand, Ok et al. (2011) reported a reduction of only
24.6% for Pb extracted with acetic acid, by also using 5% (w/w) of eggshell, in a moderately
acid soil. Nevertheless, according to the European legal framework, ES is classified as an animal
by-product not intended for human consumption (Regulation (EC) Nº 1069/2009 of the
European Parliament and the Council). Thus, the application of ES to soil may require a prior
thermal treatment to reduce the spreading risk of pathogens into the environment and human
health.
Co-composting is one of the ES treatment options that besides promoting eggshell waste
sanitation, can also deliver a tailored compost rich in calcium carbonate. This product can
enhance soil remediation due to the presence of: i) stabilized/humified organic matter that may
promote soil metal immobilisation mainly through adsorption reactions (Park et al., 2011) and ii)
CaCO3 that may precipitate heavy metals from soil solution. But to the best of the authors’
knowledge, the effect of eggshell rich organic compost on heavy metal immobilisation in soil has
not been addressed.
Accordingly, this study aims to evaluate the feasibility of using a compost (CES)
obtained from composting industrial eggshell with other organic wastes, as a soil amendment for
immobilisation of Pb and Zn in acidic contaminated mining soil. For comparison, a mature
compost without eggshell (CWES) and natural eggshell (ES) were also tested. The effects of
such amendments on soil properties were investigated at three levels: i) environmental
availability and speciation of Pb and Zn in soil, by using chemical extraction procedures, ii)
toxicity reduction of amended soil by performing bioassays and iii) evaluation of CO2 emission
from soil, after the addition of such a carbonate rich amendment.
9.2. Materials and methods
9.2.1. Soil and amendments
About 5 kg of soil sample was collected at 5-20 cm depth from a Portuguese abandoned
mining complex. The collection site was constituted by a set of mines, where hydrothermal veins
CHAPTER 9. IMMOBILISATION OF LEAD AND ZINC IN CONTAMINATED SOIL
214
rich in Pb and Zn were explored during the 19th and 20th centuries. The soil sample was air dried
and sieved through 2 mm mesh to remove large particles.
The compost soil amendments that were tested were obtained at laboratory scale by using
self-heating reactors of 105 L with forced aeration. CES compost was derived from industrial
potato peel, grass clippings, rice husk and industrial eggshell (ES) wastes in the proportions of
35.4%, 22.7%, 11.9% and 30% (w/w), respectively. CWES compost was prepared in the same
conditions as CES, without eggshell in the initial mixture while keeping the relative proportions
of the other ingredients.
9.2.2. Experimental design
Laboratory scale incubation studies were conducted for 94 days on soil conditioned with
three different treatments (T1 to T3), for each amendment tested. Representative soil samples
(about 50 g) were mixed with each compost (CES and CWES) at three rates: T1=2.5 g, T2=5 g
and T3=15 g (air dried basis). In the case of ES amendment, equivalent rates to CES_T1 to T3 in
terms of neutralising capacity (equivalent CaCO3) were tested. Thus, the application rate to soil
was ES_T1=1.6 g, ES_T2=3.2 g and ES_T3=9.5 g (air dried basis).
For each treatment and control samples, three replicates were performed (i.e. twelve
experiments were followed during the incubation period). The moisture of all mixtures was
adjusted to 65% of their water holding capacity (WHC) and maintained during each experiment
by adding distilled water. Incubation tests were carried out in 1 L closed mason jars, in dark
conditions, while keeping the temperature at 25 ºC.
9.2.3. Physico-chemical analysis
9.2.3.1. pH and electrical conductivity pH and electrical conductivity (EC) were measured in 1:5 (w/v) solid:water extracts
obtained at the beginning and at the end of the incubation period, which lasted for 94 days.
9.2.3.2. Single chemical extractions
The mobile fraction associated with very active and available metal forms was extracted
with 0.01 M CaCl2, unbuffered (Gupta et al., 1996; Pueyo et al., 2004). The mobilisable fraction
that includes potentially available, leachable and partly active compounds was extracted with a
solution of 0.5 M CH3COOH, 0.5 M NH4CH3COO and 0.02 M EDTA at pH 4.7 (Gupta et al.,
1996; Hammer and Keller, 2002). The extractions were performed for 2 h at room temperature,
PART D. ENVIRONMENTAL APPLICATIONS FOR EGGSHELL COMPOST
215
in an overhead shaker (16 rpm), using a soil:solution ratio of 1:10 (w/v). Blank samples without
soil were used as control. Lead and zinc were determined by flame atomic absorption
spectrometry (Perkin Elmer – 3000) and standard solutions were prepared with the appropriate
extracting reagent, to reduce matrix interferences.
9.2.3.3. Sequential chemical extractions
Heavy metals in soil were determined by a three-step sequential extraction method based
on the BCR (Community Bureau of Reference), which is summarised in Table 9.1 according to
the procedure presented by Rauret et al. (2000).
Table 9.1: Main features of BCR three-step sequential extraction method. Extraction Step Soil fraction evaluated Experimental procedure
1- Acid extractable F1 - exchangeable, water and acid soluble species
extraction with 0.11 mol L-1 acetic acid (v:w ratio of 40:1, 16 h);
2- Reducible
F2 - metals associated with the reducible phases, namely bound to Fe/Mn oxyhydroxides
extraction with 0.5 mol L-1 NH2OH.HCl in 0.05 mol L-1 HNO3 (v:w ratio of 40:1, 16 h)
3- Oxidisable F3 - oxidisable metal fraction, e.g. bound to organic matter or sulphides
digestion with conc. H2O2 at 85ºC followed by extraction with 1 mol L-1 ammonium acetate adjusted to pH 2 by conc. HNO3 (v:w ratio of 50:1, 16 h)
A Heidolph Reax 20 overhead shaker, at 16 rpm and room temperature, was used to
obtain each extract. Between each step, separation of the extract from the solid was undertaken
by centrifugation at 3000 rpm for 20 min followed by decantation of the supernatant liquid.
According to Sulkowski and Hirner (2006), incomplete carbonate dissolution may occur in step
1, which in turn may overestimate metal content associated with the following extraction steps.
These authors showed that if the extract from Step 1 presents pH lower than 4, the carbonate
dissolution of a soil containing 27% of dolomite was nearly complete. Thus, in the present study,
whenever pH was above 4, a second extraction with 0.11 mol L-1 acetic acid was repeated (v:w
ratio of 40:1, 16 h). After each extraction step, the residue was washed with distilled water (v:w
ratio of 20:1), shaked for 15 min, centrifuged for 20 min at 3000 rpm and the supernatant
discarded.
As a checking procedure, residue from Step 3 of two random soil mixtures was digested
in aqua regia, according to the method described by Rauret et al. (2000). The total amount of
metal extracted (sum of Step 1 + Step 2 + Step 3 + residue) was compared to the pseudo-total
amount of metal obtained by aqua regia digestion. A maximum relative error of 8.2% for Pb and
CHAPTER 9. IMMOBILISATION OF LEAD AND ZINC IN CONTAMINATED SOIL
216
5.1% for Zn was observed, which is within the errors found by Rauret et al. (2000). Blank
sample extractions (without soil) were carried out throughout the complete procedure.
A residual fraction (F4) was calculated as the difference between the pseudo-total metal
concentration and the sum of the extracted metals from the three BCR steps, which provides
information about the fraction that is resistant to extracting processes (Hass and Fine, 2010).
9.2.4. Environmental risk of metals in soil The risk assessment code (RAC) usually employed for soils and/or sediments (Guillén et
al., 2012). The RAC index was calculated by the following equation:
���(%) = �
�× 100 (9.1)
where Cm is the metal concentration in the exchangeable and carbonate fractions (equivalent to
the fraction obtained in step 1 (F1) of the BCR procedure) and Ct is the total metal concentration.
The RAC index is stratified into five risk categories (Gusiatin and Kulikowska, 2014): no risk
(<1%), low risk (1-10%), medium risk (11-30%), high risk (31-50%) and very high risk (> 50%).
This index is based on individual metal mobility and it does not account for the metal toxicity.
9.2.5. Bioassays
Germination tests using Lepidium sativum seeds were conducted on extracts obtained from soil
after treatment (CES_T1 to T3, CWES_T1 to T3 and ES_T1 to T3). The germination index (GI)
was calculated following the usual procedure as described in Chapter 6.2.3 (Pardo et al., 2011).
Inhibitory effects of the soil mixture extracts on the light emission of Vibrio fischeri were
measured using a Lumistox 300 equipment. Soil was extracted with aqueous solution of NaCl
(2% v/v) (Mantis et al., 2005). The decrease of luminescence of the bacteria before and after
being incubated (15 ºC, 30 min) with 9 dilutions of soil extract (from 6.25% to 100% v/v) was
assessed in duplicate. The effective concentration (%v/v) with a toxic effect on 50% of the
population of the marine microorganisms (EC50) was calculated.
9.2.6. Monitoring of CO2 and kinetic modelling
During the incubation tests, CO2 production from untreated and treated soil with CES,
CWES and ES was quantified. A trap with 20 mL of 0.5 M NaOH was placed in each mason jar
to capture CO2 flux during incubation tests. Until the 60th day of incubation, the jars were opened
every two days to maintain aerobic conditions by exposing them for 5-10 min to ambient
PART D. ENVIRONMENTAL APPLICATIONS FOR EGGSHELL COMPOST
217
atmosphere. From there on, flasks were opened once a week. Whenever jars were opened: i) the
CO2 trap was removed and the residual NaOH therein was back-titrated with 0.5 M HCl, using
phenolphthalein as indicator (BaCl2 in excess was added for precipitation of carbonates); ii)
moisture of soil samples was maintained at 65% of WHC by gravimetric adjustment with
deionized water; iii) before closing each incubation flask, a trap with fresh NaOH was inserted.
Consumption of NaOH in each monitoring interval was stoichiometrically converted into CO2
(Pardo et al., 2011). CO2 emission was expressed in terms of mg CO2-C 100 g-1 soil air dried d-1.
Kinetic parameters describing CO2 release during incubation were calculated by fitting
the cumulative CO2-C profile to two kinetic models (Bernal et al., 1998; Fernández et al., 2007):
first order-E model (Eq. 9.2) and parallel first order model (Eq. 9.3).
TOC/TN n.a. - 21 11.9 2.1 - Available P (mg kg-1) n.d. - n.a. n.a. n.a. - Available K (mg kg-1) 32.3 - n.a. n.a. n.a. - GI (in aqueous extract with Lepidium sativum) (%)
CES: compost with industrial eggshell; CWES: compost without industrial eggshell; ES: industrial eggshell waste; EC: electrical conductivity; TN: total nitrogen; TOC: total organic carbon; GI: germination index; n.d.: not detected; n.a.: not analysed; -: not applicable. Concentration units are presented in a dry weight basis. a) According to limiting values in agriculture soils for sewage sludge application imposed by Portuguese legislation (Decreto-Lei no276/2009). b) Based on End-of-waste criteria for biodegradable waste subjected to biological treatment (draft final report) (JRC - European Commission, 2013).
The electrical conductivity is low, as expected for mining soils that are exposed to
weathering conditions (Alvarenga et al., 2009). Heavy metal pseudo-total concentration
(associated with the soil content extracted with aqua regia) is of special concern for Pb and Zn,
exceeding by far the legal limits set by Portuguese legislation (Decreto-Lei no276/2009) for
sewage sludge applications in agriculture soils. In particular, the potentially bioavailable fraction
of Pb, assessed by the mobilisable content, represents about 77% of the total content.
Composts CES and CWES were collected after 144 days of composting. Both materials
were phytotoxin-free (germination indices close to 80%) and may be considered stable with
moderately slow respiration rates between 2-8 mg CO2 g-1 C d-1 (Gómez et al., 2006). Whereas
ES showed a lower GI (nearly 54%) but higher respiration rate (25 mg CO2 g-1 C d-1). Heavy
metals content in the tested soil amendments (CWES, CES and ES) was low in comparison to
the limits set by the end-of-waste criteria for biodegradable waste submitted to biological
treatment (draft final report) (JRC - European Commission, 2013).
PART D. ENVIRONMENTAL APPLICATIONS FOR EGGSHELL COMPOST
219
9.3.2. Effect of amendments on soil pH and electrical conductivity
The response of contaminated soil treated with amendments CES, CWES and ES
regarding pH is shown in Figure 9.1. Bars denoted with the same letter are not significantly
different according to Tukey´s test at P<0.05. pH classes included in this figure are according to
US Department of Agriculture Natural Resources Conservation Service (2013).
Figure 9.1: Soil pH at the end of 94 days of incubation after treatment with CWES, CES and ES.
All amendments ameliorated soil acidity (P<0.05), but the liming effect (pH>6) was more
relevant with CES and ES application. Although CES and ES application rates to soil were
identical in terms of neutralising capacity (equivalent CaCO3), only ES presented a dose-
response effect on the soil pH. In all cases, increasing the incorporation rate of the amendments
induced a salt level upsurge (P<0.05) (Figure S9.1 - supplementary data) and EC was positively
correlated with pH (Pearsons’s correlation coefficient of 0.912, 0.956, and 0.842 for CES,
CWES and ES, respectively, P<0.05).
9.3.3. Influence of soil treatment on lead and zinc environmental
availability
9.3.3.1. Mobile and mobilisable fraction
The influence of the tested amendments in the mobile and mobilisable fractions of Pb and
Zn in the soil after 94 days of incubation is shown in Figure 9.2.
Treatment
Soil
CWES T1
CWES T2
CWES T3
CES T1
CES T2
CES T3ES T1
ES T2ES T3
pH
2
3
4
5
6
7
8
9
fee
d
c
c
d
bba
Moderately alkaline
Neutral
Moderately acid
Very acid
Extremally acid
CHAPTER 9. IMMOBILISATION OF LEAD AND ZINC IN CONTAMINATED SOIL
220
Figure 9.2: Influence of amendments on heavy metal availability (Pb and Zn) in soil, after 94 days of incubation (mean±standard deviation): a) mobile fraction; b) mobilisable fraction. For each series, bars marked with the same letter are not statistically different according to Tukey´s test at P<0.05.
The mobile fraction achieved on each test is represented in Figure 9.2 a) and was
expressed as the percentage of the metal that was present in the corresponding mobile fraction
measured at the start of incubation (Table 9.2), since that fraction was less than 2% of the
pseudo-total metal content.
Treatment
Soil
CWES T1
CWES T2
CWES T3
CES T1
CES T2
CES T3ES T1
ES T2ES T3
Mob
ile fr
actio
n (%
of i
nitia
l mob
ile c
onte
nt)
0
20
40
60
80
100
120
PbZn
a
b
c
d dd d d d d
a
b
c
d dd d d d d
Treatment
Soil
CWES T1
CWES T2
CWES T3CES T1
CES T2CES T3
ES T1ES T2
ES T3
Mob
ilisa
ble
frac
tion
(% o
f pse
udo-
tota
l con
tent
)
0
10
20
60
80
100PbZn
aab
d dd d d d d
bcbc
c cde c
ede e
a aa
a
bb b
b b b
a)
b)
PART D. ENVIRONMENTAL APPLICATIONS FOR EGGSHELL COMPOST
221
Figure 9.2 a) shows that as the rate of the CES application to soil increases a significant
reduction (P<0.05) on the mobile fractions of Pb and Zn was observed. This behaviour may be
due to the pH increase caused by CES treatment in the soil, as previously mentioned. Soil pH is
negatively correlated with the mobile fraction for both Pb (r=-0.749, P<0.05) and Zn (r=-0.740,
P<0.05). In general, pH is considered the main variable controlling solubility and sorption
mechanisms of heavy metals in soils (Alloway, 1995; Alvarenga et al., 2009; Fleming et al.,
2013). Thus, pH is likely to have a major influence on mobility reduction of metals depicted in
Figure 9.2 a).
Regarding the mobilisable fraction, the CES treatment fostered a reduction (P<0.05), but
the effect was more pronounced for Zn (Figure 9.2 b)). However, results may be overestimated
by the extracting solution used to quantify the mobilisable fraction (0.5 M CH3COOH, 0.5 M
NH4CH3COO and 0.02 M EDTA at pH 4.7). Indeed, the EDTA extractant may stimulate the
release of metals to solution not only from carbonates or Fe and Mn oxides, but also through the
formation of stable chelates (Hammer and Keller, 2002; Santos et al., 2010). Nevertheless, CES
was able to immobilise near 50% of Zn (Figure 9.2 b)). Thus, it can be concluded that the mobile
form of Zn can be transformed into less available/soluble compounds by treating the soil with
CES. The ES treatment leads to similar effects on the mobile and mobilisable soil fractions when
compared with the ones observed for the CES experiments. Since ES and CES application rates
were identical in terms of liming capacity, it appears that the organic matter provided by CES
had no visible effect on restricting neither mobile nor mobilisable contents of these elements.
Hence, the correction of soil acidity above the upper limit of ”moderately acid” (Figure 9.1)
seems enough to foster the reduction of the mobile fraction.
With respect to CWES, the reduction of the soil mobile fraction showed a dose-response
behaviour (Figure 9.2 a)). In the case of CWES_T1 and T2, this can be entirely attributed to the
amount of organic matter added, since the pH remained close to 5 after the addition of this
amendment (Figure 9.1) and the mobility reduction is double for CWES_T2 in comparison to
CWES_T1. The significant mobility reduction observed for CWES_T3, could also be a result of
the neutral pH that was achieved, which affects the distribution of Pb and Zn between water-
soluble, exchangeable and non-exchangeable forms. Nevertheless, the mobile fraction of Pb in
soil revealed a very high negative correlation with pH (r=-0.867, P<0.05). Regarding the Zn
mobilisable fraction, the addition of CWES to soil had a negligible effect (P<0.05) (Figure 9.2
b)) while CWES_T2 and CWES_T3 led to a statistically relevant Pb reduction. These results
show that CWES has low capability to reduce the potentially bioavailable, leachable and partly
active metal fraction. This low ability to alter the Pb and Zn mobilisable fraction was also
CHAPTER 9. IMMOBILISATION OF LEAD AND ZINC IN CONTAMINATED SOIL
222
verified by Alvarenga et al. (2009) when treating highly-acidic contaminated soil with garden
waste compost in a greenhouse experiment of two months.
9.3.3.2. Distribution in soil phases and risk assessment
Contaminated sites may pose a significant risk to human health and to other
environmental receptors. In this study, the environmental risk associated to the mobility of Pb
and Zn in untreated soil was of “medium level” as calculated by Eq. (9.1), (Table S9.1 –
supplementary data). Figure 9.3 shows Pb and Zn fractions in soil before and after amendment
addition and incubation for 94 days, determined by a sequential extraction test that allows
evaluation of four different fractions: F1, acid soluble; F2, reducible; F3, oxidisable; F4,
residual. Initially, Pb was mostly associated with the reducible phase (58% in F2) that accounts
for soil Fe/Mn oxyhydroxides (Figure 9.3 a)), while Zn was predominantly connected to the
residual fraction (64% in F4; Figure 9.3 b)). Although some changes were observed, none of the
treatments was able to reverse this situation.
In the case of Pb CES_T3 treatment reduced F1 by 23%, and thus the environmental risk
category was lowered to the “low risk” class. However, CWES was more effective (P<0.05) at
reducing this metal in F1 (Table S9.1 – supplementary data). The reduction of Pb associated with
F1 was generally associated to an increase in the residual fraction (F4), thus leading to the
immobilisation of that pollutant. This probably means that favourable conditions (such as soil pH
and redox potential) were created to enhance Pb occlusion into minerals like well-crystallised
oxides inaccessible to chemical extraction (Hass and Fine, 2010). Siebielec and Chaney (2012)
also showed that a neutral soil amended with a CaCO3-rich compost increased lead adsorption in
Fe oxides.
The CES treatment caused not only a slightly different distribution among the soil
fractions, but also a mitigation of the environmental risk of Zn pushing it to the “low level”
classification (Table S9.1 – supplementary data). Increasing the application rate of CES, the
decrease in the acid soluble (F1) and oxidisable (F3) fractions were also increased, while an
increase in the reducible (F2) and residual (F4) fractions was observed. When compared to
untreated soil, CES_T3 reduced by nearly 50% F1 and F3 fractions, while F2 was doubled and
the F4 fraction increased by 10%. The pH that was achieved (7.4) with CES_T3 has probably
driven the formation of Al, Fe and/or Mn oxides, which precipitate at neutral pH conditions (Fan
et al., 2011). In addition, since the surface charge of Mn oxides is negative at pH 7.4, they
provided extra sites for sorption of Zn cations (Alloway, 1995). F4 fraction could also account
for some Zn co-precipitated as Fe and Mn oxides (Alloway, 1995), which may become attached
PART D. ENVIRONMENTAL APPLICATIONS FOR EGGSHELL COMPOST
223
to crystallised secondary minerals (Hass and Fine, 2010; Ma et al., 2006). Comparison of ES and
CES treatments showed that: i) ES was effective at reducing the environmental risk (Table S9.1
– supplementary data); ii) at the lower application rate (T1), Zn bound to the oxidisable fraction
is favoured with CES (P<0.05), probably as a result of the organic matter conveyed by the
amendment; iii) at the higher rate (T3) ES was more effective than CES to allocate Zn in F4
(P<0.05), probably due to the higher soil pH attained with ES, which may favour oxides
formation. Finally, the environmental risk of Zn was not reduced with CWES treatment (Table
S9.1 – supplementary data). The higher amount of organic matter conveyed by CWES provoked
a relocation of Zn to F2 and F3. The same behavior has been found in other studies (Fleming et
al., 2013). However, further investigation should be performed to conclude about the mechanism
involved or the lack of selectivity of the BCR method (Vodyanitskii, 2006).
Figure 9.3: Lead (a) and zinc (b) fractions of untreated and treated soil after 94 days of incubation, according to BCR procedure (mean±standard deviation, n=3) expressed in % of pseudo total content: F1 (exchangeable, water and acid soluble fraction), F2 (reducible fraction), F3 (oxidisable), F4 (residual fraction). For each metal fraction, bars denoted with the same letter are not statistically different according to Tukey´s test at P<0.05.
a)
b)
CHAPTER 9. IMMOBILISATION OF LEAD AND ZINC IN CONTAMINATED SOIL
224
9.3.4. Toxicity evaluation
Table 9.3 shows the results of GI and EC50 measured in the extracts of soil treated with
the three different amendments. For CES treatment, GI based on Lepidium sativum germination
showed that the initial soil toxicity was partially overcome (GI>50%). This effect suggests the
presence of toxic soluble elements in very low concentrations (Pardo et al., 2011). In addition,
the high toxicity of untreated soil towards Vibrio fischeri was effectively suppressed with CES,
regardless of the application rate. These results confirm the reduction of the environmental risk
prompted by CES (Table S9.1 – supplementary data) in terms of Pb and Zn mobility. The ES
treatment yielded similar results to CES with respect to soil toxicity. Concerning the CWES
treatment, the Vibrio fischeri inhibition was gradually reduced from CWES_T1 to CWES_T3,
but only the higher application rate (T3) was non-toxic to 50% of the bacteria population. This
smaller capacity of CWES to inhibit soil ecotoxicity may be associated with its low ability to
reduce the mobile fractions of the metals, as pointed out in Figure 9.2a) and discussed previously
in section 9.3.3.1.
Table 9.3: Results from bioassays in extracts from untreated and treated soil (mean±standard deviation). Treatments Control
nt: means that EC50 value is out of the equipment’s range, and thus undiluted soil extract cannot induce inhibition of 50% of the Vibrio fischeri population.
9.3.5. CO2 efflux and kinetic modelling
Over the entire incubation period of 94 days, the respiration rate of the untreated and
treated soil was quantified as CO2-C production. The total CO2-C released is shown in Figure 9.4
a). All amendments tested enhanced the CO2 emission from soil, but in the case of eggshell
derived materials (CES and ES) the increase was more pronounced compared to the initial soil
sample (about 2 to 3 fold for T2 and T3 application rates).
In fact, for acidic soils exposed to liming treatment with carbonate based materials, the
CO2 emissions may increase due to (i) dissolution of carbonates and/or (ii) improvement of
biological processes with the consequent release of organically derived CO2 (Ahmad et al., 2013;
Biasi et al., 2008). Nevertheless, in our study the discrimination between these two contributions
was not assessed. However, there is a high positive correlation between total cumulative CO2-C
PART D. ENVIRONMENTAL APPLICATIONS FOR EGGSHELL COMPOST
225
production (Figure 9.4a)) and pH (Figure 9.1) (r=0.881, P<0.05) which is indicative of the
liming capacity of the amendments.
The rate of CO2-C accumulation from soil treatments fitted the kinetic models described
by Eq. (9.2) and (9.3). The fitting parameters can be found in Table 9.4 for each kinetic model.
Overall, the parallel first order model was found to describe data better (higher R2 adj) than first
order E-model. For CES_T1 and CES_T2 both models seem adequate, since the contribution of
Cf (carbon fraction with fast turnover to CO2-C) in both cases is very low and the kf is high.
Despite acidic soil conditions, the carbon release rate was significant (high kf, low t1/2,f
and high Cfkf) what is in agreement with other similar studies (Turrión et al., 2012). Figure 9.4b)
compares, as an example, the kinetic data of CES_T3 and ES_T3, based on the parallel first
order equation. In the two cases, this kinetic model perfectly represents the experimental data. As
previously mentioned, these two treatments have the same liming potential (equivalent CaCO3)
and thus their abiotic CO2 release capacity is similar. However, important differences were
detected in the kinetic behaviour, as well as in the ultimate CO2-C fraction (C∝). In fact, for
CES_T3 not only the C∝ is higher, but also the rate of CO2-C flux of both fast and slow
fractions is lower. These results can be confirmed through C∝, Cfkf, Csks, t1/2,f and t1/2,s
parameters reported in Table 9.4. Such behaviour can be attributed to the biotic carbon present in
CES, which may extend the CO2-C emission for longer periods, while ES had a faster effect on
soil.
Addition of CWES amendment to soil increased the carbon fraction that can be slowly
decomposed and retracted the initial potential mineralisation of the fast C pool (Cfkf). This
indicates that CWES is characterised by a stable fraction of organic matter that did not encourage
labile carbon mineralisation, as expected from a mature compost. However, the complex organic
compounds present in the amendment were less humified than the stable fraction of soil organic
matter (increase of Csks), which may favour microbial conversion (Turrión et al., 2012).
Organic and liming amendments can enhance CO2 emissions from soil (Paradelo et al.,
2015; Thangarajan et al., 2013) with the consequent effects on greenhouse gas emissions. Thus,
when selecting an appropriate amendment for soil remediation, the CO2-C release should be
taken in consideration for the sake of reducing GHC emissions from soil treatment. In this study,
the application of CWES was beneficial for the labile C fraction of soil and presented lower
CO2-C emissions (Figure 9.4 a)). Nonetheless, this amendment was not effective to reduce the
environmental risk of zinc in soil (Table S9.1 – supplementary data). Also the negative impact of
soil on surface water and groundwater persisted after treatment, as indicated by the EC50 value
CHAPTER 9. IMMOBILISATION OF LEAD AND ZINC IN CONTAMINATED SOIL
226
(Table 9.3). In contrast, CES and ES (with the exception of ES_T3) were able to reduce the risk
of heavy metal mobility in soil, and revealed ability to suppress its toxicity as well.
Figure 9.4: (a) Total CO2 release at the end of incubation (mean±standard deviation, n=3); (b) Cumulative CO2-C release during incubation tests of soil treated with CES_T3 and ES_T3.
Incubation time (days)
0 20 40 60 80 100
Cum
ulat
ive
CO
2 -C
(m
g C
100
g-1
soil)
0
200
400
600
800
1000fast fraction - CESslow fraction - CESexperimental data - CESparallel first order model - CESfast fraction - ESslow fraction - ESexperimental data - ESparallel first order model - ES
Treatment
Soil
CWES T1
CWES T2
CES T1
CES T2
CES T3ES T1
ES T2ES T3
Tot
al C
O2
-C r
elea
se (m
g C
-CO
2 10
0 g-1
soi
l)
0
200
400
600
800
1000
a)
b)
PART D. ENVIRONMENTAL APPLICATIONS FOR EGGSHELL COMPOST
227
Tab
le 9
.4:
Kin
etic
par
amet
ers
of th
e st
udie
d m
odel
s, h
alf-
life
tim
e an
d in
itial
pot
entia
l em
issi
on f
or e
ach
CO
2-C
poo
l.
Firs
t ord
er-E
mod
el
Par
alle
l fir
st o
rder
mod
el
C
f C
o k
t 1/2
, 0
Co k
R2
adj
Cf
Cs
k f
k s
t 1/2
, f
t 1/2
, s
Cf k
f C
s ks
C∞
R2
adj
Tre
atm
ent
(mg
CO
2-C
100
g-1 so
il)
(day
s-1)
(day
s)
(mg
CO
2-C 1
00
g-1 so
il d
ays-1
)
(m
g C
O2-
C 1
00 g
-1 so
il)
(day
s-1)
(day
s)
(mg
CO
2-C 1
00 g
-1
soil d
ays-1
)
( mg
CO
2-C
100
g-1 so
il)
Soil
cont
rol
39.2
37
6 0.
010
69.3
3.
8 0.
996
52.1
49
2 0.
318
0.00
6 2.
2 10
9.7
16.6
3.
1 54
4 0.
999
CE
S_T
1 6.
8 52
1 0.
014
49.5
7.
3 0.
999
6.9
521
7.3x
104
0.01
4 9.
5x10
-6
49.5
5.
0x10
5 7.
3 52
8 0.
998
CE
S_T
2 6.
3 71
0 0.
017
41.0
12
.0
0.99
9 16
.3
710
119
0.01
7 5.
8x10
-3
40.8
75
0 12
.1
716
0.99
9
CE
S_T
3 91
.8
807
0.02
6 26
.7
21.0
0.
991
298
941
0.11
7 0.
010
5.9
69.3
34
.9
9.1
1239
0.
999
ES_
T1
59.0
56
6 0.
022
31.5
12
.4
0.99
7 91
.7
575
0.27
5 0.
018
2.5
38.5
25
.2
10.4
66
7 0.
999
ES_
T2
88.3
56
5 0.
027
25.7
15
.3
0.99
4 14
9 55
9 0.
252
0.02
0 2.
8 34
.6
37.5
11
.2
708
0.99
9
ES_
T3
115
641
0.03
0 23
.1
19.2
0.
992
196
621
0.26
2 0.
022
2.6
31.5
51
.4
13.7
81
7 0.
999
CW
ES_
T1
11.3
47
2 0.
012
57.8
5.
6 0.
999
19.4
49
9 0.
194
0.01
0 3.
5 67
.2
3.8
5.0
518
0.99
9
CW
ES_
T2
17.2
67
1 0.
012
57.8
8.
1 0.
998
79.2
93
8 0.
074
0.00
6 9.
0 11
7.5
5.8
5.6
1017
0.
999
Co,
Cf a
nd C
s are
the
CO
2-C
poo
ls w
ith
pote
ntia
l, fa
st a
nd s
low
turn
over
tim
e, r
espe
ctiv
ely;
C∞
is th
e ul
tim
ate
CO
2-C
rel
ease
d; k
, kf a
nd k
s are
the
emis
sion
con
stan
ts
of th
ese
pool
s an
d t 1
/2, t
1/2,
f a
nd t 1
/2, s
repr
esen
t the
hal
f-li
fe ti
mes
for
the
pote
ntia
l, fa
st a
nd s
low
CO
2-C
fra
ctio
ns, r
espe
ctiv
ely.
CHAPTER 9. IMMOBILISATION OF LEAD AND ZINC IN CONTAMINATED SOIL
228
9.4. Conclusions
CES presented a liming capacity able to shift soil pH to values higher than 6. The
environmental availability of Pb and Zn in the contaminated soil was ameliorated, when
considering the metals mobile and mobilisable fractions. However, in acid conditions CES
effectiveness was only clearly proven for Zn immobilisation. Reducible and residual soil
fractions were the major sinks for zinc retention in soil amended with CES at higher
application rates (CES_T3), but in this case the CO2 emissions were about 6-fold higher than
in untreated soil. It is important to strengthen that the environmental risk decreased from
“medium” to “low level” for both heavy metals at any application rate of CES.
In comparison to CWES, CES showed more effective characteristics to promote soil
acidity correction and metals immobilisation. Nevertheless, the ability of ES to promote
remediation of the tested soil was not effectively overcome by CES.
In summary, CES was found to be an effective liming material and revealed intrinsic
properties for in situ remediation of soil contaminated with Pb and Zn. Nevertheless, due to
the stable organic matter present within CES, its use could be more beneficial to metal-
contaminated soils that also require restoration of organic matter levels, thus contributing to a
long term soil quality and fertility.
9.5. References
Ahmad, M., Hashimoto, Y., Hyun, D., Soo, S., Sik, Y., 2012. Immobilization of lead in a Korean military shooting range soil using eggshell waste : An integrated mechanistic approach. J. Hazard. Mater. 209-210, 392–401.
Alvarenga, P., Gonçalves, a P., Fernandes, R.M., de Varennes, a, Vallini, G., Duarte, E., Cunha-Queda, a C., 2009. Organic residues as immobilizing agents in aided phytostabilization: (I) effects on soil chemical characteristics. Chemosphere 74, 1292–300.
Alvarenga, P., Palma, P., Gonçalves, a. P., Fernandes, R.M., de Varennes, a., Vallini, G., Duarte, E., Cunha-Queda, a. C., 2009. Organic residues as immobilizing agents in aided phytostabilization: (II) Effects on soil biochemical and ecotoxicological characteristics. Chemosphere 74, 1301–1308.
Bernal, M.P., Sánchez-Monedero, M.A., Paredes, C., Roig, A., 1998. Carbon mineralization from organic wastes at different composting stages during their incubation with soil. Agric. Ecosyst. Environ. 69, 175–189.
Bertrand, I., Delfosse, O., Mary, B., 2007. Carbon and nitrogen mineralization in acidic, limed and calcareous agricultural soils: Apparent and actual effects. Soil Biol. Biochem. 39, 276–288.
Decreto-Lei no276/2009, n.d. de 2 de Outubro. Diário da República no192-I Série A. Ministério do Ambient. do Ordenam. do Territ. e do Desenvolv. Reg. Lisboa.
Fernández, J.M., Plaza, C., Hernández, D., Polo, A., 2007. Carbon mineralization in an arid soil amended with thermally-dried and composted sewage sludges. Geoderma 137, 497–503.
PART D. ENVIRONMENTAL APPLICATIONS FOR EGGSHELL COMPOST
229
Gadepalle, V.P., Ouki, S.K., Hutchings, T., 2009. Remediation of Copper and Cadmium in Contaminated Soils using Compost with Inorganic Amendments. Water, air soil Pollut. 196, 355–368.
Gadepalle, V.P., Ouki, S.K., Van Herwijnen, R., Hutchings, T., 2008. Effects of amended compost on mobility and uptake of arsenic by rye grass in contaminated soil. Chemosphere 72, 1056–1061.
Garrido, F., Illera, V., García-González, M.T., 2005. Effect of the addition of gypsum- and lime-rich industrial by-products on Cd, Cu and Pb availability and leachability in metal-spiked acid soils. Appl. Geochemistry 20, 397–408.
Gómez, R.B., Lima, F. V, Ferrer, A.S., 2006. The use of respiration indices in the composting process: a review. Waste Manag. Res. 24, 37–47.
Guillén, M.T., Delgado, J., Albanese, S., Nieto, J.M., Lima, A., De Vivo, B., 2012. Heavy metals fractionation and multivariate statistical techniques to evaluate the environmental risk in soils of Huelva Township (SW Iberian Peninsula). J. geochemical Explor. 119-120, 32–43.
Gupta, S.K., Vollmer, M.K., Krebs, R., 1996. The importance of mobile, mobilisable and pseudo total heavy metal fractions in soil for three-level risk assessment and risk management. Sci. Total Environ. 178, 11–20.
Gusiatin, Z.M., Kulikowska, D., 2014. The usability of the IR, RAC and MRI indices of heavy metal distribution to assess the environmental quality of sewage sludge composts. Waste Manag. 34, 1227–1236.
Hammer, D., Keller, C., 2002. Changes in the rhizosphere of metal-accumulating plants evidenced by chemical extractants. J. Environ. Qual. 31, 1561–1569.
Hass, A., Fine, P., 2010. Sequential Selective Extraction Procedures for the Study of Heavy Metals in Soils, Sediments, and Waste Materials—a Critical Review. Crit. Rev. Environ. Sci. Technol. 40, 365–399.
Janoš, P., Vávrová, J., Herzogová, L., Pilařová, V., 2010. Effects of inorganic and organic amendments on the mobility (leachability) of heavy metals in contaminated soil: A sequential extraction study. Geoderma 159, 335–341.
JRC - European Commission, 2013. End-of-waste criteria on Biodegradable waste subject to biological treatment (draft final report).
Kumpiene, J., Lagerkvist, A., Maurice, C., 2008. Stabilization of As, Cr, Cu, Pb and Zn in soil using amendments--a review. Waste Manag. 28, 215–225.
Lagomarsino, A., Mench, M., Marabottini, R., Pignataro, A., Grego, S., Renella, G., Stazi, S.R., 2011. Copper distribution and hydrolase activities in a contaminated soil amended with dolomitic limestone and compost. Ecotoxicol. Environ. Saf. 74, 2013–2019.
Lee, S.S., Lim, J.E., El-Azeem, S. a M.A., Choi, B., Oh, S.-E., Moon, D.H., Ok, Y.S., 2013. Heavy metal immobilization in soil near abandoned mines using eggshell waste and rapeseed residue. Environ. Sci. Pollut. Res. Int. 20, 1719–1726.
Mantis, I., Voutsa, D., Samara, C., 2005. Assessment of the environmental hazard from municipal and industrial wastewater treatment sludge by employing chemical and biological methods. Ecotoxicol. Environ. Saf. 62, 397–407.
Ok, Y.S., Lee, S.S., Jeon, W.-T., Oh, S.-E., Usman, A.R. a, Moon, D.H., 2011. Application of eggshell waste for the immobilization of cadmium and lead in a contaminated soil. Environ. Geochem. Health 33, 31–9.
Pardo, T., Clemente, R., Alvarenga, P., Bernal, M.P., 2014. Efficiency of soil organic and inorganic amendments on the remediation of a contaminated mine soil: II. Biological and ecotoxicological evaluation. Chemosphere 107, 101–108.
CHAPTER 9. IMMOBILISATION OF LEAD AND ZINC IN CONTAMINATED SOIL
230
Pardo, T., Clemente, R., Bernal, M.P., 2011. Effects of compost, pig slurry and lime on trace element solubility and toxicity in two soils differently affected by mining activities. Chemosphere 84, 642–650.
Park, J.H., Lamb, D., Paneerselvam, P., Choppala, G., Bolan, N., Chung, J.-W., 2011. Role of organic amendments on enhanced bioremediation of heavy metal(loid) contaminated soils. J. Hazard. Mater. 185, 549–74.
Pauget, B., Gimbert, F., Coeurdassier, M., Scheifler, R., de Vaufleury, A., 2011. Use of chemical methods to assess Cd and Pb bioavailability to the snail Cantareus aspersus: a first attempt taking into account soil characteristics. J. Hazard. Mater. 192, 1804–1811.
Pueyo, M., López-Sánchez, J.., Rauret, G., 2004. Assessment of CaCl2, NaNO3 and NH4NO3 extraction procedures for the study of Cd, Cu, Pb and Zn extractability in contaminated soils. Anal. Chim. Acta 504, 217–226.
Rauret, G., López-Sánchez, J.-F., Sahuquillo, a., Barahona, E., Lachica, M., Ure, a. M., Davidson, C.M., Gomez, a., Lück, D., Bacon, J., Yli-Halla, M., Muntau, H., Quevauviller, P., 2000. Application of a modified BCR sequential extraction (three-step) procedure for the determination of extractable trace metal contents in a sewage sludge amended soil reference material (CRM 483), complemented by a three-year stability study of acetic acid . J. Environ. Monit. 2, 228–233.
Siebielec, G., Chaney, R.L., 2012. Testing amendments for remediation of military range contaminated soil. J. Environ. Manage. 108, 8–13.
Soares, M.A.R., Quina, M.J., Quinta-Ferreira, R., 2013. Co-composting of eggshell waste in self-heating reactors: Monitoring and end product quality. Bioresour. Technol. 148, 293–301.
Sulkowski, M., Hirner, A. V., 2006. Element fractionation by sequential extraction in a soil with high carbonate content. Appl. Geochemistry 21, 16–28.
U S Department of Agriculture Natural Resources Conservation Service, 2013. NATIONAL SOIL SURVEY HANDBOOK [WWW Document]. Title 430-VI. URL http://soils.usda.gov/technical/handbook/ (acessed 11-03-2014).
Van Herwijnen, R., Hutchings, T.R., Al-Tabbaa, A., Moffat, A.J., Johns, M.L., Ouki, S.K., 2007. Remediation of metal contaminated soil with mineral-amended composts. Environ. Pollut. 150, 347–354.
Wuana, R.A., Okieimen, F.E., 2011. Heavy Metals in Contaminated Soils: A Review of Sources, Chemistry, Risks and Best Available Strategies for Remediation. ISRN Ecol. 2011, 1–20.
9.6. Supplementary material
Table S9.1: Environmental risk of lead and zinc according to risk assessment code (mean±standard deviation). Pb Zn Treatment RAC value Environmental risk RAC value Environmental risk Soil 11.3±0.7 Medium 16.2±1.6 Medium CWES_T1 8.0±0.3 Low 12.9±0.6 Medium CWES_T2 6.5±0.5 Low 11.4±0.2 Medium CWES_T3 3.9±0.1 Low 11.4±0.7 Medium CES_T1 9.8±0.3 Low 7.7±1.1 Low CES_T2 9.1±0.7 Low 7.9±0.3 Low CES_T3 8.6±0.4 Low 6.9±0.3 Low ES_T1 8.1±0.3 Low 5.7±0.2 Low ES_T2 10.4±1.1 Low 6.1±0.6 Low ES_T3 11.1±0.3 Medium 4.2±0.1 Low
PART D. ENVIRONMENTAL APPLICATIONS FOR EGGSHELL COMPOST
231
Figure S9.1: Soil characteristics after 94 days of incubation, with tested amendments: electrical conductivity. Bars denoted with the same letter are not statistically different according to Tukey´s test at P<0.05.
Treatment
Soil
CWES T1
CWES T2
CWES T3CES T1
CES T2CES T3
ES T1ES T2
ES T3
CE
afte
r in
cuba
tion
(dS
m-1
)
0,0
0,2
0,4
0,6
0,8
1,0
1,2
1,4
1,6
1,8
a
b
cc f
d
e
f f
g
h
CHAPTER 9. IMMOBILISATION OF LEAD AND ZINC IN CONTAMINATED SOIL
232
This Page Intentionally Left Blank
PART E. CONCLUSIONS AND FORTHCOMING WORK
233
Part E. Conclusions and forthcoming
work
A general overview of the most relevant conclusions of the work is presented in this part
of the thesis. Moreover, some proposals for future work are suggested.
CHAPTER 10. MAIN CONCLUSIONS AND FUTURE WORK
234
This Page Intentionally Left Blank
PART E. CONCLUSIONS AND FORTHCOMING WORK
235
10. Main conclusions and future work
The production of eggshell waste imposes the need to move towards waste
management solutions that boost the retrieval of ES as a resource. In this scope, this study
addressed the application of co-composting as a technology capable of promoting ES
sanitation and its application as operating supply for environmental remediation.
On the basis of the results of the experiments performed in this study, the following
conclusions can be outlined:
- The presence of grass clippings (an N-rich source) in the composting mixture
containing ES was determinant to attain the pathogen-killing temperature (>70ºC for 1h)
required by regulations in force. However, by increasing incorporation of ES up to 30% (w/w,
wet basis) the capacity of the N-rich composting mixture to accomplish that sanitising criteria
was not affected.
- In the absence of an N-rich source, ES proved to be as an ingredient that can change
the ammonification ability of the mixture, thus increasing the potential for N-losses as ES
incorporation increases until 30%ES.
- At a higher level of ES (60% w/w, wet basis), the upper bulk density and lower water
holding capacity of the starting mixture were the main drawbacks to the development of an
aerobic biological activity, still pathogen-killing temperatures were attained.
- Principal component analysis suggested that physical properties of the mixture are
the most relevant for explaining the variability of the process data due to ES content, namely
bulk density and moisture content.
- In spite of the starting composting mixture, after more than 90 days of composting all
ES composts obtained in the composting tests showed to be stable and without properties that
can cause plant injury.
- Organic matter of the eggshell composting product (CES) provided supplementary
sites for lead sorption in aqueous media in comparison to untreated ES.
- CES was found to be an effective liming material and revealed intrinsic properties
for in situ remediation of soil contaminated with Pb and Zn. Despite ES ability to promote
remediation of the tested soil was not clearly overcome by CES, its stable organic matter can
be beneficial to metal contaminated soils that require organic matter restoration.
CHAPTER 10. MAIN CONCLUSIONS AND FUTURE WORK
236
This study constitutes a first insight into the feasibility of co-composting industrial
eggshell waste (ES) to attain pathogen-killing temperatures in accordance to the legal
requirement. The results obtained were promising and envisage that co-composting process
can be applicable for high levels of ES. Nevertheless, there are still some issues to be further
evaluated, aiming to completely assess the merits of co-composting for managing industrial
eggshell waste.
The use of intermittent aeration strategies should be tested in the case of starting
mixtures with a lower self-heating potential. These experiments would allow a broader
understanding of how the sanitising conditions can be attained, by lowering convective heat
losses in comparison to the biological reaction heat. Furthermore, the analysis of the influence
of high ES content on air permeability would be important for design and operation of the
process.
Industrial eggshell waste has a low C:N ratio and such peculiarity may have a
significant impact in the gaseous emission of N2O, which is a relevant greenhouse gas in the
composting process. Therefore a deeper understanding of the nitrogen dynamics during ES
co-composting should be tested, by using additional automatic gas analysers. In this case, also
the use of intermittent aeration strategies should be addressed as a strategy to promote N
conservation during co-composting of ES.
The microbiological analysis (pathogens presence) of the untreated ES and ES rich
compost also needs to be performed, to completely evaluate the pathogen-killing effectiveness
of the co-composting process. The eradication of plant pathogens should be covered, due to
the origin of the organic materials used in this study.
A better understanding of the sorption capacities of eggshell-rich products for lead
uptake, should be broaden to other operational conditions, namely pH and liquid to solid
ratios. Additionally, other metals and multielement systems can also be addressed.
Moreover, it would be interesting to assess the influence of the liming capacity of
eggshell-rich products on the microbial biomass and nitrification of metal polluted soils.
Finally, given that composting is a biological process, the study of ES co-composting
is not exhausted within the scope addressed and suggested in this thesis. In fact, the
characterisation of the microbiota involved during the all composting phases is essential to
better understand the entire process, as well as the properties of the final product. Thus, it
should not be set aside from the operational design of such process.