1 Draft Version: Please do not cite without author Draft Version: Please do not cite without author Draft Version: Please do not cite without author Draft Version: Please do not cite without author’ ’ ’ ’s permission s permission s permission s permission Assessing Vulnerability to Chronic Undernutrition among Assessing Vulnerability to Chronic Undernutrition among Assessing Vulnerability to Chronic Undernutrition among Assessing Vulnerability to Chronic Undernutrition among Under Under Under Under- -Five Children in Egypt: Contextual Determinants of an Five Children in Egypt: Contextual Determinants of an Five Children in Egypt: Contextual Determinants of an Five Children in Egypt: Contextual Determinants of an Individual Consequence Individual Consequence Individual Consequence Individual Consequence Sumit Mazumdar Sumit Mazumdar Sumit Mazumdar Sumit Mazumdar Email: [email protected]Web: http://iitmandi.academia.edu/SMazumdar
Draft Version: Please do not cite without authorDraft Version: Please do not cite without authorDraft Version: Please do not cite without authorDraft Version: Please do not cite without author’’’’s permissions permissions permissions permission
Assessing Vulnerability to Chronic Undernutrition among Assessing Vulnerability to Chronic Undernutrition among Assessing Vulnerability to Chronic Undernutrition among Assessing Vulnerability to Chronic Undernutrition amongUnderUnderUnderUnder----Five Children in Egypt: Contextual Determinants of anFive Children in Egypt: Contextual Determinants of anFive Children in Egypt: Contextual Determinants of anFive Children in Egypt: Contextual Determinants of an
Assessing Vulnerability to Chro Assessing Vulnerability to Chro Assessing Vulnerability to Chro Assessing Vulnerability to Chronic Undernutrition among Undernic Undernutrition among Undernic Undernutrition among Undernic Undernutrition among Under----FiveFiveFiveFiveChildren in Egypt: Contextual Determinants of an IndividualChildren in Egypt: Contextual Determinants of an IndividualChildren in Egypt: Contextual Determinants of an IndividualChildren in Egypt: Contextual Determinants of an IndividualConsequenceConsequenceConsequenceConsequence
Abstract Abstract Abstract Abstract
Nutritional outcomes remain an important development indicator, and reflects ahouseholds vulnerability to improved quality of life. Drawing upon recent household surveydata from Egypt, this paper applies hierarchical models to test the effect of contextualfactors on chronic undernutrition among under-five children and identifies the demographicand socioeconomic characteristics that underscore such vulnerability. Results indicateconsiderable regional and neighbourhood effects influencing a household’s nutritionalchoices. However, no significant effect could be identified for socioeconomic status of thehousehold and also for mother’s education. A low-level equilibrium in undernutrition withreduced heterogeneity suggests more focused intervention strategies aimed at vulnerableEgyptian communities to reduce child undernutrition.Keywords:Keywords:Keywords:Keywords: Child undernutrition, Egypt, Multilevel models
RéRéRéRésumésumésumésuméRésultats nutritionnels restent un indicateur important de développement, et témoigned'une vulnérabilité des ménages à la qualité de vie améliorée. S'appuyant sur des donnéesd'enquête récente sur les ménages de l'Egypte, le présent document s'applique modèleshiérarchiques pour tester l'effet de facteurs contextuels sur la malnutrition chronique chezles moins de cinq enfants et identifie les caractéristiques démographiques et socio-économiques qui mettent en évidence cette vulnérabilité. Les résultats indiquentconsidérables effets régionaux et de quartier en influençant les choix alimentaires d'unménage. Cependant, aucun effet significatif peut être identifié de la situationsocioéconomique du ménage et aussi pour l'enseignement maternel. Un équilibre à bas
niveau à la dénutrition à l'hétérogénéité réduit suggère des stratégies d'intervention plusciblés destinés à des communautés vulnérables d'Egypte pour combattre la dénutrition desenfants.MotsMotsMotsMots----clés:clés:clés:clés: dénutrition chez l'enfant, l'Egypte, les modèles multiniveaux
Introduction:Introduction:Introduction:Introduction:Hunger and nutritional failure signify both the cause as well as the consequence of
a household’s vulnerability to economic shocks, chronic and transient, and an importantindicator of food insecurity, poverty and deprivation of well-being. Assessment and
understanding of the phenomenon of nutritional deprivation is crucial for gaining insightsinto vulnerability; it can be in identifying the causative factors and their pathways of influencing household food security. Furthermore, being a quantifiable outcome, objectiveindicators of nutritional failure can be decomposed to observe the relative influence of socio-cultural, economic, community-specific and geographical vulnerabilities, which aids inprioritizing corrective intervention programs. Conventional vulnerability analyses has beenpredominantly focused on the production and availability of grain staples at the expense of other indicators, such as lack of access to health services, nutritional status, cultural
practices and gender inequality. Such analyses failed to identify which population groupsfell at relatively greater risk, and the underlying reasons.
This paper concentrates on child malnutrition, owing to its sublime importance towardsdevelopment goals and future economic impact. Malnourishment during the early years cancontribute to the prospective vulnerability of a household and can jeopardize the possibilityof moving out of the poverty trap. The broad aim of this paper is to examine relativevulnerability across households and individuals towards adverse nutritional outcomes, fromthe basic premise that these proximal determinants act in unison to threaten householdfood security, thereby applying constraints on adequate nutritional requirements amongchildren. We seek to identify the contextual correlates of malnutrition and understand therelative risk and vulnerability to suffer from adverse nutritional outcomes. We focus onEgypt, and present some descriptive statistics from secondary sources on the Arab world,but the results are expected to be significantly robust for other developing nations as well.
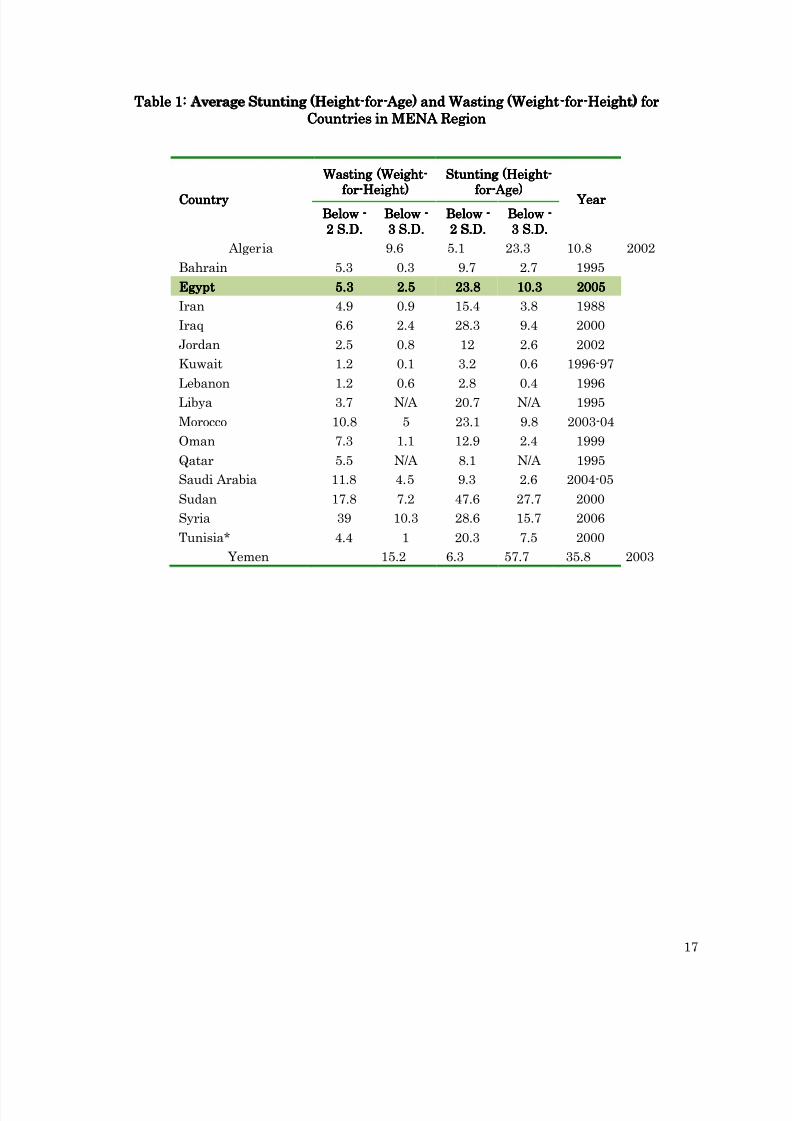
Egypt is a low-income, food-deficit country, with considerable poverty, and regionalpockets of high levels of food insecurity and malnutrition. According to the latest availableDHS data for Egypt (EDHS 2008), there is considerable level of chronic malnutrition amongEgyptian children. Overall, 29 percent of children under age five are stunted (short for age),
with 14 percent severely stunted, and though there has been a declining trend, stark socio-economic differentials have been observed in the distribution of malnutrition in Egypt(ORC Macro 2009). High prevalence of stunting among pre-school children and considerableregional variations has also been observed by a number of studies (FAO 2003). Althoughwasting (thin for age) is moderate (in the range of 5-10%), yet this indicates prevalence of acute nutritional shortfalls, most likely to be concentrated among the vulnerable populationgroups (cited in FAO 2003).
Conceptual Framework of Vulnerability and Nutritional Outcomes:Conceptual Framework of Vulnerability and Nutritional Outcomes:Conceptual Framework of Vulnerability and Nutritional Outcomes:Conceptual Framework of Vulnerability and Nutritional Outcomes:
Standard conceptual frameworks used in conventional vulnerability assessment andmapping has not been much applied to DHS data, primarily due to the paucity of adequate
data on consumption and a money-metric of economic status. However, the wealth of information on other proximate determinants of child nutritional outcomes at thehousehold level in the DHS datasets, allows us to examine vulnerability to chronic andacute nutritional deprivation beyond the direct causality between household food securityand nutritional status.
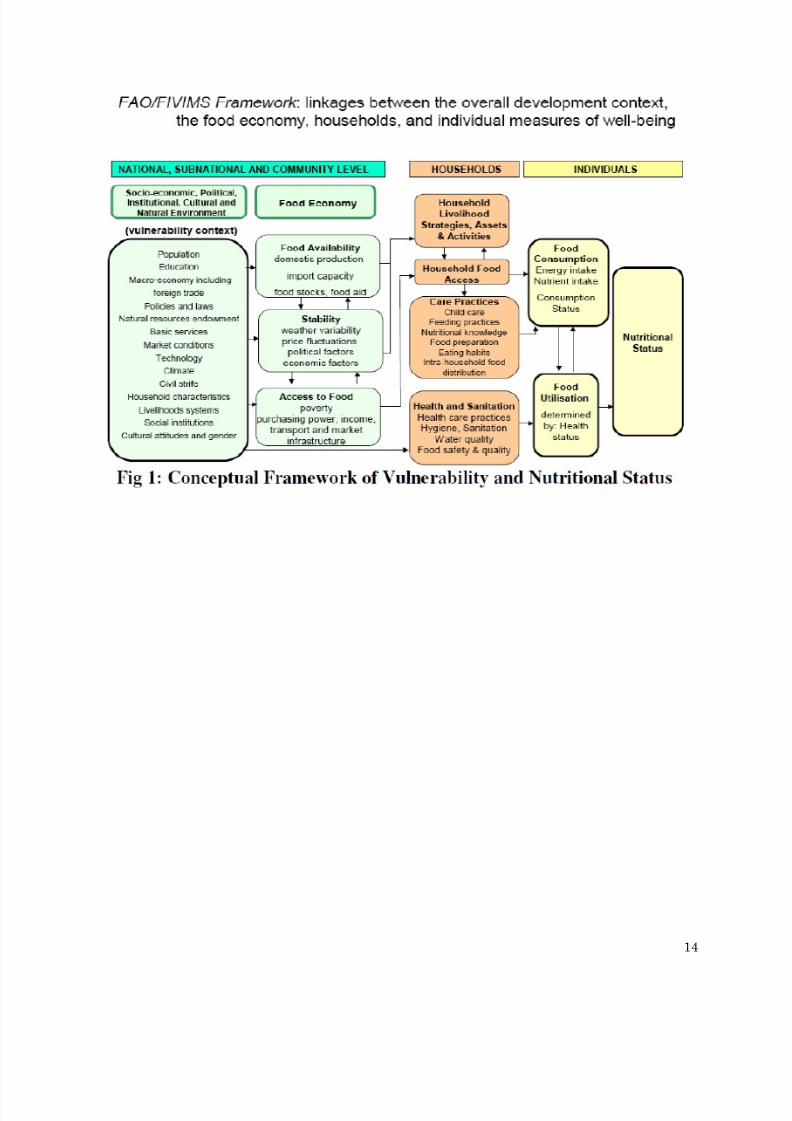
[Figure 1 around here][Figure 1 around here][Figure 1 around here][Figure 1 around here]The framework for vulnerability assessment depicted above has been proposed by
FAO as a standard theoretical underpinning for identifying the vulnerable allowing for theeffects of proximal and intermediate correlates. Although suited more for macro-levelnational analyses, testing the same using unit record household survey data is largelylimited by dearth of information at the macro (national/sub-national) level. Additionally,
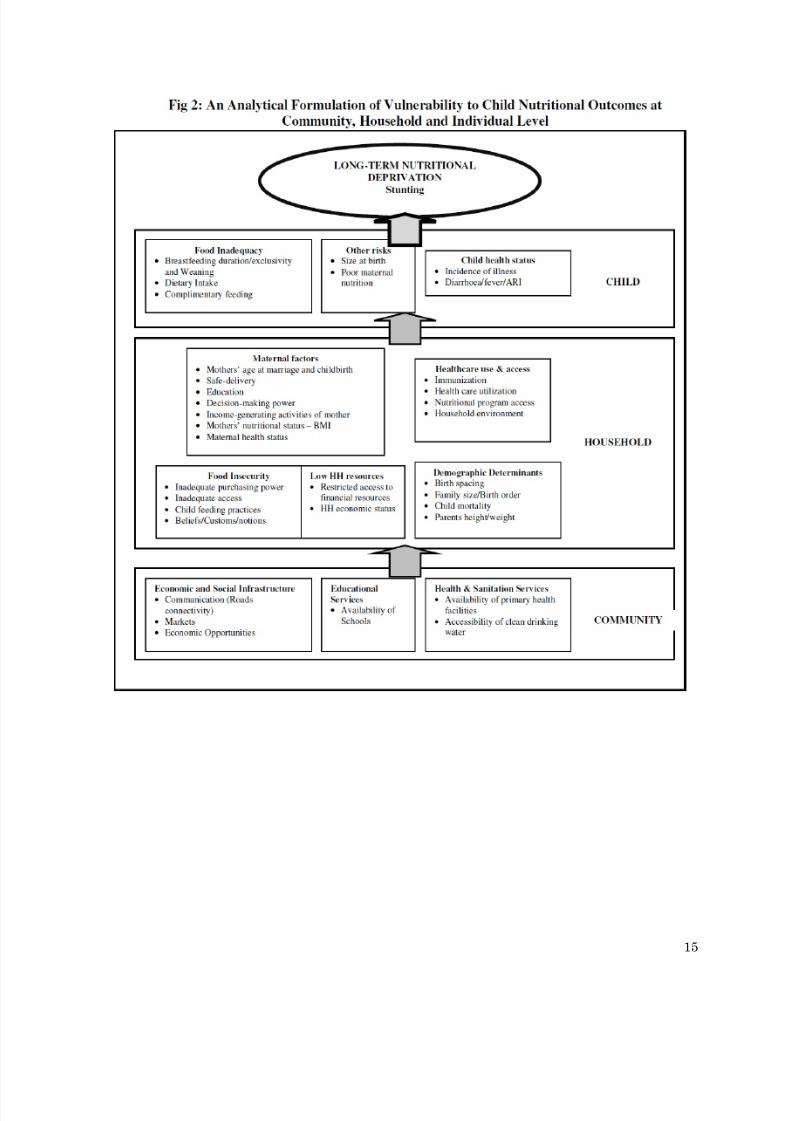
econometric considerations of pooling macro-level observations across cross-sectional surveyunits (i.e. households and/or individuals) are fraught with problems too. In view of theabove we have laid out a simpler analytical framework (Figure 2) that rests on theconceptualization of vulnerability to long-term nutritional shocks illustrated in Figure 1. InFigure 2, which draws upon established frameworks for analyzing determinants of undernutrition among children (The commonest starting point has been the frameworkprovided by UNICEF; See UNICEF 1990), the proximal and intermediate determinants of undernutrition has been laid out, isolating factors operating at the community (or macro-
level), household, maternal and child-level covariates. We return to explain the variablesused towards operationalizing the framework using the EDHS data in the next section.
[Figure 2 around here][Figure 2 around here][Figure 2 around here][Figure 2 around here]
II.II.II.II. Data and MethodsData and MethodsData and MethodsData and Methods
We use data from the latest available rounds of the Egyptian Demographic andHealth Survey (EDHS)-2008, which provides information on anthropometric indicators(height-for-age, weight-for-age and weight-for-height) of children under age five. We employthe standard practice of considering the standardized z-scores of deviations from thereference population (for details please refer EDHS 2008: ORC Macro 2009) for theseanthropometric indices. In the absence of a formal ‘income’ or ‘consumption expenditure’variable in the DHS, we rely on the household asset-based wealth index scores provided asa proxy for economic status.
To address the study objectives, we employ alternative econometric techniques.Initiating from an OLS regression of height-for-age (HAZ) scores on selected proximal andintervening parameters (following the analytical framework illustrated below), we move
towards multilevel models allowing for cluster level random effects. The multilevelapproach allows for possible correlation in undernutrition risks between children byincluding in the model a community/household specific random effect. The outcomevariable of interest in the OLS specification is the standardized z-scores of HAZ separatelymeasured as deviations from the WHO-NCHS reference population (EDHS 2009). Due tothe hierarchical nature of the data, a nested model is used, where the child is nested withinthe mother, which in turn is nested within the household and the community (PSU)variable.
Following conventional approaches cited in literature (Rice and Jones 1997;Gragnolati and Marini 2003; Gragnolati 2002; Diez-Roux 2000), a variance-componentsmultilevel model is fitted to correct for the aforesaid problem of correlated observations dueto the clustered nature of the data. A cluster-level random effect is introduced as correction
involving the following functional form:zijk = ββββxijk + ij + ∂i + €ijk
where zijk is the HAZ score of the k’ th child of the j’ th family in the i ’th community, ββββis the vector of regression coefficients corresponding to the fixed (and observable) effects of model covariates, xijk,, ∂i is a random community-effect that represents deviation of community i’ s mean z-score from the grand mean, ij is the random family-effectrepresenting the deviation of family ij ’’s mean from the mean of community i and €ijk is anindividual error term that represents the deviation of child ijk ’s z-score from the mean of family ij . By including the model covariates measured distinctly at the individual,household and community level, the variance-component multilevel model facilitates
exploring the extent to which cluster-level effects accounts for differences in the z-scores,introducing relative effect of covariates at each level. This analytical arrangement allowsidentifying the significant contextual correlates of malnutrition and delineating possiblechannels of vulnerability in different prevailing factors that can be considered as of havingsignificant influence in influencing adverse nutritional outcomes in children.
For the second objective, identifying the relative risk and vulnerability to suffer fromboth acute and chronic nutritional failure, linking individual consequences to contextualdeterminants of nutritional vulnerability requires a different analytical specification.
Allowing for the cluster-level random effects, logit specifications of regression models were
introduced, with dichotomous variables of anthropometric status as dependant variables.Occurrence of chronic undernutrition (using z-scores for HAZ) was regressed upon theearlier model covariates. Parsimonious model specifications were tested with introducingmodel covariates in stages, and changes in the model fit observed through log-likelihoodvalues to decide on the optimal model. All analysis were carried out using the STATA (Release 9) employing the glamm and xtmixed routines for the multilevel analysis.
III.III.III.III. Results and DiscussionResults and DiscussionResults and DiscussionResults and Discussion
Levels and Trends of Child Undernutrition in Egypt Levels and Trends of Child Undernutrition in Egypt Levels and Trends of Child Undernutrition in Egypt Levels and Trends of Child Undernutrition in Egypt
The Egyptian Demographic and Health Surveys (EDHS) is an important source formonitoring the undernutrition problem among Egyptian children and provides fairlydetailed information about the background characteristics of the undernourished childrenwhich helps in identifying the possible risk factors as well. Undernutrition in youngchildren is most commonly measured in terms of stunting (low height for age), wasting (low
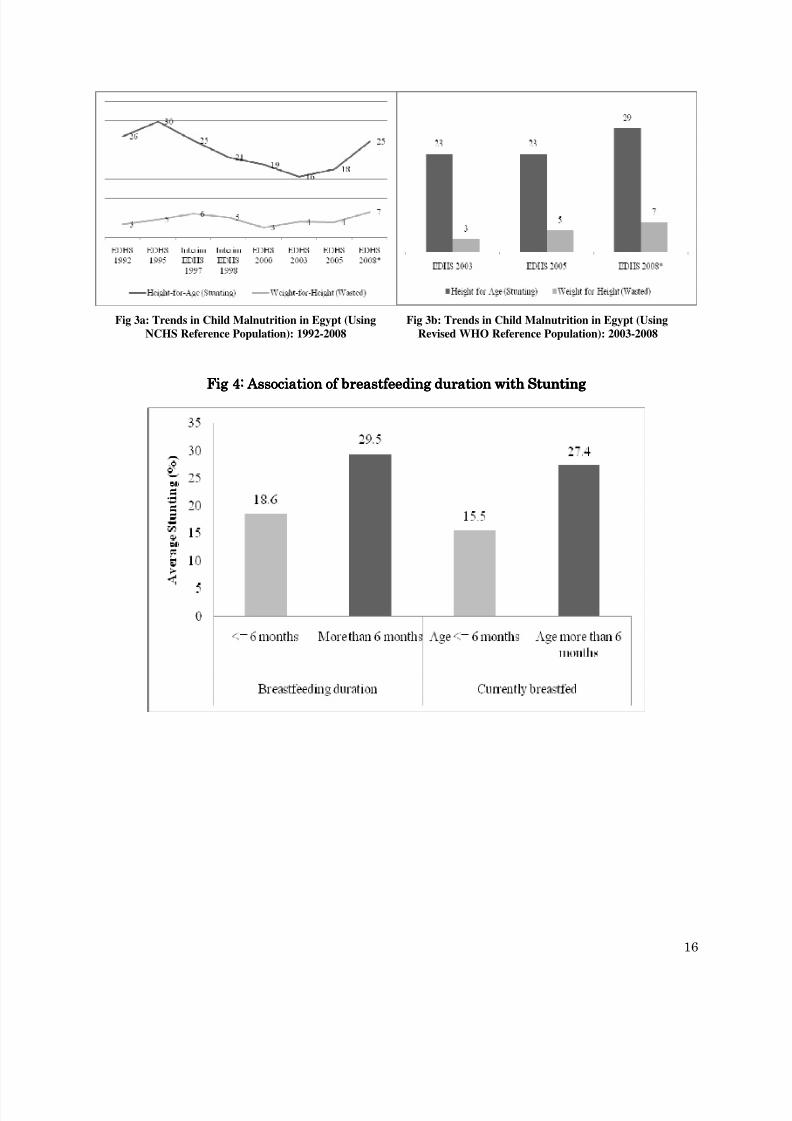
weight for height) and underweight (low weight for age). These indices are comparedagainst an international reference population. Children whose measurements fall below –2z-scores of the reference population median are considered undernourished, i.e. to havestunting, wasting or to be under-weight. Those children with measurements below –3 z-scores are considered to be severely undernourished. For the EDHS 2008, standardized z-scores were provided based on a new international reference population released by WHOin April 2006 (WHO Multicenter Growth Reference Study Group, 2006, cited in IIPS, 2007).Thus, while examining the trend in child undernutrition over the years, we have presentedthe estimates using the earlier standard (i.e. NCHS reference population) in Figure 3a, andusing the revised WHO reference population (Figure 3b).
[Figure 3a & 3b around here][Figure 3a & 3b around here][Figure 3a & 3b around here][Figure 3a & 3b around here]
As seen from the figures above, Egypt have witnessed mixed experience inchild malnutrition over the past decade and half. Both for stunting as well as wasting,denoting long-term and acute nutritional deprivation respectively, prevalence have declinedsteadily for about a decade (1995-2003). However, a reverse trend is witnessed since 2003(for EDHS-2005 and 2008), with a visible increasing trend (Figure 3a). Similar trend is alsoobserved while using the revised WHO reference population (Fig. 3b). Average stuntingamong under-five children in Egypt was almost constant between 2003 and 2005, but hadwitnessed a spurt then on, with an increase of about six percentage points in the ensuingperiod. A temporary (and insignificant) rise in child malnutrition (or any other demographicrates and ratios) based on household survey data is understandable, and researchers have
attributed such increases to better data quality, and in the present instance, improvedmeans of measuring children’s heights and better reporting of ages. However anexplanation for increasing trend observed since 2003, this does not explains theconsiderable increase in average stunting between 2005 and 2008 for obvious reasons (non-sampling errors in estimation can be reasonably expected to be stable over such shorterspan of time). The EDHS quotes findings of Geerlings and others (2007) in support of thehypothesis that large-scale culling of poultry in the wake of the outbreak of Avian influenzaof 2006 in Egypt, might have reduced supply of chicken and eggs considerably to thehouseholds having a bearing on nutritional status, besides putting strain on household
financial resources as poultry sales accounted for nearly half the incomes of Egyptianhouseholds prior to 2006 (Geerlings et.al. 2006, cited in ORC Macro 2009). To what extentsuch transient shocks can affect an index which is more amenable to long-term shocks andvulnerabilities, is an important research issue in its own capacity and deserves furtherinvestigation, which is beyond the scope of the present paper.
As in other developing countries the incidence of long-term undernutrition amongchildren in Egypt indicates significant extent of clustering across demographic,sociocultural and economic subsets of the population. About 29 percent of the childrenunder-five years of age in Egypt suffer from moderate long-term undernutrition and about14 percent from severe forms of it (EDHS 2009). Marked socioeconomic differentials inaverage stunting exist in Egypt with considerably higher incidence in rural areas (30percent) compared to the urban areas (27 percent). Regional differentials appear to be oneof the major sources of the absolute heterogeneity, with considerable inter-regionalvariations, varying from 23 percent in Urban Governorates to 38 percent in Lower Egypt.However, interestingly and deviating from established patterns visible otherwise across thedeveloping world no systematic differentials are observed with respect to household
economic status and mother’s education, which are among the strongest predictors of childundernutrition. For mother’s education, although no significant association could beestablished between broad categories of education and average stunting, children whosemothers have had no education appears to suffer from long-term undernutrition (29percent) compared to those with some schooling (27 percent, p - value of chi-square=0.07)1.But even such association is not visible using truncated categories of economic status (poor,middle and rich on the basis of DHS wealth quintiles). Similarly mother’s employment alsodoes not reveal any significant association with average stunting.
Determ Determ Determ Determinants of Long inants of Long inants of Long inants of Long- -- -term Undernutrition among Children in Egypt term Undernutrition among Children in Egypt term Undernutrition among Children in Egypt term Undernutrition among Children in Egypt
There is well documented evidence in literature citing the different correlates of
child undernutrition in developing countries (for e.g. Gragnolati and Marini 2003, Smith &Haddad 1999, Wagstaff and Watanabe 2000, Svedberg 2007, Mazumdar 2008 etc.). Theanalytical framework we have presented earlier draws on the empirical findings of multivariate models used to identify correlates of child malnutrition. Being primarilyfocused on long-term nutritional deprivation, we concentrate on the analysis of thedeterminants of same, using standardized height-for-age z-scores as the dependant variable(a negative transformation for easier interpretation) in the regressions. The explanatoryvariables have been selected guided by the analytical framework (Fig 2).
Child-level variables include size of the child at birth, recent experiences of commonchildhood illnesses (diarrhoea, fever and acute respiratory infections) and breastfeeding
duration in months, apart from the conventional variables for age and sex of the child.Maternal-level covariates are conceptualized as being nested within the household-levelvariables (in EDHS less than 10 percent of the women shared the same household). Thesevariables include mother’s level of education, whether she is employed or not, age atchildbirth, nutritional status in terms of BMI, place of delivery of the child and pastexperiences of child mortality. Owing to the empirical evidences of influence of women’s
1Summary results are available in the published reports of EDHS 2008 (Please refer to the end of the text). Further
computations are available from the author on request.
status and decision-making power on the long-term nutritional status of children (Smithet.al. 2003), a composite index of decision-making power of the women was employed2. Placeof delivery, apart from denoting improved receipt of post and ante-natal care by the women,also proxies the extension of healthcare service delivery and maternal and child healthintervention programme outreach in general, which has a definite bearing on overall healthof the child including nutritional status. For similar reasons, a composite index of healthcare utilization combining experiences of seeking post and antenatal care andmedical treatment in the case of childhood illnesses was also included.
Immunization status of the child has been found to be of considerable importance forchild health, not only due to its preventive aspect, but since it also represents the value ahousehold (or mother) attaches to the general health of the child which in turn caninfluence better infant and child care practices and health care uptake similar to place of delivery. Sociocultural covariates also play a significant role in determining childnutritional status that acts through intermediate variables, viz. infant and child feedingpractices and notions (Ruel and Menon 2002). As such, a composite index of infant andchild feeding practices developed by Ruel and Menon has been employed (for details in
computing the index, please refer to Ruel and Menon, op. cit.). Household financialresources and economic status, an important predictor is included in the model as well.Since the DHS do not provide any direct information on income or consumptionexpenditure, a composite index for the same, known as the DHS Wealth Index (Rutsteinand Johnson 2004) has been included.
A group of demographic variables such as birth-spacing and birth order of the childhave also been incorporated in the models. In the absence of alternative community-level ormacro determinants, we have in the models variables for place of residence (urban/rural),and geographic regions. To proxy for the availability and accessibility of public welfareprogrammes having a bearing on health status, we include two variables: one denoting theperception of the respondent on the distance from the nearest health facility and piped
The primary motivation for a multilevel analysis stems from the hierarchicallyclustered nature of the EDHS data. Where, children are nested into mothers, mothers arenested into households, households are into PSUs and PSUs into regions. Hence, factorsaffecting health outcomes in general and child nutritional status in particular arise fromdifferent levels of aggregation. Apart from individual demographic and health attributes(such as age, gender, birth order, size at birth etc.) which is independently determined forevery children, siblings share certain common characteristics of the mother and the
household (mother’s education and household economic status for e.g.) and children from aparticular community or village have in common community level factors such asavailability of health facilities and outcomes, it can be reasonably asserted that unobservedheterogeneity in the outcome variable is also correlated at the cluster levels (Gragnolati
2 Women's decision-making index was estimated by principal component analysis. The indicator combines whether woman
works for cash income, percentage age difference between woman and husband, woman's age at marriage and educationaldifference, in years, between woman and spouse, normalized to a scale of 0-100)[Smith et. al. 2002]
2005, Marini and Gragnolati 2006, Jones and Rice 1997, Bingenheimer and Raudenbush2004). This amounts to an estimation problem employing conventional OLS estimators.
The classical OLS estimator is equally efficient as the maximum likelihoodestimators only when the community level covariates and the household level covariatesare uncorrelated with the individual and maternal effects covariates (Angeles et. al. 2002).However, a consequence of clustering as stated above is that observations within a cluster(household, community and/or region) may be more homogenous than observations chosenat random, thus violating the assumption of independent observations; the classicalassumptions of OLS estimators.
Researchers have adopted fixed effects models to estimate nutrition models andcontrol for unobservable variables at the cluster level, which leads to the difficulty that if the fixed effect is differenced away, then the effect of those variables that do not vary in acluster will be lost in the estimation process (Marini and Gragnolati 2006).
The variance-components model correct for the problem of correlated observations ina cluster, by introducing a random effect at each cluster. In other words, subjects within thesame cluster are allowed to have a shared random intercept. Thus, we have,
where zzzzijkijkijkijk is the height-for-age z-score for the kth child from the jth household in the ith community (any additional level, such as lth state can be introduced likewise). ββββ is a vectorof regression coefficients corresponding to the effects of fixed covariates xxxxijkijkijkijk, which are theobserved characteristics of the child, the household and the community. Is a randomcommunity effect denoting the deviation of community i’s mean z-score from the grandmean, is a random household effect that represents deviation of household ij’s mean z-scorefrom the ith community mean, and is an individual error that represents deviation of thechild ijk’s z-score from the mean of household ij. The error terms δδδδiiii , , , , ijijijij and εεεεijkijkijkijk are assumedto be normally distributed with zero mean and variances σ2c, σ2,h and σ2i respectively. As per
our arguments above, these terms are non-zero and estimated by variance componentsmodels. To the extent that the greater homogeneity of within-cluster observations is notexplained by the observed covariates, σ2c, and σ2,h will be larger (Gragnolati 2005). Toevaluate the appropriateness of the multilevel models, we test whether the variances of therandom part are different from zero over households and communities. The resultingestimates from the models can be used to assess the Intra Class Correlation (ICC) i.e., theextent to which child undernutrition is correlated within households and communities,before and after we have accounted for the observed effects of covariates xxxxijkijkijkijk. A significantlydifferent ICC3 from zero suggests appropriateness of random effect models (Marini andGragnolati 2006). Following this, the total variability in the individual height-for-age zscores can be divided into its three components; variance among children within
households, households within communities and communities. By including covariates ateach level, the variance components models allow to examine the extent to which observeddifferences in the anthropometric scores are attributable to factors operating at each level.
3 The ICC coefficient describes the proportion of variation that is attributable to the higher level source of variation.
The correlations between the anthropometric outcomes of children in the same community and in the same family arerespectively:ρc = σ2c /(σ2c + σ2h + σ2i) and ρ h = (σ2c + σ2h )/(σ2c + σ2h + σ2i).
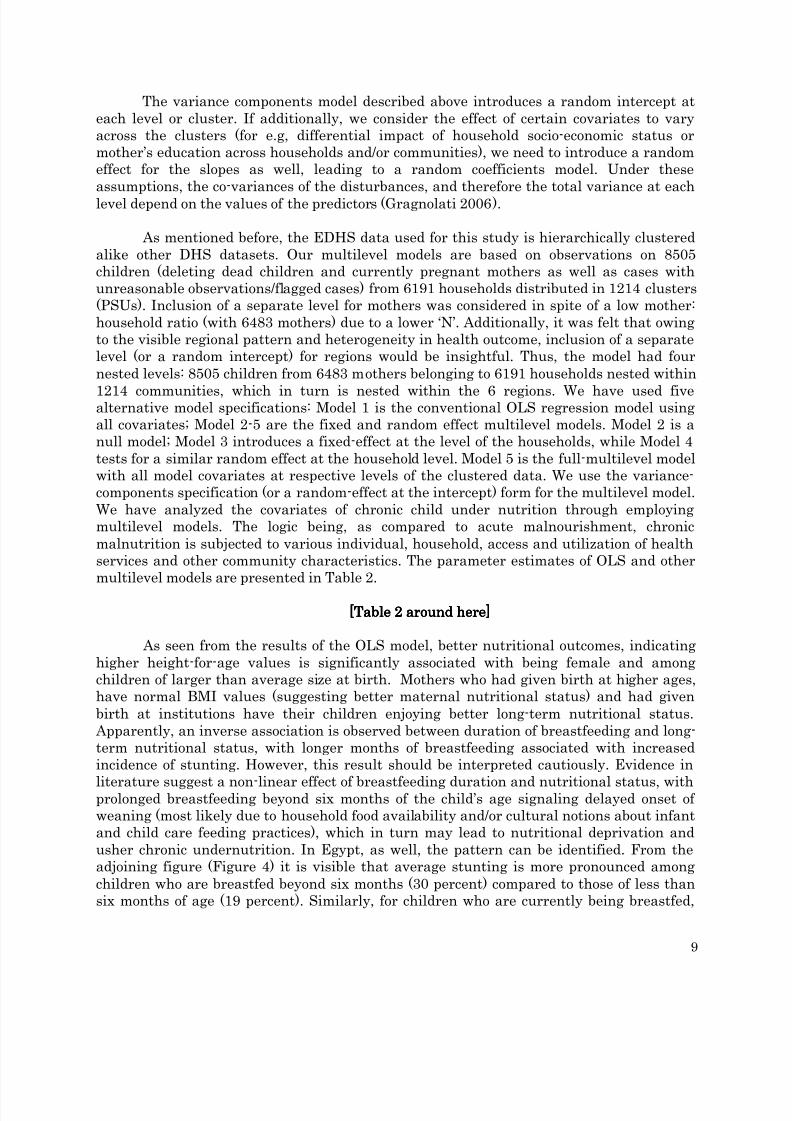
The variance components model described above introduces a random intercept ateach level or cluster. If additionally, we consider the effect of certain covariates to varyacross the clusters (for e.g, differential impact of household socio-economic status ormother’s education across households and/or communities), we need to introduce a randomeffect for the slopes as well, leading to a random coefficients model. Under theseassumptions, the co-variances of the disturbances, and therefore the total variance at eachlevel depend on the values of the predictors (Gragnolati 2006).
As mentioned before, the EDHS data used for this study is hierarchically clusteredalike other DHS datasets. Our multilevel models are based on observations on 8505children (deleting dead children and currently pregnant mothers as well as cases withunreasonable observations/flagged cases) from 6191 households distributed in 1214 clusters(PSUs). Inclusion of a separate level for mothers was considered in spite of a low mother:household ratio (with 6483 mothers) due to a lower ‘N’. Additionally, it was felt that owingto the visible regional pattern and heterogeneity in health outcome, inclusion of a separatelevel (or a random intercept) for regions would be insightful. Thus, the model had fournested levels: 8505 children from 6483 mothers belonging to 6191 households nested within
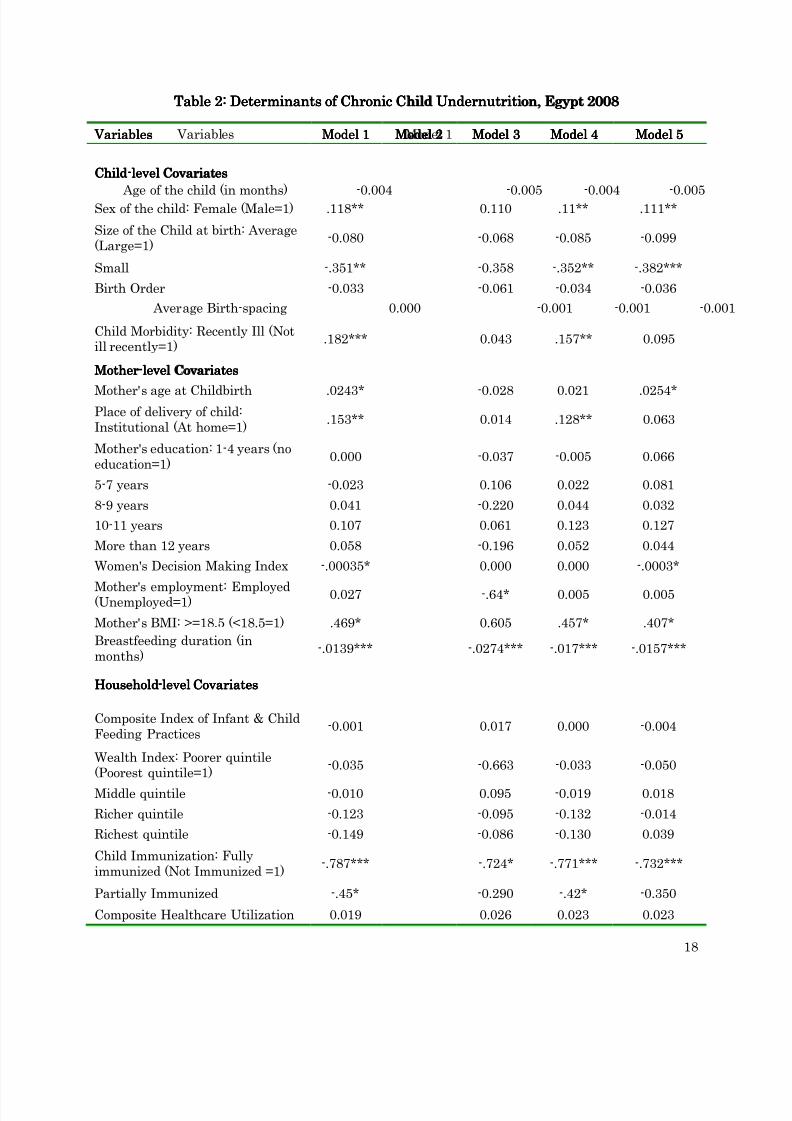
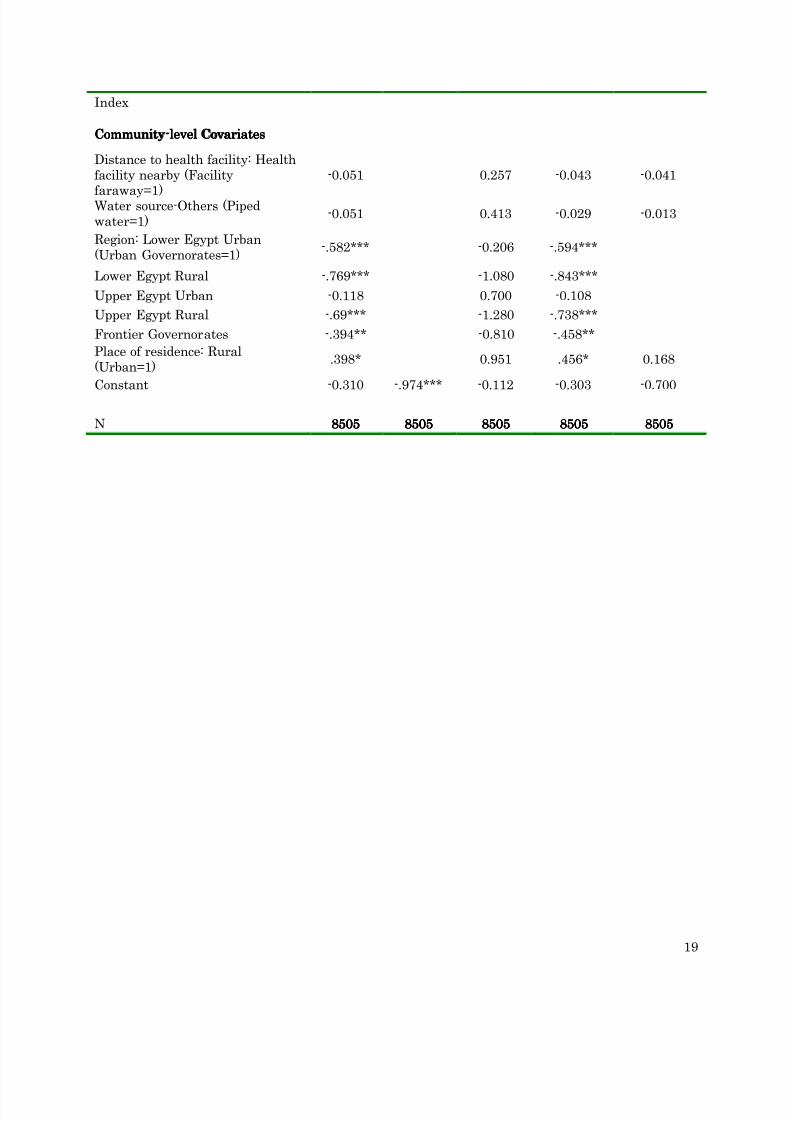
1214 communities, which in turn is nested within the 6 regions. We have used fivealternative model specifications: Model 1 is the conventional OLS regression model usingall covariates; Model 2-5 are the fixed and random effect multilevel models. Model 2 is anull model; Model 3 introduces a fixed-effect at the level of the households, while Model 4tests for a similar random effect at the household level. Model 5 is the full-multilevel modelwith all model covariates at respective levels of the clustered data. We use the variance-components specification (or a random-effect at the intercept) form for the multilevel model.We have analyzed the covariates of chronic child under nutrition through employingmultilevel models. The logic being, as compared to acute malnourishment, chronicmalnutrition is subjected to various individual, household, access and utilization of healthservices and other community characteristics. The parameter estimates of OLS and othermultilevel models are presented in Table 2.
[Table 2 around here][Table 2 around here][Table 2 around here][Table 2 around here]
As seen from the results of the OLS model, better nutritional outcomes, indicatinghigher height-for-age values is significantly associated with being female and amongchildren of larger than average size at birth. Mothers who had given birth at higher ages,have normal BMI values (suggesting better maternal nutritional status) and had givenbirth at institutions have their children enjoying better long-term nutritional status.
Apparently, an inverse association is observed between duration of breastfeeding and long-term nutritional status, with longer months of breastfeeding associated with increasedincidence of stunting. However, this result should be interpreted cautiously. Evidence in
literature suggest a non-linear effect of breastfeeding duration and nutritional status, withprolonged breastfeeding beyond six months of the child’s age signaling delayed onset of weaning (most likely due to household food availability and/or cultural notions about infantand child care feeding practices), which in turn may lead to nutritional deprivation andusher chronic undernutrition. In Egypt, as well, the pattern can be identified. From theadjoining figure (Figure 4) it is visible that average stunting is more pronounced amongchildren who are breastfed beyond six months (30 percent) compared to those of less thansix months of age (19 percent). Similarly, for children who are currently being breastfed,
those of younger age (less than/equals six months) are visibly less stunted than those of higher ages and still being breastfed.
[Figure 4 around here][Figure 4 around here][Figure 4 around here][Figure 4 around here]
The visible association of immunization status of children which has been includedin the model as a health service access variable, apart from importance of being immunizedin its own right (health aspects) is a bit surprising. As seen being fully immunized issignificantly associated with long-term undernutrition, controlling for other factors. A major reason seems to be the preponderance of fully immunized children in the entiresample (75 percent) and partially immunized (24 percent), leaving less than one percentchildren not immunized. It thus seems that access to health facilities do not seem to exert aconsiderable wedge in influencing the long-term health status, possibly due to considerablehomogeneity in access (and availability) for the factors considered. This is further explainedby the insignificant association of nutritional outcomes with composite health careutilization index which we have used and perceived distance from the health facility.
Although there appears to be significant inter-regional gradient in undernutrition, yet the
basic OLS models suggests that few variables which have been otherwise established asstrong predictors of child nutritional status, such as mother’s education, householdeconomic status and infant and child care feeding practices driven by cultural notions, donot emerge equally important in terms of significant statistical association and predictiveability in our model. We attempt further refinements in the regression models by allowingfixed and random effects and also try out different functional forms of the outcome variable(a binary transformation of the continuous height-for-age z-scores), but micro-level in-depthstudies can probably address the issue more aptly.
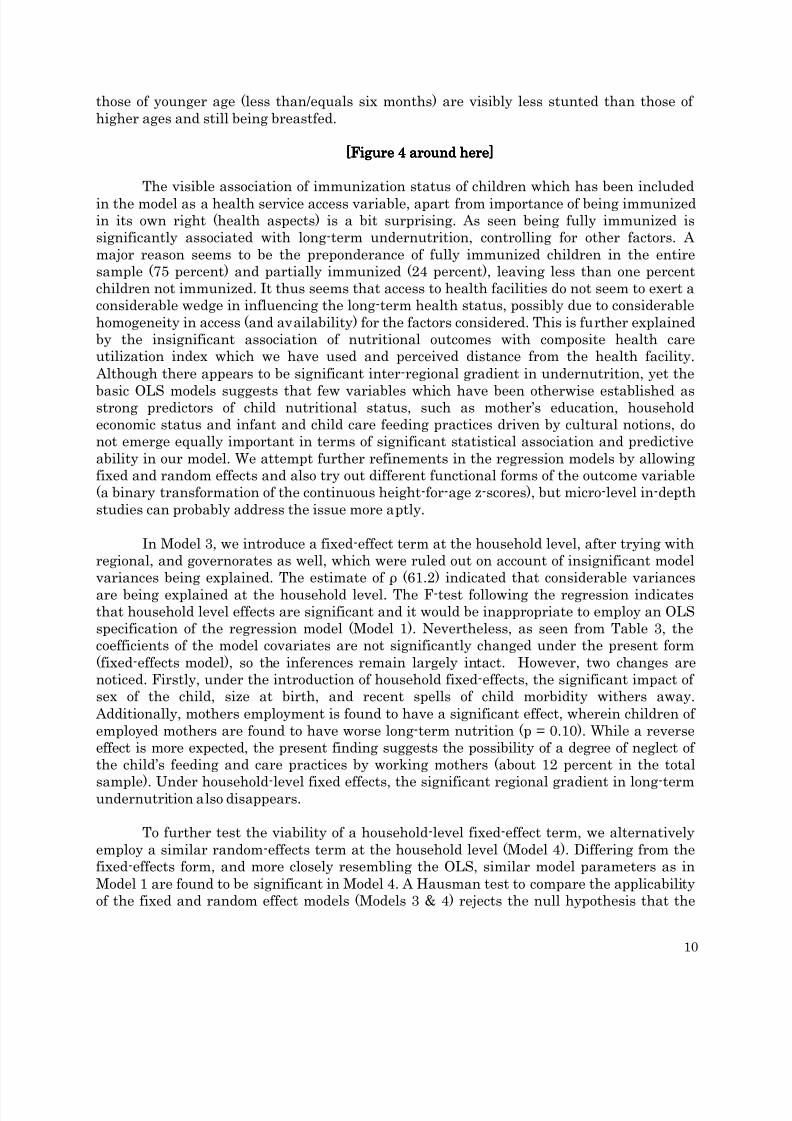
In Model 3, we introduce a fixed-effect term at the household level, after trying withregional, and governorates as well, which were ruled out on account of insignificant modelvariances being explained. The estimate of ρ (61.2) indicated that considerable variances
are being explained at the household level. The F-test following the regression indicatesthat household level effects are significant and it would be inappropriate to employ an OLSspecification of the regression model (Model 1). Nevertheless, as seen from Table 3, thecoefficients of the model covariates are not significantly changed under the present form(fixed-effects model), so the inferences remain largely intact. However, two changes arenoticed. Firstly, under the introduction of household fixed-effects, the significant impact of sex of the child, size at birth, and recent spells of child morbidity withers away.
Additionally, mothers employment is found to have a significant effect, wherein children of employed mothers are found to have worse long-term nutrition (p = 0.10). While a reverseeffect is more expected, the present finding suggests the possibility of a degree of neglect of the child’s feeding and care practices by working mothers (about 12 percent in the total
sample). Under household-level fixed effects, the significant regional gradient in long-termundernutrition also disappears.
To further test the viability of a household-level fixed-effect term, we alternativelyemploy a similar random-effects term at the household level (Model 4). Differing from thefixed-effects form, and more closely resembling the OLS, similar model parameters as inModel 1 are found to be significant in Model 4. A Hausman test to compare the applicabilityof the fixed and random effect models (Models 3 & 4) rejects the null hypothesis that the
random-effects estimator is consistent (Baum 2006). The household-level individual effectsdo appear to be correlated with the regressors.
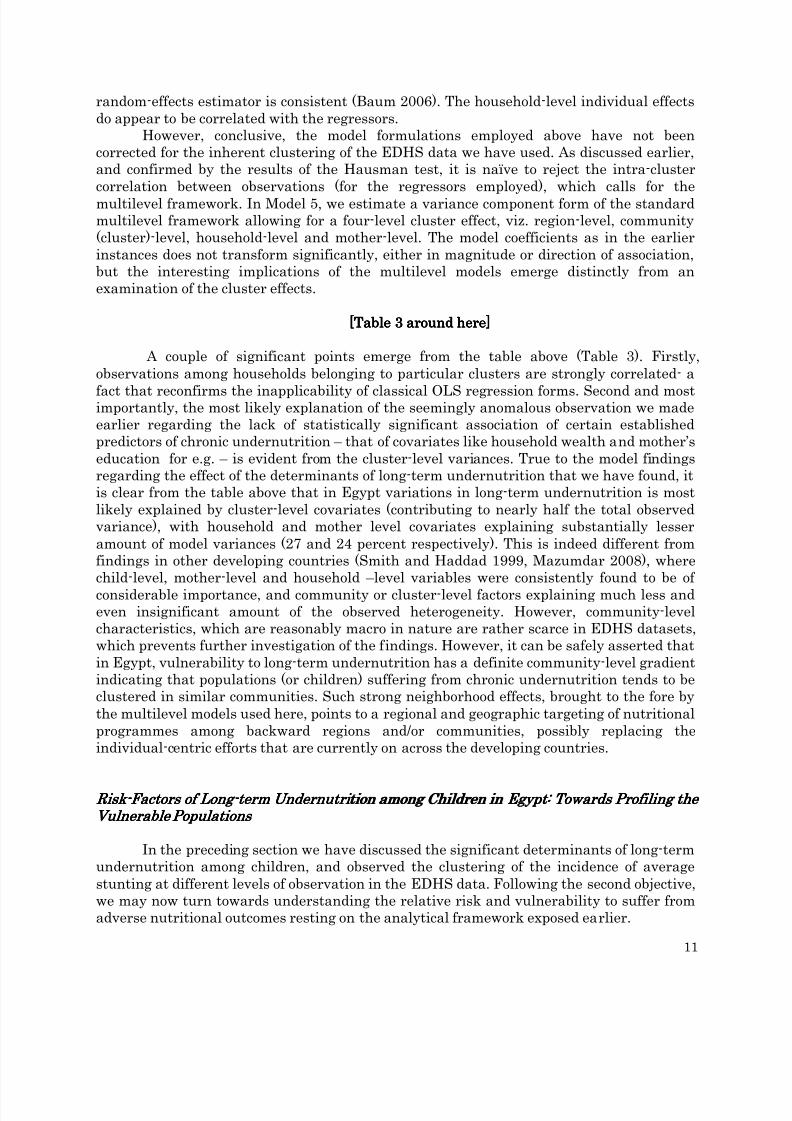
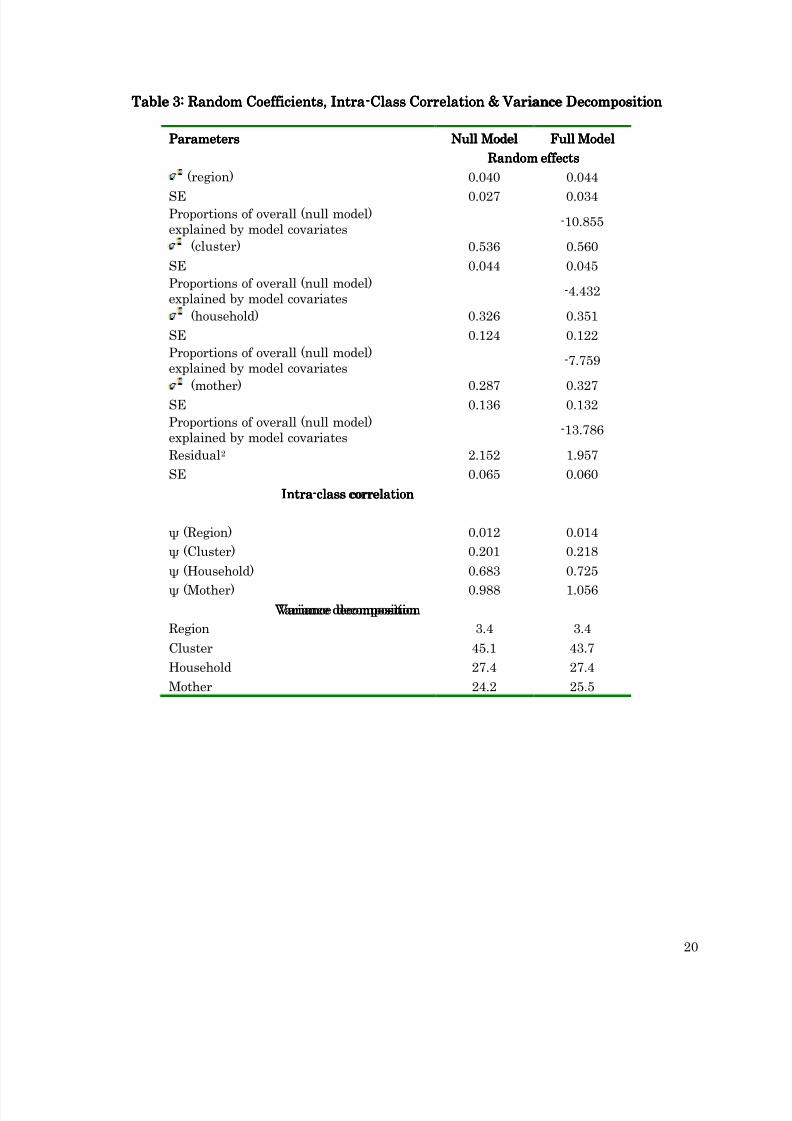
However, conclusive, the model formulations employed above have not beencorrected for the inherent clustering of the EDHS data we have used. As discussed earlier,and confirmed by the results of the Hausman test, it is naïve to reject the intra-clustercorrelation between observations (for the regressors employed), which calls for themultilevel framework. In Model 5, we estimate a variance component form of the standardmultilevel framework allowing for a four-level cluster effect, viz. region-level, community(cluster)-level, household-level and mother-level. The model coefficients as in the earlierinstances does not transform significantly, either in magnitude or direction of association,but the interesting implications of the multilevel models emerge distinctly from anexamination of the cluster effects.
[Table[Table[Table[Table 3333 around here]around here]around here]around here]
A couple of significant points emerge from the table above (Table 3). Firstly,observations among households belonging to particular clusters are strongly correlated- a
fact that reconfirms the inapplicability of classical OLS regression forms. Second and mostimportantly, the most likely explanation of the seemingly anomalous observation we madeearlier regarding the lack of statistically significant association of certain establishedpredictors of chronic undernutrition – that of covariates like household wealth and mother’seducation for e.g. – is evident from the cluster-level variances. True to the model findingsregarding the effect of the determinants of long-term undernutrition that we have found, itis clear from the table above that in Egypt variations in long-term undernutrition is mostlikely explained by cluster-level covariates (contributing to nearly half the total observedvariance), with household and mother level covariates explaining substantially lesseramount of model variances (27 and 24 percent respectively). This is indeed different fromfindings in other developing countries (Smith and Haddad 1999, Mazumdar 2008), wherechild-level, mother-level and household –level variables were consistently found to be of
considerable importance, and community or cluster-level factors explaining much less andeven insignificant amount of the observed heterogeneity. However, community-levelcharacteristics, which are reasonably macro in nature are rather scarce in EDHS datasets,which prevents further investigation of the findings. However, it can be safely asserted thatin Egypt, vulnerability to long-term undernutrition has a definite community-level gradientindicating that populations (or children) suffering from chronic undernutrition tends to beclustered in similar communities. Such strong neighborhood effects, brought to the fore bythe multilevel models used here, points to a regional and geographic targeting of nutritionalprogrammes among backward regions and/or communities, possibly replacing theindividual-centric efforts that are currently on across the developing countries.
Risk Risk Risk Risk- -- -Factors of Long Factors of Long Factors of Long Factors of Long- -- -term Undernutrition among Children in Egypt term Undernutrition among Children in Egypt term Undernutrition among Children in Egypt term Undernutrition among Children in Egypt: T : T : T : Towards Profiling the owards Profiling the owards Profiling the owards Profiling the
In the preceding section we have discussed the significant determinants of long-termundernutrition among children, and observed the clustering of the incidence of averagestunting at different levels of observation in the EDHS data. Following the second objective,we may now turn towards understanding the relative risk and vulnerability to suffer fromadverse nutritional outcomes resting on the analytical framework exposed earlier.
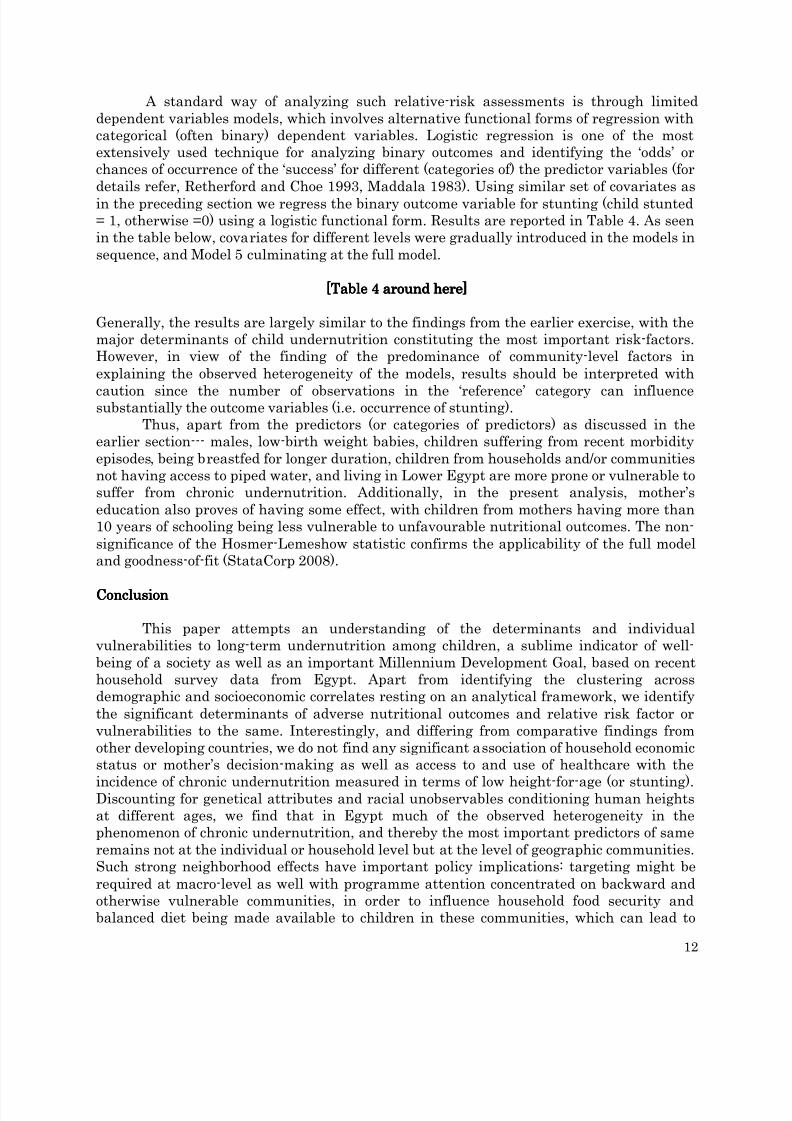
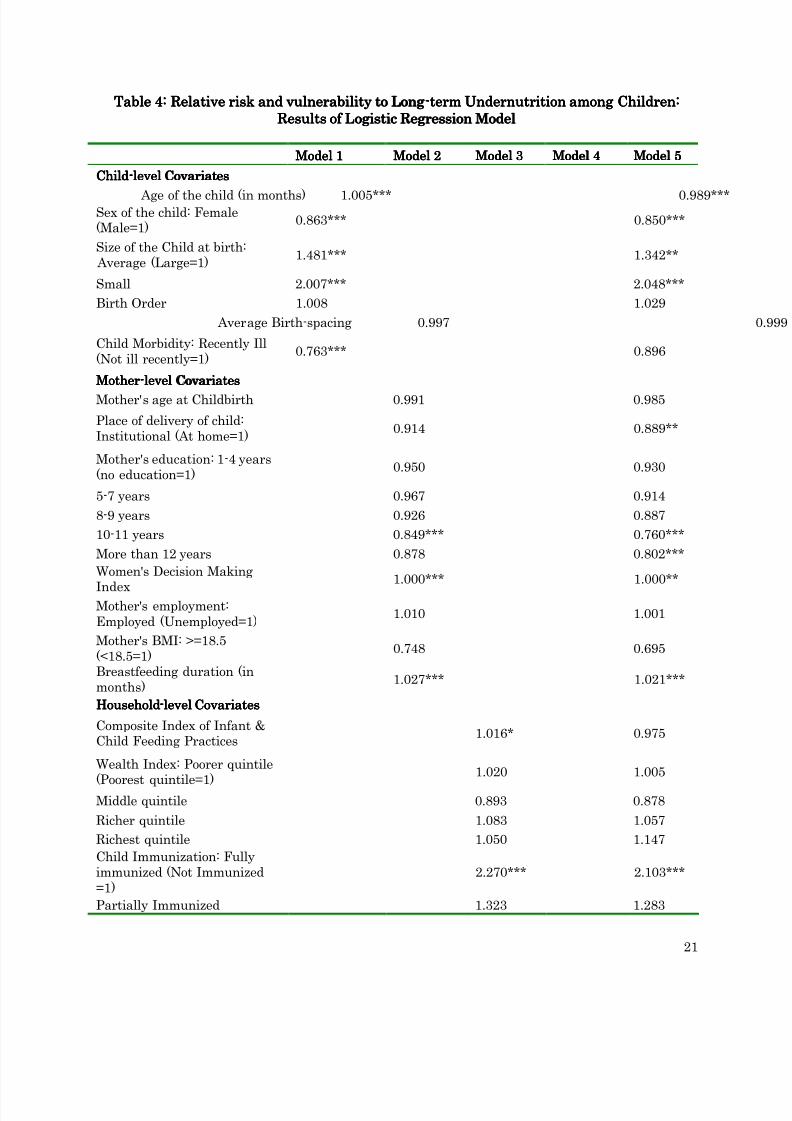
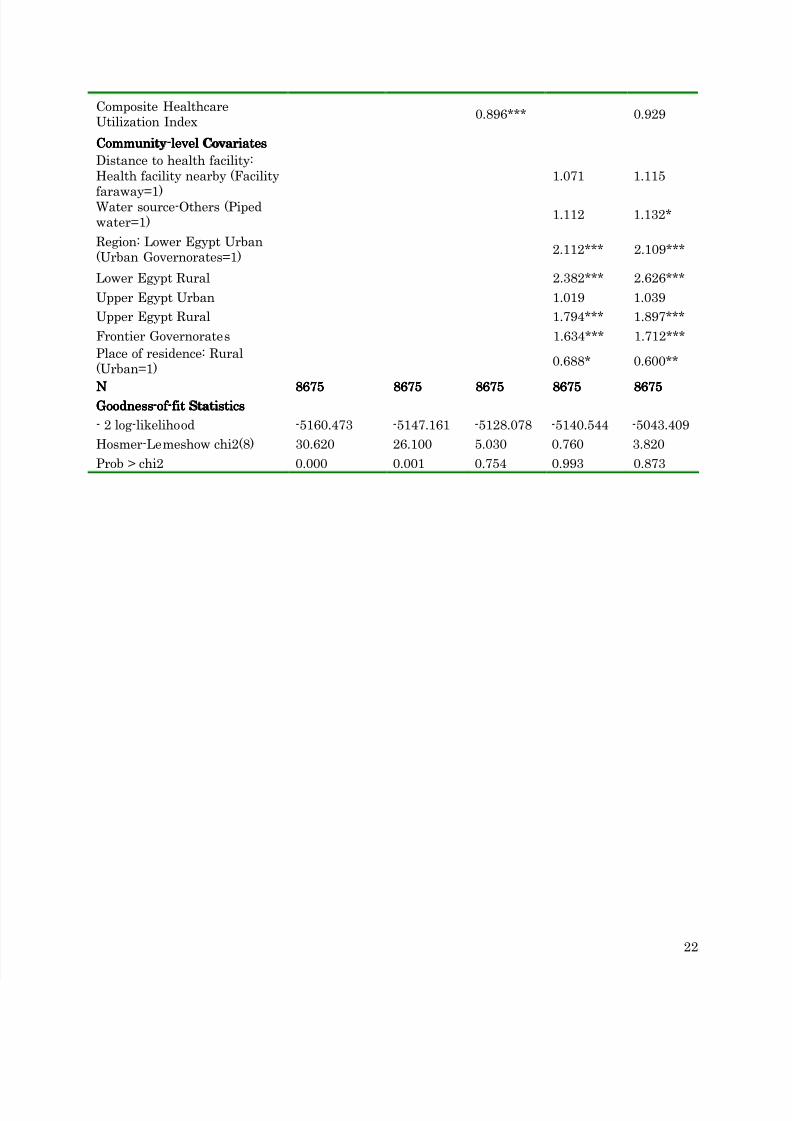
A standard way of analyzing such relative-risk assessments is through limiteddependent variables models, which involves alternative functional forms of regression withcategorical (often binary) dependent variables. Logistic regression is one of the mostextensively used technique for analyzing binary outcomes and identifying the ‘odds’ orchances of occurrence of the ‘success’ for different (categories of) the predictor variables (fordetails refer, Retherford and Choe 1993, Maddala 1983). Using similar set of covariates asin the preceding section we regress the binary outcome variable for stunting (child stunted= 1, otherwise =0) using a logistic functional form. Results are reported in Table 4. As seenin the table below, covariates for different levels were gradually introduced in the models insequence, and Model 5 culminating at the full model.
[Table 4 around here][Table 4 around here][Table 4 around here][Table 4 around here]
Generally, the results are largely similar to the findings from the earlier exercise, with themajor determinants of child undernutrition constituting the most important risk-factors.However, in view of the finding of the predominance of community-level factors inexplaining the observed heterogeneity of the models, results should be interpreted with
caution since the number of observations in the ‘reference’ category can influencesubstantially the outcome variables (i.e. occurrence of stunting).Thus, apart from the predictors (or categories of predictors) as discussed in the
earlier section--- males, low-birth weight babies, children suffering from recent morbidityepisodes, being breastfed for longer duration, children from households and/or communitiesnot having access to piped water, and living in Lower Egypt are more prone or vulnerable tosuffer from chronic undernutrition. Additionally, in the present analysis, mother’seducation also proves of having some effect, with children from mothers having more than10 years of schooling being less vulnerable to unfavourable nutritional outcomes. The non-significance of the Hosmer-Lemeshow statistic confirms the applicability of the full modeland goodness-of-fit (StataCorp 2008).
ConclusionConclusionConclusionConclusion
This paper attempts an understanding of the determinants and individualvulnerabilities to long-term undernutrition among children, a sublime indicator of well-being of a society as well as an important Millennium Development Goal, based on recenthousehold survey data from Egypt. Apart from identifying the clustering acrossdemographic and socioeconomic correlates resting on an analytical framework, we identifythe significant determinants of adverse nutritional outcomes and relative risk factor orvulnerabilities to the same. Interestingly, and differing from comparative findings fromother developing countries, we do not find any significant association of household economicstatus or mother’s decision-making as well as access to and use of healthcare with the
incidence of chronic undernutrition measured in terms of low height-for-age (or stunting).Discounting for genetical attributes and racial unobservables conditioning human heightsat different ages, we find that in Egypt much of the observed heterogeneity in thephenomenon of chronic undernutrition, and thereby the most important predictors of sameremains not at the individual or household level but at the level of geographic communities.Such strong neighborhood effects have important policy implications: targeting might berequired at macro-level as well with programme attention concentrated on backward andotherwise vulnerable communities, in order to influence household food security andbalanced diet being made available to children in these communities, which can lead to
significant improvements in the nutritional outcomes in Egypt. Although, our analysescould have revealed more if we could incorporate other macro-level parameters that canmore distinctly segregate communities or clusters in terms of developmental indicators andthen test the macro-level association, the complimentary micro-level investigation brings tothe fore the importance of contextual effects that should be considered to adequatelyaddress vulnerabilities at the individual or household level.
ReferencesReferencesReferencesReferences
Borrell, A. G. Rambell and A. Mathurin, undated. “Chronic Vulnerability in Niger: Implications andLessons Learnt”, Accessed at http://www.odihpn.org/report.asp?id=2808
Diez-Roux, A.V., 2000. “Multilevel Analysis in Public Health Research”, Annual Review of Public
Health , 21, pp. 171-92.El-Zanaty & A. Way, 2006. “Egypt Demographic and Health Survey-2005”, Cairo, Egypt: Ministry of
Health, El-Zanaty and Associates and Macro International. _________________ 2009. “Egypt Demographic and Health Survey-2008”, Cairo, Egypt: Ministry of
Health, El-Zanaty and Associates and Macro International.
FAO, 2003. Country Nutrition Profile: Egypt. FAO: Rome.Geerlings, E., L. Albrechtsen, and J. Rushton. 2007. “Highly pathogenic avian influenza: A rapid
assessment of the socioeconomic impact on vulnerable households in Egypt ”. Rome, Italy:FAO/WFP-Joint Project
Gragnolati, M and A. Marini, 2003. “Malnutrition and Poverty in Guatemala”, Policy Research
Working Paper # 2967 . The World Bank: Washington D.C.Gragnolati, M., 2002. “Children’s Growth and Poverty in Rural Guatemala” Policy Research Working
Paper # 2193. The World Bank: Washington D.C.Maddala, G.S., 1983. “Limited Dependent and Qualitative Variables in Econometrics ”, Cambridge
University Press, Cambridge, UK.Mazumdar, S, 2008. “Child Malnutrition in India: The impact of Poverty and Inequality”,
Unpublished Working paper (processed).Retherford, R. and M.K. Choe, 1993. “Statistical Models for Causal Analysis ”, Wiley-Eastern, New
Delhi.Rice, N. and A. Jones, 1997. “Multilevel Models and Health Economics”, Center for Health
Economics Discussion Paper, University of York.Ruel T.M. & P. Menon, 2002. “Creating a child feeding index using the Demographic and Health
Surveys: An Example from Latin America”, FCND Discussion paper No. 130. , Food Consumptionand Nutrition Division, International Food Policy Research Institute, Washington D.C.
Rutstein, S.O. & K. Johnson, 2004. “The DHS Wealth Index”, DHS Comparative Reports # 6, ORCMacro: Maryland, USA.
StatCorp, 2007. STATE Release9. StatCorp: TexasSvedberg P., 2007. Child Malnutrition in India and China: 2020 focus brief on the world’s poor and
hungry people.UNICEF (United Nations Children's Fund). 1990. Strategy for Improved Nutrition of Children and
Women in Developing Countries. New York. UNICEFWagstaff, A. & N. Watanabe, 2000. “Socioeconomic Inequalities in Child Malnutrition in theDeveloping World”, Policy Research Working Paper , WPS 2434, Development Research group, TheWorld Bank: Washington D.C..
WHO working group, 1986. “The use and Interpretation of Anthropometric Indicators of NutritionalStatus”, Bulletin of the World Health Organization, 64(6), pp.929-941.
FigFigFigFig 4444: Association of breastfeeding duration with Stunting: Association of breastfeeding duration with Stunting: Association of breastfeeding duration with Stunting: Association of breastfeeding duration with Stunting
Fig 3a: Trends in Child Malnutrition in Egypt (Using
NCHS Reference Population): 1992-2008
Fig 3b: Trends in Child Malnutrition in Egypt (Using
Table 1: Average Stunting (HeightTable 1: Average Stunting (HeightTable 1: Average Stunting (HeightTable 1: Average Stunting (Height----forforforfor----Age) and Wasting (Weight Age) and Wasting (Weight Age) and Wasting (Weight Age) and Wasting (Weight----forforforfor----Height) forHeight) forHeight) forHeight) forCountries in MENA RegionCountries in MENA RegionCountries in MENA RegionCountries in MENA Region
TTTTableableableable 4444:::: RelativeRelativeRelativeRelative risk and vulnerability to Longrisk and vulnerability to Longrisk and vulnerability to Longrisk and vulnerability to Long----term Undernutrition among Children:term Undernutrition among Children:term Undernutrition among Children:term Undernutrition among Children:Results of Logistic Regression ModelResults of Logistic Regression ModelResults of Logistic Regression ModelResults of Logistic Regression Model
Model 1Model 1Model 1Model 1 Model 2Model 2Model 2Model 2 Model 3Model 3Model 3Model 3 Model 4Model 4Model 4Model 4 Model 5Model 5Model 5Model 5