THE CLIMATE FINANCE LANDSCAPE Empowered Lives, Resilient Nations. UNDP CLIMATE FINANCE READINESS THE CLIMATE FINANCE LANDSCAPE EXPERIENCES FROM EASTERN AND SOUTHERN AFRICA Enhancing Readiness for Climate Finance
Transcript
c h a p h e a d e r h e r e
T h e c l i m a T e F i n a n c e l a n d s c a p e
Empowered Lives,Resilient Nations.
UND
P Cl
imat
e Fi
NaN
Ce R
eaD
iNes
s
The climaTe finance landscape
E x p E r i E n c E s f r o m E a s t E r n a n d s o u t h E r n a f r i c a
enhancing Readiness for climate finance
A
Empowered Lives,Resilient Nations.
compiled by
oneWorld Sustainable investments (oneWorld) is a climate and development consultancy and partner based in South Africa and operating across the African continent. oneWorld produces applied research, strategy development, policy analysis, thought leadership and interventions towards resilient development together with its partners and programme beneficiaries. For more information, see www.oneworldgroup.co.za.
UNdp partners with people at all levels of society to help build nations that can withstand crisis, and drive and sustain the kind of growth that improves the quality of life for everyone. on the ground in 177 countries and territories, we offer global perspective and local insight to help empower lives and build resilient nations.
This report was produced under the leadership and funding of the UNdp’s Regional bureau of Africa regional environment project on the management of environmental Services and Financing for Sustainable development. The project provides support targeted at building the capacity of regional economic communities (Recs), governments, UNdp country offices and other stakeholders on sustainable ways to restore and manage natural ecosystems, while also, establishing enabling conditions for countries to access environmental finance from emerging carbon/environmental finance markets.
enhancing Readiness for climate finance
RecommeNded ciTATioN
oneWorld (2014). Enhancing Readiness for Climate Finance: Experiences from Eastern and Southern Africa – The Climate Finance Landscape. For UNdp Regional Service centre for Africa. cape Town: oneWorld Sustainable investments.
diSclAimeR
every effort has been made to include, and acknowledge, all participants.
The development of this material was funded by the United Nations development programme (UNdp). However, the views expressed do not necessarily reflect the official policies or views of UNdp. While reasonable efforts have been made to ensure that the contents of this publication are factually correct, UNdp does not take responsibility for the accuracy or completeness of its contents and shall not be liable for loss or damage that may be occasioned directly or indirectly through the use of, or reliance on, the contents of this publication.
This study was conducted between october 2013 and November 2014. The fieldwork behind the study was concluded in July 2014, also the cut off date applied to the data referenced throughout the main report and the supplementary reports.
E x p E r i E n c E s f r o m E a s t E r n a n d s o u t h E r n a f r i c a
enhancing Readiness for climate finance
2 T h e c l i m a T e F i n a n c e l a n d s c a p e
a c k n o w l e d g e m e n T s
Acknowledgements
We would like to thank Helene Gichenje and Assan Ngombe of the UNDP Regional Service Centre (RSC) for their input into and guidance for this study on climate finance readiness in six sub-Saharan Africa countries. The UNDP country offices also provided invaluable logistical support, including venues for hosting meetings in Ethiopia, Mozambique and Zambia; we thank them all for their commitment and hard work.
We would also like to thank our local country experts for the work done on the six country case studies, which were also commented on by the relevant government officials for completeness. These case studies were done by Mulugeta Mengist Ayalew and Michael Menker Girma for Ethiopia; Carmen Munhequeta and Sergio Malo for Mozambique; Dr. Lehlohonolo Moeti for Lesotho; Damian Casmiri for Tanzania; and Jonathan Kampata and Charity Mundia for Zambia. These case studies provided critical insights and significant input for the final report.
This work has been presented to, and discussed with, key stakeholders and officials representing the governments of Ethiopia (Admasu Nebebe, Zerihun Getis, and Ghrmawit Haile), Mozambique (Telma Manjate), Kenya (Fatuma Hussein), Lesotho (Mabafokeng Mahahabisa), Tanzania (Dr. Julius Ningu) and Zambia (Sabera Khan). Comments were also solicited and received from the offices of the United Nations Framework Convention on Climate Change (UNFCCC) Focal Points in each of the six countries. We would like to thank them all for their attendance and participation at the round table and the work they put into reviewing the case studies.
The following development partners attended and participated in the round tables: CDKN, DfID, FAO, GIZ, the Norwegian Embassy (Tanzania), USAID and the World Bank. We thank them all for their support and valuable input to this work.
We would also like to thank our team of experts: Merylyn Hedger, Global Climate Finance Adviser; Dennis Tänzler, Adviser on Global Best Practice; and Hussein Nafo, Senior Climate Finance Expert and Negotiator. Each expert contributed a chapter to the final report based on their area of expertise.
This report was written by Belynda Petrie, the project lead, with thanks and acknowledgement for the assistance of the OneWorld Team Members – Charlotte Ellis, Claire Pengelly, Dania Petrik and Lucy Martin – for their work on the UNDP project and their contribution to this report. These supplementary reports form the foundation of and inform the main report. In particular we would also like to acknowledge the role that Charlotte Ellis played, supported by John Notoane, in undertaking excellent fieldwork in each of the case study countries.
3T h e c l i m a T e F i n a n c e l a n d s c a p e
Table of Contents
T a b l e o F c o n T e n T s
1. Introduction 71.1 The Developmental Context of Climate Finance 81.2 Climate Finance and Development Finance 9
2. The Global Climate Finance Landscape 102.1 Public vs. Private Flows 102.2 Funds Available 112.3 Overview of Key Climate Finance Funds 12
The Least Developed Countries Fund (LDCF) 12Special Climate Change Fund (SCCF) 13The Adaptation Fund (AF) 13Climate Investment Funds (CIFs) 14Fast Start Finance (FSF) 14Reducing Emissions from Deforestation and Forest Degradation (REDD+) funds 14The Green Climate Fund (GCF) 15The Clean Development Mechanism (CDM) 15
3. Africa: The Climate Finance Landscape 173.1 Adaptation vs. Mitigation 183.2 Bilateral Initiatives Supporting Climate Activities in Africa 193.3 Geographical and Sectoral Distribution of Climate Funds in Africa 20
The Global Environmental Facility (GEF) Trust Fund 20The Least Developed Countries Fund (LDCF) and Special Climate Change Fund (SCCF) 21The Adaptation Fund (AF) 22Climate Investment Funds (CIFs) 24Fast Start Finance (FSF) 26Reducing Emissions from Deforestation and Forest Degradation (REDD+) 26The Green Climate Fund (GCF) 27The Clean Development Mechanism (CDM) 27
4. Access to key climate change funds by case study country 29The Global Environmental Facility (GEF) Trust Fund 30The Least Developed Countries Fund (LDCF) and Special Climate Change Fund (SCCF) 33The Adaptation Fund (AF) 33Climate Investment Funds (CIFs) 34Fast Start Finance (FSF) 34Reducing Emissions from Deforestation and Forest Degradation (REDD+) 35The Clean Development Mechanism (CDM) 36
4
l i s T o F T a b l e s , F i g u r e s a n d b o x e s
T h e c l i m a T e F i n a n c e l a n d s c a p e
List of TablesTable 1. Types of International Funds 11Table 2. Types of International Funds 28Table 3. International funds accessed by case study countries (US$ million) 37
List of FiguresFigure 1. Percentage of approved GEF spending per region 21Figure 2. Adaptation funding per region 22Figure 3. African AF allocation by sector 22Figure 4. Number of approved AF projects in Africa implemented through different
implementing entities 23Figure 5. CIF funds accessed in Africa 24Figure 6. CIF funds approved spending by region 25Figure 7. Amount of funding committed during 2010-2012 FSF contribution period,
by recipient region and major objective 26Figure 8. CDM Registered Projects by region 27Figure 9. GEF 4 and 5: accessed funds as a percentage of allocated funds (as of May 2014) 30Figure 10. Differences between GEF 4 & 5 allocations 31Figure 11. GEF 5 allocations (US$) 31Figure 12. LDCF and SCCF approved spending (US$ million) 32Figure 13. CIF approved funding (US$ million) 33Figure 14. FSF accessed 2010 - 2012 (US$ million) 34Figure 15. Approved REDD+ funding (US$ million) 35Figure 16. CDM registered projects by host country 35
List of BoxesBox 1. South Africa’s Experience with the Adaptation Fund Board 23Box 2. Kenya’s Experience with the Clean Development Mechanism 36
5
l i s T o F a b b r e v i a T i o n s a n d a c r o n y m s
T h e c l i m a T e F i n a n c e l a n d s c a p e
List of Abbreviations and AcronymsAF Adaptation Fund
AFB Adaptation Fund Board
BFI Bilateral Finance Institution
CDKN Climate and Development Knowledge Network
CDM Clean Development Mechanism
CER Certified Emission Reduction
CIF Climate Investment Fund
COP Conference of the Parties
CTF Clean Technology Fund
DNA Designated National Authority
FCPF Forest Carbon Partnership Facility
FIP Forest Investment Program
FSF Fast Start Finance
GCCA Global Climate Change Alliance
GCF Green Climate Fund
GDP Gross Domestic Product
GEF Global Environmental Facility
GEEREF Global Energy Efficiency and Renewable Energy Fund
GHGs Greenhouse gases
IEA International Energy Agency
IPCC Intergovernmental Panel on Climate Change
LDC Least Developed Country
LDCF Least Developed Countries Fund
MDBs Multilateral development banks
MDGs Millennium Development Goals
MIE Multilateral Implementing Entity
MRV Monitoring, Reporting and Verification
NIE National Implementing Entity
ODA Official Development Assistance
6
l i s T o F a b b r e v i a T i o n s a n d a c r o n y m s
T h e c l i m a T e F i n a n c e l a n d s c a p e
PPCR Pilot Program for Climate Resilience
REDD Reducing Emissions from Deforestation and Forest Degradation
SCCF Special Climate Change Fund
SCF Standing Committee on Finance
SGP Small Grants Programme
SREP Scaling-Up Renewable Energy Program for Low Income Countries
SSA Sub-Saharan Africa
UNCCD United Nations Convention to Combat Desertification
UNEP United Nations Environment Programme
UNFCCC United Nations Framework Convention on Climate Change
UN-REDD United Nations Collaborative Initiative on Reducing Emissions from Deforestation and Forest Degradation
WEO World Energy Outlook
WFP World Food Programme
7
1 . i n T r o d u c T i o n
T h e c l i m a T e F i n a n c e l a n d s c a p e
1. Introduction
Energy demand is on the rise. Rapid population growth, intensified by a burgeoning global middle-class, places pressure on energy generation for social and economic development; – heating, lighting, mobility, industry, and manufacturing – are all necessary features of inclusive, widespread global development. The burning of fossil fuels, deforestation, industrial scale agriculture and transportation, among other activities, have markedly increased the concentration of carbon dioxide (CO2), methane (CH4) and nitrous oxide (N2O) – or Greenhouse Gases (GHGs) – in the atmosphere. The overriding effect is a decreasing resilience in the earth’s ecosystems due to the disturbances arising from climate change and associated impacts (droughts, flooding, fires, ocean acidification and rising sea levels, etc.) (Escobar and others, 2009; IPCC, 2007).
In the 2011 edition of the World Energy Outlook (WEO), the International Energy Agency (IEA) warned that the world has only six years to shift to a low-carbon energy pathway, or face irreversible and catastrophic climate change (Pearce, 2012). In light of this fast-approaching deadline, possible mitigation options across all sectors need to be considered to address the expected scope of climate change impacts, while adaptation measures must be considered as a strategy to cope with unavoidable impacts under different scenarios of climate change.
Unless significant reductions are made, current pledges to reduce emissions by 2020 will not be substantial enough to put a cap of 2°C on global warming and are predicted to result in a 3.5-4°C global temperature increase by 2100. The emissions gap is the disparity between the expected emissions levels in 2020 (if countries fulfill their current pledges) and the emissions levels necessary to keep the global temperature trajectory below 2°C. While technically and financially viable mitigation efforts using energy efficiency measures and renewable energy technologies can enable governments to take the steps necessary to decrease emissions, adaptation costs and the impact on lives and livelihoods will be dramatic and potentially irreversible, should this gap not be closed (UNEP and AMCEN and CA,2013).
Efficient, transparent and country-driven approaches to the delivery of climate finance are crucial to achieving the global objectives of climate change policy. International responses to climate change include mitigation and adaptation strategies to facilitate greater resilience to expected impacts. There are already a variety of national and international funds, with different access modalities and a diversity of funded projects, that deliver climate finance with the purpose of reducing global GHG emissions and associated impacts, through both adaptation and mitigation measures. This chapter explores the global climate finance context by providing an overview of the key funds, describes the climate finance landscape in Africa highlighting the most important sources of funds, and then focuses on the ability of the countries covered in this study (namely Ethiopia, Kenya, Lesotho, Mozambique, Tanzania and Zambia) to access various climate change funds.
8
1 . i n T r o d u c T i o n
T h e c l i m a T e F i n a n c e l a n d s c a p e
1.1 The developmental context of climate financePeople living in developing and least developed countries will be most vulnerable to the effects of climate change in the coming century – and will be least equipped to deal with the consequences. Generally, these countries have a large proportion of their populations strongly dependent on favourable climatic conditions for agriculture and other livelihood activities that rely on stable, predictable environmental factors. While developed (“Annex 1”1) countries can deal with the expected impacts of the warming atmosphere through designer mitigation and adaptation measures, many developing countries continue to struggle with difficulties such as poverty, political instability, debt, food insecurity, a lack of potable water and energy provision, and local climatic events that present far more immediate problems. Climatic impacts are expected to exacerbate these vulnerabilities, preventing developing countries from achieving significant economic growth, and potentially eroding hard-won development gains, as they battle with socio-economic development and environmental challenges.
In Africa, least developed countries (LDCs) are further characterized by poor infrastructure and weak institutional capacities, the combination of which disables effective coping strategies for dealing with climatic impacts on natural resources and livelihoods. Global action on reducing GHG emissions needs to be taken, while at a national level, developing countries need to be able to achieve equitable and sustainable growth trajectories without an associated increase in emissions. The timely transfer of appropriate climate finance to the poorest and most vulnerable countries is necessary in order to provide them with the resources to adapt and cope with expected climatic impacts and enable them to embark on a low-carbon and climate-resilient development trajectory (Nakhooda and others, 2013). This is particularly important, as developing countries are generally those least responsible for anthropogenic climate change. Climate finance is a crucial component of such response strategies, and supports the directives and actions of developing countries most vulnerable to climate change impacts.
It has been estimated that more than 300,000 people are currently dying from the effects of climate change annually (GHF, 2009). The incidence of death and disease and the severity of droughts and flooding are likely to increase alongside global atmospheric temperatures. Climate change is thus intrinsically associated with the right to health, life and personal security, and this introduces an ethical dimension to the climate change debate. It is imperative that countries cooperate to solve these complex problems.
According to the World Resources Institute, between now and 2050, developing countries will require an estimated US$531 billion per year of additional investment in energy supply and demand technologies in order to contribute to the international commitment of limiting the global temperature rise to 2° C above pre-industrial levels (Polycarp, Brown and Fu-Bertaux, 2013). This translates to a need far greater than the collective commitment by developed countries under the UNFCCC to mobilize US$100 billion a year by 2020. Given the recent world economic slowdown, it is vital for developing countries to explore innovative ways of leveraging, mobilizing and scaling-up climate finance from both public and private sources in order to meet their identified needs.
1 “Annex 1 countries” refer to industrialized countries and economies in transition (former Soviet bloc countries), which committed themselves as a groupas part of the UNFccc agreement to reducing their emissions of the six greenhouses gases by at least 5 per cent below 1990 levels over the period between 2008 and 2012.
9
1 . i n T r o d u c T i o n
T h e c l i m a T e F i n a n c e l a n d s c a p e
1.2 climate finance and development financeWhilst Annex 1 countries are assigned historical emission levels, and typically have the financial resources and capabilities to pursue lower-emission growth trajectories, the pursuit of economic development in developing countries typically follows growth trajectories linked to higher emission levels. Unlike Annex 1 countries that have driven high emissions through decades of economic growth, developing countries are not considered historically responsible for climate change. Yet, in spite of their historical responsibility for emissions and their proven ability to mitigate them, Annex 1 countries are reluctant to pay all the costs of mitigation, including those for developing countries. Likewise, developing nations are reluctant to undertake mitigation measures that may constrain the achievement of their objectives of growth and development. These challenges persist, resulting in inadequate responses from both the developed and developing world, as the need for a global response to increasing GHG emissions grows stronger.
The question of gaining access to “new and additional” climate finance on top of Official Development Assistance (ODA) has been one of the concerns often expressed by developing countries. The rationale behind this concern is that developing countries fear that climate finance will replace the much-needed ODA required for achievement of the Millennium Development Goals (MDGs). They claim that the issue of additionality is firmly grounded in international climate law2. The term “new” generally refers to the fact that the funds should represent an increase over past and existing climate-related funds. The term “additional” refers to the idea that financial resources raised for one objective, such as climate change, should not replace or divert funding from other important objectives, in particular, economic and social development (World Resources Institute, 2010). The definition of “new and additional” is important for mutual trust, yet it is hotly contested as several reports have acknowledged. Essentially, establishing whether funding is “new and additional” requires that “old and established” funding is clearly defined. In other words, a determination of the baseline is required, to which new and additional funds can be compared (Doornbosch and Knight, 2008). From the African perspective, it is important that the Standing Committee on Finance (SCF) of the UNFCCC undertakes the task of enhancing transparency as soon as possible, by proposing definitions of what “new and additional” means in terms of climate finance.
2 The United Nations Framework convention on climate change (UNFccc) (1992, Art. 4.3), the Kyoto protocol (1997, Art. 11.2), the bali Action plan (2007, para 1e), and the copenhagen Accord (2009, para 8) all call for developed countries to provide “new and additional” climate change financing to developing countries.
10
2 . T h e g l o b a l c l i m a T e F i n a n c e l a n d s c a p e
T h e c l i m a T e F i n a n c e l a n d s c a p e
2. The Global Climate Finance Landscape
Navigating the global climate finance landscape is a complex process. The number of funds and access modalities, the different ways in which those funds can be blended, and the distinct fiduciary requirements of each fund, all make for an environment that constrains the ability of some nations to access and disburse funding for climate-related initiatives.
The literature shows that there are neither ready-made prescriptions for climate finance, nor a one-size-fits-all model to ensure developing countries are able to access and use such funding for domestic purposes. Rather, as climate change impacts manifest themselves locally, readiness is very context- and country-specific. Readiness or preparatory activities for climate finance should be designed so that each country can organize and equip national institutional settings to respond to, plan and use the resources available so as to transform their development pathways. This transformation should be understood as a country-driven shift toward policies and technologies that catalyse new investments and mainstream climate change into existing systems.
2.1 public vs. private flowsThere is broad consensus about both the urgency of climate change adaptation in developing countries (particularly in Africa), and the imperative to use the scarce financial resources available wisely to meet the demand for economic development in a manner that directs economies towards low-carbon and climate-resilient development. While public finance is particularly important, increasing the supply of public finance alone will not suffice. Hence, there is a need to harness and leverage private sector spending. The IEA estimates that about 40 per cent of the global investment needed to transform energy systems alone will come from both households and businesses, while only 20 per cent is expected from governments (IEA, 2009). According to the UN’s Advisory Group on Climate Change Financing, actions to promote low-emission and climate-resilient development must be largely public-policy-based and private sector financed, so that international public finance is used catalytically alongside much larger capital flows (UNAGF, 2010).
Furthermore, developing countries have started increasing their own public spending on climate change activities, with developed countries creating the right setting for this by offering financial and technical support for “readiness and preparatory” activities (UNDP, 2012). In Warsaw 2013 (at COP 19) all parties were requested to enhance enabling environments and policy frameworks in order to facilitate the mobilisation and effective deployment of climate finance (Decision 3/CP.19, para. 6) (UNFCCC, 2014b).
11
2 . T h e g l o b a l c l i m a T e F i n a n c e l a n d s c a p e
T h e c l i m a T e F i n a n c e l a n d s c a p e
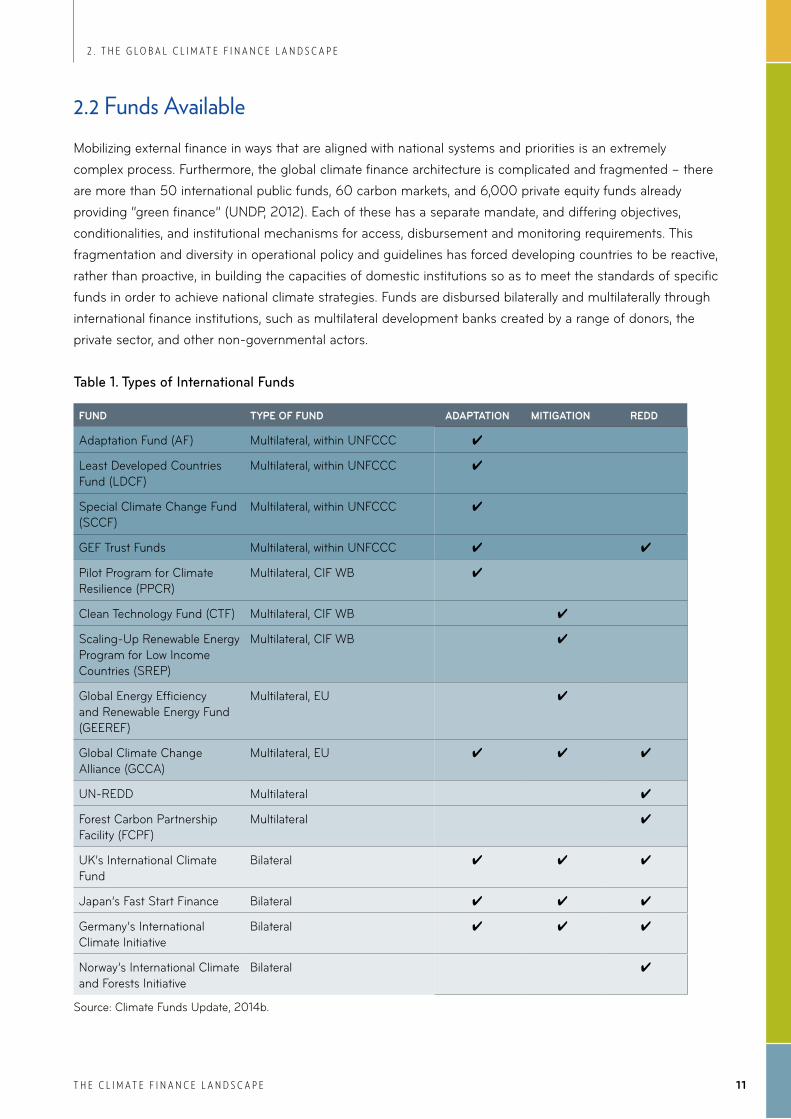
2.2 funds availableMobilizing external finance in ways that are aligned with national systems and priorities is an extremely complex process. Furthermore, the global climate finance architecture is complicated and fragmented – there are more than 50 international public funds, 60 carbon markets, and 6,000 private equity funds already providing “green finance” (UNDP, 2012). Each of these has a separate mandate, and differing objectives, conditionalities, and institutional mechanisms for access, disbursement and monitoring requirements. This fragmentation and diversity in operational policy and guidelines has forced developing countries to be reactive, rather than proactive, in building the capacities of domestic institutions so as to meet the standards of specific funds in order to achieve national climate strategies. Funds are disbursed bilaterally and multilaterally through international finance institutions, such as multilateral development banks created by a range of donors, the private sector, and other non-governmental actors.
Table 1. Types of international Funds
Fund Type oF Fund AdApTATIon MITIGATIon Redd
Adaptation Fund (AF) Multilateral, within UNFCCC ✔
Least Developed Countries Fund (LDCF)
Multilateral, within UNFCCC ✔
Special Climate Change Fund (SCCF)
Multilateral, within UNFCCC ✔
GEF Trust Funds Multilateral, within UNFCCC ✔ ✔
Pilot Program for Climate Resilience (PPCR)
Multilateral, CIF WB ✔
Clean Technology Fund (CTF) Multilateral, CIF WB ✔
Scaling-Up Renewable Energy Program for Low Income Countries (SREP)
Multilateral, CIF WB ✔
Global Energy Efficiency and Renewable Energy Fund (GEEREF)
Multilateral, EU ✔
Global Climate Change Alliance (GCCA)
Multilateral, EU ✔ ✔ ✔
UN-REDD Multilateral ✔
Forest Carbon Partnership Facility (FCPF)
Multilateral ✔
UK’s International Climate Fund
Bilateral ✔ ✔ ✔
Japan’s Fast Start Finance Bilateral ✔ ✔ ✔
Germany’s International Climate Initiative
Bilateral ✔ ✔ ✔
Norway’s International Climate and Forests Initiative
Bilateral ✔
Source: Climate Funds Update, 2014b.
12
2 . T h e g l o b a l c l i m a T e F i n a n c e l a n d s c a p e
T h e c l i m a T e F i n a n c e l a n d s c a p e
To date, the flows for both adaptation and mitigation finance have come from a handful of developed countries. The United Kingdom (UK), the United States (US), Germany, the European Commission and Japan represent more than 70 per cent of the US$2.73 billion pledged for adaptation (of which US$2.23 billion has actually been disbursed); while 73 per cent of the US$7.28 billion pledged for mitigation funding is accounted for by the US, Japan, the UK and Germany (of which US$5.6 billion has been disbursed to the relevant funds). Interestingly, only a small group of 20 countries is receiving the bulk of the financing and has accessed 50.3 per cent of the adaptation-targeted funding and 85 per cent of the mitigation-targeted funding (Schalatek and others, 2012a ; Schalatek and others, 2012b). Such a skewed climate funding allocation reveals some of the underlying considerations that influence the finance flows. For example, some of the countries most vulnerable to climate change, such as Zimbabwe, receive a very small proportion of the funding. On the other hand, emerging economies, such as South Africa, Egypt, Mexico and India, are the leading recipients of mitigation funding, exposing the inherent attraction of investing in fast-growing economies with high potential returns on investment.
2.3 Overview of Key climate finance fundsThe main adaptation funds are the Pilot Program for Climate Resilience (PPCR), responsible for 40.2 per cent of adaptation pledges; the Least Developed Countries Fund (LDCF) (27.1 per cent of adaptation pledges); the Global Climate Change Alliance (GCCA), (13.4 per cent); the Special Climate Change Fund (SCCF), (11.5 per cent); and the Adaptation Fund (AF), which is growing in importance but has currently contributed the least towards adaptation-related pledges, at 7.8 per cent as of November 2012 (Schalatek and others, 2012b)
Funds primarily supporting mitigation activities include the Clean Technology Fund (CTF), administered through the World Bank’s Climate Investment Funds (CIFs), responsible for almost 66 per cent of pledges for mitigation financing; the Global Environment Facility (GEF) Trust Fund 4 and 5, responsible for 26 per cent of mitigation financing pledges; the Scaling-Up Renewable Energy Program for Low Income Countries (SREP), responsible for 5.6 per cent of mitigation pledges; and the Global Energy Efficiency Renewable Energy Fund (GEEREF), (2.3 per cent). The GEF has had the highest success in terms of actual mitigation disbursements (US$9.8 billion), in spite of pledges being approximately a third of those to the CTF, a fund with actual disbursements of US$1.3 billion (Schalatek and others, 2012c).
The Global Environmental Facility (GEF) Trust FundThe GEF is the longest running, dedicated public environment and climate change fund, administering various funds specifically for environment and climate change since 2002, and supporting the implementation of multilateral environmental agreements. Although the GEF has focal areas, it supports activities covering both climate change mitigation and adaptation. Two climate change adaptation funds, established under the UNFCCC, are managed by the GEF: the Least Developed Countries Fund (LDCF), focusing on climate change adaptation (GEF, 2014c) and the Special Climate Change Fund (SCCF), focusing on technology transfer and adaptation. The Small Grants Programme (SGP) is also funded by GEF, supporting non-governmental and community-based organizations with grants of up to US$50 000.
The Least Developed Countries Fund (LDCF)The LDCF focuses on the creation and implementation of adequate National Adaptation Plans of Action (NAPAs), to support the National Adaptation Plans (NAP) process in Least Developed Countries (LDC).
13
2 . T h e g l o b a l c l i m a T e F i n a n c e l a n d s c a p e
T h e c l i m a T e F i n a n c e l a n d s c a p e
As of September 26, 2014, the LDCF had approved over US$863 million to implement 158 projects and programmes in 48 LDCs and 51 LDCs had accessed US$12.2 million in support of the preparation of their NAPAs (GEF, 2014b).
As of 31 August 2014, cumulative pledges to the LDCF amounted to US$915.16 million, of which US$872.63 million had been received (GEF, 2014b) However, the resources within the LDCF have not been sufficient to get many National Adaptation Plans of Action (NAPAs) projects implemented and GEF procedures have been challenging for some developing countries.
Special Climate Change Fund (SCCF)The Special Climate Change Fund (SCCF) was established primarily to fund adaptation, technology transfer and capacity-building projects in developing countries which are party to the UNFCCC. The purpose of the Fund is to implement measures that build resilience in sectors that are vulnerable to the impacts of climate change. As of 31 August 2014, US$333.75 million of the US$347.71 million pledged has been received to support both long- and short-term projects covering a range of activities, including water resource and land management, agriculture, health, infrastructure, and ecosystems and coastal zone management (GEF, 2014b)(GEF, 2014d). Projects should focus on long-term planned responses to climate change, as well as strategies and policies rather than short-term, reactive activities. The SCCF should act as a catalyst to leverage additional resources from other sources (FAO, 2009).
As at September 26, 2014, a total of 76 countries have accessed the SCCF for some 67 projects (GEF, 2014b). Under the two active funding windows of the SCCF, the Adaptation window (SCCF-A) and the Technology Transfer window (SCCF-B), 57 projects to the value of US$240.99 million under the SCCF-A and 11 projects to the value of US$55.48 million under the SCCF-B have been approved (GEF, 2014b).
The Adaptation Fund (AF)The AF falls under the Kyoto Protocol and is financed with a share of the proceeds from Clean Development Mechanism (CDM) project activities, as well as through voluntary pledges by donor governments. However it has limited funds and is likely to be overtaken by the Green Climate Fund (GCF). The current low price of carbon is of concern as it has an impact on the potential ability of the AF to generate revenues from the sale of Certified Emission Reduction (CER) units. Some countries, such as the UK, have made bilateral donations, but once the GCF becomes operational it is expected to be the focus of the multilateral global funding efforts.
The AF Board offers two avenues to access its resources. Eligible developing countries can access funds through a Multilateral (or Regional) Implementing Entity (MIE), or through a nominated domestic institution that operates as the National Implementing Entity (NIE). All entities, whether national, regional or multilateral, have to meet the fiduciary and sound management standards set by the Adaptation Fund Board (AFB).
Direct access is the core innovative feature of the AF. The AF was the first international fund to implement direct access in the climate finance landscape. So far 17 National, four Regional and 11 Multilateral Implementing Entities have been accredited with authorization to receive money from the AF. Only three years after the first call for proposals, the AF has approved 30 adaptation projects, worth an estimated allocation of US$200 million.
14
2 . T h e g l o b a l c l i m a T e F i n a n c e l a n d s c a p e
T h e c l i m a T e F i n a n c e l a n d s c a p e
The AF’s total funding revenue for 2013-2020 (at current market prices of US$0.16 per ton or per CER), is forecast to be only US$8 million. Budget constraints pose a significant challenge to the Fund, forcing eight approved projects submitted by multilateral agencies to be halted. The AF has received strong support from the international community since the recent COP 19 in November 2013, with commitments of US$72.5 million in funding from seven European governments, bringing the total raised in its major fundraising push to US$104.3 million. This increase in donor commitments has partly alleviated the pipeline issues, enabling the Fund to finance five of the eight projects proposed by MIEs (Adaptation Fund, 2013).
Climate Investment Funds (CIFs)The Climate Investment Funds (CIFs) consist of four funding windows to help developing countries pilot low emissions and climate-resilient development. With CIF support, 48 developing countries are piloting transformations in clean technology, sustainable management of forests, increased energy access through renewable energy, and climate-resilient development. The CIFs are the Clean Technology Fund (as of September 30, 2014, US$6.09 billion indicative allocation to 134 projects and programmes in total (Climate Investment Funds, 2014b)); and three further funds which fall within the Strategic Climate Fund (US$2.49 billion pledged as of the end of 2013 (Climate Investment Funds, 2014a)); the Forest Investment Program; the Pilot Program for Climate Resilience (PPCR) and the Scaling-Up Renewable Energy Program (SREP). CIFs provide grants, concessional loans and risk mitigation instruments (CIF, 2014a). These are disbursed through Multilateral Development Banks (MDBs), notably the World Bank, as this is a World Bank Group initiative.
Fast Start Finance (FSF) FSF arose from the Copenhagen Accord of the UNFCCC as a predecessor to the GCF. It focused on short-term financing (US$30 billion fast track 2010-2012) as opposed to the medium-term finance requirements (US$100 billion annually by 2020). Funds were supplemented by a significant contribution from Japan, as well as from the EU. However, allocations were usually not “new and additional” as there had been rebranding – for example, some PPCR contributions had been redefined as FSF funds. In fact, 80 per cent of FSF was reported as official development assistance (ODA), and not all funding was “new and additional” (Nakhooda and others, 2013). There was no direct access to FSF funds, nor were countries consulted about donor decisions on FSF. FSF was closed at the end of 2012, and the intention was that long-term funding would then come under the GCF. As the GCF was not yet operational at time of the Warsaw COP in November 2013, several countries have made new commitments to other existing funds. Germany has made commitments to the AF. The UK has allocated new funding in conjunction with the US and Norway to sustainable forest landscapes, for example REDD+ and has enhanced its own funding mechanism, the International Climate Fund. Japan has made a further commitment of concessional and non-concessional loans.
Reducing Emissions from Deforestation and Forest Degradation (REDD+) fundsREDD+ funds are an important, yet distinct area of funding. REDD+ is a mitigation effort that incentivizes a break from the historic trend of increasing deforestation rates. REDD (as it was previously known) is an effort to create a financial value for the carbon stored in forests, offering incentives for developing countries to reduce emissions from forested lands and invest in low-carbon paths to sustainable development. “REDD+” goes beyond deforestation and forest degradation, and includes the role of conservation, sustainable management of forests and enhancement of forest carbon stocks (UN-REDD, 2014). Land use changes, principally deforestation, are responsible for 12-20 per cent of global GHG emissions (Caravani and others, 2013). The funds primarily supporting REDD+ are the Amazon Fund, the Forest Carbon Partnership Facility (FCPF), the
15
2 . T h e g l o b a l c l i m a T e F i n a n c e l a n d s c a p e
T h e c l i m a T e F i n a n c e l a n d s c a p e
Forest Investment Program (FIP), UN-REDD and the Congo Basin Forest Fund. Most relevant for the SSA region are UN-REDD, the Congo Basin Forest Fund and the FCPF. UN-REDD has disbursed US$186.18 million as of 4 October 2013, which represents 75 per cent of its approved funding of US$248.84 million (Climate Funds Update, 2014a). Disbursement rates for the remainder of REDD+ funds appear quite low, and both the Carbon Fund component of the FCPF (FCPF-CF) and the FIP appear to have disbursed less than 1 per cent of available funding.
The Green Climate Fund (GCF)The establishment of the Green Climate Fund (GCF) signals an important new contribution to the international climate finance architecture. The GCF is designed to pursue a country-driven approach and to strengthen engagement through the effective involvement of the relevant institutions and stakeholders at the country level (Green Climate Fund, 2012a). The GCF aims to shift countries toward low-emission and climate-resilient development paths by providing support to developing countries to limit or reduce their GHG emissions and to adapt to the impacts of climate change (Green Climate Fund, 2012a). Because the GCF seeks to allow flexibility in access modalities, as well as to encourage a country-driven approach, there is the expectation that this new fund will address the shortcomings of previous funds and will harmonise its access and delivery modalities.
The Fund will play a key role in channeling additional, adequate and predictable financial resources to developing countries and will catalyse public and private climate finance at international and national levels (Green Climate Fund, 2012b). The GCF is to be a continuous learning institution guided by processes for monitoring and evaluation. The COP’s approval of the GCF’s governing instrument solidifies the enhanced role designated national authorities (DNAs) will play in the future approval of funding proposals. The use of DNAs will ensure the coherence of approved programmes with national strategies and plans, in response to pressures from developing countries for institutional arrangements and mechanisms that provide greater legitimacy and enable direct access.
A growing number of bilateral and multilateral actors in climate finance are seeking opportunities to invest in detailed programmes that will deliver clear benefits. There is particular focus on investing in “flagship programmes” that demonstrate strong potential to deliver transformative change and enhance ongoing efforts to improve underlying policy and regulatory frameworks via climate change strategy development programmes (Green Climate Fund, 2012b). Overall, one distinguishing feature of the GCF is that it will help deliver large-scale programmatic change.
At the time of writing, the GCF has yet to receive funding for disbursal (despite start-up funding provided by Germany, Denmark and South Korea) and is struggling to raise additional funds. Concerns remain over possible sources of this necessary additional funding. While funds may be sourced from developed countries’ public funds, the private sector has been flagged as a potential source of substantial finance. However, there are concerns over whether private sector contributions may be used by wealthy countries to limit their public contributions (Rowling, 2014). While the AF experience will inform the standards and approaches that the GCF adopts, there are likely to be some differences between the two funding mechanisms. The GCF is set to include a more all-encompassing approach to environmental and social safeguards than those reflected in the fiduciary standards of the AF (Green Climate Fund, 2012b).
16
2 . T h e g l o b a l c l i m a T e F i n a n c e l a n d s c a p e
T h e c l i m a T e F i n a n c e l a n d s c a p e
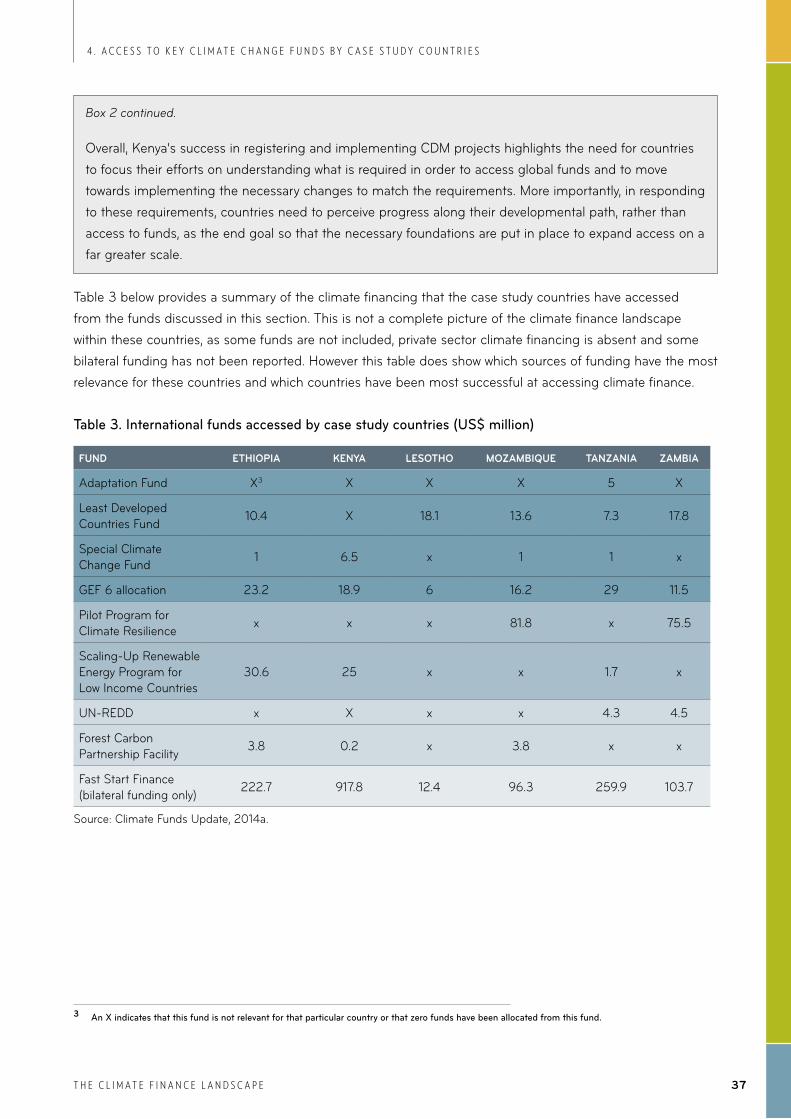
The Clean Development Mechanism (CDM) CDM is not typically seen as a fund, but it is an important source of climate financing and therefore is included in this chapter. The CDM was established under the Kyoto Protocol to assist developed countries in fulfilling their commitment to reduce emissions through the trading of Certified Emission Reduction units (CERs), otherwise known as carbon credits. The CDM provides developing countries with a source of carbon finance for sustainable development and investment in clean technologies. Projects are financed on the basis that carbon emissions can be reduced and CER units produced. These CER units are then sold to private/public investors to ensure compliance with their GHG emission reduction commitments. (UNCCD, 2013)
17
3 . a F r i c a : T h e c l i m a T e F i n a n c e l a n d s c a p e
T h e c l i m a T e F i n a n c e l a n d s c a p e
Africa’s ability to adapt to the adverse effects of climate change, as well as to contribute towards the mitigation of GHGs depends on access to and use of climate finance. In the absence of adequate funds for adaptation and mitigation, the impacts of climate change are likely to have devastating consequences on Africa, given its high levels of poverty and low levels of resilience. Despite the vulnerability of the continent to climate change, the international support provided and disbursements relative to adaptation needs are inadequate, with the bulk of climate finance targeting mitigation initiatives (Hellmuth, Moorhead and Thmpson, 2007). Estimated adaptation costs in Africa will be in the range of US$20-30 billion per annum over the next 10 to 20 years (AfDB, 2011), with additional financing required for mitigation actions. Over the past decade, a total of US$1.7 billion has been approved for programmes throughout the region (Nakhooda and others, 2013). Although climate finance is increasing with the proliferation of funds, the fact remains that Africa is not accessing sufficient climate finance. While this could be attributed to the fact that there is insufficient funding available for climate change globally, it may also be a symptom of the complexity of the climate finance architecture.
Developing countries have experienced difficulty in applying to various global funds because of the complexity of the application procedures. Identification of specific funding mechanisms relevant to projects and the subsequent packaging of those projects into specific (and bankable) applications is another significant problem (UNCCD, 2013). Often, project application and implementation processes are not sufficiently comprehensive, coordinated or strategic. Without proper governance systems in place, money may be lost to maladministration and inadequate delivery.
Another key concern is the lack of predictability of climate finance provided by developed countries to developing countries. As climate change agendas advance, countries in Africa are beginning to integrate climate change strategies into budget expenditure planning processes, and have called for additional sources of funding in order to plan adequately for the long term, aligning their national budgets with available funding. When initiatives are not sustained over time and are not geared towards long-term programmes, countries find it difficult to sustain projects, which may result in the ad hoc use of funding.
To ensure transparency and build mutual confidence among parties on the delivery of the financial and associated support commitments, the development of monitoring, reporting and verification (MRV) on climate finance flows is vital. Currently there is no accurate assessment of the amount of North-South climate finance flowing into developing countries. While multilateral funding can be tracked with relative ease, bilateral flows, which remain a significant source of climate finance in Africa, remain difficult to assess (UNFCCC, 2013). Accurate and consistent MRV practices are necessary to improve the efficiency, success and equity of climate finance disbursement and implementation processes.
3. Africa: The Climate Finance Landscape
18
3 . a F r i c a : T h e c l i m a T e F i n a n c e l a n d s c a p e
T h e c l i m a T e F i n a n c e l a n d s c a p e
3.1 adaptation vs. mitigationAccording to the UNEP, Africa has been classed as a “vulnerability hotspot” for climatic impacts, facing huge financial challenges in adapting to climatic impacts should governments fail to close the emissions-gap needed to prevent global temperatures rising above 2°C (UNEP, AMCEN and CA, 2013).
Expected impacts across the continent include:n Increases in frequency of extreme heat eventsn Projected increases in sea levels along the African coastn Ecosystem shifting, with a potential resultant loss of biodiversity and speciesn Reduction in crop production across most of the continent n Impaired livestock production due to increased heat stress and disease and decreased quality and availability
of feed and water inputsn Damage to fisheries due to higher water temperatures, levels of evaporation and decreased nutrient contentn Higher rates of malnourishment and vector- and water-borne diseases, affecting human health
An analysis of the effects of extreme weather change, rises in sea level, and losses in agricultural productivity on low-income countries (those with annual income of less than US$2,500 per capita at purchasing power parity), finds that, of the top 25 states vulnerable to these particular impacts, 19 are from Sub-Saharan Africa (SSA) (Wheeler, 2011). The ability of African countries to adapt to, and deal with, the expected fallout of climatic impacts on socio-economic activities is expected to be severely challenged by the magnitude and rapidity of the predicted impacts. It is very unlikely that human innovation can keep pace with the scale of such impacts, particularly in SSA developing countries that lack financial capacity and technological capabilities.
Of the estimated global public climate funding flows in 2012, only US$1-4.4 billion went to adaptation (or approximately 27 per cent of public climate finance flows), while an estimated US$14.9-18.2 billion went to mitigation activities (CPI, 2012). In 2007 the UNFCCC predicted that the mitigation measures needed to return global GHG emissions in 2030 to current levels would equate to investment and financial flows of approximately US$200-210 billion, while adaptation funding flows would need to amount to several tens of billions (De Boer, 2007). The Intergovernmental Panel on Climate Change (IPCC) has estimated annual mitigation costs of 0.2-3.5 per cent of global GDP, or between US$78 and US$1,141 billion per annum, while the IEA has estimated the costs at US$300 billion per annum (Spratt and Ashford, 2011). While the estimates vary, expected mitigation costs are large; however, given the predicted warming, failure to act will result in the acceleration of irreversible and catastrophic climatic impacts, leading to economic costs of between 5 per and 20 per cent of global GDP (Stern, 2007).
The various climate change scenarios add layers of complexity to estimating adaptation costs; however, in order to achieve the hoped-for limitation of a 2°C warming scenario, the World Bank (World Bank, 2010) predicts these costs to be approximately US$24 billion per annum for SSA by 2040, with the highest costs expected to be in the water supply, coastal zone management and protection, infrastructure and agriculture sectors. The focus will also be on constraining sea-level rise impacts by the 2070s (as the sea will continue to rise regardless of global temperature stabilization) (UNEP, AMCEN and CA, 2013). Broadly speaking, the CDKN has estimated that costs of adaptation in LDCs will equate to 13 per cent of GDP (adjusted for
19
3 . a F r i c a : T h e c l i m a T e F i n a n c e l a n d s c a p e
T h e c l i m a T e F i n a n c e l a n d s c a p e
purchasing power parity) by 2030 (Ellis, Cambray and Lemma, 2013). Despite the different predictions for the level of funding needed, what remains clear is that large financial commitments are essential in adaptation mitigation activities in order to propel development trajectories towards the least dangerous climate scenario possible.
Africa’s experience with accessing climate financing highlights the large imbalance that exists between funding for adaptation and mitigation activities. While there is some finance available for adaptation, it has not been sufficient to meet Africa’s identified need for adaptation efforts. From an African perspective, financing is not regionally balanced according to need, nor is there an adequate balance between mitigation and adaptation within the continent. The UN Convention to Combat Desertification (UNCCD) states that thus far, mitigation-focused finance constitutes over 50 per cent of funds while adaptation constitutes around 33 per cent (UNCCD, 2013). The Fast Start Finance (FSF) initiative was supposed to redress this imbalance but has experienced challenges in doing so. While adaptation received US$5.7 billion of the FSF commitment, mitigation (including initiatives for REDD+) received US$22.6 billion, more than 70 per cent of the total funding.
Interestingly, the funding under the UNFCCC agreements, notably the LDCF and GEF funds, are also very important within the African context. The LDCF financing is far more relevant than the AF for adaptation activities but this Fund, which is supposed to support 34 LDC countries in Africa, has less allocated to it than the CTF (for which only two SSA countries have qualified). This further demonstrates that the distribution of financing is focused towards mitigation activities, rather than the more pressing adaptation investments required. It remains to be seen if the GCF is able to better balance funding between adaptation and mitigation investments within the African context and additionally simplify and consolidate an already complex and disparate climate finance environment.
3.2 Bilateral initiatives supporting climate activities in africaIn contrast to multilateral funds, generally financed by a group of developed countries, bilateral finance institutions or initiatives (BFIs) are often financed by an individual country with the aim of providing aid, contributing technical support, or investing in selected development activities in developing or emerging countries. BFIs may include the creation of a fund to be used as the financing mechanism, and are generally administered by an agency from the donor country.
While there has been a lot of attention paid recently to the development of green funds to catalyse international climate finance, the reality is that most public climate finance is currently provided by bilateral institutions rather than multilateral institutions (Climate Funds Update, 2012). The proliferation of bilateral climate finance opportunities adds to the challenge of capturing and coordinating climate change activities over and above those associated with the requirements and policies of multilateral funds. There are several bilateral climate finance initiatives supporting climate projects in Africa. Given the scope of this report, the focus will be on activities and implementation in an African context.
20
3 . a F r i c a : T h e c l i m a T e F i n a n c e l a n d s c a p e
T h e c l i m a T e F i n a n c e l a n d s c a p e
BFIs have some similarities with the activities of multilateral development banks (MDBs); however, there are important differences. BFIs are often financed by a single donor or a group of donors and the beneficiaries or clients of these institutions are not direct shareholders. This is in contrast to MDBs to which resources are entrusted to be distributed at the discretion of the MDB according to their own policies and guidelines, and who may be responsible for implementation. BFIs are usually a result of the foreign policies of donor countries and are thus bound to activities predefined by the contributor’s agenda.
The strength of bilateral funds is that they can be accessed and disbursed efficiently in comparison to funds emanating from multilateral institutions which need carefully to navigate governance policies such as democracy, and applicability ranking. Bilateral funds have proved key to testing the innovative distribution of finances. If proved successful, these innovations can then be replicated by multilateral funds. However, developing countries have pointed out that while most of the bilateral projects are admittedly grant-based and donor-driven, many do not match the precise needs of recipients’ central government, community-based organisations or local requirements.
The data on bilateral funding are often incomplete and difficult to separate from other sources of climate finance, however a report produced by UNEP in 2010 attempts to analyse the flows of bilateral funding to developing countries for a selection of BFIs. So while these data do not provide a complete picture, they should create an indicative image of the bilateral flows to Africa. SSA countries accounted for 11.5 per cent of overall bilateral spending in 2009 (US$1.47 billion of US$12.82 billion). Of this SSA share, approximately half was allocated to mitigation activities (49 per cent) and the other half to adaptation activities (51 per cent). SSA accounted for a larger percentage of adaptation funding in comparison to mitigation funding than any other region. Overall the split was 69 per cent for mitigation activities versus 31 per cent for adaptation. This funding is financed primarily through concessional loans (65.3 per cent), followed by non-concessional loans (22.2 per cent), grants (6.5 per cent) and other (6 per cent) (UNEP, 2010).
3.3 Geographical and sectoral distribution of climate funds in africaThe expenditure patterns of the key multilateral funds in Africa reveal some trends in their sectoral distribution and regional focus. While data are not available in the same level of detail across all the funds, where possible, important trends or focuses are highlighted. The purpose of this section is to illustrate which are the most important sources of climate finance in Africa, or more specifically SSA, and what the focus of these funds is.
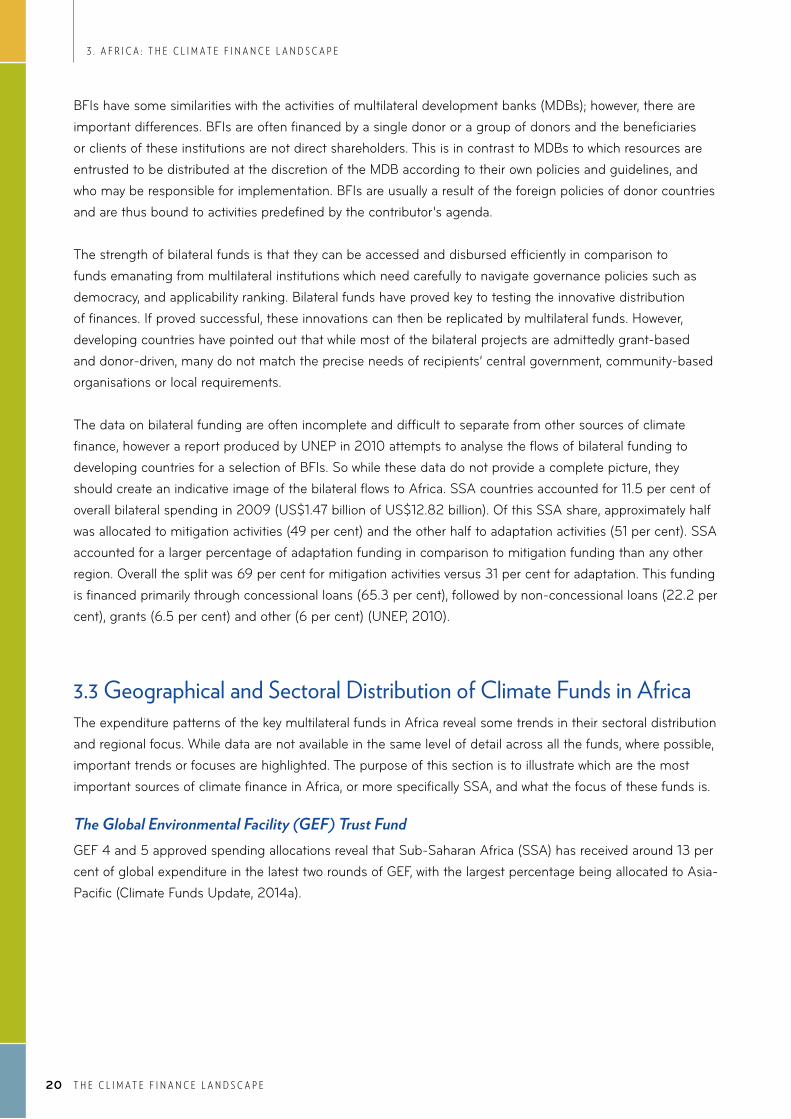
The Global Environmental Facility (GEF) Trust FundGEF 4 and 5 approved spending allocations reveal that Sub-Saharan Africa (SSA) has received around 13 per cent of global expenditure in the latest two rounds of GEF, with the largest percentage being allocated to Asia-Pacific (Climate Funds Update, 2014a).
21
3 . a F r i c a : T h e c l i m a T e F i n a n c e l a n d s c a p e
T h e c l i m a T e F i n a n c e l a n d s c a p e
Figure 1: percentage of approved geF spending per region
39%
17% 5%
17%
5%
13%
4% Asia and Pacific
Europe and Central Asia
Global
Latin America and the Caribbean Middle East and North Africa Sub-Saharan Africa
Unknown
Source: Climate Funds Update, 2014a.
Of the approximately US$220 million approved GEF funding for SSA, over 90 per cent was focused on mitigation activities solely. This is more or less in line with the overall global focus of the Fund on mitigation versus adaptation investments. The data illustrate how financing from multilateral funds such as GEF have been more successfully accessed in Asia than Africa and that the focus has predominantly been on mitigation investments.
The Least Developed Countries Fund (LDCF) and Special Climate Change Fund (SCCF)Seventy one percent of LDCs are situated in Africa and as of October 2013, Africa had been assigned 69 per cent of LDCF financing. Additionally, the largest shares of SCCF financing had also been directed towards Africa and Asia, with 29 per cent and 28 per cent of total funding approvals distributed to the two regions respectively.
With regard to the sectoral distribution of the different GEF funds, some 32 per cent of LDCF resources have been directed towards enhancing the resilience of agricultural production and food systems. Coastal zone management, water resources management and climate information services are other priority sectors for LDCF financing, each having received about a sixth of the approved resources. The largest share of SCCF financing had been directed towards enhancing the resilience of water resources management and agriculture, with 26 per cent of approved resources per sector. Coastal zone management is another priority sector for SCCF financing, receiving 14 per cent of the resources approved. A further 9 per cent of the SCCF resources support cross-cutting projects, primarily under the Program for Technology Transfer (GEF, 2013c).
22
3 . a F r i c a : T h e c l i m a T e F i n a n c e l a n d s c a p e
T h e c l i m a T e F i n a n c e l a n d s c a p e
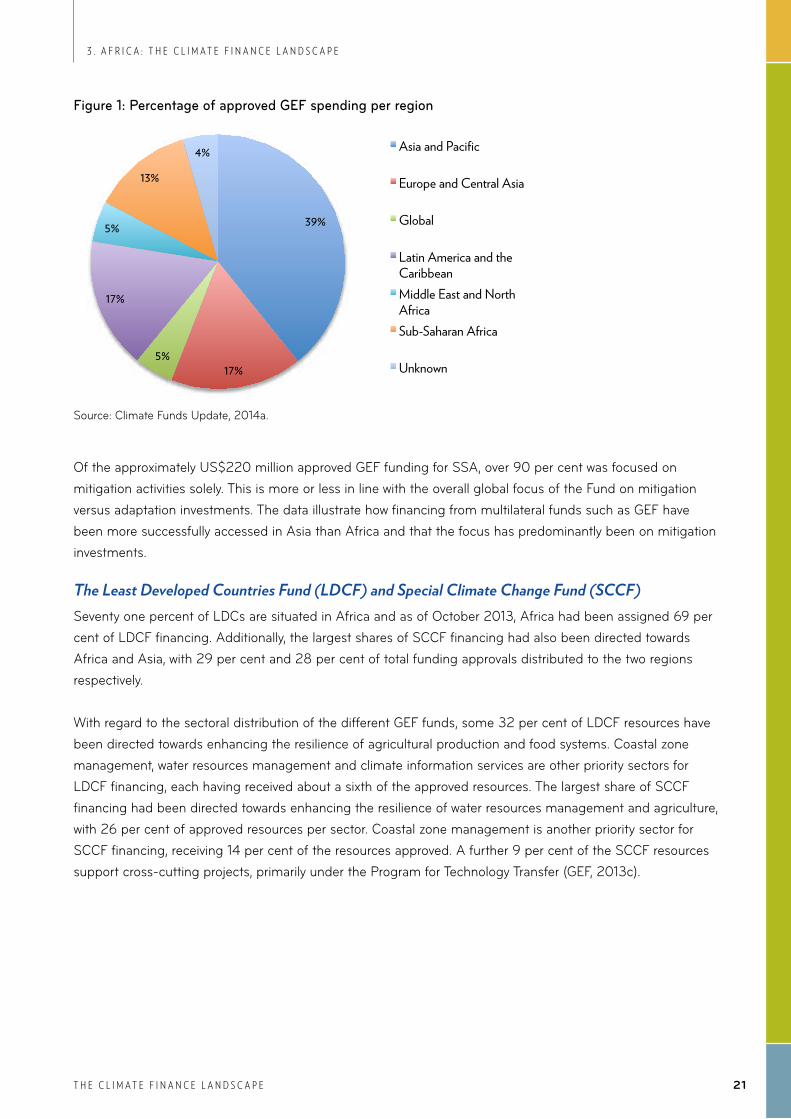
The Adaptation Fund (AF)As of September 2014, Africa had thus far been allocated 30 per cent of the total AF funds made available since the start of the Fund in 2011 (Figure 2) (Adaptation Fund, 2014).
Figure 2: Adaptation funding per region
Source: Adaptation Fund, 2014.
In terms of the distribution of funds per sector within Africa, the AF has focused on coastal management (32 per cent), rural development (24 per cent), food security (21 per cent), agriculture (14 per cent, and multi-sectoral (9 per cent) (Figure 3) (Adaptation Fund, 2014).
Figure 3: African AF allocation by sector
Source: Adaptation Fund, 2014.
Problems have arisen with the AF, as it works through Implementing Entities (IEs), and many countries have been unable to meet the criteria necessary to get accreditation for their national institutions, mostly because of questions about fiduciary standards (see Box 1). In Africa, only Benin, Kenya, Namibia, Senegal, Rwanda and South Africa have an NIE approved by the Fund. There are two regionally approved IEs in Africa: the West Africa Development Bank in Togo and the Observatoire du Sahel/ Sahara in Tunisia.
30%
35% 2%
32% Africa
Asia-Pacific
Eastern Europe
Latin America and the Caribbean
14%
21%
32%
24%
9%
Agriculture
Food security
Coastal Management
Rural development
Multi-sector
23
3 . a F r i c a : T h e c l i m a T e F i n a n c e l a n d s c a p e
T h e c l i m a T e F i n a n c e l a n d s c a p e
box 1. South Africa’s experience with the Adaptation Fund board
In South Africa, the South African National Biodiversity Institute (SANBI) reports that the most significant problem with the AF was frequently changing rules and requirements, which is challenging for NIEs and the project proposal process. As an example, a project proposal could originally be completed in 10 pages, whereas now the required information would cover approximately 40 pages. Included in these more extensive requirements is the need to justify the total cost of adaptation, for which there is limited data availability. There is also the need to provide strong evidence that the activity is not business as usual, that the project is a climate change project as opposed to a development project, and that the project is the most appropriate response to the identified problem. Finally, the project must demonstrate the ability to provide concrete evidence of implementation evidence on the ground (Hedger, 2012).
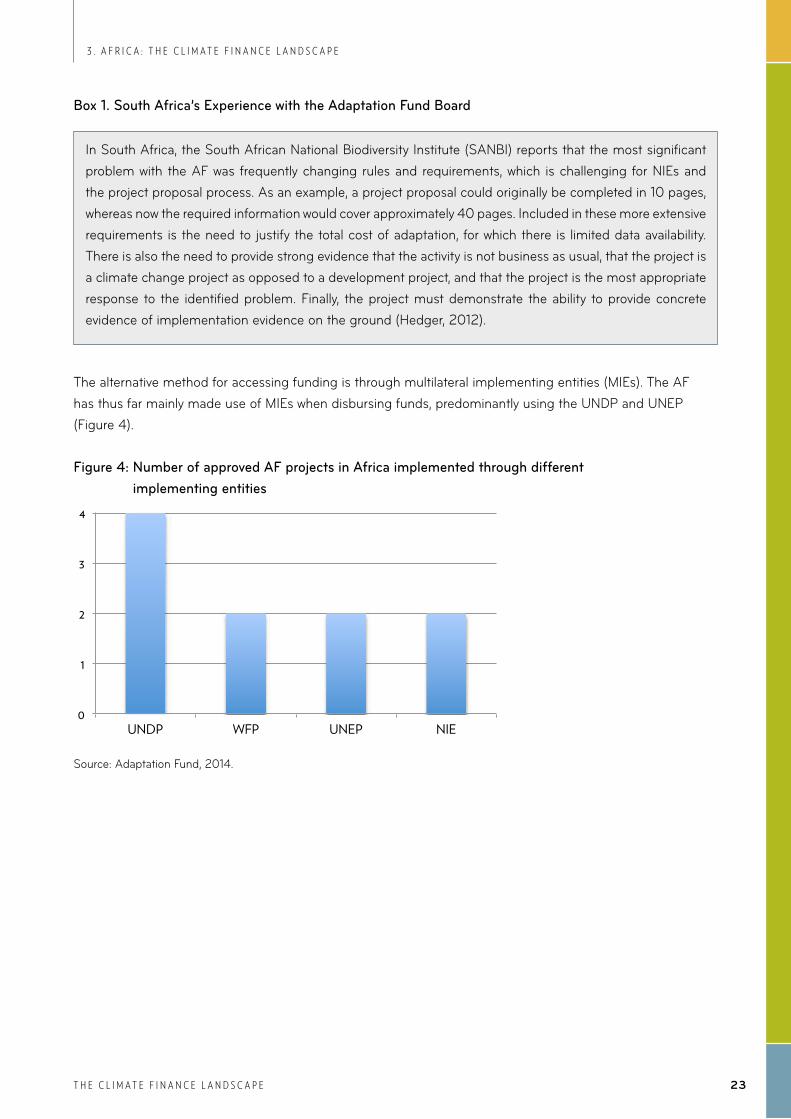
The alternative method for accessing funding is through multilateral implementing entities (MIEs). The AF has thus far mainly made use of MIEs when disbursing funds, predominantly using the UNDP and UNEP (Figure 4).
Figure 4: Number of approved AF projects in Africa implemented through different implementing entities
Source: Adaptation Fund, 2014.
0
1
2
3
4
UNDP WFP UNEP NIE
24
3 . a F r i c a : T h e c l i m a T e F i n a n c e l a n d s c a p e
T h e c l i m a T e F i n a n c e l a n d s c a p e
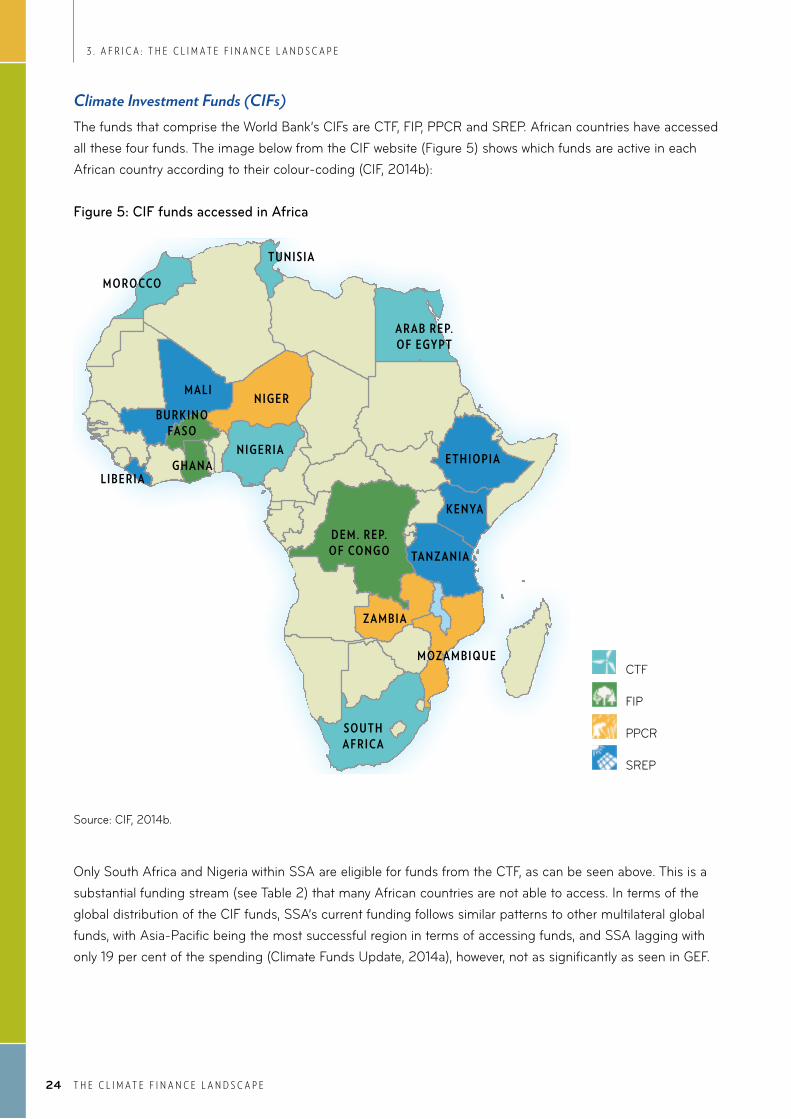
Climate Investment Funds (CIFs)The funds that comprise the World Bank’s CIFs are CTF, FIP, PPCR and SREP. African countries have accessed all these four funds. The image below from the CIF website (Figure 5) shows which funds are active in each African country according to their colour-coding (CIF, 2014b):
Figure 5: ciF funds accessed in Africa
Source: CIF, 2014b.
Only South Africa and Nigeria within SSA are eligible for funds from the CTF, as can be seen above. This is a substantial funding stream (see Table 2) that many African countries are not able to access. In terms of the global distribution of the CIF funds, SSA’s current funding follows similar patterns to other multilateral global funds, with Asia-Pacific being the most successful region in terms of accessing funds, and SSA lagging with only 19 per cent of the spending (Climate Funds Update, 2014a), however, not as significantly as seen in GEF.
CTF
FIP
PPCR
SREP
m o Ro CCo
m a l iN i g e R
N i g e R i ae t h i o P i a
k e N ya
ta N z a N i a
z a m b i a
m oz a m b i q U e
D e m . R e P. o F Co N g o
so U t h a F R i C a
g h a N al i b e R i a
b U R k i N o Fa so
t U N i s i a
a R a b R e P. o F egy Pt
25
3 . a F r i c a : T h e c l i m a T e F i n a n c e l a n d s c a p e
T h e c l i m a T e F i n a n c e l a n d s c a p e
Figure 6: ciF funds approved spending by region
33%
15% 22%
11%
19%
0%
Asia and Pacific
Europe and Central Asia
Latin America and the Caribbean Middle East and North Africa
Sub-Saharan Africa
Unknown
Source: Climate Funds Update, 2014a.
When broken down by fund, between 2008 and 2013 the CTF has provided the most funding in SSA with US$475 million, followed by PPCR (US$256 million), then FIP (US$100 million) and finally SREP (US$76 million). Of the CIF funds, only PPCR is focused on adaptation investments and it is encouraging to note that SSA has received a large proportion of the financing from this fund, having accessed approximately 33 per cent of the global allocation.
26
3 . a F r i c a : T h e c l i m a T e F i n a n c e l a n d s c a p e
T h e c l i m a T e F i n a n c e l a n d s c a p e
Fast Start Finance (FSF) An analysis of the funding reported under FSF reveals that SSA received less funding than Asia-Pacific and approximately the same as Latin America and the Caribbean (Figure 7). SSA funds were largely focused on mitigation activities (54 per cent). The contributor countries reported the data used for the graph below, so funding by region is bilateral and the funds directed towards the dedicated funds are allocated globally. The dedicated funds refer to the multilateral funds discussed elsewhere in this report, among others.
Figure 7: Amount of funding committed during 2010-2012 FSF contribution period, by recipient region and major objective
0"
2000"
4000"
6000"
8000"
10000"
12000"
14000"
[Ded
icated
"Fund
]"
Asia"an
d"Pacific
"
Europ
e"and
"Centr
al"As
ia"
La?n
"Ameri
ca"an
d"the
"Carib
bean
"
Middle"
East"
and"N
orth"A
frica"
Mul?ple
"
SubGS
ahara
n"Afric
a"
Unkn
own"
Million&USD
&
Unknown"
REDD+"
Mul?ple"
Mi?ga?on"
Adapta?on"
Source: Open Climate Network, 2013.
The top five countries in SSA by amount committed during the FSF period were:n Kenya (US$918 million)n Malawi (US$376 million)n South Africa (US$295 million)n Tanzania (US$260 million)n Ethiopia (US$223 million).
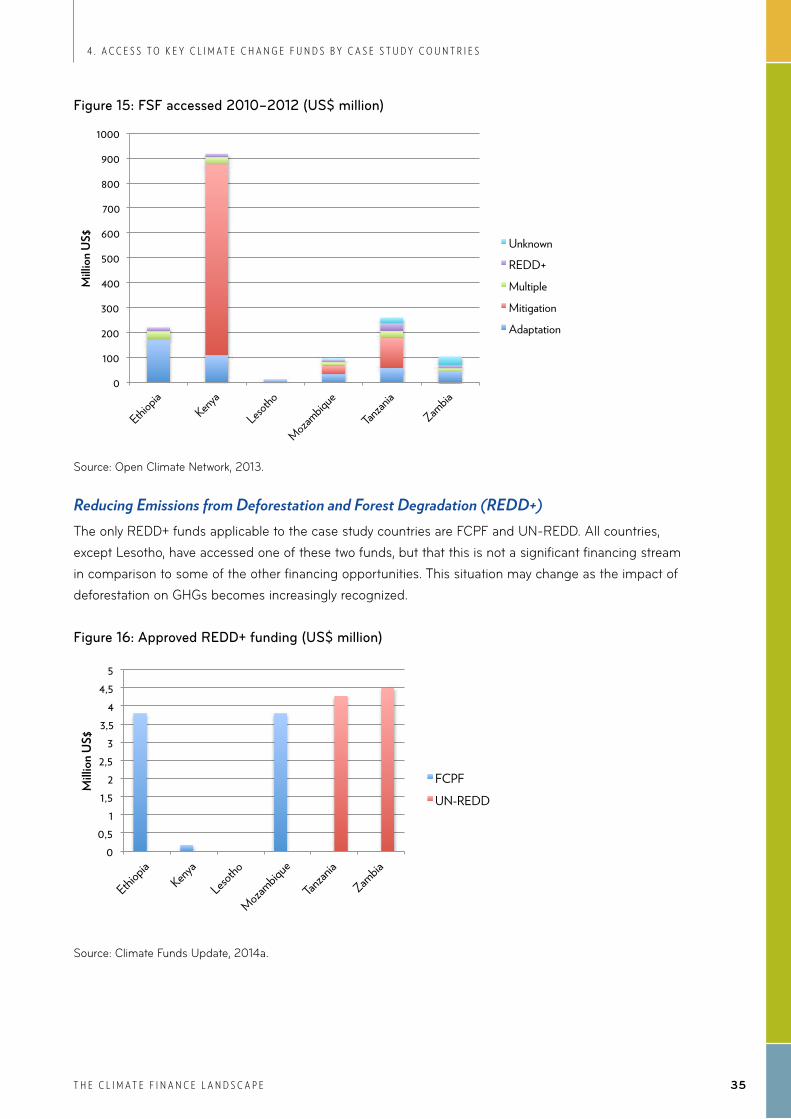
Reducing Emissions from Deforestation and Forest Degradation (REDD+)The REDD+ funds operating in SSA are by their very nature only applicable in certain countries (i.e. those countries that have significant forest cover). The SSA allocation of the relevant funds (UN-REDD, FCPF and the Congo Basin Forest Fund) is relatively high, with over 38 per cent of the total global allocation. Of this, a large proportion has been allocated to the Democratic Republic of Congo, mainly from the Congo Basin Fund (Climate Funds Update, 2014a).
27
3 . a F r i c a : T h e c l i m a T e F i n a n c e l a n d s c a p e
T h e c l i m a T e F i n a n c e l a n d s c a p e
The Green Climate Fund (GCF)The GCF has the potential to create a watershed in the flow of climate finance to Africa if it manages to scale-up its resources to meet the adaptation and mitigation needs. It is expected that the GCF will recognise the urgent requirements for adaptation in the region, and enhance adaptive capacities by encouraging direct access. African countries expect to benefit from the Fund with a 50:50 balance between adaptation and mitigation projects. Furthermore, the GCF will target the developing countries that are the most vulnerable to climate change impacts – a minimum of 50 per cent of the funds will be provided specifically for vulnerable developing countries, including LDCs, Small Island Developing States and African States (Green Climate Fund, 2014).
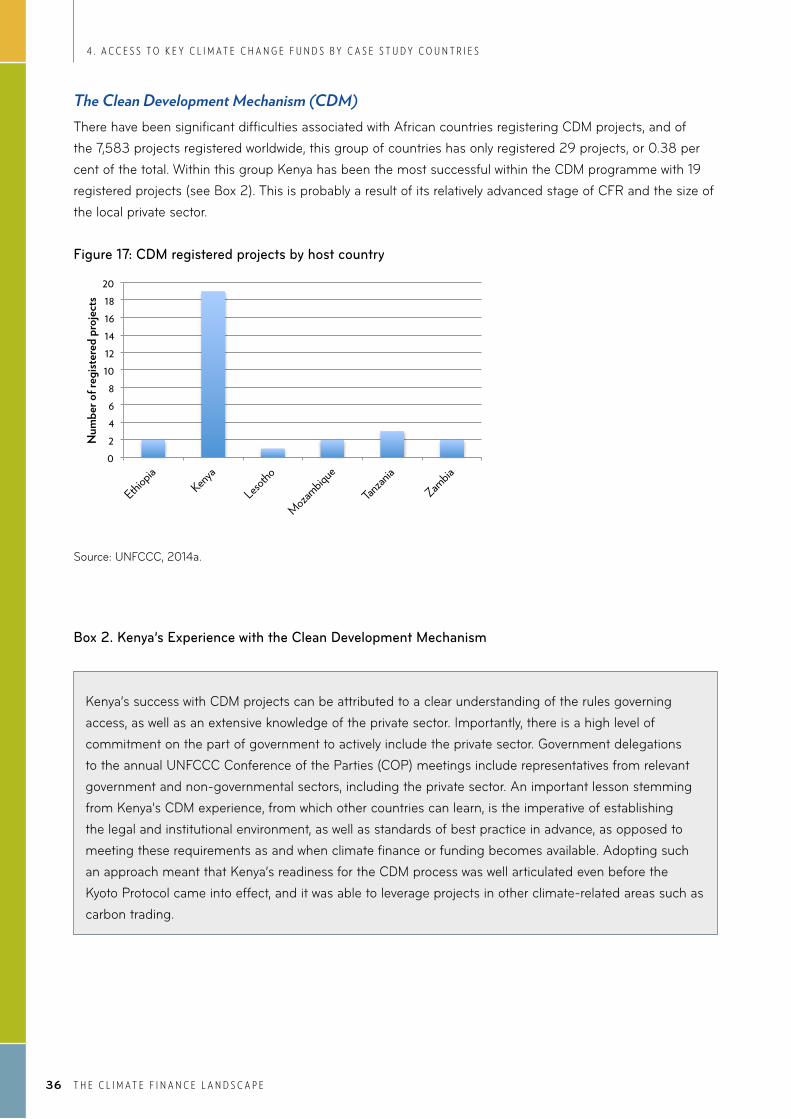
The Clean Development Mechanism (CDM)Africa’s share of CDM projects is very low. Of the 7,538 globally registered CDM projects as of 31 July 2014, Africa accounted for only 2.5 per cent (UNFCCC, 2014a) (Figure 8). Most of the projects that are registered in Africa are in South Africa, which is one of the few African countries to have issued CERs and thus to have carbon credits to sell (UNCCD, 2013). Africa’s low share of CDM transactions is due to a number of factors, largely related to the technical difficulties in accessing CDM, financial barriers, and the institutional capacity of the host countries.
Figure 8. cdm Registered projects by region
0.6%
12.8% 2.5%
84.1%
Economies in transition
Latin America & Carribean
Africa
Asia & Pacific
Source: UNFCCC, 2014a.
28
3 . a F r i c a : T h e c l i m a T e F i n a n c e l a n d s c a p e
T h e c l i m a T e F i n a n c e l a n d s c a p e
Updating Table 1 with the funds that have been approved for SSA reveals which sources of funding have the most relevance within the African climate finance landscape.
Table 2. Types of international Funds
Fund SSA AppRoved FundInG (uS$ MILLIon)
Adaptation Fund (AF) 58.6
Least Developed Countries Fund (LDCF) 419.7
Special Climate Change Fund (SCCF) 49.7
GEF Trust Funds 220.8
Pilot Program for Climate Resilience (PPCR) 256.1
Clean Technology Fund (CTF) 475.2
Scaling-Up Renewable Energy Program for Low Income Countries (SREP)
76.1
Global Energy Efficiency and Renewable Energy Fund (GEEREF) 27.0
Global Climate Change Alliance (GCCA) 180.4
UN-REDD 24.2
Forest Carbon Partnership Facility (FCPF) 34.7
UK’s International Climate Fund 79.8
Japan’s Fast Start Finance 865.3
Germany’s International Climate Initiative 107.5
Norway’s International Climate and Forests Initiative 36.5
Source: Climate Funds Update, 2014a.
The bilateral funding through Japan’s Fast Start Finance was extremely significant (note that the amount indicated under Japan’s Fast Start Finance does not include all the funding from the FSF countries), which illustrates how funding is skewed towards bilateral arrangements. There is also substantial financing from the funds managed by the World Bank (PPCR, CTF and SREP), most notably the CTF. The CTF is only applicable to South Africa and Nigeria within SSA (see Figure 6) and therefore this important financing stream is focused on only two countries that have relatively large economies. This corroborates the concern that mitigation climate financing will follow existing investment trends and focus on those countries that already have attractive investment profiles.
29T h e c l i m a T e F i n a n c e l a n d s c a p e
4. Access to key climate change funds by case study countries
29
4 . a c c e s s T o k e y c l i m a T e c h a n g e F u n d s b y c a s e s T u d y c o u n T r i e s
T h e c l i m a T e F i n a n c e l a n d s c a p e
The ability of the countries included in this study to access funds proved to be an important indicator of their climate finance readiness. Ethiopia, Kenya, Lesotho, Mozambique, Tanzania and Zambia were evaluated on their ability to access the various funds and sources of financing available. Their relative success (or failure) in accessing multilateral and bilateral sources of funding was indicative of their national capacity to develop programmatic climate responses and their ability to meet global institutional fiduciary standards, in themselves measures of climate finance absorptive capacity.
As discussed, various sources of multilateral and bilateral climate funds are available. Some of the multilateral funds work on an allocations basis (e.g. the GEF) and it is up to each country to access their allocations and use these to leverage additional funds. In addition, countries should be in a position to direct and manage bilateral resources.
This section uses data available for the countries in this study to evaluate their ability to access financing from the funds listed in the previous section.
30
4 . a c c e s s T o k e y c l i m a T e c h a n g e F u n d s b y c a s e s T u d y c o u n T r i e s
T h e c l i m a T e F i n a n c e l a n d s c a p e
The Global Environmental Facility (GEF) Trust FundFigure 9 shows the funds accessed against those allocated in the most recent rounds of GEF funding (GEF 4 and 5). The chart highlights the fact that Lesotho struggled to use its allocation in GEF 4, yet accessed more than its total allocation in GEF 5, indicating an increased capacity in the country for accessing GEF funds. Ethiopia, Mozambique and Zambia were moderately successful in accessing GEF 4 and all show a significant improvement in their access rates in GEF 5 funds. Kenya and Tanzania continued their high access rates between GEF 4 and GEF 5 of over 95 per cent.
Figure 9. geF 4 and 5: accessed funds as a percentage of allocated funds (as of october 2014)
Source: GEF, 2014a.
Successfully accessing climate funds helps increase allocations in future rounds of funding in addition to enhancing programmatic climate resilience-building. Allocations under GEF 5 were based on a methodology that takes the country’s need into account, the potential impact that the funds may have on the country, and the country’s potential to achieve global environmental benefits, as well as the country’s performance in its previous allocation. This partly explains why some countries have seen large increases in their allocations in GEF 5 (see Figure 10), while other countries showed modestly increasing or declining allocations after GEF 4. This has been raised as a source of frustration by countries that experience challenges in accessing GEF.
0%
20%
40%
60%
80%
100%
120%
GEF 4 GEF 5
31
4 . a c c e s s T o k e y c l i m a T e c h a n g e F u n d s b y c a s e s T u d y c o u n T r i e s
T h e c l i m a T e F i n a n c e l a n d s c a p e
Figure 10. differences between geF 4 & 5 allocations
51% 61%
-39%
29%
51%
31%
-40% -30% -20% -10%
0% 10% 20% 30% 40% 50% 60% 70%
Ethiopia Kenya Lesotho Mozambique Tanzania Zambia
Source: GEF, 2014a.
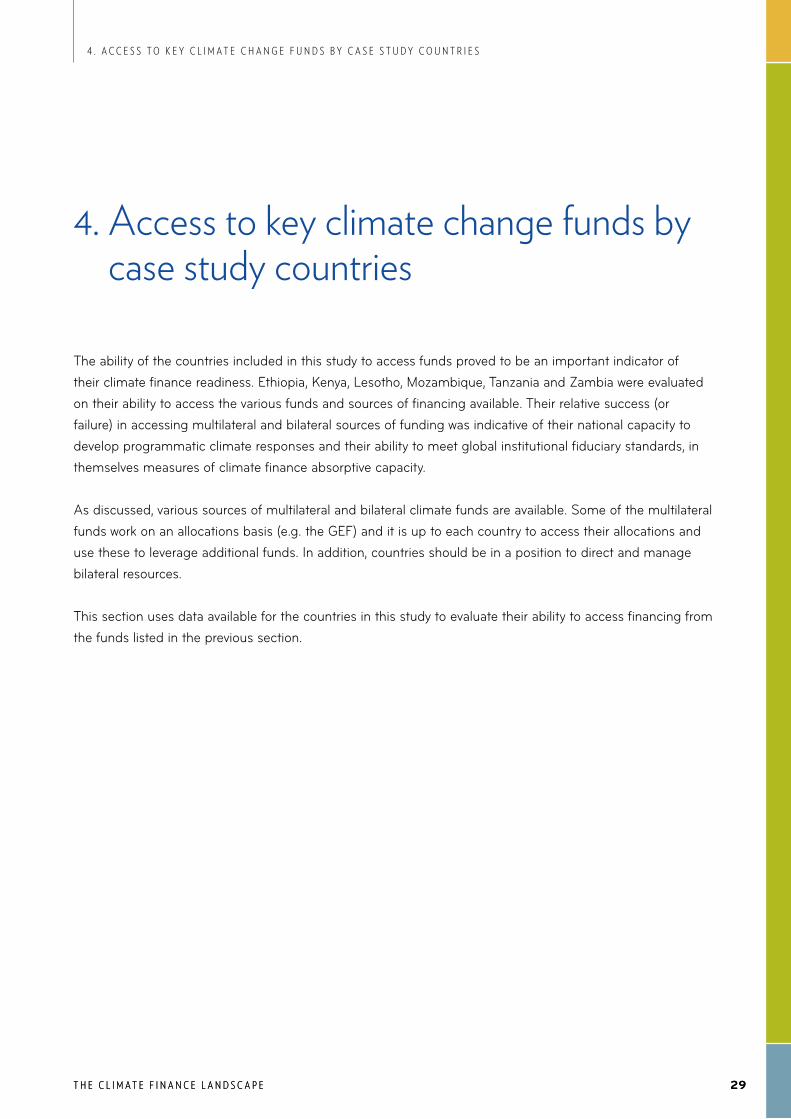
The allocation for GEF 6 was released in May 2014, with the total funds allocated between GEF 5 and GEF 6 only increasing 4% (see Figure 11). For this group of countries, Kenya, Tanzania and Zambia’s allocation increased more or less in line with the overall increase of 4%, while Ethiopia, Lesotho and Mozambique’s allocations increased significantly. Most striking is Lesotho and it may be argued that Lesotho’s improvement in its access rates between GEF 4 and GEF 5 may have contributed to the improved allocation in GEF 6.
Figure 11. differences between geF 5 & 6 allocations
22%
4%
39%
24%
6% 4%
0%
5%
10%
15%
20%
25%
30%
35%
40%
Ethiopia Kenya Lesotho Mozambique Tanzania Zambia
Source: GEF, 2014a.
32
4 . a c c e s s T o k e y c l i m a T e c h a n g e F u n d s b y c a s e s T u d y c o u n T r i e s
T h e c l i m a T e F i n a n c e l a n d s c a p e
An examination of the absolute amount of funds allocated under GEF 6 (see Figure 12) shows Tanzania in the lead with Ethiopia and Kenya not far behind; these three countries also experienced the largest increases in allocation between GEF 4 and 5 of between 51 and 61 per cent. Mozambique and Zambia have been allocated both a moderate amount of funds and a moderate increase in funds (29 and 31 per cent respectively), while Lesotho’s allocation is far below those of the other countries despite its increase of 39 per cent between GEF 5 and 6 as it experienced a decrease of 39 per cent between GEF 4 and 5, (see Figures 10 and 11).
Figure 12. geF 6 allocations (US$ million)
Source: GEF, 2014a.
The figures above clearly show that those countries at a more advanced stage of planning for climate have an enhanced ability to access funds. Kenya and Ethiopia consistently show themselves to be at an advanced stage of CFR in terms of the regional CFR indicators for planning, and they are clearly able to access bilateral and multilateral funds more easily than the other countries studied. Lesotho’s status in terms of planning is certainly consistent with its access status. The picture is, however, distorted to some extent by Tanzania. This country is clearly in transition in terms of planning and is at early transition stage for access. Nevertheless it has accessed the AF (through an MIE), has seen an increased GEF allocation in GEF 5, fared well in accessing its GEF 4 and 5 allocation and is second of the six countries in accessing FSF. It may be that, because the country’s agenda is strongly donor- driven, Tanzania’s success in accessing funds is not necessarily reflective of national ownership or government capacity. Alternatively, it may be reflective of the global environmental benefits that can be obtained through the protection of Tanzania’s natural capital, which is reflected in the large allocation to biodiversity in GEF 6 (Figure 12).
0
5
10
15
20
25
30
Milli
on U
S$
Climate Change Biodiversity Land Degradation Total for Country
33
4 . a c c e s s T o k e y c l i m a T e c h a n g e F u n d s b y c a s e s T u d y c o u n T r i e s
T h e c l i m a T e F i n a n c e l a n d s c a p e
The Least Developed Countries Fund (LDCF) and Special Climate Change Fund (SCCF)Data for LDCF and SCCF reveal that the LDCF is a far more significant financing stream than the SCCF for this group of six countries, as it is for SSA as a whole. The LDCF is only applicable to LDCs, so Kenya is not able to access this financing stream. Lesotho has been comparatively unsuccessful at accessing bilateral and multilateral funding overall. However, its access to the LDCF is an exception to this general rule: Lesotho has been the most successful within this group of countries at accessing this fund. The LDCF is also by far the most important funding source for Lesotho. This would seem to indicate that this fund has been designed with the capacity issues of LDCs in mind.
Figure 13. ldcF and SccF approved spending (US$ million)
0 2 4 6 8
10 12 14 16 18 20
Milli
on U
S$
LDCF
SCCF
Source: Climate Funds Update, 2014a.
The Adaptation Fund (AF)The only country in this study to have accessed the AF is Tanzania, despite not having a National Implementing Entity (NIE). The project, entitled “Reduce Vulnerability of Coastal Communities”, is being implemented by UNEP and has been allocated a grant amount of just over US$5 million. Kenya has an NIE but has not been able to access the AF yet.
34
4 . a c c e s s T o k e y c l i m a T e c h a n g e F u n d s b y c a s e s T u d y c o u n T r i e s
T h e c l i m a T e F i n a n c e l a n d s c a p e
Climate Investment Funds (CIFs)The only CIFs that are relevant for the case study countries are SREP and PPCR. Lesotho was not eligible for either of these World Bank funds, while the other countries accessed funding through either PPCR or SREP. Interestingly, the funding allocated to adaptation funding through the PPCR is significantly higher than the mitigation focused funding of the SREP. PPCR is consequently one of the most important multilateral sources of funding for adaptation on the African continent, even if focused on only three countries.
Figure 14: ciF approved funding (US$ million)
0 10 20 30 40 50 60 70 80 90
Milli
on U
S$
SREP
PPCR
Source: Climate Funds Update, 2014a.
Fast Start Finance (FSF) For various reasons, available data (Figure 15) do not provide a complete picture of the Fast Start Finance accessed during the period 2010-2012 by the countries focused on in this report, but it does provide some good indications as to bilateral funding accessed between 2010 and 2012. Already a popular recipient of climate finance at the outset of the FSF programme, Kenya, as reflected in Figure 15, accessed the bulk of the funds among the six case study countries. Notably the funding for mitigation activities is substantially larger than that of any of the other countries in the study. There are a number of reasons for this, from the comparatively mature policy environment encouraging investments in renewable energy, to the relative size and sophistication of the local private sector. In terms of adaptation, Ethiopia received the most funding in this group of countries and this is also reflective of its climate focus and innovative funding mechanisms.
35
4 . a c c e s s T o k e y c l i m a T e c h a n g e F u n d s b y c a s e s T u d y c o u n T r i e s
T h e c l i m a T e F i n a n c e l a n d s c a p e
Figure 15: FSF accessed 2010–2012 (US$ million)
0
100
200
300
400
500
600
700
800
900
1000
Milli
on U
S$
Unknown
REDD+
Multiple
Mitigation
Adaptation
Source: Open Climate Network, 2013.
Reducing Emissions from Deforestation and Forest Degradation (REDD+)The only REDD+ funds applicable to the case study countries are FCPF and UN-REDD. All countries, except Lesotho, have accessed one of these two funds, but that this is not a significant financing stream in comparison to some of the other financing opportunities. This situation may change as the impact of deforestation on GHGs becomes increasingly recognized.
Figure 16: Approved Redd+ funding (US$ million)
0 0,5
1 1,5
2 2,5
3 3,5
4 4,5
5
Milli
on U
S$
FCPF
UN-REDD
Source: Climate Funds Update, 2014a.
36
4 . a c c e s s T o k e y c l i m a T e c h a n g e F u n d s b y c a s e s T u d y c o u n T r i e s
T h e c l i m a T e F i n a n c e l a n d s c a p e
The Clean Development Mechanism (CDM)There have been significant difficulties associated with African countries registering CDM projects, and of the 7,583 projects registered worldwide, this group of countries has only registered 29 projects, or 0.38 per cent of the total. Within this group Kenya has been the most successful within the CDM programme with 19 registered projects (see Box 2). This is probably a result of its relatively advanced stage of CFR and the size of the local private sector.
Figure 17: cdm registered projects by host country
0 2 4 6 8
10 12 14 16 18 20
Num
ber o
f reg
ister
ed p
rojec
ts
Source: UNFCCC, 2014a.
box 2. Kenya’s experience with the clean development mechanism
Table 3 below provides a summary of the climate financing that the case study countries have accessed from the funds discussed in this section. This is not a complete picture of the climate finance landscape within these countries, as some funds are not included, private sector climate financing is absent and some bilateral funding has not been reported. However this table does show which sources of funding have the most relevance for these countries and which countries have been most successful at accessing climate finance.
Table 3. international funds accessed by case study countries (US$ million)
Fund eThIopIA KenyA LeSoTho MozAMbIque TAnzAnIA zAMbIA
Adaptation Fund X3 X X X 5 X
Least Developed Countries Fund 10.4 X 18.1 13.6 7.3 17.8
Special Climate Change Fund 1 6.5 x 1 1 x
GEF 6 allocation 23.2 18.9 6 16.2 29 11.5
Pilot Program for Climate Resilience x x x 81.8 x 75.5
Scaling-Up Renewable Energy Program for Low Income Countries
30.6 25 x x 1.7 x
UN-REDD x X x x 4.3 4.5
Forest Carbon Partnership Facility 3.8 0.2 x 3.8 x x
3 An X indicates that this fund is not relevant for that particular country or that zero funds have been allocated from this fund.
Kenya’s success with CDM projects can be attributed to a clear understanding of the rules governing access, as well as an extensive knowledge of the private sector. Importantly, there is a high level of commitment on the part of government to actively include the private sector. Government delegations to the annual UNFCCC Conference of the Parties (COP) meetings include representatives from relevant government and non-governmental sectors, including the private sector. An important lesson stemming from Kenya’s CDM experience, from which other countries can learn, is the imperative of establishing the legal and institutional environment, as well as standards of best practice in advance, as opposed to meeting these requirements as and when climate finance or funding becomes available. Adopting such an approach meant that Kenya’s readiness for the CDM process was well articulated even before the Kyoto Protocol came into effect, and it was able to leverage projects in other climate-related areas such as carbon trading.
37
4 . a c c e s s T o k e y c l i m a T e c h a n g e F u n d s b y c a s e s T u d y c o u n T r i e s
T h e c l i m a T e F i n a n c e l a n d s c a p e
Table 3 below provides a summary of the climate financing that the case study countries have accessed from the funds discussed in this section. This is not a complete picture of the climate finance landscape within these countries, as some funds are not included, private sector climate financing is absent and some bilateral funding has not been reported. However this table does show which sources of funding have the most relevance for these countries and which countries have been most successful at accessing climate finance.
Table 3. international funds accessed by case study countries (US$ million)
Fund eThIopIA KenyA LeSoTho MozAMbIque TAnzAnIA zAMbIA
Adaptation Fund X3 X X X 5 X
Least Developed Countries Fund 10.4 X 18.1 13.6 7.3 17.8
Special Climate Change Fund 1 6.5 x 1 1 x
GEF 6 allocation 23.2 18.9 6 16.2 29 11.5
Pilot Program for Climate Resilience x x x 81.8 x 75.5
Scaling-Up Renewable Energy Program for Low Income Countries
30.6 25 x x 1.7 x
UN-REDD x X x x 4.3 4.5
Forest Carbon Partnership Facility 3.8 0.2 x 3.8 x x
3 An X indicates that this fund is not relevant for that particular country or that zero funds have been allocated from this fund.
Kenya’s success with CDM projects can be attributed to a clear understanding of the rules governing access, as well as an extensive knowledge of the private sector. Importantly, there is a high level of commitment on the part of government to actively include the private sector. Government delegations to the annual UNFCCC Conference of the Parties (COP) meetings include representatives from relevant government and non-governmental sectors, including the private sector. An important lesson stemming from Kenya’s CDM experience, from which other countries can learn, is the imperative of establishing the legal and institutional environment, as well as standards of best practice in advance, as opposed to meeting these requirements as and when climate finance or funding becomes available. Adopting such an approach meant that Kenya’s readiness for the CDM process was well articulated even before the Kyoto Protocol came into effect, and it was able to leverage projects in other climate-related areas such as carbon trading.
Box 2 continued.
Overall, Kenya’s success in registering and implementing CDM projects highlights the need for countries to focus their efforts on understanding what is required in order to access global funds and to move towards implementing the necessary changes to match the requirements. More importantly, in responding to these requirements, countries need to perceive progress along their developmental path, rather than access to funds, as the end goal so that the necessary foundations are put in place to expand access on a far greater scale.
38
4 . a c c e s s T o k e y c l i m a T e c h a n g e F u n d s b y c a s e s T u d y c o u n T r i e s
T h e c l i m a T e F i n a n c e l a n d s c a p e
This summary table illustrates how important bilateral funding is to the countries involved in this study. The FSF reported represents only part of the bilateral funding accessed, but provides indicative guidance as to how significant it is. For all the countries studied, except Lesotho, this funding is the most substantial funding stream, and for certain countries such as Kenya and Tanzania, it is by far the largest. As discussed above, GEF is one of the few funds that all the countries have accessed and it provides some analytical insight into their climate finance readiness. GEF is an important multilateral fund, particularly when the LDCF and SCCF are included, so the ability to access the GEF allocation is more than a stepping-stone to improved readiness; rather, it provides meaningful financing flows. The ability of countries to access a large variety of funds is also an important indicator of accessing readiness. In this regard Tanzania is seen as the leader in this group, with Lesotho lagging behind. Tanzania’s success is not demonstrably a result of an enhanced state of climate finance readiness but may be due to strong donor relationships with the country. Kenya has accessed the largest total amount. This is clearly as a result of a comparatively mature state of climate finance readiness and a relatively attractive investment profile. Lesotho, on the other hand, is struggling with access to funds and has scope to improve its access to financing significantly through more thorough planning of its climate change strategic response.
39
r e F e r e n c e s
T h e c l i m a T e F i n a n c e l a n d s c a p e
ReferencesAdaptation Fund (AF) (2013). Press release of the AF Secretariat: The Adaptation Fund Surpasses
$100 Million Fundraising Target at COP19. Available from https://www.adaptation-fund.org/media/adaptation-fund-surpasses-100-million-fundraising-target-cop19.
AF (2014). Adaptation Fund Interactive Map of Projects and Programmes. Available from https://adaptation-fund.org/funded_projects/interactive.
African Development Bank (AfDB) (2011). The Cost of Adaptation to Climate Change in Africa. Available from http://www.afdb.org/fileadmin/uploads/afdb/Documents/Project-and-Operations/Cost%20of%20Adaptation%20in%20Africa.pdf.
Buchner, B., M. Herve-Mignucci, C.Trabacchi, J.Wilkinson, M.Stadelmann, R. Boyd, R, and V. Micale (2013). . Climate Policy Initiative. Available from http://climatepolicyinitiative.org/wp-content/uploads/2013/10/The-Global-Landscape-of-Climate-Finance-2013.pdf.
Caravani, A., S.Nakhooda,C.Watson, W. McFarland, and L. Schalatek (2013). . Available from http://www.odi.org/sites/odi.org.uk/files/odi-assets/publications-opinion-files/8676.pdf.
Climate Investment Funds (CIF) (2014a). Retrieved from https://climateinvestmentfunds.org/cif/funds-and-programs
CIF (2014b.). Country Plans and Projects. Available from https://www.climateinvestmentfunds.org/cifnet/.Climate Funds Update (2012). Climate Funds Update: Sub-Saharan Africa. Available from http://www.
climatefundsupdate.org/regions/sub-saharan-africa#TOC-What-is-getting-financed.Climate Funds Update (2014a). The data. Available from http://www.climatefundsupdate.org/data.Climate Funds Update (2014b). The funds. Available from http://www.climatefundsupdate.org/the-funds.Climate Investment Funds (2014a). . Available from https://www.climateinvestmentfunds.org/cif/sites/
climateinvestmentfunds.org/files/cif-AR2013-ALL-feb19.pdf.Climate Investment Funds (2014b). . Available from https://www.climateinvestmentfunds.org/cif/sites/
climateinvestmentfunds.org/files/CTF_14_3_Semi_Annual_Operational_Report.pdf.Climate Policy Initiative (CPI) (2012). . Available from http://climatepolicyinitiative.org/wp-content/
uploads/2012/12/The-Landscape-of-Climate-Finance-2012.pdf.De Boer, Y. (2007). Investment and financial flows to address climate change. Vienna, Austria: United Nations
Framework Convention on Climate Change (UNFCCC). Available from http://unfccc.int/files/meetings/dialogue/application/pdf/070828_de_boer.pdf.
Doornbosch, R., and E. Knight (2008). OECD. Available from http://www.oecd.org/sd-roundtable/papersandpublications/41564226.pdf.
Ellis, K., A. Cambray and A. Lemma (2013). Climate and Development Knowledge Network (CDKN). Available from http://cdkn.org/2013/02/paper-drivers-and-challenges-for-climate-compatible-development/?loclang=en_gb.
Escobar, J. C., E.S. Lora, O.V Venturini, E.E Yáñez, E.F. Castillo, and O. Almazan (2009). Biofuels: Environment, technology and food security.Volume 13, Issues 6-7, August-September.
Food and Agricultural Organisation of the United Nations (FAO) (2009). . Available from http://www.fao.org/fileadmin/templates/rome2007initiative/NENA_Forum_2009/Factsheets/FAO_CCFactsheet_LDCFSCCF.pdf.
Global Environment Facility (GEF) (2013a). . Available from http://www.thegef.org/gef/sites/thegef.org/files/documents/GEF-LDCF.SCCF_.1503,%20Progress%20Report%20on%20the%20LDCF%20and%20the%20SCCF,%20DRAFT%206,%202013-10-10.pdf.
40
r e F e r e n c e s
T h e c l i m a T e F i n a n c e l a n d s c a p e
GEF (2013b). The Least Developed Countries Fund (LDCF). G Retrieved from http://www.thegef.org/gef/LDCF.GEF (2013c). The Special Climate Change Fund (SCCF). Retrieved from http://www.thegef.org/gef/SCCF.GEF (2014a). GEF country profile. Available from http://www.thegef.org/gef/country_profileGEF (2014b). Progress Report on the Least Developed Countries Fund and the Special Climate Change Fund.
Available from http://www.thegef.org/gef/sites/thegef.org/files/documents/GEF-LDCF.SCCF_.17-03,%20Progress%20Report%20on%20the%20LDCF%20and%20the%20SCCF,%202014-10-08.pdf.
GEF (2014c). The Least Developed Countries Fund (LDCF). Available from http://www.thegef.org/gef/LDCFGEF (2014d). The Special Climate Change Fund (SCCF). G Available from http://www.thegef.org/gef/SCCFGlobal Humanitarian Forum (GHF) (2009). . Geneva: Switzerland: Available from http://www.ghf-ge.org/
human-impact-report.pdf.Green Climate Fund. (2012a). Available from http://gcfund.net/fileadmin/00_customer/documents/pdf/GCF-
governing_instrument-120521-block-LY.pdfGreen Climate Fund. (2012b). . Available from http://gcfund.net/about-the-fund/mandate-and-governance.
htmlGreen Climate Fund. (2014). Green Climate Fund Board takes key decisions on operations and makes
progress on “Essential Eight”. Press Release. 22 February, Bali, Indonesia.: Available from http://gcfund.net/fileadmin/00_customer/documents/pdf/GCF_Press_Release_fin_20140222.pdf.
Hedger, M. (2012). . Available from http://climatefinance-asiapacific.org/attachments/article/30/121130%20Hedger%20Report%20Readiness%20for%20Climate%20Finance%20in%20Mongolia%20EN.pdf.
Hellmuth, M. E., A. Moorhead, and M. C. Thomson, (2007). . New York: International Research Institute for Climate and Society (IRI). Available from http://iri.columbia.edu/docs/CSP/Climate%20and%20Society%20No1_en.pdf.
International Energy Agency (IEA) (2009). World Energy Outlook 2009. Paris.I Available from www.worldenergyoutlook.org/media/weowebsite/2009/WEO2009.pdf.
Intergovernmental Panel on Climate Change (IPCC) (2007). . Geneva, Switzerland. Available from http://www.ipcc.ch/publications_and_data/publications_ipcc_fourth_assessment_report_wg3_report_mitigation_of_climate_change.htm.
Nakhooda, S., A. Caravani, N. Bird, and L.Schalatek (2011). Climate Finance Policy Brief. ODI & Heinrich Böll Stiftung. Available from http://www.cbd.int/financial/climatechange/subsaharan-climate.pdf.
Nakhooda, S., T. Fransen, T.Kuramochi, A.Caravani, A.Prizzon, N.Shimizu, and B. Welham (2013). ODI, WRI, IGES and OCN. Available from http://www.odi.org.uk/publications/7987-mobilising-international-climate-finance-lessons-fast-start-finance-period.
Open Climate Network (2013).Fast-Start Finance Contributions Dataset. World Resources Institute. Available from http://www.wri.org/resources/data-sets/fast-start-finance-contributions.
Pearce, F. (2012). Washington, DC.: Rights & Resources Initiative (RRI). Available from http://www.rightsandresources.org/documents/files/doc_4701.pdf.
Polycarp, C., Brown, L and X. Fu-Bertaux, (2013). . World Resources Insitute. Available from http://www.wri.org/publication/mobilizing-climate-investment.
M. Rowling (2014). Green Climate Fund aims to allocate half of money for adaptation. 24 February. Available from http://www.trust.org/item/20140224125627-ejf6y/.
Schalatek, L., S.Nakhooda, S. Barnard, and A. Caravani (2012a). . Overseas Development Institute (ODI) and Heinrich Böll Stiftung.. Available from http://www.odi.org.uk/sites/odi.org.uk/files/odi-assets/publications-opinion-files/7914.pdf.
41
r e F e r e n c e s
T h e c l i m a T e F i n a n c e l a n d s c a p e
Schalatek, L., S.Nakhooda, S. Barnard, and A. Caravani (2012b). . Overseas Development Institute (ODI) and Heinrich Böll Stiftung. Available from http://www.odi.org.uk/sites/odi.org.uk/files/odi-assets/publications-opinion-files/7910.pdf.
Schalatek, L., S.Nakhooda, S. Barnard, and A. Caravani (2012c). . Overseas Development Institute (ODI) and Heinrich Böll Stiftung. OAvailable from http://www.odi.org/sites/odi.org.uk/files/odi-assets/publications-opinion-files/7911.pdf.
Spratt, S., and C. Ashford (2011). . Institute of Development Studies (IDS)/Stamp Out Poverty. Available from http://www.stampoutpoverty.org/wf_library_post/climate-finance/’.
Stern, N. (2007). . Cambridge University Press. Available from http://www.cambridge.org/us/academic/subjects/earth-and-environmental-science/climatology-and-climate-change/economics-climate-change-stern-review
United Nations Secretary-General’s High-level Advisory Group (UNAGF). (2010). . New York. Available from http://www.un.org/wcm/webdav/site/climatechange/shared/Documents/AGF_reports/AGF%20Report.pdf.
United Nations Convention to Combat Desertification (UNCCD). (2013). Available from http://global-mechanism.org/gm-publications/documents-and-publications/gm-publications/view-category.
UNDP (2012). . Retrieved from http://www.undp.org. /publicationsDocuments/UNDP-Readiness_for_Climate_Finance.pdf.
UNEP (2010). . Available from http://www.unep.org/pdf/dtie/BilateralFinanceInstitutionsCC.pdf.United Nations Environment Programme (UNEP), African Ministerial Conference on the Environment
(AMCEN) and Climate Analytics (CA). (2013). . UNEP. Retrieved from http://www.unep.org/pdf/AfricaAdapatationGapreport.pdf.
United Nations Framework Convention on Climate Change(UNFCCC) (2013). . Available from http://unfccc.int/files/cooperation_and_support/financial_mechanism/standing_committee/application/pdf/scf_-_submissions_to_scf_5.pdf.
UNFCCC (2014a). Available from http://cdm.unfccc.int/Statistics/Public/CDMinsights/index.html.UNFCCC (2014b). Warsaw Outcomes. Available from http://unfccc.int/key_steps/warsaw_outcomes/
items/8006.php.UN-REDD (2014). About REDD+. Available from http://www.un-redd.org/AboutREDD/tabid/102614/Default.
aspx.Wheeler, D. (2011). Quantifying Vulnerability to Climate Change: Implications for Adaptation Assistance.
Center for Global Development (CGD), Working Paper 240, January.. Available from http://www.cgdev.org/publication/quantifying-vulnerability-climate-change-implications-adaptation-assistance-working.
World Bank (2010). Available from http://siteresources.worldbank.org/INTWDR2010/Resources/5287678-1226014527953/WDR10-Full-Text.pdf.
World Resources Institute. (2010). . Available from www.un-ngls.org/IMG/.../WRI_-_Additionality_of_Climate_Finance.pdf.