Page 1
Environmental Technology, National Institute for Interdisciplinary Science &
Technology (NIIST-CSIR), Thiruvananthapuram
April-2018
.
EIA REPORT FOR MINING OF HEAVY MINERAL SAND IN ALAPPAD, PANMANA
AND AYANIVELIKULANGARA VILLAGES IN KOLLAM DISTRICT FOR AN AREA OF
180 HA IN NK BLOCK IV EE BY INDIAN RARE EARTHS, CHAVARA, KOLLAM,
KERALA
Draft Report
Submitted to
Indian Rare Earths Limited
(A Government of India Undertaking)
Chavara, Kollam
Page 7
Executive summary
Indian Rare Earths (IRE) has been granted mining lease to collect heavy
mineral sand in Alappad, Panmana and Ayanivelikulangara village in Kollam
district for an area of 180 Ha vide G.O (Rt.) No. 746/07/ID dated
08/06/07 by the Government of Kerala.
IREL has been accorded Environmental Clearance & CRZ Clearance for
this mining project as per F.No. 11- 36/2008 IA- III dated 01.03.2011.
The study was conducted by CSIR-NIIST for the proposed production
of 2,37,150 TPA. The public in the lease area wanted the land to be given
back at the earliest and requested IREL for enhancing the mining rate.
Accordingly IREL propose to go for enhancement of mining from 2,37,150
TPA to 7,50,000 TPA. IREL as per work order No 21/T.No37/1314 dated
12/06/2013 has appointed CSIR-NIIST Thiruvananthapuram,to evaluate
the environmental aspects and their possible associated impacts to
workout environmental management plans and environmental monitoring
programme to prevent, control, minimize or eliminate the adverse
environmental impacts envisaged from the proposed mining activity in the
180 Ha.
Application for Prior environmental clearance was submitted in Form-1 to
Ministry of Environment & Forests, Government of India. TOR has been
finalised based on the presentation on June 2015.
The source of information are desk research, discussion with local
panchayats, NGO’s, affected people, officials of state and central
government relevant offices, literature survey and field studies. Primary
and secondary data on meteorology, air, noise, water, soil, traffic, land
use, ecology and socio-economics were collected and analyzed by CSIR -
NIIST. The field studies were carried out from March 2015 to May 2017
for the study area (buffer zone) within 10 km radius with the IREL-ML
area (core area) at the centre. No major or minor industries exist in the
core area except M/s. Kerala Minerals & Metals Limited (KMML) which is
9.34 km and IREL main plant at Chavara at about 15.4 km road distance
from the northwestern end of the proposed ML area. The mining lease
area of 180 hectares has Vattakayal at the south and Pannikarkadavu
bridge in the north.
EIA study is a well-recognized, effective planning tool that ensures
environmentally sound activity. In this report, the impacts on relevant
Page 8
ii
discipline of environment due to the operation of the proposed project
have been identified and assessed quantitatively, as far as possible.
Environmental management programmes for mitigation of impacts are
delineated. An environmental monitoring programme has been suggested
for post operational phase of the project. The monitoring programme
specifies the locations, parameters, and frequency of monitoring of
significant aspects. Capacity building in terms of staff, technical
expertise and monitoring facilities are also suggested.
The proposed project lease area encompasses ‘vatta kayal’ which is part
of the waterway called TS canal. The entire plot has heavy deposit of
beach sand minerals. The mineable reserve of ilmenite, rutile, zircon,
sillimanite, leucoxene and monozite is about 6.02 Million Tons as per the
plan which is submitted for the period from 2016-17 to 2020-21, and the
area proposed for production is in the western side of TS canal, the
reserves of 6.025 Lakh tonne are calculated with the available data. As
the report is awaited for the study carried out as per the UNFC
classification which covers the entire lease area of 180 Ha. The average
heavy mineral content of the area proposed for mining in 01 to 05 years
is about 17.62%. The location of the site is given in the report.
Quantification of the impacts was carried out applying mathematical
models. For quantifying and predicting the air quality the Fugitive Dust
Modelling Software has been used and hemispherical modelling has been
used for the noise quality modelling. Battelle environmental system has
been used for evaluation of impacts of environmental pollution, ecology,
human interest and aesthetics.
Dredge mining is a wet process and no dust pollution arises out of it.
Total about 375t/day of raw material will be conveyed through 38 trips
from mining area to mineral separation plant, assuming capacity of tippers
as 10T.
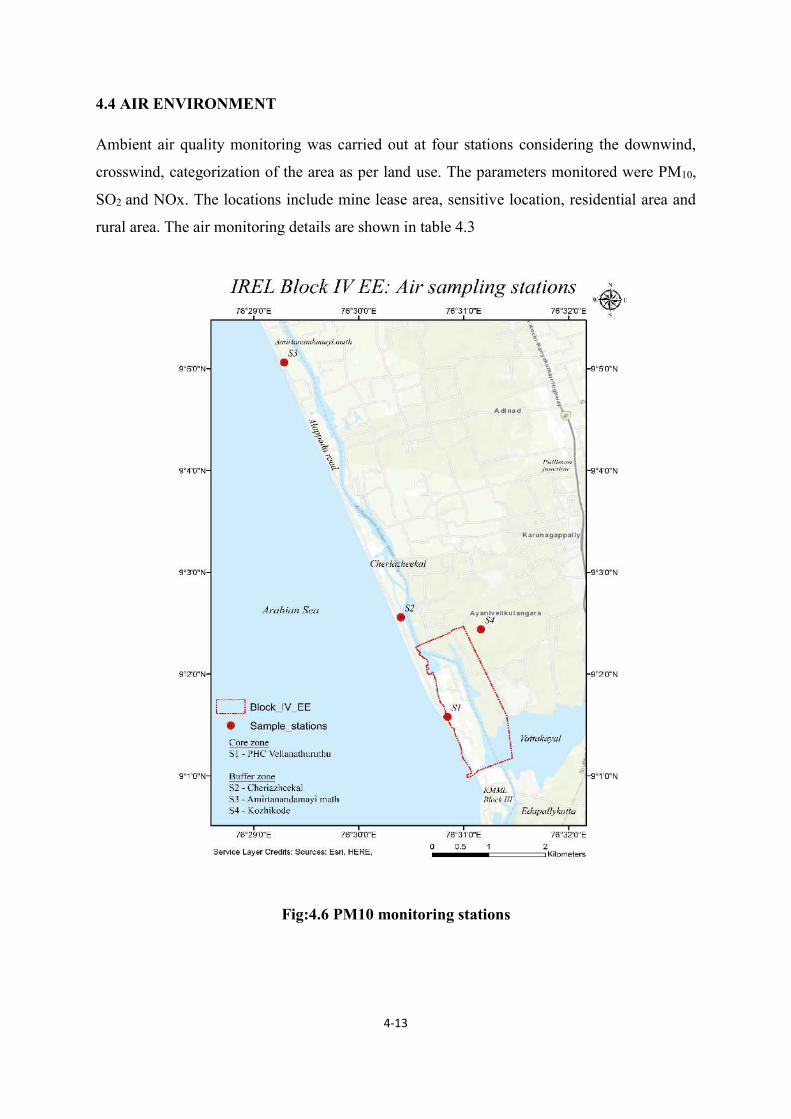
The present air quality has been evaluated by setting up four high volume
samplers at four different locations. Ambient air quality for PM10, SO2,
NOx were monitored. Upwind downwind and cross direction location as
well as the land use, wind rose were considered in selection of the
sampling locations. Ambient Air Quality monitored at Vellanathuruthu
PHC, Project Location, Amrithananthamai math and Maravana Junction
for PM10, SO2 and NOx.
Page 9
iii
The air pollutants of interest in this project are PM10. The main sources
are emissions during mining and transportation. However dust emission is
not significant in dredge mining as the ore and rejects are in wet or
slurry form. Road transportation of ore on the haul road is the only
source of dust emission. On commissioning of mining activity there will be
increase in truck movement by 46 trips. Due to this increase in truck
movement there will be increase in dust emission.
For prediction of dust emission the modelling software Envitrans MINE
Fugitive Dust Modelling Pro was used. The model shows incremental
increase in pollution caused due to the area due to truck. However the
incremental values are within the CPCB limit prescribed for PM10, which
is 100µg/m3 for 24 hour. This value is based on the prediction obtained
without any control measures.
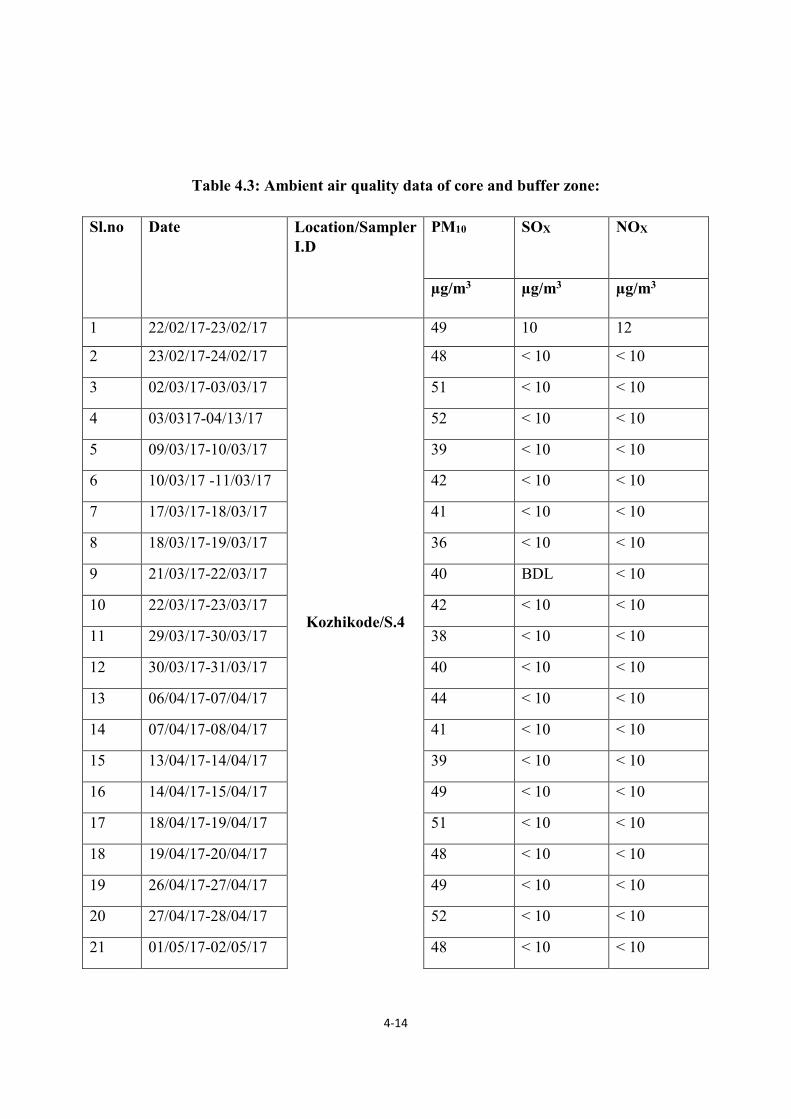
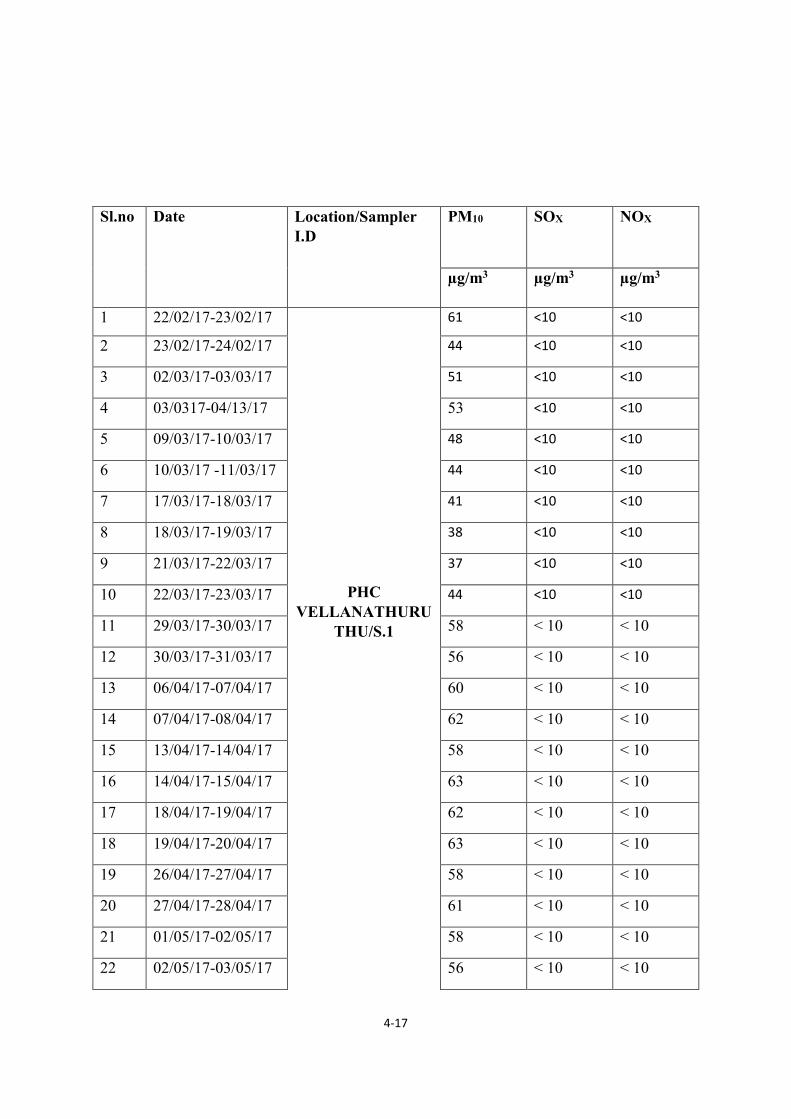
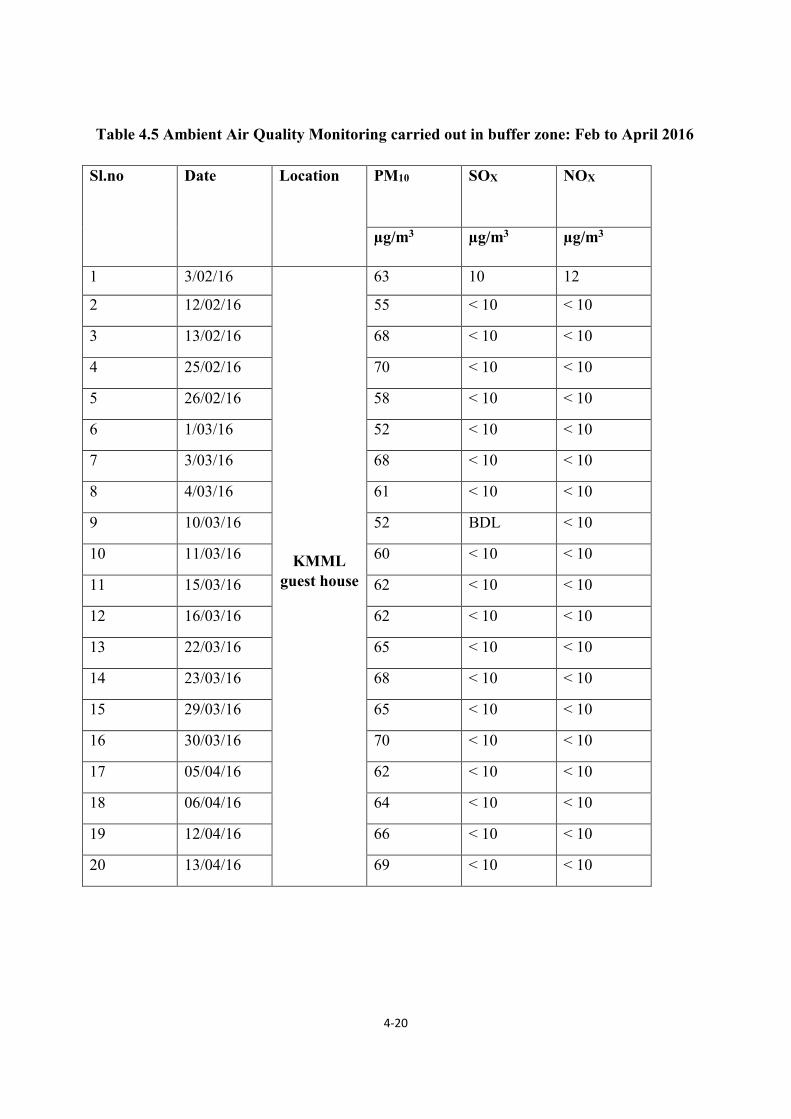
The maximum value of PM10 for an average of 24 hours was 63 µg/m3
observed inside the mine lease and minimum value for PM10 for an
average of 24 H was 45 µg/m3. Similarly SO2, NO2 values showed, less
than 10 µg/m3 for all stations. The permissible limits as per NAAQ std’s
for PM10 is 100 µg/m3and for SO2 and NO2 the limits are 80µg/m3.Thus
the observed values for air quality taken over the period of February to
April 2016 and February to May 2017 in core and buffer zone is within
the permissible limits.
The report looks into the viability of barge economics which appears to
be a feasible option for transporting mineral concentrate using TS canal (
part of NW3 water way) to IREL plant. The distance to IREL plant site
is only 6.85 km as compared to 15.4 km road distance from northern end
of the ML area. Considering the existing traffic congestion along the NH
- ML area road , the availability of canal adjacent to the ML area ,
shorter distance to plant via water transport and provision of local
employment to fishermen community, it is recommended that a trial run
using water transport be conducted by IREL.
Country boats can be considered on environmental and socio-economic
grounds. The loading and unloading of mineral concentrate from country
boats has to be worked out. The loading of concentrate can be carried
out by allowing concentrate slurry to flow into the boat or barge.
Advantages and cost economics of barge transport which is ecofriendly
best suited compared to road transport are covered in the report.
Page 10
iv
Another option for transportation of the slurry is by pumping. A seven
stage pumping at a rate of 65 tph is proposed The total estimated cost
of the project is Rs.500 lakhs.
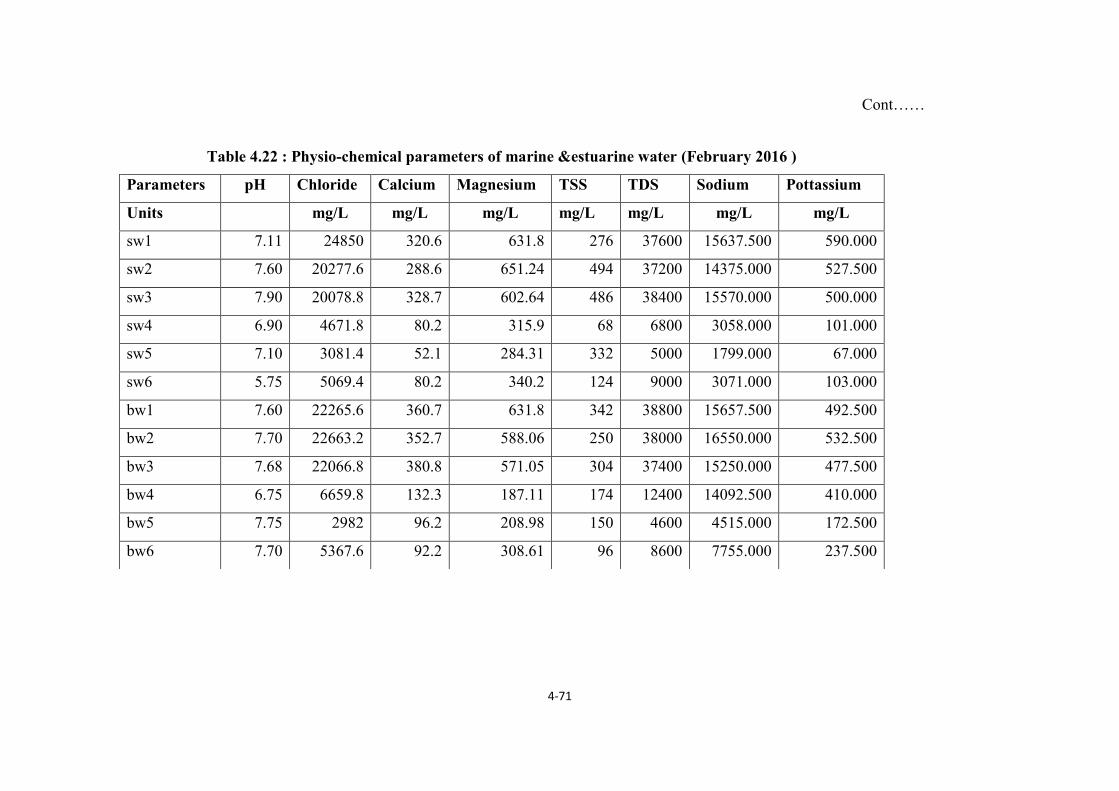
Water quality changes are widely considered to be the most significant
consequence of mining activities. The surface and ground water
characteristics have been established through field monitoring data at 13
locations generated during the study with respect to physicochemical
characteristics and pollutant levels and the same has been compared with
quality criteria for drinking water. The details are given in chapter-4.
The Ground water contour map indicated that the flow/movement of
water direction is predominantly towards South West and to the eastern
side of the lease.
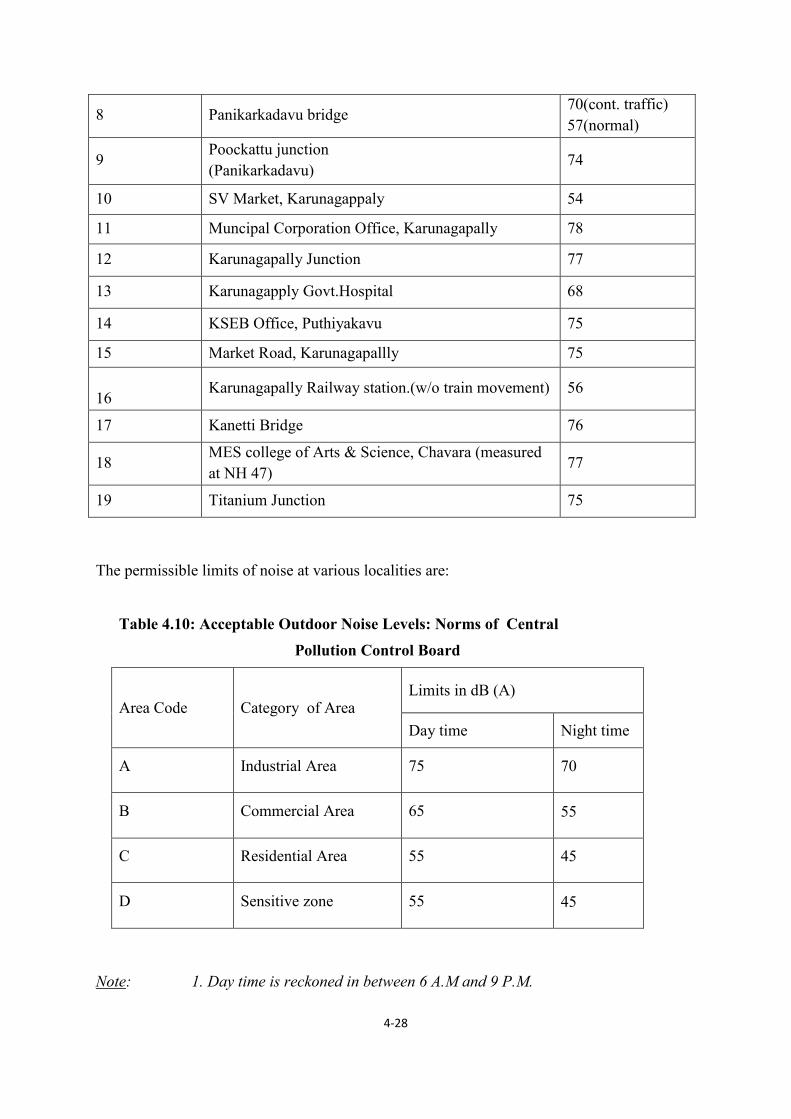
Maximum noise level during the study period was observed at Near
municipal Corporation office, Karunagapally Junction which are busy
junctions along the national highway which can be ascribed due to
commercial activities, movement of continuous vehicular and other
traffic and location of bus stand. Minimum ambient noise level observed
was 50 - 60 dB at the Primary Health Centre Vellanathuruth,
Pandarathuruth. The low values could be attributed to considerably less
traffic and calm environment.
The noise level at dredge is about 70 dB that fades off at less than 50
meters and beyond 50 meters there was no effect of dredge operation.
The modeling results also show almost the same results. Nearest
habitation is beyond 100m distance and hence there is no need for noise
control measures. However, the impact on staff at dredge should be
minimized by introducing shift system, automation wherever possible and
practicing safety measures.
Surface mining usually renders the land unsuitable for other uses unless
it is restored or rehabilitated. The consultant suggests simultaneous
refilling of the mine in progression with mining. After the recovery of
HM concentrates the reject sand is used for refiling the mined out area.
As the back filling is integrated into the mining process, the excavated
land will be subsequently reclaimed and the ground surface of the
reclaimed land will be brought back to the contours matching with the
surrounding topography. No temple or any sensitive locations will be
disturbed. The reclamation will improve the overall landscape
considerably in a phased manner by green belt development and ponds for
water conservation and ground water recharge, to improve the water
Page 11
v
quality / quantity. It will also be a sustainable source for water, availing
infiltration of water wherever feasible. The management plan also
suggests rip rap bank protection, green belt development , conversion of
mined area to sand dunes, creation of wet land ideal for mangrove
afforestation which can serve as barrier in preventing sea water
intrusion to the inland as well as recreation purposes. The deepening of
the TS canal also enables smooth navigation of waterways.
NW-3 is the project of the Inland Waterways Authority (IWA) of India,
Noida They aim at developing waterways upto a certain standard so that
Inland Waterway Transport operators can operate the vessels for cargo
and passenger transportation, State government is also interested in
developing the NW3 as this will ease the congestion on roads. Moreover,
it is a cheaper means of transport compared to roads. IWA has plans to
develop 11 terminal for NW-3. Land acquisition for 10 terminals is over
and 7 terminals are under construction. Widening of narrow canals and
installation of navigational aids like day markings are in progress.
Improved roads and communication, electrical facilities and employment
opportunity are the other immediate outcome of the project which is
beneficial to the public. However, construction of black topped roads and
its regular maintenance should be ensured to prevent fugitive dust
emissions. The report lays stress on the probable occupational health
hazards involved and the remedial measures.
The proposed ML area does not come under ‘forest land’ and hence no
compensatory afforestation is required. No existing mangrove areas will
be mined, however the project facilitates mangrove afforestation
enhancing the total mangrove area to 2.73 ha in lieu of the existing 1.32
ha.
The company is now planning certain steps to recover the land lost to the
sea. To reclaim the shore in Block IV EE and Block IV, it is proposed to
construct Groyenes in the NK Block IV EE area between Thazhchakadavu
(IREL Boundary) and the VT bus-stand. Four groynes will be constructed
in this stretch with a distance of around 200 meters apart. Kerala
irrigation department with a total cost expected to be Rs. 10 crores has
taken up the work.
Another positive outcome of the proposed activity is that the mining of
sand and separation of HM concentrates eventually contributes to a
Page 12
vi
reduction in the overall level of radiation in the environment, which is a
relief to the inhabitants in the area. However, it is recommended that
external exposure be measured at selected locations round the year.
Data regarding the existing socioeconomic conditions were collected by
circulating questionnaire among the families living in the project affected
areas of Alappad, Panmana and Ayanivelikulangara of Kollam district. 550
families were covered under the survey. Water borne diseases are
frequently reported and acute water shortage is experienced by the
villagers. They depend on water supply schemes for potable water.
The R & R scheme has been formulated after tripartite discussion
between district administration, affected people and project authorities.
The scheme has been approved by district authorities. General welfare
measures for the fishermen community as well as for the general public
are also highlighted in the report. The summary of the socio-economic
report is given in Chapter-4.
The last chapter includes post project monitoring to ensure that the
mitigation measures planned by way of environmental protection, function
effectively during the entire period of the mining and reclamation. These
include (1) Meteorological Observatory (2) Periodic topographic survey
(3) Measures for Coastal protection & its monitoring (4) Water
Resources management (5) Socio-economic development (6) Greenbelt
development (7) Occupational health & Biological monitoring (8)
Radiation Exposure monitoring (9) Organisational set-up & staff
requirement for post - project monitoring. In addition to this a separate
Environmental Monitoring Committee (EMC) is recommended comprising
senior officers, external experts and representative of the Alapad
panchayat to ensure implementation of recommendations as per the EMP.
An amount of Rs. 159.00 lakhs will be required for post-project
monitoring initially which include capital and recurring expenditure. The
recurring expenditure will be about Rs. 113 lakhs/year. This project
provides opportunity to reduce the existing radiation levels, increase in
mangroves areas, prevents sea erosion, enhancement of wet land etc.
Page 13
1-1
CHAPTER 1
INTRODUCTION
1.1 General
Beach Sand Heavy Minerals such as ilmenite, rutile, zircon, monazite, sillimanite etc. are
used in considerable quantities as raw materials for the manufacture of various essential
industrial products like titanium dioxide, welding electrodes, ceramics etc. In India these mineral
deposits are found in the eastern and western coastal stretches at various locations. The major
deposits along the west coast are the Quilon deposit at Chavara along the Neendakara -
Kayamkulam belt in Kerala and the Manavalakurichi deposit in Kanyakumari district of Tamil
Nadu that extends from the Midalam to Kolachal. The economically exploitable deposits of east
coast are at Chatrapur in Odisha and Bhimulipatnam in Andhra Pradesh.
The beach placer deposits along the southern coast of India was explored and exploited
by various agencies since the accidental discovery of monazite by a German Chemist Sir. Herr
Shomberg in the year 1909 at Manavalakurichi in Tamilnadu.
The beach placer deposit in kollam district of Kerala is commonly known as "Chavara
Deposits". It occurs in a 22.5 km. long barrier beach with an average width of 200 m between
the two tidal channels at Neendakara in the south and Kayamkulam in the north. The deposit is
bounded by the Arabian Sea in the west. The deposit is seen to extend beyond Kayamkulam
estuary (or Pozhi as it is known locally) up to Thottapally in the North, which has not been
mined so far. The area south of Kayamkulam Pozhi has been under intensive mining since 1932.
During this period, it was the main center for export of Ilmenite. This has been the only deposit
so far in the Indian coast, to have a heavy mineral content running as high as 60 to 70%. Also
the Chavara ilmenite known as Quilon grade or 'Q' grade Ilmenite has high TiO2 content of 59 to
60%.
In the year 1965, Indian Rare Earths Ltd. (IREL), an organization under the administrative
control of the Department of Atomic Energy, succeeded in taking over the assets of two
companies viz. M/s. Travancore Mineral Concern and M/s. Hopkin & Williams Ltd., and since
then rationalized and reorganized the production of the economic minerals from the Chavara
sand deposits. Initially, their activities were confined to the mining and separation of heavy
minerals from the beach washings collected over the beach by the wave action between high and
Page 14
1-2
low water marks. Later on the Atomic Minerals Division (presently Atomic Minerals Directorate
for Exploration and Research) under the Department of Atomic Energy carried out geological
exploration of the area and since 1990 the company is engaged in inland dredge mining
operation.
Besides Chavara, IREL has plants at Manavalakuruchi in Kanyakumari district (Tamil
Nadu) and at Chatrapur in Ganjam District (Odisha).
This stretch of deposit between Neendakara and Kayamkulam (NK ) was divided by the
Govt. of Kerala into 8 blocks, for mining lease purpose. The even numbered blocks (II, IV,VI
and VII ) have been leased to Indian Rare Earths Limited (IREL) and odd numbered blocks to
Kerala Minerals and Metals Limited (KMML), Kollam in the year 1970.
In the year 2007, IREL has been granted mining lease to collect heavy mineral sand in
the Eastern Extension of the NK Block IV in the Alappad, Panmana and Ayanivelikulangara
villages in Kollam district for an area of 180 ha vide G.O (Rt.) No. 746/07/ID dated 08/06/07 by
the Government of Kerala.
This study is conducted for carrying out the mining in Block IV EE. The TS canal passes
in between the proposed mining block. The deposit covers an area of 180 hectares with
Neendakara at the south and Kayamkulam in the north. The mining method is open cast method
of inland mining (dredging using DWUP).
A mining project may significantly contribute towards economic development but it may
also bring in its wake associated ill-effects. These include the problems related to air & water
pollution, solid waste management, land degradation, noise, human settlements, and impact of
mining on the ecology. The coastal area of Kerala is one of the most densely populated area. As
per 2011 census the population of the villages of the present project, Alappad, Panamana and
Ayanivelikulangra villages are 21,655; 29,008 and 24,268 respectively. The main occupation of
the people here is fishing.
Degradation and inappropriate utilization of coastal areas adversely affect aesthetic and
environmental values. These could be avoided through proper management based on the
assessment of ecological values and potential damages from the project. The unique
environmental and ecological values of the coastal areas require conservation, improvement and
effective controls on the causes that imply environmental deterioration.
Page 15
1-3
To fulfill the statutory requirements of Ministry of Environment, Forests & Climate
change, Government of India, for Project appraisal procedures, Environment Impact Assessment
(EIA) study needs to be carried out for the project. EIA is one of the most valuable,
interdisciplinary objective decision making tool considering various alternate routes for
development, process technologies and project site options. It is an anticipatory mechanism
which establishes quantitative and qualitative values for parameters indicating the quality of
environment and natural systems before and after the proposed mining activity.
IREL F.No. 11- 36/2008 IA- III dated 01.03.2011, IREL obtained EC and CRZ clearance
for this block for mining of minerals for a quantity of 2,37,150 TPA, Now IREL propose to
enhance the production capacity to 7,50,000 TPA, hence this project is a capacity expansion
project.
IREL as per the work order No 21/T.No37/1314 dated 12/06/2013 has appointed
National Institute for Interdisciplinary Science & Technology NIIST-CSIR,
Thiruvananthapuram, to evaluate the environmental aspects and their possible associated impacts
that would arise due to the enhanced capacity of the project proposed for heavy mineral sand
mining operations. Environmental management plans and environmental monitoring program are
proposed to prevent, control, minimize or eliminate the adverse environmental impacts
envisaged from the proposed mining activity. TOR has been finalised based on the presentation
before the central appraisal committee on June 2015. NIIST has carried out the field study during
March 2015 to May 2017.
IREL is an organization having integrated certification on ISO on 9002, 14001 & 18001.
The Environmental policy of IREL is as follows:
IREL, Chavara is committed to sustain the growth of company in the supply of beach
sand minerals & mineral products through:
Product Quality
Customer satisfaction
Prevention of pollution
Conservation of natural resources
Compliance with legal requirements
Prevention of incidents & ill health
Safe working Environment
Page 16
1-4
Continual improvement
1.2 Resources
IREL has already obtained mining plan approval for Mineral Sands (including
Sillimanite) mineral from Indian Bureau of Mines vide Ltr.No. 279/1031/2009/BNG/1079,
Dated 25.06.2009 for the period 2011-12 to 2015-16 and from AMDER vide letter No.
AMD/MPA/3M/IREL/180Ha/2008, dated- 01.12.20 for a capacity of 2,37,150 TPA. Now IREL
submitted modified mining plan for approval to AMDER. The present study was conducted as
per the modified mining plan. The mining activity at Block IVEE involves inland mining using
dredger. The average depth of the deposit is 7.7m and the average grade is 10 to 18.85 %.
1.3 Need of the project
Based on the available mineral reserves IREL has been granted mining lease to collect
heavy mineral sand in NK Block IVEE, in Alappad, Panmana and Ayanivelikulangara in Kollam
district for an area of 180 Ha. The minable reserve of sand containing ilmenite, rutile, zircon,
sillimanite and leucoxene (brown ilmenite) is 6.025 MT as per the approved mine plan.
The mined out sand is pre concentrated and transported to IREL plant for further
separation. At the plant the mineral separation is conducted solely based on the physical
properties of the minerals, such as magnetic susceptibility, electrical conductivity, grain size,
specific gravity etc.
The mineral sand from different mining areas as well as dredged sand from DWUP site is
fed to HUP, where it is passed through a set of spirals and is separated into heavies and tailings
(lighter) fractions. The heavies are passed through Wet High Intensity Magnetic Separator
(WHIMS) to get magnetic and non-magnetic fractions.
The dewatered WHIMS magnetic fraction from HUP is dried in Fluidised Bed Drier
(FBD) and is fed to the ilmenite plant, where the conducting, Ilmenite product is separated by the
high tension separators and the non-conducting fraction, which is enriched in Monazite, is sent to
the monazite plant for further processing.
The dewatered WHIMS non-magnetic fraction from HUP is dried in another Fluidised
Bed Drier and fed to High Tension Separators in Rutile plant to get conducting fraction and non-
conducting fractions. The conducting fraction is fed to Magnetic separators to get three fractions
Page 17
1-5
viz, (1) Magnetics (ilmenite product), (2) Non-magnetics (Rutile product) and also a middlings
fraction (Leucoxene product).
The non-conducting fraction from the Rutile High Tension Separators in Rutile plant is
fed to another set of Magnetic separators. The magnetic fraction rich in Monazite content is fed
to Monazite circuit. The non-magnetic fraction is fed to the spirals circuit. The heavier fraction
from these spirals is further upgraded through Wet tables, Magnetic separators, HTS etc. to
produce Zircon product. The tailings from the spirals are treated in Kelsey Jig and wet tables to
recover Zircon. The tailings fraction from Kelsey Jig is treated in Spirals, Flotation cells etc. to
produce Sillimanite product.
1.4 Use of Minerals:
Ilmenite (FeO.TiO2) is the main raw material for the Titanium Dioxide Pigment industry. It is
used as white pigment for paints, lacquer, enamels, rayon, etc. It is also used in the welding rod
coating.
Rutile (TiO2) is used for the manufacture of TiO2 pigment, for the manufacture of welding
electrodes, titanium metal and its alloys. Titanium is very light, corrosion resistant and erosion
resistant and is used in highly corrosive environment as alloys.
Zircon (ZrO2.SiO2) is used in the production of foundry moulds, refractory bricks and crucibles,
and in the ceramic industry as opacifier. Zirconium alloys are used for nuclear power reactors
and as jet engine parts in Aircraft industry in the manufacture of surgical instruments, high
intensity electric arc lamp etc.
Monazite (Ce, Y, La, Th (PO4)) is a phosphate of rare earths with variable amounts of thorium
usually combined with silicate or phosphate. Thorium is largely used as a breeder in the Nuclear
Reactors. Mixtures of rare earths are used in glass polishing, arc carbons, flint for lighters. They
are used in optical lenses, prisms, television tubes, faceplates etc.
Sillimanite (Al2O3.SiO2): This finds the largest application in the manufacture of refractory
products for lining furnaces and it is also used in ceramic industry.
1.5 Scope of the present study
The scope of study includes detailed characterization of the Environmental status in
respect of environmental components viz. air, noise, water, traffic, ecological and socio-
economic components covering an area of 10 km radius from the project site with the boundary
Page 18
1-6
of mine lease as its central nodal point. Thus the study area comprises the central nodal point and
its surrounding area within 10 km radius.
1.6 Terms of reference
1.6.1 Objective
The objective of the study is to identify the environmental impacts on the lease areas due
to the proposed enhanced dredge mining activity. The study will identify the existing
environmental conditions, predict impacts and suggest environmental safeguards and develop
post project monitoring programme to ensure environment friendly mining and transportation of
the concentrate.
The above objectives are planned to be completed in three main steps as detailed below:
Determination of current environmental baseline conditions;
Assessment of impacts on the environment due to proposed activities
Preparation of EIA document delineating mitigation measures, environmental monitoring
programme with cost.
The details of ML areas are as follows:
NK Block-IV EE : 180 ha
The detailed monitoring was carried out for one season and representative sampling is
done for other seasons for significant aspects observed. Secondary data from previous studies
were also used.
1.6.2 PLAN OF APPROACH AND METHODOLOGY
The study comprises of Environmental Impact Assessment, Environmental Management
Plan as per the Guidelines and norms laid down by the Ministry of Environment EIA notification
2006 applicable for mining projects.
The buffer zone is 10 kilometers all around the periphery of the core zone (ML area). The
scope of services includes literature survey, field studies, impact assessment and preparation of
the EIA document.
The significant areas of a sand / dredge mining include air emissions due to
transportation, change in land use, noise generation, traffic, sea erosion, marine ecological
survey and social impact assessment including R&R. Other minor aspects include geology
indicating seismic zone, water body ecology, flora & fauna, surface drainage pattern, vehicular
Page 19
1-7
traffic density, hydrology, baseline meteorology and occupational safety and health and radiation
studies. Based on the data collected, Coastal Regulation Zone map issued from NCESS and
mining plan, the impacts on air, water, noise, land, socio-economic environment and ecology are
assessed. For mitigation of adverse impacts, an Environmental Management Plan is prepared.
For monitoring of critically affected parameters, environmental monitoring programme is
designed. Rehabilitation & Resettlement plan as per the approved IRE pattern are also
formulated.
NIIST has engaged a (1) Mining engineer with valid license as RQP from Indian Bureau
of Mines, Government of India (2) Geologist having experience in geological mapping and
mineral surveys (3) Sociologist / NGO group with more than 5-year experience in carrying out
Social Impact Assessment studies for the mine leases (4) Ecologists and (5) Marine Ecologist for
carrying out aquatic ecological survey of TS canal and the Arabian sea. Based on the TOR
submitted, the following studies were carried out as part of the project.
1.6.3 Baseline Meteorological and Air Quality data
Although dredge mining with electrically driven dredges has little impact on air quality, the
existing ambient air quality of the area is important for evaluating the overall impact of mining.
Baseline air quality data available with adjacent mine (KMML) are also used for analysis.
Secondary data available with IRE/KMML/PCB are also collected and compiled in the report.
In the absence of stack (point emission source) the ambient air quality is expected to be
affected only in and around mining areas and transportation routes up to a limited distance
depending on wind speeds / direction.
Wind rose pattern was plotted season wise based on Trivandrum IMD data. Data on
temperature, relative humidity were also recorded during the study period. Two ambient air
quality monitoring stations were installed in the core zone and one in the mine lease area. The
predominant wind direction is determined by studying the wind rose pattern in the study area.
The samples were collected and analyzed as per IS:5182 guidelines. The monitoring was
done for four months (twice a week) covering one season.
Page 20
1-8
Landuse
For the ML area, land use patterns were classified into the following land use/land cover
categories from the maps and GIS analysis
Build up area
Agricultural land
Forest
Waste Land
Water bodies
Mining
Others.
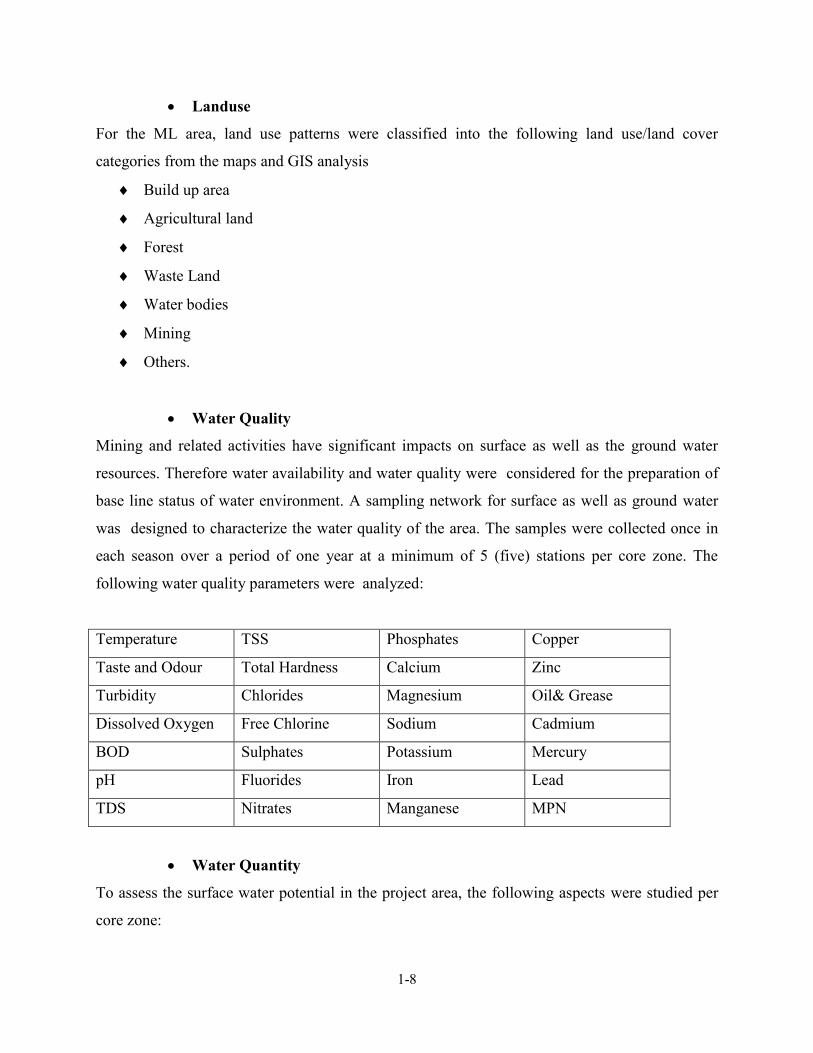
Water Quality
Mining and related activities have significant impacts on surface as well as the ground water
resources. Therefore water availability and water quality were considered for the preparation of
base line status of water environment. A sampling network for surface as well as ground water
was designed to characterize the water quality of the area. The samples were collected once in
each season over a period of one year at a minimum of 5 (five) stations per core zone. The
following water quality parameters were analyzed:
Temperature TSS Phosphates Copper
Taste and Odour Total Hardness Calcium Zinc
Turbidity Chlorides Magnesium Oil& Grease
Dissolved Oxygen Free Chlorine Sodium Cadmium
BOD Sulphates Potassium Mercury
pH Fluorides Iron Lead
TDS Nitrates Manganese MPN
Water Quantity
To assess the surface water potential in the project area, the following aspects were studied per
core zone:
Page 21
1-9
Field monitoring of well details
Hydro geological characteristics from the available literature.
Review of hydrological records/field studies and analysis
Surface water:
The contours were generated in the ML area and also distance to water bodies were l be marked
in a map .Seasonal fluctuations during summer & post monsoon season were also studied. The
water samples (surface as well as ground water samples ) from both core as well as the buffer
zone were collected, and the analytical results for both surface water and ground water were
prepared separately and interpretation of the water quality is done comparing with the drinking
water specification IS 10500 and CPCB water quality criteria.
Ground water:
. The study area falls within coastal zone where the aquifer systems discharge ground water to
the sea or estuarine portion. The intra-coastal canals and lacustrine extensions of the tidal effect
add complexity of the hydrodynamic equilibrium of the coastal tract... Seasonal fluctuations i.e.
along summer and post monsoon season were monitored .The samples were collected both from
core and the buffer zones. n.
Geology & Soil characteristics
The baseline data on geology were collected from the available literature. Regional geology
with type of ore formation are e discussed along with the tectonic history and seismicity of the
region. . The local stratigraphical sequence of the mining area is interpreted from the geological
map .The lithological sequence of the mining area is also interpreted from the existing mines,
open wells and cuttings. Geological map of the study area is prepared and geologic cross
sections (longitudinal and transverse) are drawn.
The topics such as natural and geologic features, terrain topography, geological disturbance, ore
grade, mineable reserves, production rate, estimated life of mine are detailed in the report.
Representative soil sampling in the core zone and buffer zone covering 10 kms radius from
mine lease area was conducted. The depth of sampling is dependent upon the nature of soil
profile, type of structures, land use/cover etc. The soil samples were collected at the rate of one
each representing different land use areas. Total 15 samples were e analyzed during the full
period of study. The agricultural crop in the study area is mentioned by collecting the data from
the concerned departments/agencies and limited ground truthing by field survey.
Page 22
1-10
The physical parameters that were analyzed for soil are colour, texture, water holding
capacity, Electrical conductivity, Permeability, and Porosity. The chemical properties were
include pH, Chloride, Sodium Absorption Ratio.
Demography & Socio-economics
The project is in a densely populated area and therefore social impact assessment is of major
importance. Mining activity in an area has long term irreversible impact on local, sociological,
cultural and economic situation. In order to evaluate socio-economic impact of the project, an
extensive study on the existing socio-economic status is carried out. The project also bring
benefits to local people. The displacement of people and loss of livelihood are the major
social/economic impact of the mining projects.
For the same the report l covers the following for each mine lease:
1. Demographic growth profiles and Socioeconomic status of all the villages in the
affected mine lease area
2. Collection of details of religious places and historic monuments in the mine lease
3. Determine opinions, expression on the project;
4. Assess the nature of existing resources and means of livelihood
5. Ascertaining reasons and various social and political driving forces causing complaints
and obstruction of existing and proposed activity;
6. Examine possible impact of the project on local population due to their displacement;
loss of land, and other means of livelihood .;
7. Work out mechanism for consultation with all stakeholders and influential forces in order
to address issues related to the proposed activity
8. Evolve suggestions , creative recommendations for getting the co-operation of local
communities and work out guidelines for an effective R&R of the ‘project affected
persons’ (PAPs) under focus.
9. Delineate R&R based on the result of the survey and in line with government and IREL
policy.
Terrestrial Ecology
As a part of the study the phyto-geographic region in which the relevant part of the project area
lies were identified through field studies. A one season study on inventory of the common flora
Page 23
1-11
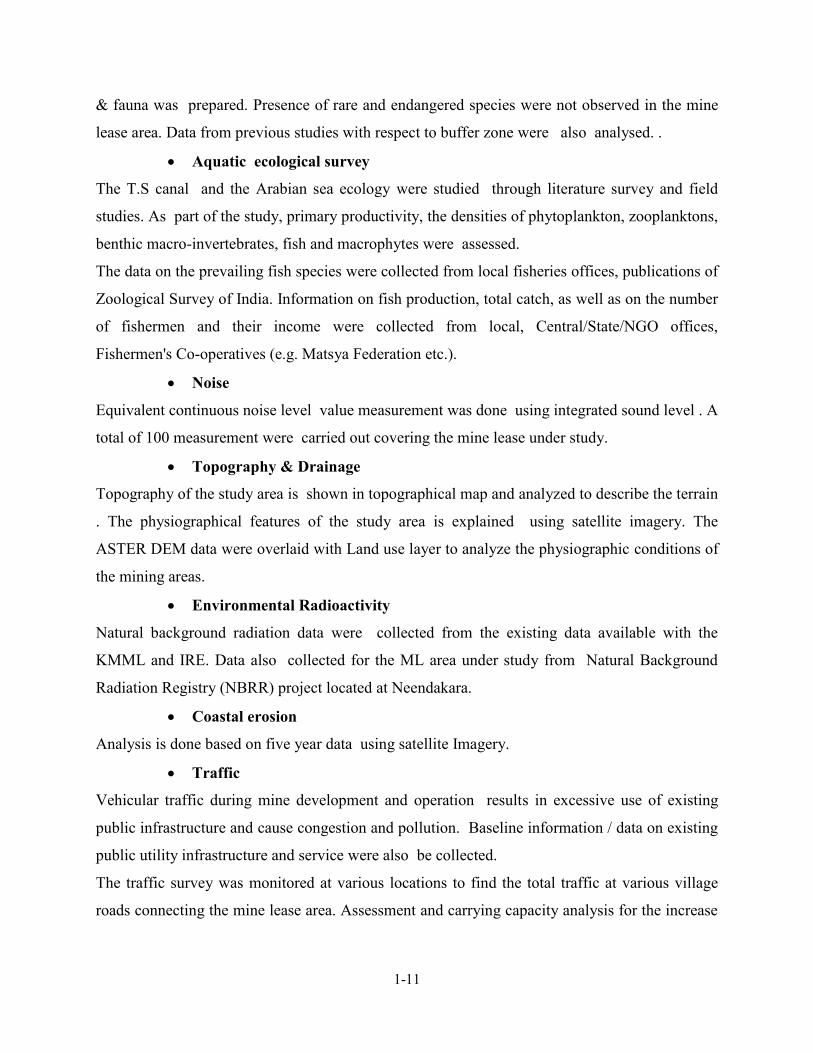
& fauna was prepared. Presence of rare and endangered species were not observed in the mine
lease area. Data from previous studies with respect to buffer zone were also analysed. .
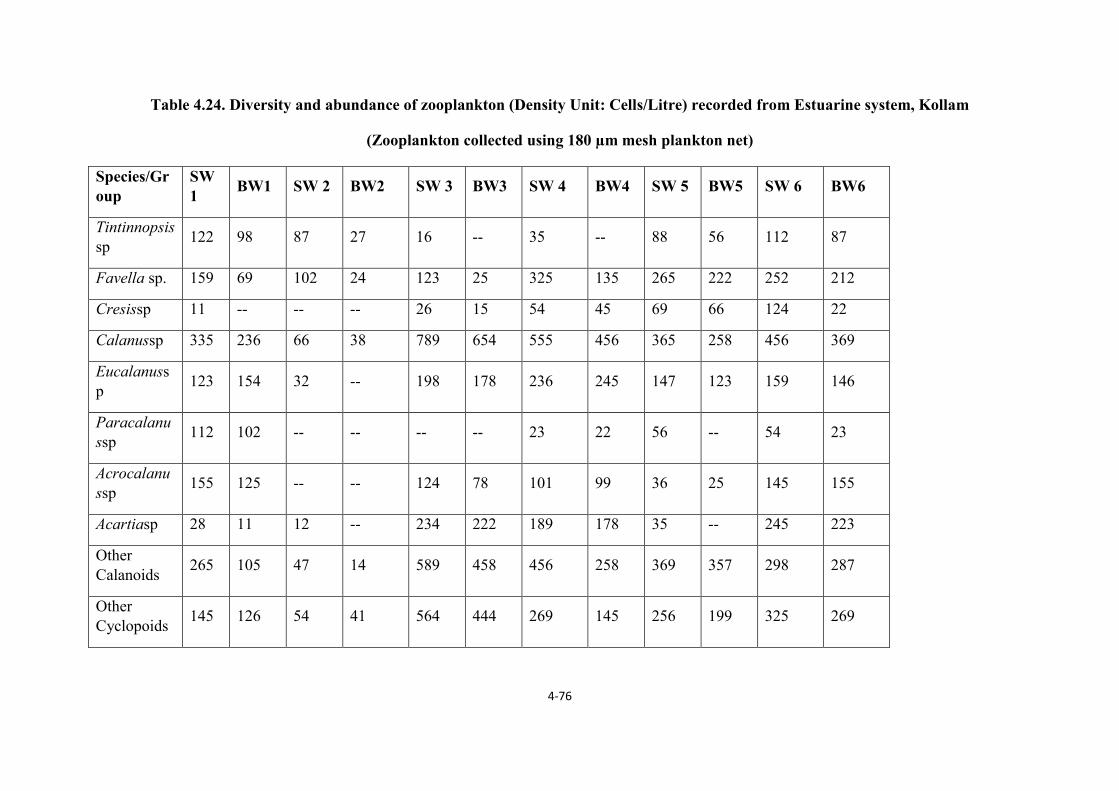
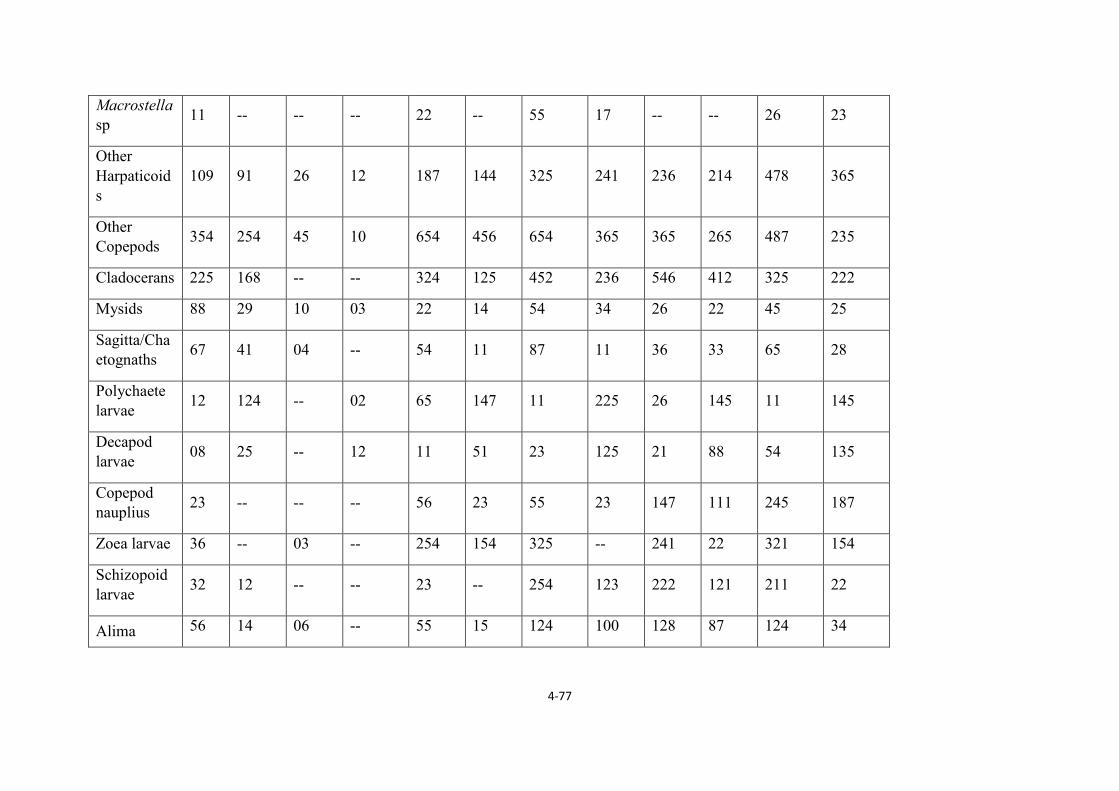
Aquatic ecological survey
The T.S canal and the Arabian sea ecology were studied through literature survey and field
studies. As part of the study, primary productivity, the densities of phytoplankton, zooplanktons,
benthic macro-invertebrates, fish and macrophytes were assessed.
The data on the prevailing fish species were collected from local fisheries offices, publications of
Zoological Survey of India. Information on fish production, total catch, as well as on the number
of fishermen and their income were collected from local, Central/State/NGO offices,
Fishermen's Co-operatives (e.g. Matsya Federation etc.).
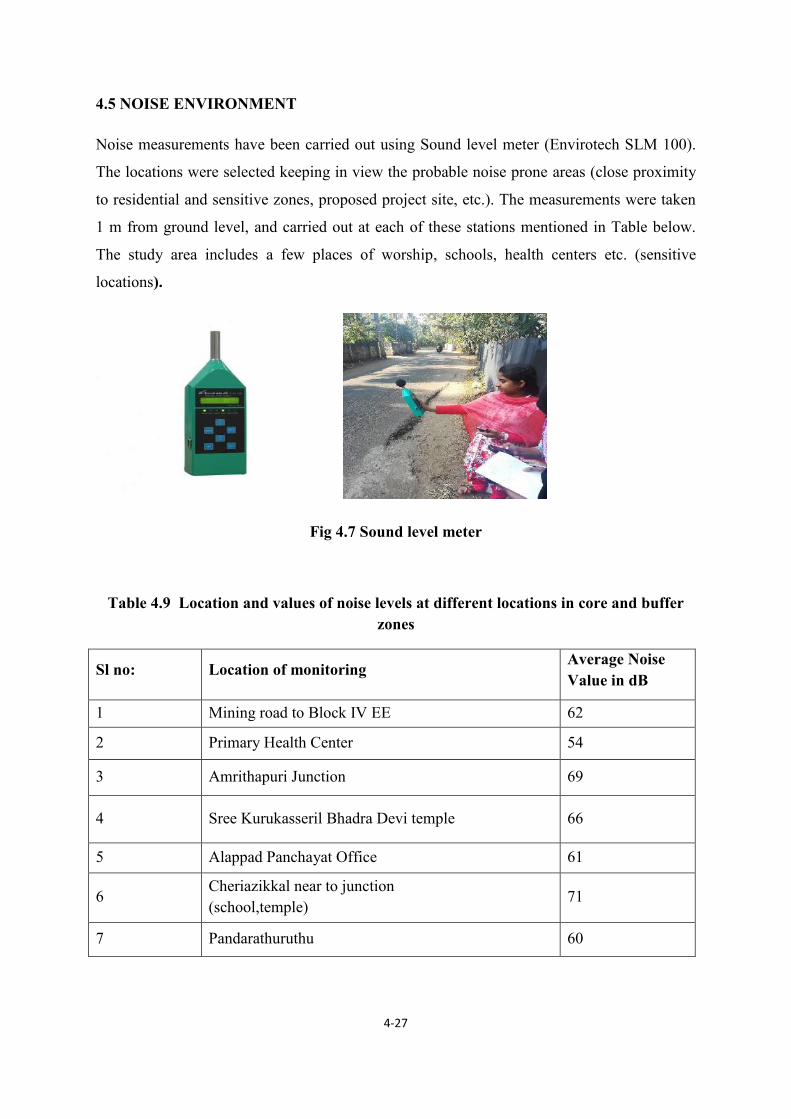
Noise
Equivalent continuous noise level value measurement was done using integrated sound level . A
total of 100 measurement were carried out covering the mine lease under study.
Topography & Drainage
Topography of the study area is shown in topographical map and analyzed to describe the terrain
. The physiographical features of the study area is explained using satellite imagery. The
ASTER DEM data were overlaid with Land use layer to analyze the physiographic conditions of
the mining areas.
Environmental Radioactivity
Natural background radiation data were collected from the existing data available with the
KMML and IRE. Data also collected for the ML area under study from Natural Background
Radiation Registry (NBRR) project located at Neendakara.
Coastal erosion
Analysis is done based on five year data using satellite Imagery.
Traffic
Vehicular traffic during mine development and operation results in excessive use of existing
public infrastructure and cause congestion and pollution. Baseline information / data on existing
public utility infrastructure and service were also be collected.
The traffic survey was monitored at various locations to find the total traffic at various village
roads connecting the mine lease area. Assessment and carrying capacity analysis for the increase
Page 24
1-12
in traffic due to the proposed mining activity is assessed. Alternate management plans were
formulated to minimize the impact due to traffic.
1.6.4 Impact Assessment
In the proposed IRE lease, the option of alternate site has little relevance since it is
mainly guided by mineral deposits. Identification of all potential environmental impacts due to a
project is an essential step of Environmental impact Assessment. These are critically examined
and major impacts (both beneficial & adverse) were further studied. In case of this particular
project activity the significant impacts are increased vehicular traffic and mining related social
impact assessment and R&R.. The nature and characteristics of impacts are taken into
consideration while evaluating the magnitude of impacts.
The impacts of the project on air, water, traffic, land use, ecology, socio-economic
environment were assessed. BEES environmental evaluation was used for evaluation of impacts.
Based on the project details, fields studies, the impacts with regard the following were assessed:
Anticipated impact on the land environment
Impact on water environment
Impact on Air environment
Impact due to vehicular traffic
Impact on beach environment
Impact on the biological environment
Impact on Noise
Impact on workers health
Impact on socio-economic environment
Social Impact Assessment
1.6.5 Environmental Management & Monitoring Plans
A management plan to mitigate the adverse impacts is suggested. Accordingly, he various
issues to be addressed are:
Dust emission control
Traffic
Sea erosion
Page 25
1-13
Land use and mine closure
Socio-economic conditions of the region
Human settlement and rehabilitation
Afforestation plans
Occupational Safety & Health
Organization and methods for environmental management
Post-project monitoring programme for critical environmental parameters
Estimation of cost required for management and monitoring plans
1.6.6 Risk Analysis and Disaster Management Plan
Risk Assessment aims at prevention of accidents and to take necessary steps to prevent it
happening. The main components that are covered in the ML will be
Protect workers in mines from accident
Prevent or reduce the incidence and severity of injury during mining operations
To respond immediately and adequately in case of an accident
1.6.7 Public Hearing
The issues raised by the people during public hearing and the response of the project
proponent together will form the final EIA report.
Page 26
1-14
1.7 Main elements of the study
The main elements of the study are:
Chapter – 1 Introduction
Chapter - 2 Project Description.
Chapter - 3 Analysis of Alternatives (Technology and Site)
Chapter – 4 Description of environment (baseline data)
Chapter - 5 Impact Analysis and Mitigation measures
Chapter - 6 Environment Monitoring Program
Chapter - 7 Additional Studies
Chapter – 8 Project Benefits
Chapter – 9 Environmental Management Plan (EMP)
Chapter – 10 Summary and Conclusions
Chapter – 11 Disclosure of Consultants
Page 27
2-1
CHAPTER -2
PROJECT DESCRIPTION
2.1 Location and Accessibility
Figure 2.1: Location map showing accessibility
Page 28
2-2
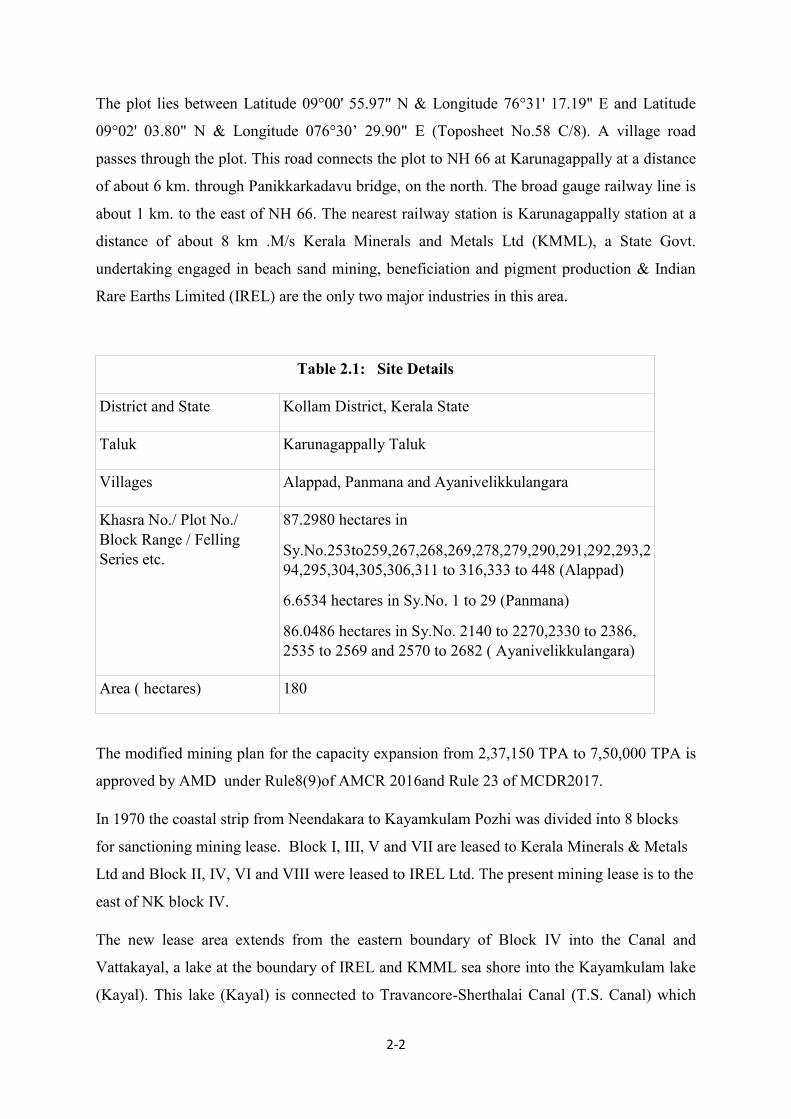
The plot lies between Latitude 09°00' 55.97" N & Longitude 76°31' 17.19" E and Latitude
09°02' 03.80" N & Longitude 076°30’ 29.90" E (Toposheet No.58 C/8). A village road
passes through the plot. This road connects the plot to NH 66 at Karunagappally at a distance
of about 6 km. through Panikkarkadavu bridge, on the north. The broad gauge railway line is
about 1 km. to the east of NH 66. The nearest railway station is Karunagappally station at a
distance of about 8 km .M/s Kerala Minerals and Metals Ltd (KMML), a State Govt.
undertaking engaged in beach sand mining, beneficiation and pigment production & Indian
Rare Earths Limited (IREL) are the only two major industries in this area.
Table 2.1: Site Details
District and State Kollam District, Kerala State
Taluk Karunagappally Taluk
Villages Alappad, Panmana and Ayanivelikkulangara
Khasra No./ Plot No./
Block Range / Felling
Series etc.
87.2980 hectares in
Sy.No.253to259,267,268,269,278,279,290,291,292,293,2
94,295,304,305,306,311 to 316,333 to 448 (Alappad)
6.6534 hectares in Sy.No. 1 to 29 (Panmana)
86.0486 hectares in Sy.No. 2140 to 2270,2330 to 2386,
2535 to 2569 and 2570 to 2682 ( Ayanivelikkulangara)
Area ( hectares) 180
The modified mining plan for the capacity expansion from 2,37,150 TPA to 7,50,000 TPA is
approved by AMD under Rule8(9)of AMCR 2016and Rule 23 of MCDR2017.
In 1970 the coastal strip from Neendakara to Kayamkulam Pozhi was divided into 8 blocks
for sanctioning mining lease. Block I, III, V and VII are leased to Kerala Minerals & Metals
Ltd and Block II, IV, VI and VIII were leased to IREL Ltd. The present mining lease is to the
east of NK block IV.
The new lease area extends from the eastern boundary of Block IV into the Canal and
Vattakayal, a lake at the boundary of IREL and KMML sea shore into the Kayamkulam lake
(Kayal). This lake (Kayal) is connected to Travancore-Sherthalai Canal (T.S. Canal) which
Page 29
2-3
passes by the side of IREL Chavara Plant. Hence, in addition to road transport, water
transport from the mining area to the plant is also feasible.
2.2 Lease Details
The lease is for the extraction of mineral sands (Ilmenite, Monazite, Rutile, Zircon,
Leucoxene and Sillimanite). Monazite rich fraction coming out of the process plant are stock
piled as per AERB guide lines at plants premises.
The lease area can be divided into the following geographical types.
2.2.1 Beach area to the east of Block IV
This area is part of the beach deposit. The land is flat and the elevation is generally within 2
meters of MSL. The area was mostly patta lands/ government purambokk lands owned by
private persons. M/s IREL has purchased part of the land and the company is in the process
of buying rest of the anticipated ML area. All the land required for commencement of mining
operation are in IREL possession. The company offers a very attractive rehabilitation
package and the company does not expect any problem in procuring the required extent of
land. Details of rehabilitation policy are indicated in chapter-5.
Table: 2.2 Year wise production details for last 5 years
Year
Raw sand production
G.O.(MS)No746/07/I
D dt08.06.2007–in
inlandareas(inlakh
tons)
Remarks
2011-12 Nil
The proposed production was not done
due to the agitation of the previous land
owners and asking for more
compensation for the lands and
employment.
2012-13 Nil
2013-14 Nil
2014-15 Nil
2015-16 Nil
Total Nil
Page 30
2-4
Figure 2.2: A view of the southern end of the leasehold
2.2.2 Canal and Lake area
About 25 % of the area is canal or lake. The canal (NW 3) area is generally shallow with
depth of 1.7 meters. NW- 3 is the project of the Inland Waterways Authority (IWA) of India,
Noida. The central and state government is interested in developing the national waterway by
maintaining depth and width for operating the cargo and passenger transportation.
Page 31
2-5
Figure 2.3: A view of the lake being dredged by National Water Way Authority for
deepening the lease area is in back ground
2.2.3 Area to the east of T.S. Canal.
This area is mainly private land used for agriculture and homestead. The area will be required
only towards the latter half of the lease period of 20 years. IRE will be buying this land as
and when required. The company offers a very attractive rehabilitation package and the
company does not expect any problem in procuring the required extent of land.
The Mineral Separation Plant (MSP) of IREL is located on the Block 2 leasehold of IRE at
about 15.4 Km from the proposed ML area and 1.5 km from the NH 66, that is Kanyakumari-
Salem Highway, and this is at 13 km from the district headquarters at Kollam and 80 km
from the capital city, Trivandrum. It has all the infrastructural facilities for operating the
mines and processing plant. Export of the minerals is through Cochin Port which is 130 KM
to the North of the IRE plant.
Page 32
2-6
Figure 2.4 : Another view of the southern parts of the leasehold
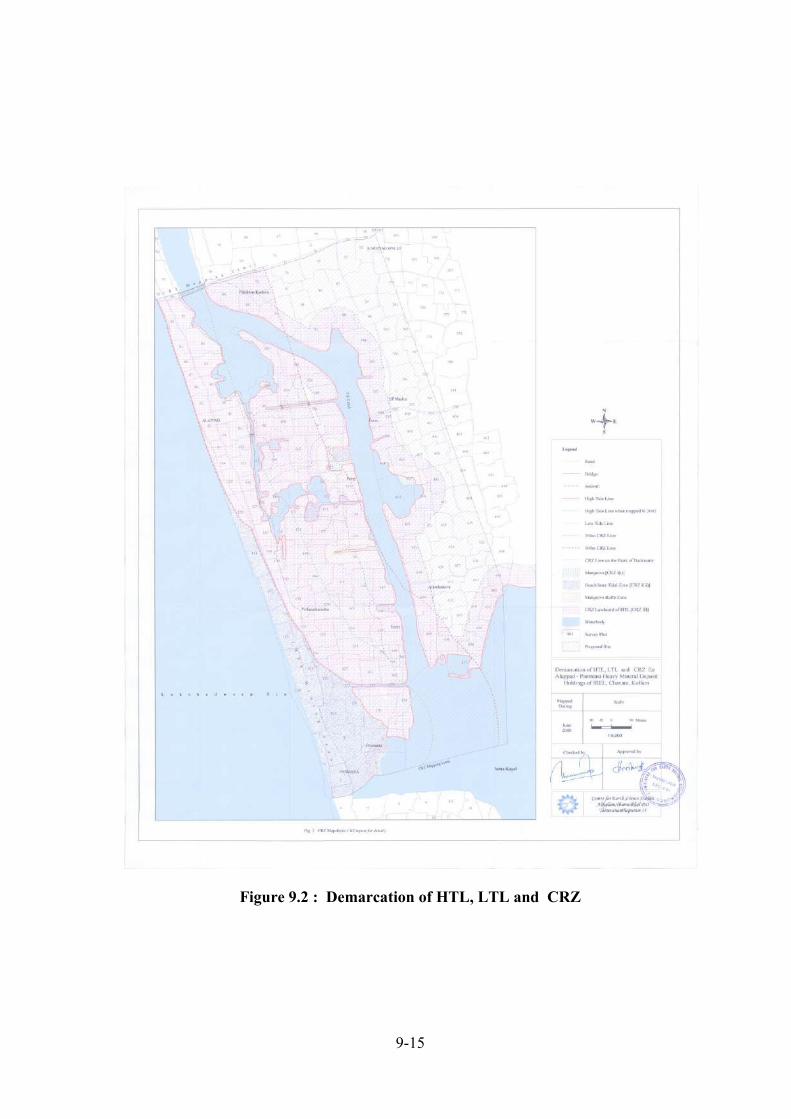
2.3 COASTAL REGULATION ZONE STATUS
The present study area is within or close to Coastal Regulation zone (MoEF, 2011) and falls
in Map No. 17 of the Coastal Zone Management Plan of Kerala (CZMP, 1995; MoEF,
1996). All the development activities in CRZ are regulated through the CRZ Notification
(MoEF,2001). The Government of India Notification [S.O.19(E) dated 6.1.2011] under
section 3(1) and section 3(2) (v) of the Environment (Protections)Rules ,1986 has defined
CRZ. The CRZ notification (2011; 1991) defines “High tide line (HTL) as the line on the
land, up to which the highest water line reaches during the spring tide”. The HTL/LTL has
to be identified based on the coastal geomorphologic signatures in the field/satellite
imageries/ aerial photographs following the guidelines of MoEF (MoEF, 2011; 1991). The
coastal zone report of the project site prepared by NCESS is appended as Annexure-9
The mining site is in Alappad, Panmana and Ayanivelikkulangara villages. The HTL, LTL
and CRZ mapping was done on large scale maps of 1:4000. The HTL and LTL are
demarcated by taking into consideration the geomorphic signatures that are discernible in
the field such as berms, mangroves, seawalls and embankments. The HTL, shoreline and
nature of beach are getting modified at the mining sites.500m landward of the HTL is the
Page 33
2-7
CRZ along the seacoast. The CRZ on the banks of kayal/backwater and canals is 100m or
width of the water body whichever is less. The CRZ categories are identified based on the
CZMP of the State and coastal ecosystems and morphologies identified during field
mapping. Being in panchayat, the CRZ except those categorized as CRZ IA, CRZ IB and
CRZ IV belongs to CRZ III. The seasonal beach and other intertidal zones are CRZ IB.
Mangrove vegetation are present as small isolated patches on the banks of backwater/canal
and these belong to CRZ IA. Mining of placer deposits rich in heavy minerals is
permissible in CRZ subject to conditions.
KCZMA has recommended the project for CRZ clearance to MoEF vide letter number
2933/A1/2018/KCZMA dated 22/10/18.
2.3 Justification for the Project
The heavy minerals have substantial demand in India and abroad. Substantial gap exists
between actual production and demand for the minerals. Chavara deposit which has heavy
mineral content as high as 60 - 80% and is the richest deposit in Asia and one of the
important beach sand deposits in the world.
Considering the important aspects, viz., meeting the internal demand, earning valuable
foreign exchange, generating additional employment and further economic development of
the region, continuation of mining and allied activities at Chavara deposit is essential and is
the need of the country.
2.5 Geology of Beach Sand Deposit
The prominent geological feature of the region is the beach sand deposits of Neendakara to
Arattupuzha coast. The coastal plain of Neendakara to Arattupuzha extends inland for several
kilometers. It is a raised marine plain and is marked by retreat dunes, which extend to inland
for some distance. The present coast is marked by a raised barrier dune behind which there is
a canal which links a series of lagoons between the tidal channels at Neendakara on the
Ashtamudi estuary and at the Kayamkulam lagoon.
Block II, where IRE's plant is located, has been divided into two major parts: the Beach zone
(consisting of the beach-front and the mid-zone) and the easterly extension.
The economically valuable minerals occur dominantly in the beach zone. Valuable minerals
extend to the west for a mile or so under the waters of the Arabian Sea (Rao 1968b) and on
Page 34
2-8
land to the east, across the coastal plains. The lease boundaries are well defined but the
reserve of heavy minerals continues eastward beyond the lease boundary also.
The beach is subjected to intermittent marine erosion and to replenishment of heavy minerals
from abundant off-shore, submarine deposits (Rao, 1968b). Hence, it is probable that
economically valuable minerals could occur intermittently for some miles to the east across
the plain. The mineralized layer is of the order of 7 m. (22ft) deep but the grades are
generally much lower than those of the beach zone.
The beach zone is very rich and grades near 90% total heavy minerals are found near the
surface. The average grade of the beach front zone is 45.7% and remaining of the zone (the
mid zone) is 38.3% heavy mineral.
The eastern extension is lower in grade with the majority of the higher grade samples around
20%. There are extensive areas of material with grades between 5 and 15% of total heavy
mineral and the average is 10.8% heavy mineral. The deposit along the sea coast is formed by
the tidal waves of the sea. The origin of the sand deposits is attributed to the weathering
action on the Archean crystalline rocks in the hinterland including the Western Ghats. The
minerals were carried down along the rivers to the sea and sorted by tidal action.
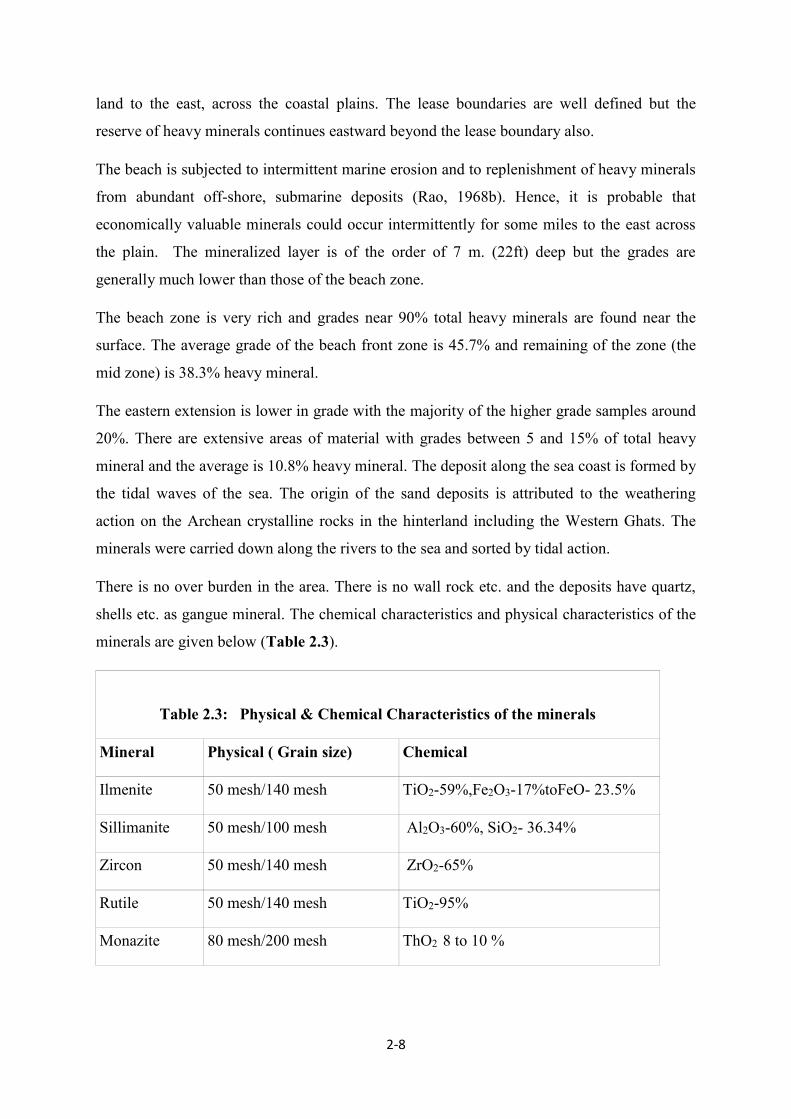
There is no over burden in the area. There is no wall rock etc. and the deposits have quartz,
shells etc. as gangue mineral. The chemical characteristics and physical characteristics of the
minerals are given below (Table 2.3).
Table 2.3: Physical & Chemical Characteristics of the minerals
Mineral Physical ( Grain size) Chemical
Ilmenite 50 mesh/140 mesh TiO2-59%,Fe2O3-17%toFeO- 23.5%
Sillimanite 50 mesh/100 mesh Al2O3-60%, SiO2- 36.34%
Zircon 50 mesh/140 mesh ZrO2-65%
Rutile 50 mesh/140 mesh TiO2-95%
Monazite 80 mesh/200 mesh ThO2 8 to 10 %
Page 35
2-9
2.6 Exploration already carried out in the area
The area was prospected by AMD in October 1981 to April 1982 under “Heavy Mineral
Investigation of Eastern Extension of Block IV, Chavara (Eastern and Western sides of TS
Canal).
A series of boreholes were drilled in the area. These are along lines spaced at a distance of 30
meters and the lines were numbered 118 to 196. In each line, boreholes were located at a
spacing of about 30 meters and named as A, B, C etc. Some of the boreholes were in the old
lease hold of Block IV and the rest in new lease area. In each bore hole, samples were taken
every 1.5 meters and the HM content was checked. The boreholes were restricted to the area
to the west of TS canal. There were 274 boreholes in the land purchased by IRE and
adjoining areas.
Based on the Heavy Mineral data of the boreholes, the weighted average of heavy mineral
content of the boreholes in the area in possession of IRE was worked out. The grid lines
from 118 to144 relate to this area, which is planned for mining in the next five years.
Weighted average of the data from the core analysis for this area is seen to be 18.85%.
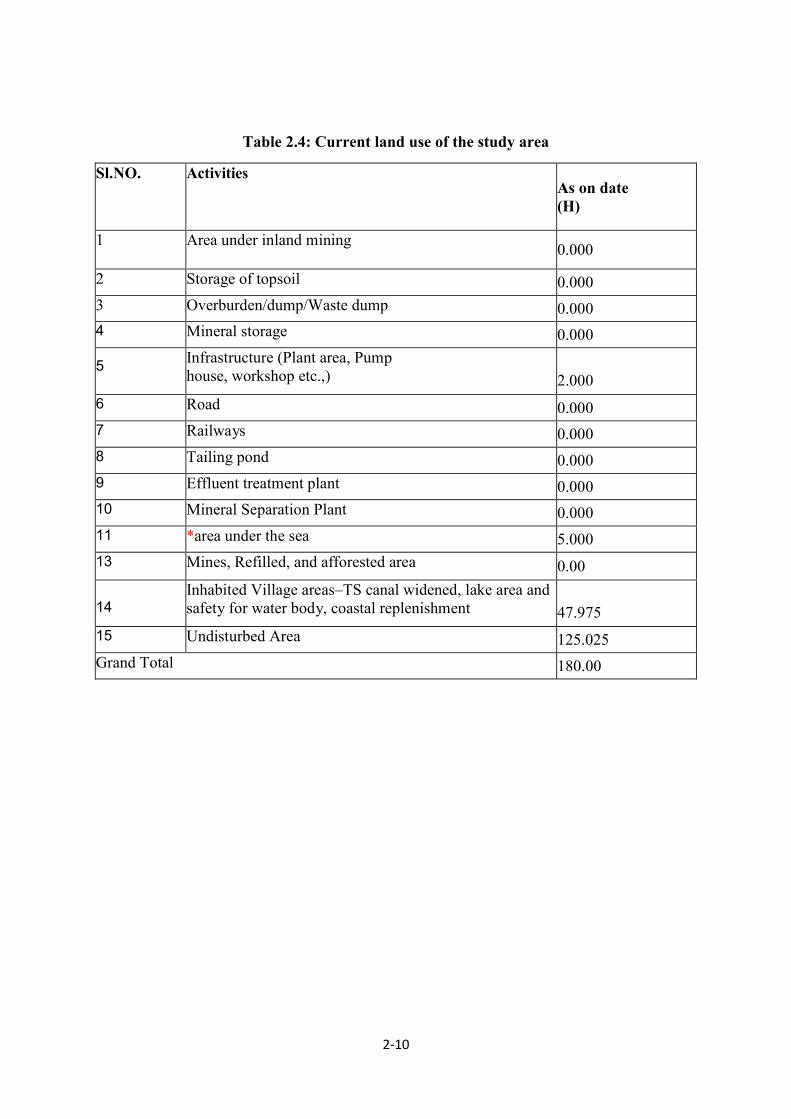
Summary of the current land usage of study area is shown in Table 2.4. Estimate of Mineral
reserves in the area in possession of IRE is shown in Table 2.5.
Page 36
2-10
Table 2.4: Current land use of the study area
Sl.NO. Activities As on date
(H)
1 Area under inland mining 0.000
2 Storage of topsoil 0.000
3 Overburden/dump/Waste dump 0.000
4 Mineral storage 0.000
5 Infrastructure (Plant area, Pump
house, workshop etc.,)
2.000
6 Road 0.000
7 Railways 0.000
8 Tailing pond 0.000
9 Effluent treatment plant 0.000
10 Mineral Separation Plant 0.000
11 *area under the sea 5.000
13 Mines, Refilled, and afforested area 0.00
14
Inhabited Village areas–TS canal widened, lake area and
safety for water body, coastal replenishment
47.975
15 Undisturbed Area 125.025
Grand Total 180.00
Page 37
2-11
Table 2.5 Mineable reserve available in Block IV EE
2.7 Mining methodology
The proposed method of mining is similar to the dredge mining conducted by the company in
Block No. 2. No development work is required here. There is no over burden. The beach
sands will be mined by open cast method. The equipment used is DWUP. The dredge has a
working length of 30 meters and width of 14 meters. A drawing of the dredge is shown below
Figure 2.5 : Dredge Operation Details
Classification Block UNFCCode Quantity (MillionTon)
Grade(%) Forest/Non Forest/ Unspecified
(A)Mineral Reserve
NK-IV(EE)
Proved Mineral
Reserve
NK-IV(EE) 111 6.025 17.62 Non-Forest
Page 38
2-12
Figure 2.6 : DWUP (Dredge and Wet Upgradation Plant) located
in the dredge pond at IRE Chavara Plant
Figure 2.7 : Heavies Discharge from DWUP at Chavara Plant
The Dredge-WUP combination has a maximum capacity of 125 TPH. However, average
capacity reached in operation is about 40 TPH. The DWUP comprises of a dredge which is
the main excavating equipment with a bucket wheel cutter mounted on a ladder lift. The
Page 39
2-13
Bucket Wheel ladder is lowered and lifted by hydraulically operated winches. The bucket
wheel and the gravel pumps are also driven hydraulically. Anchoring ropes are provided for
swinging the dredge and bucket wheel. Spud carriage ways are provided for movement of
the DWUP and also for anchoring the plant when there is no operation. The sideway
movement of the dredge is achieved by hydraulically operated slew winches. Two rear
anchors area provided for additional safety during rough weather conditions.
The pond is man-made and the pond advances by the cutting action of the dredge. The tailing
is discharged as a heap in the tailings cyclone underflow and is used for refilling the back
side of the pond. A loader is used for handling the tailings. The heavies are also discharged
outside the pond in another heap and is transported to the Chavara Plant by loader- tipper
combination. The dredge is moved to the desired direction by operation of the winches.
Estimated yearly production of raw sand is 7,50,000 tons having an average grade of 15%
THM content. During up-gradation of raw sand, the DWUP can generate about 6 to 6.6 lakh
tons of heavies having about 85 % THM content. Rest of the sand (nearly 85%) of the raw
sand mined, is rejected by the DWUP as tailings.
The area proposed for mining is shown in figure-.2.8.
Figure 2.8: A view of the area proposed to be mined
Page 40
2-14
Mineral transport can be by tipper trucks. A combination of water transport, or by means of
pumping through conduits can also be explored.
2.8 Mining Methodology Proposed for the new lease area
The entire plot has deposit of beach sand minerals. The prospecting done here has not
indicated any hard rock present upto a depth of 7.5 M below MSL. The dredge can reach
upto depth of 8m. The dredge will work in a pond of water. The pond will move forward by
the cutting action of the dredger. Rejects from the DWUP will be used for refilling the mined
out area of the pond. Hence refilling will go side by side with mining operation. The pond
with the dredger in it will traverse the entire area of the lease area, recovering Heavy
Minerals present in the sand. The refilled area will be free of HM, especially Monazite,
which is radio-active. Thus the dredging and mining of the area will reduce the radioactivity
of the area. The adjoining T.S canal is dredged periodically to maintain the depth required for
water transportation. This also generates good quantity of material that is also used for
refilling the dredge pit. There will have to be one pond dug in the area for accommodating the
dredger and hence no specific and elaborate development programme is necessary for this
project.
The mining will proceed from the southern boundary of the plot. The pond will progress as a
strip parallel to the lease boundary. The excavation during the first two years will be
2,37,150 tons of raw sand and for the coming three years it will be 7,50,000 tons. Estimated
Raw sand production is worked out in table 2.6.
Page 41
2-15
Table 2.6 Yearwise development and estimated production
Year Pit No. Total
tentative
Excavatio
n (TON)
Top
Soil
(Ton)
OB/
SB/I
B
ROM(Ton) Mineral
reject
ROM/
Waste
Ratio
Ore Mineral
Reject
1 2 3 4 5 6 7 8 9
2016
-17
NK
block
IVEE
2,37,150 Nil Nil 2,37,150 Nil Nil 1:0
2017
-18
NK
block
IVEE
2,37,150 Nil Nil 2,37,150 Nil Nil 1:0
2018
-19
NK
block
IVEE
7,50,000 Nil Nil 7,50,000 Nil Nil 1:0
2019
-20
NK
block
IVEE
7,50,000 Nil Nil 7,50,000 Nil Nil 1:0
2020
-21
NK
block
IVEE
7,50,000 Nil Nil 7,50,000 Nil Nil 1:0
27,24,300 27,24,300
Source: Mine Plan
2.9 Site infrastructure and facilities:
The Chavara processing plant which maintains all site services including Electric workshop
and Mechanical will take care of the repairs and maintenance. Main stores, fuel storage
points, hospital and canteen, cooperative store are also situated at Chavara main plant. The
workshop is fully equipped to take care of the repairs and routine maintenance etc. The
electricity is supplied by KSEB to the plant through 11 KV line. The dredge area is supplied
with power from separate grid from Kerala State Electricity Board's main 11 KV lines. The
Page 42
2-16
stores and fuel storage tanks are located at convenient locations. A hospital with two Doctors
and required number of supporting staff is also maintained in the Plant.
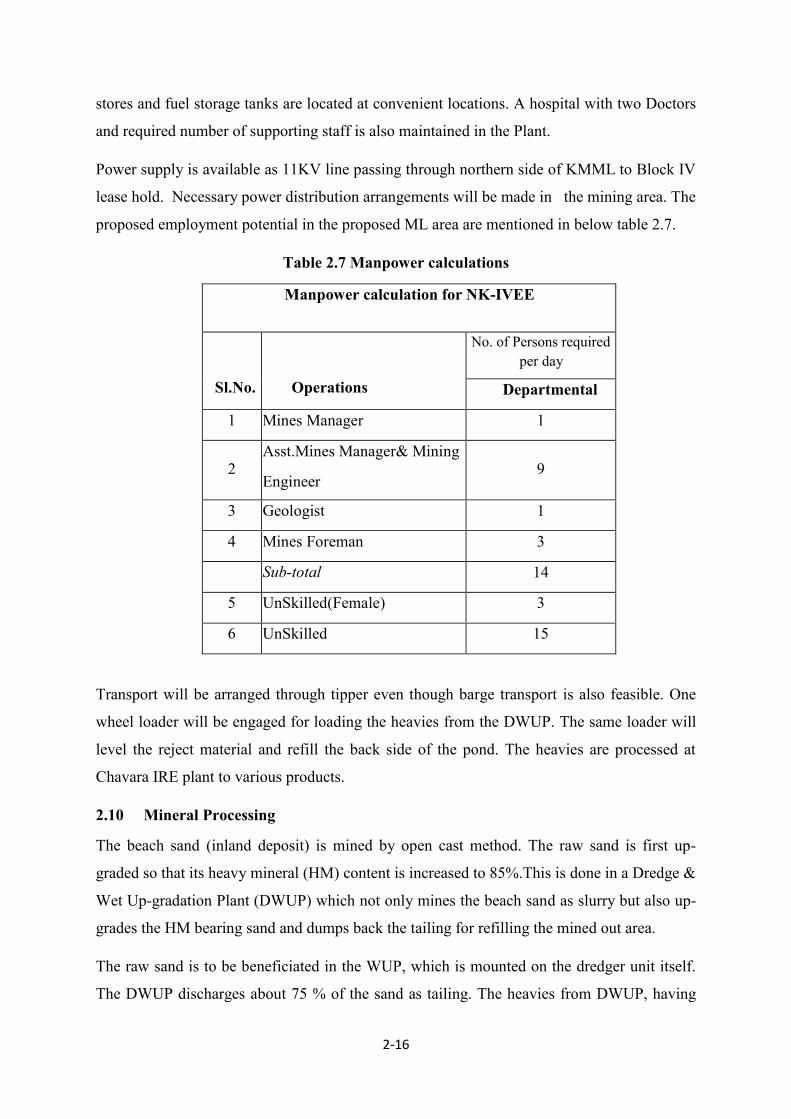
Power supply is available as 11KV line passing through northern side of KMML to Block IV
lease hold. Necessary power distribution arrangements will be made in the mining area. The
proposed employment potential in the proposed ML area are mentioned in below table 2.7.
Table 2.7 Manpower calculations
Manpower calculation for NK-IVEE
Sl.No.
Operations
No. of Persons required
per day
Departmental
1 Mines Manager 1
2 Asst.Mines Manager& Mining
Engineer
9
3 Geologist 1
4 Mines Foreman 3
Sub-total 14
5 UnSkilled(Female) 3
6 UnSkilled 15
Transport will be arranged through tipper even though barge transport is also feasible. One
wheel loader will be engaged for loading the heavies from the DWUP. The same loader will
level the reject material and refill the back side of the pond. The heavies are processed at
Chavara IRE plant to various products.
2.10 Mineral Processing
The beach sand (inland deposit) is mined by open cast method. The raw sand is first up-
graded so that its heavy mineral (HM) content is increased to 85%.This is done in a Dredge &
Wet Up-gradation Plant (DWUP) which not only mines the beach sand as slurry but also up-
grades the HM bearing sand and dumps back the tailing for refilling the mined out area.
The raw sand is to be beneficiated in the WUP, which is mounted on the dredger unit itself.
The DWUP discharges about 75 % of the sand as tailing. The heavies from DWUP, having
Page 43
2-17
THM content of 75% is discharged through the cyclone mounted on a stand/staker. The
heavies are to be transported to the Chavara Plant where it is first fed to the Heavies
Upgrading Plant (HUP). Product of HUP has about 95% HM content and it is sent to the
Mineral Separation Plant. Here the minerals are separated using their properties like magnetic
attraction, electric conductivity etc. The mineral processed in this system gives the end
products as Ilmenite, Rutile, Zircon, Sillimanite and Monazite. The separation process
ensures the purity of end products and prevents contamination of the product by any other
mineral. The water required for the Spiral Separators in the Dredge and Wet Upgradation
Plant (DWUP) is made available from the artificial pond itself in which the DWUP floats and
the water is being recycled back to the pond. The power required for the plant is supplied by
the Kerala State Electricity Board and in case of electricity failure there are two standby
generators of 1150 KVA each and one of 950 KVA to take care of the plant requirement.
The reject tailings from the DWUP as mentioned earlier will be pumped back to the mined
out area at Chavara. These will be systematically analyzed for the heavies and the mineral
content will be monitored.
2.11 Product Information
Ilmenite, Leucoxene and Rutile are minerals containing mainly TiO2 varying from around
60% to 98%. The fraction that contains an average TiO2 content of about 60% is called
Ilmenite, 75% is called Leucoxene and 98% is called Rutile.
Zircon : Zircon is Zirconium silicate - Zr O2.SiO2
Sillimanite : It is Silicate of Alumina - Al203 SiO2
Monazite : It is a complex phosphate of Thorium and Rare Earth Minerals. This is
radio active.
2.12 Physical properties
The minerals are separated by various physical means depending on their properties viz.
1. Magnetic Susceptibility
2. Electrical conductivity and
3. Specific Gravity.
Ilmenite, Leucoxene and Monazite are magnetic materials. The magnetic susceptibility of
these materials is different. Ilmenite is more magnetic and Leucoxene and Monazite are
feebly magnetic. Regarding electrical conductivity, all titanium minerals (i.e. Ilmenite,
Leucoxene and Rutile) are conducting and all others are non-conducting.
Page 44
2-18
The specific gravity the various minerals are as below: -
1. Monazite - 5.20
2. Zircon - 4.70
3. Rutile - 4.20
4. Ilmenite - 4.50
5. Leucoxene - 3.50
6. Sillimanite - 3.25
7. Quartz - 2.65
2.13 Separation of Minerals
Ilmenite: Ilmenite is the largest constituent of the raw sand. Its Magnetic Susceptibility is
more than that of Leucoxene and Monazite, which are also magnetically susceptible. Hence a
low intensity magnetic separator can separate Ilmenite.
Rutile: As Ilmenite, Leucoxene and Rutile are electrically conducting materials, these can be
separated from other minerals using High Tension Separators or Electrostatic separators. Of
these conducting materials Ilmenite is highly magnetic, Leucoxene is feebly magnetic and
Rutile is non magnetic. Ilmenite can be removed by using a low intensity magnetic separator
and the non-magnetic fraction will be Rutile.
Leucoxene: The fraction obtained as magnetics of High Intensity Magnetic Separator is
theoretically Leucoxene. This will contain Ilmenite, Rutile and a small percentage of non-
conducting. However since the Leucoxene content in raw sand is very low, this can be sent
along with Rutile without affecting the guaranteed TiO2 content of Rutile.
Flow sheet of DWUP process is shown as figure 2.9.
2.14 Mineral Recovery
The non-conducting minerals, composed of Monazite, Zircon, Sillimanite, Quartz is further
processed to separate the valuable minerals. Zircon and Sillimanite are sold as finished
products and Monazite is stored as a concentrated fraction.
Construction of separate Sillimanite plant was suggested for production of additional quantity
of Sillimanite from plant tails, which was postponed due to low market demand.
Page 45
2-19
Process flow chart
Figure 2.9: DWUP Process Flow Chart
Monazite-rich fraction is stock piled in demarcated earthen pits / trenches on Northern side of
plant beyond HUP as per the the directions from AERB/HPU for ensuring safety from
radiation. The trenches are covered using 1 m thick sand cover.
2.15 Use of Heavy Minerals
Ilmenite is used for production of titanium-di-oxide pigment which is used in paints, paper,
plastic, rubber and in the electronic industry. Naturally occurring Rutile contains 94-96%
titanium dioxide. Rutile is used for manufacture of titanium dioxide pigment, coatings of
welding electrodes and in the manufacture of titanium sponge and metal. Titanium
tetrachloride, used in the manufacture of aluminum materials is produced by chlorination of
rutile or a mixture of highly altered Ilmenite or leucoxene. Zircon is used in the manufacture
of foundry moulds, refractory bricks and crucibles and in the ceramic industry as opacifier.
Zirconium alloys are used for nuclear reactor as cladding materials for nuclear fuel and in the
aerospace industry for the manufacture of jet engine parts. Garnet is used for manufacture of
abrasives. Sillimanite is an important raw material used for manufacturing high grade
refractories and porcelain goods. Moanazite is phosphate of rare earths with variable amounts
of thorium usually combined with silicate or phosphate.Monazite is used for production of
Page 46
2-20
rare earth compounds, tri-sodium phosphate, thorium hydroxide and thorium nitrate. Thorium
is largely used as fuel in fast breeder nuclear reactors.
Page 47
3-1
CHAPTER 3
ANALYSIS OF ALTERNATIVES
There is no scope of alternative sites as this rare earth as the rare earth
minerals are available only on the coastal stretches of Kerala and concentrated on the
stretches between Neendakara and Kayamkulam.
The minable reserves of minerals in the inland area based on prospecting done
by Atomic Minerals Directorate (AMD) is around 6.02 million tons on IREL Block
IVEE.
The inland mining will be conducted for about 2,37,150 MT/year for first two
years followed by 7,50,000 million tons per year for the remaining 3 years. The THM
content of inland mining is 17.62 % and no beach washing is present in Block IV EE.
The technology adopted is conventional dredge mining. It is a wet process
and no dust pollution arises out of it. The DWUP comprises of a dredge which is the
main excavating equipment with a bucket wheel cutter mounted on a ladder lift. The
Bucket Wheel ladder is lowered and lifted by hydraulically operated winches. The
bucket wheel and the gravel pumps are also driven hydraulically. The ladder lift is
designed for a dredging depth of 6-8 metres. The concentrate of the DWUP is the
feed material for the mineral separation plant (MSP).
No major impacts are anticipated by using this technology. No drilling or
blasting is adopted in this mining project. Since there will be no subgrade material
there will be no dumps. The mining and the separation of the minerals are done by
physical processes and hence there will be no discharge of any chemicals.
The mining of radioactive mineral (Monazite containing Thorium) reduces
the radiation exposure significantly.
The heavy minerals have significant demand in India and abroad. Substantial
gap exists between actual production and demand for these minerals.
Chavara deposit is the richest deposit in Asia and one of the important beach
sand deposits in the world. Considering the important aspects, viz., meeting the
internal demand, earning valuable foreign exchange, generating additional
employment and further economic development of the region, continuation of mining
and allied activities at Chavara deposit is essential and is the need of the country.
Considering the above facts there is no scope for exploring alternate sites and
technology.
Page 48
4-1
CHAPTER 4
DESCRIPTION OF ENVIRONMENT
4.1General
The Chavara coast of Kollam district, Kerala is world famous for its rich placer deposits. The
heavy mineral content in the beach sand goes up to as high as 95%. Sand extraction by Indian
Rare Earths Ltd (IREL) and its predecessor companies has been going on at various sites
along the Chavara coast since 1930.The occurrence of rare mineral deposits is site-specific
and their exploitation does not allow any options except to adopt eco-friendly mining
operations. IREL aims to adopt environmental equilibrium by ensuring sustainable
operations.
The primary objective of an EIA Study includes determination of the present environmental
status, the study of the proposed activities specifically related to the project and evaluation of
the probable environmental impacts due to these specific activities, thus, leading to the
recommendations of necessary environmental mitigation/control measures.
An EIA Study, thus, necessarily includes collecting detailed information on the existing
environmental scenario or ‘baseline data’ and establishing related data of the proposed
activity. The project data, relevant to environmental aspects, is then superimposed on the
baseline data and the resultant environmental conditions predicted with the help of effective
predictive tools.
The EIA is, thus, a comprehensive study on environmental impacts due to proposed mining
activity, work out plans to assess and mitigate the detrimental impacts on the environment
due to proposed mining operation and other allied activities.
Some of the important aspects considered are:
1. Mine lease area (180 Ha) is the Core Zone
2. 10 km radius from the boundary limits of the mine lease area is considered as a buffer
zone.
3. Maps of the study area (core and buffer zone) showing various monitoring stations,
superimposed on locations of habitats.
Page 49
4-2
4. Monitoring and testing are done as per standard testing protocols.
5. One season (non-monsoon) primary baseline data on ambient air quality (PM10, SO2
and NOx), water quality, noise level, soil and flora and fauna were collected and the
specific meteorological data were also collected. The locations of the monitoring
stations were selected such as to represent whole of the study area and justified
keeping in view the pre-dominant direction and location of sensitive receptors. As per
TOR, there should be at least one monitoring station within 500m of the mine lease in
the pre dominant downwind direction. Base line data collected during the last three
years by CSIR-NIIST has been incorporated as a part of the report and utilized in
formation of baseline Environmental status and Environmental Management Plan.
6. NABET accredited NGO’s, empaneled experts, NABL Lab Cochin form the team for
carrying out the study in addition to functional area experts and EIA coordinator of
CSIR-NIIST.
4.2 Reconnaissance Survey of project site:
The distance to key locations (refer figure 4.2 &4.3) from the 180Ha mine lease area(north
west end) is as follows:
NH 66 at Karunagappally : 3.45 km
Kerala Minerals & Metals (KMML) : 9.34 km
Indian Rare Earths Ltd.( IREL) : 15.4 km
Kollam (district HQ) : 25 km
Thiruvananthapuram capital of Kerala: : 95.5 km
Karunagappaly town : 3.75 km
The deposit is quite rich with respect to ilmenite, rutile, and zircon and the mineral ilmenite
happens to be of weathered variety analyzing 60% TiO2. The project aims in the mining of
heavy minerals through inland mining using dredge/excavators.
Page 50
4-3
4.2.1 Key Observation:
The mining area is a human inhabited area. The beach area to the west of the new mining
lease is already subjected to collection of beach washing. Most of the people residing in the
beach zone area are of the fishermen community. The area was devastated by the 2004
tsunami. The block comprises of sensitive locations such as churches and temples, these
religious places likely to be mined subjected to some specific conditions. Company plans to
shift temples or churches to nearby acceptable places with prior permission after observing
the religious formalities. There was a similar relocation in surrounding area (Panmana Sri
Durga Devi temple, Vellanathuruth ).IREL respects people’s beliefs and company will not
indulge in any activities compromising people’s believes. The block also comprises
mangroves to a smaller extent, covering an area of 2.73 Ha
Page 51
4-4
Fig 4.1: Block IV EE lease area (Core Zone)
Page 52
4-5
Fig 4.2 Buffer zone of the study area (IREL Block IVEE)
Page 53
4-6
4.3 Aspects studied
The major environmental disciplines studied include geology, soils, hydrology, meteorology,
landuse, surface and groundwater quality, air quality, noise quality terrestrial and aquatic
ecology, demography and socioeconomics. The radiation data are generated during August
2017 by BARC and this is incorporated in the study. The Report consists of field data
generated over a period from September 2013, (from date of signing of agreement) to
December 2017 along with relevant data collected from various agencies on the above
disciplines. The data and observations carried out in adjacent mining lease of IREL, KMML
which is in the buffer zone is also considered for preparation of impacts and mitigation
measures. The present block have already got EC in the year 2011, the current project is an
expansion project and hence for the present report previous studies data were also considered.
4.3.1Micro-Meteorological Status:
The climate of Kerala, as per Koppen's classification, is tropical monsoon with seasonally
excessive rainfall and hot summer. The entire state is classified as one meteorological
subdivision for climatological purposes. The year is divided into four seasons. The period
March to the end of May is the hot season. This is followed by Southwest Monsoon season
that continues till the beginning of October. From October to December is the Northeast
Monsoon season and the two months (January & February) period is considered as winter
season. The climate is pleasant from September to February. Summer months March to May
is uncomfortable due to high temperature and humidity. The State is extremely humid due to
the existence of Arabian Sea in the west.
The mine lease area which comes in Kollam district has a tropical humid climate, with an
oppressive summer. The hot season from March to May is followed by the southwest
monsoon season from June to September. October - November may be termed the post-
monsoon or the retreating monsoon season. December to February is the northeast monsoon
season. (Source: ENVIS Centre: The Kerala State of Environment and Related Issues)
Page 54
4-7
Rainfall
The total annual rainfall in the State varies from 360 cm over the extreme northern parts to
about 180 cm in the southern parts. The southwest monsoon (June-October) is the principal
rainy season when the State receives about 70% of its annual rainfall. Monsoon rainfall as
percentage of annual rainfall decreases from north to south and varies from 83 % in northern
district of Kasaragod to 50% in the southern district of Thiruvananthapuram. Northeast
monsoon rainfall as percentage of annual rainfall increases from north to south and varies
from 9% in north most district of Kasaragod to 27% in south most district of
Thiruvananthapuram. The rainfall amount in the State decreases towards the south with
decrease of height of Western Ghats. The southernmost district of Thiruvananthapuram
where Western Ghats are nearest to the sea coast and its average height is also least in the
State receives minimum amount of rainfall. The thunderstorm rains in the pre-monsoon
months of April and May and that of monsoon months are locally known as 'EDAVAPATHI'.
Rainfall during northeast monsoon season is known as 'THULAVARSHAM' in local
language.
The southwest monsoon sets-over the study area situated at Kollam tentatively on 1st June
and extends over the entire State by 5th June. June and July are the rainiest months, each
accounting individually to about 23% of annual rainfall. The average level of annual rainfall
is quite high when compared to other Indian states. The study area /Kerala does not have
extreme climatical variations like acute summer or acute winter as experienced in northern
states. The study area experiences 4 types of climatic conditions such as winter, summer,
South West Monsoon and North East Monsoon.
Rainfall data collected from the nearest IMD station of the mine lease (Alappuzha) are given
intable 4.1. Owing to its position near the southern end of the Peninsula, the lease area
benefits from the southwest monsoon and to a lesser extent from the northeast monsoon.
Rains mostly in the form of thunderstorm occur in the summer and in the post-monsoon
months constitute a good portion of the annual total of rainfall.
Page 55
4-8
Table 4.1 Rainfall data
Month Total rainfall (mm)
Temperature (o C)
Maximum Minimum
Oct-14 203.0 31.8 24.4
Nov-14 135.6 31.5 24.1
Dec-14 35.1 31.7 24.2
Jan-15 11.0 32.3 23.5
Feb-15 4.2 33.2 24.0
Mar-15 61.9 33.9 25.3
Apr-15 160.6 33.9 25.4
May-15 184.2 33.4 26.5
Jun-15 451.7 31.9 25.3
Jul-15 283.6 31.3 24.5
Aug-15 274.3 32.4 24.7
Sep-15 258.0 33.4 25.1
Oct-15 349.6 32.4 24.6
Source: IMD, Trivandrum
Temperature
Day temperatures are more or less uniform over the plains throughout the year except during
monsoon months when these temperatures drop down by about 3 to 5°C. Both day and night
temperatures are lower over the plateau and at high level stations than over the plain. Day
temperatures of coastal places are less than those of interior places. March is hottest month
with a mean maximum temperature of about 33°C. Mean maximum temperature is minimum
in the month of July when the State receives plenty of rainfall and the sky is heavily clouded.
Page 56
4-9
It is 28.5°C for the State as a whole in July, varying from about 28°C in the north to about
29°C in the South. Inland stations experience higher maximum temperatures than the coastal
stations. From May onwards both the maximum and minimum temperatures start falling.
Daily maximum and minimum temperature from October 2014 to October 2015 were
collected from Indian Meteorological Department (IMD) monitoring station at Alappuzha.
The months March, April, and May are the hottest and the mean daily maximum temperature
being of the order of 32.5oC On certain days the maximum temperature reached 33.9oC. In
April and May, the oppressive heat is relieved by thundershowers. With the onset of the
monsoon by the end of May, weather becomes cooler. After September, the day temperature
increases gradually till they reach a maximum in the hot season. The average daily minimum
temperature is 23.5oC.
CSIR NIIST conducted a field study during the period of March-April 2008 for IRE to
evaluate the environmental aspects and their possible associated impacts that would arise due
to the proposed heavy mineral sand mining operations, in the same area. In the study,
meteorological data from Thiruvananthapuram observatory was analyzed and found that
temperature variations through the seasons were fairly uniform. March, April and May are
the hottest months, the mean daily maximum temperature being of the order of 30.5oC. On
some days the maximum may reach 36oC. In April and May, the oppressive heat is relieved
somewhat by thundershowers. With the onset of the monsoon by the end of May weather
becomes cooler. After September, the day temperature increases gradually till they reach
maximum in the hot season. The average daily minimum temperature during December to
February is 22.6 oC. On some individual days in this season the minimum may be lower by
three or four degrees.
Humidity
The State stretches from north to south with the Arabian Sea in its west, relative humidity is
in general high over the State. In the period January to March afternoon humidity reduce to
60-63%, varying from 35% in the interior to 71 % in the coastal area. The diurnal variation in
relative humidity during this period is maximum and ranges from 4 to 16%, depending upon
the proximity of the sea. The relative humidity in the monsoon period rises to about 85% for
the state. The variation in this period is minimum.
Page 57
4-10
The air is highly humid practically all the year round in mine lease area, the relative humidity
being over 78.93%. Daily relative humidity from October 2014 to October 2015 was
collected from IMD, Alappuzha station. The relative humidity during the months of
December to May is slightly less than that during the rest of the year. The average monthly
relative humidity is given in table 4.2.
Table 4.2 Average monthly Relative humidity
Month Relative humidity (%)
Oct-14 89.19
Nov-14 87.97
Dec-14 83.26
Jan-15 79.74
Feb-15 78.93
Mar-15 82.77
Apr-15 82.47
May-15 85.26
Jun-15 89.77
Jul-15 92.45
Aug-15 91.84
Sep-15 90.53
Oct-15 92.45
Page 58
4-11
Cloudiness
Skies are heavily clouded or overcast on most of the days in the monsoon months and to a
lesser extent in the post-monsoon months. In the summer and post-monsoon months,
cloudiness generally increases in the afternoons. During the rest of the year, skies are
generally clear.
Winds
The winds over the State are seasonal only in the region of Palakkad Gap where winds are
predominantly from the east in the period from November to March and from west in the rest
of the year. In other parts of the State flow of wind is mainly governed by differential heating
of land and water mass together with mountain winds. Winds have westerly component
during the day and easterly components during the night throughout the year. In general
winds are quite strong during afternoons when the thermal circulation is best developed and
weak during night.
Wind direction and wind speed were measured at site monitoring station by NCESS. Hourly
wind speed and direction for a period of 12 months were monitored. The wind rose diagrams
have been plotted for the site on a seasonal basis from the wind data collected on site for the
duration December 2014 to December 2015 is presented in figures 4.3, 4.4, 4.5.
Fig 4.3 Wind rose –post-monsoon (October 2015 to Nov 2015)
Page 59
4-12
Fig 4.4 Wind rose – Winter (December 2014 to March 2015)
Fig 4.5 Wind rose – Summer (April 2015 to June 2015)
Page 60
4-13
4.4 AIR ENVIRONMENT
Ambient air quality monitoring was carried out at four stations considering the downwind,
crosswind, categorization of the area as per land use. The parameters monitored were PM10,
SO2 and NOx. The locations include mine lease area, sensitive location, residential area and
rural area. The air monitoring details are shown in table 4.3
Fig:4.6 PM10 monitoring stations
Page 61
4-14
Table 4.3: Ambient air quality data of core and buffer zone:
Sl.no Date Location/Sampler
I.D
PM10
SOX NOX
µg/m3 µg/m3 µg/m3
1 22/02/17-23/02/17
Kozhikode/S.4
49 10 12
2 23/02/17-24/02/17 48 < 10 < 10
3 02/03/17-03/03/17 51 < 10 < 10
4 03/0317-04/13/17 52 < 10 < 10
5 09/03/17-10/03/17 39 < 10 < 10
6 10/03/17 -11/03/17 42 < 10 < 10
7 17/03/17-18/03/17 41 < 10 < 10
8 18/03/17-19/03/17 36 < 10 < 10
9 21/03/17-22/03/17 40 BDL < 10
10 22/03/17-23/03/17 42 < 10 < 10
11 29/03/17-30/03/17 38 < 10 < 10
12 30/03/17-31/03/17 40 < 10 < 10
13 06/04/17-07/04/17 44 < 10 < 10
14 07/04/17-08/04/17 41 < 10 < 10
15 13/04/17-14/04/17 39 < 10 < 10
16 14/04/17-15/04/17 49 < 10 < 10
17 18/04/17-19/04/17 51 < 10 < 10
18 19/04/17-20/04/17 48 < 10 < 10
19 26/04/17-27/04/17 49 < 10 < 10
20 27/04/17-28/04/17 52 < 10 < 10
21 01/05/17-02/05/17 48 < 10 < 10
Page 62
4-15
22 02/05/17-03/05/17 46 < 10 < 10
23 11/05/17-12/05/17 48 < 10 < 10
24 12/05/17-13/05/17 51 < 10 < 10
25 18/08/17-19/05/17 48 < 10 < 10
26 19/05/17-20/05/17 46 < 10 < 10
27 24/05/17-25/05/17 38 < 10 < 10
28 25/05/17-26/05/17 36 < 10 < 10
Sl.no Date Location/Sampler
I.D
PM10
SOX NOX
µg/m3 µg/m3 µg/m3
1 22/02/17-23/02/17
Cheriazeekal S.2
66 10 12
2 23/02/17-24/02/17 52 < 10 < 10
3 02/03/17-03/03/17 58 < 10 < 10
4 03/0317-04/13/17 56 < 10 < 10
5 09/03/17-10/03/17 42 < 10 < 10
6 10/03/17 -11/03/17 44 < 10 < 10
7 17/03/17-18/03/17 44 < 10 < 10
8 18/03/17-19/03/17 42 < 10 < 10
9 21/03/17-22/03/17 36 BDL < 10
10 22/03/17-23/03/17 46 < 10 < 10
11 29/03/17-30/03/17 58 < 10 < 10
12 30/03/17-31/03/17 58 < 10 < 10
13 06/04/17-07/04/17 59 < 10 < 10
14 07/04/17-08/04/17 60 < 10 < 10
15 13/04/17-14/04/17 52 < 10 < 10
16 14/04/17-15/04/17 60 < 10 < 10
17 18/04/17-19/04/17 64 < 10 < 10
18 19/04/17-20/04/17 66 < 10 < 10
Page 63
4-16
19 26/04/17-27/04/17 58 < 10 < 10
20 27/04/17-28/04/17 No reading
Instrument
not
working
< 10 < 10
21 01/05/17-02/05/17 60 < 10 < 10
22 02/05/17-03/05/17 58 < 10 < 10
23 11/05/17-12/05/17 52 < 10 < 10
24 12/05/17-13/05/17 64 < 10 < 10
25 18/08/17-19/05/17 56 < 10 < 10
26 19/05/17-20/05/17 54 < 10 < 10
27 24/05/17-25/05/17 48 < 10 < 10
28 25/05/17-26/05/17 38 < 10 < 10
Page 64
4-17
Sl.no Date Location/Sampler
I.D
PM10
SOX NOX
µg/m3 µg/m3 µg/m3
1 22/02/17-23/02/17
PHC
VELLANATHURU
THU/S.1
61 <10 <10
2 23/02/17-24/02/17 44 <10 <10
3 02/03/17-03/03/17 51 <10 <10
4 03/0317-04/13/17 53 <10 <10
5 09/03/17-10/03/17 48 <10 <10
6 10/03/17 -11/03/17 44 <10 <10
7 17/03/17-18/03/17 41 <10 <10
8 18/03/17-19/03/17 38 <10 <10
9 21/03/17-22/03/17 37 <10 <10
10 22/03/17-23/03/17 44 <10 <10
11 29/03/17-30/03/17 58 < 10 < 10
12 30/03/17-31/03/17 56 < 10 < 10
13 06/04/17-07/04/17 60 < 10 < 10
14 07/04/17-08/04/17 62 < 10 < 10
15 13/04/17-14/04/17 58 < 10 < 10
16 14/04/17-15/04/17 63 < 10 < 10
17 18/04/17-19/04/17 62 < 10 < 10
18 19/04/17-20/04/17 63 < 10 < 10
19 26/04/17-27/04/17 58 < 10 < 10
20 27/04/17-28/04/17 61 < 10 < 10
21 01/05/17-02/05/17 58 < 10 < 10
22 02/05/17-03/05/17 56 < 10 < 10
Page 65
4-18
23 11/05/17-12/05/17 48 < 10 < 10
24 12/05/17-13/05/17 62 < 10 < 10
25 18/08/17-19/05/17 52 < 10 < 10
26 19/05/17-20/05/17 50 < 10 < 10
27 24/05/17-25/05/17 46 < 10 < 10
28 25/05/17-26/05/17 36 < 10 < 10
Sl.no Date Location/Sampler I.D PM10
SOX NOX
µg/m3 µg/m3 µg/m3
1 22/02/17-23/02/17
NEAR
AMRITHANANTHA
MAYI MADAM
(S3)
52 < 10 < 10
2 23/02/17-24/02/17 48 < 10 < 10
3 02/03/17-03/03/17 54 < 10 < 10
4 03/0317-04/13/17 48 < 10 < 10
5 09/03/17-10/03/17 42 < 10 < 10
6 10/03/17 -11/03/17 44 < 10 < 10
7 17/03/17-18/03/17 44 < 10 < 10
8 18/03/17-19/03/17 42 < 10 < 10
9 21/03/17-22/03/17 42 BDL < 10
10 22/03/17-23/03/17 44 < 10 < 10
11 29/03/17-30/03/17 42 < 10 < 10
12 30/03/17-31/03/17 45 < 10 < 10
13 06/04/17-07/04/17 48 < 10 < 10
14 07/04/17-08/04/17 51 < 10 < 10
15 13/04/17-14/04/17 46 < 10 < 10
16 14/04/17-15/04/17 54 < 10 < 10
17 18/04/17-19/04/17 60 < 10 < 10
18 19/04/17-20/04/17 58 < 10 < 10
Page 66
4-19
19 26/04/17-27/04/17 52 < 10 < 10
20 27/04/17-28/04/17 49 < 10 < 10
21 01/05/17-02/05/17 52 < 10 < 10
22 02/05/17-03/05/17 51 < 10 < 10
23 11/05/17-12/05/17 51 < 10 < 10
24 12/05/17-13/05/17 48 < 10 < 10
25 18/08/17-19/05/17 48 < 10 < 10
26 19/05/17-20/05/17 46 < 10 < 10
27 24/05/17-25/05/17 42 < 10 < 10
28 25/05/17-26/05/17 44 < 10 < 10
Table:4.4 Comparison of ambient air quality (PM10) of the four sampling locations:
S.No. Location Mean Minimum Maximum
1. Kozhikode 45 38 52
2. Cheriazeekal 54 36 66
3. Primary Health Centre
Vellanathuruth
53 36 63
4. Amrithananthamayi Madam 49 42 60
Page 67
4-20
Table 4.5 Ambient Air Quality Monitoring carried out in buffer zone: Feb to April 2016
Sl.no Date Location PM10
SOX NOX
µg/m3 µg/m3 µg/m3
1 3/02/16
KMML
guest house
63 10 12
2 12/02/16 55 < 10 < 10
3 13/02/16 68 < 10 < 10
4 25/02/16 70 < 10 < 10
5 26/02/16 58 < 10 < 10
6 1/03/16 52 < 10 < 10
7 3/03/16 68 < 10 < 10
8 4/03/16 61 < 10 < 10
9 10/03/16 52 BDL < 10
10 11/03/16 60 < 10 < 10
11 15/03/16 62 < 10 < 10
12 16/03/16 62 < 10 < 10
13 22/03/16 65 < 10 < 10
14 23/03/16 68 < 10 < 10
15 29/03/16 65 < 10 < 10
16 30/03/16 70 < 10 < 10
17 05/04/16 62 < 10 < 10
18 06/04/16 64 < 10 < 10
19 12/04/16 66 < 10 < 10
20 13/04/16 69 < 10 < 10
Page 68
4-21
Sl.no Date Location PM10
µg/m3
SOX
µg/m3
NOX
µg/m3
1` 3/02/16
M.S Plant
(KMML)
66 < 10 11
2 12/02/16 43 < 10 10
3 13/02/16 85 12 14
4 25/02/16 73 11 12
5 26/02/16 56 < 10 < 10
6 1/03/16 64 11 13
7 03/03/16 65 BDL < 10
8 4/03/16 54 < 10 < 10
9 10/03/16 55 < 10 < 10
10 11/03/16 48 BDL < 10
11 15/03/16 49 < 10 < 10
12 16/03/16 52 < 10 10
13 22/03/16 60 < 10 10
14 23/03/16 60 < 10 10
15 29/03/16 55 < 10 < 10
16 30/03/16 55 < 10 < 10
17 05/04/16 55 < 10 11
18 06/04/16 56 < 10 10
19 12/04/16 58 < 10 < 10
20 13/04/16 60 < 10 12
21 19/04/16 58 < 10 12
22 20/04/16 62 < 10 10
23 26/04/16 60 < 10 10
24 27/04/16 55 12 14
Page 69
4-22
Sl.no Date Location PM10
µg/m3
SOX
µg/m3
NOX
µg/m3
1 3/2/16
IREL GUEST
HOUSE
81 < 10 < 10
2 12/02/16 65 < 10 < 10
3 13/02/16 58 < 10 10
4 25/02/16 48 < 10 10
5 26/02/16 46 < 10 12
6 1/03/16 40 10 12
7 3/03/16 44 < 10 11
8 4/03/16 50 < 10 < 10
9 10/03/16 40 < 10 < 10
10 11/03/16 48 < 10 12
11 15/03/16 52 < 10 12
12 16/03/16 48 < 10 10
13 22/03/16 52 < 10 11
14 23/03/16 53 < 10 10
15 29/03/16 53 < 10 12
16 30/03/16 56 10 12
17 05/04/16 50 < 10 10
Page 70
4-23
18 06/04/16
IREL GUEST
HOUSE CONT.
52 < 10 10
19 12/04/16 55 < 10 < 10
20 13/04/16 58 < 10 10
21 19/04/16 56 < 10 11
22 20/04/16 55 < 10 10
23 26/04/16 55 < 10 11
24 27/04/16 56 < 10 10
Sl.no Date Location PM10
µg/m3
SOX
µg/m3
NOX
µg/m3
1 3/02/16
VELLANATHURUT
H
64 <10 10
2 12/02/16 75 < 10 12
3 13/02/16 68 < 10 11
4 25/02/16 58 < 10 10
5 26/02/16 48 < 10 11
6 1/03/16 42 < 10 <10
7 3/03/16 42 < 10 12
8 4/03/16 55 < 10 11
9
10/03/16 54 <10 < 10
Page 71
4-24
Sl.no Date PM10
µg/m3
SOX
µg/m3
NOX
µg/m3
10 11/03/16 58 <10 <10
11 15/03/16 46 <10 <10
12 16/03/16 52 <10 <10
13 22/03/16 52 <10 11
14 23/03/16 52 <10 10
15 29/03/16 53 <10 <10
16 30/03/16 54 <10 <10
17 05/04/16 VELLANATHURUT
H
(CONT…)
48 <10 13
18 06/04/16 52 <10 10
19 12/04/16 52 <10 <10
20 13/04/16 54 <10 11
21 19/04/16 52 <10 10
22 20/04/16 55 <10 <10
23 26/04/16 55 <10 12
24 27/04/16 52 <10 <10
Page 72
4-25
Table 4.6 Comparison of ambient air quality (PM10) of the four sampling locations
(Feb to April 2016)
S.No. Location Mean Minimum Maximum
1. KMML guest house 63 85 52
2. MS plant (KMML) 59 85 54
3. IREL guest house 48.7 81 40
4. Vellanathuruthu 53 75 42
Table 4.7: Comparison of Ambient Air Quality Status for summer season –
RSPM (µg/m3) May 2008
S.No. Location Mean Minimum Maximum
1. Project Site (MCH Centre,
Vellanathuruthu)
29.4 13 48
2. MaravanaJn 19.9 14 27
3. Kannety 30 13 56
Table 4.8Ambient Air Quality Status for Winter season –RSPM (µg/m3 )
December 2008
S.No. Location Mean Minimum Maximum
1. Project Site (MCH Centre,
Vellanathuruthu)
33.3 19 51
2. MaravanaJn 22.5 19 29
3. Kannety 41 29 66
Page 73
4-26
Table 4.4, 4.6, 4.7 and 4.8 shows the comparison of PM10 in study area and its buffer zone.
From the study it can be seen that in all locations PM10 was found within the permissible
limits (100 µg/m3) for three years of various studies. The SOx and NO2 averages will give
negligible values, as in most locations 24 H sampling have given values less than 10
µg/m3.Thus the results shows that all stations have observed SOx and NO2 values within
permissible limits.(80 µg/m3 for both SOx and NO2 )
Source of data: KSPCB.
Source of data: KSPCB.
The air quality status of a major industry (KMML) which is situated within 10 km of mine
lease is being compared with the air quality of Trivandrum and Kochi with a classification
based on the utility of the area i.e. residential, sensitive, commercial and industrial. The air
quality of the Block IVEE mine lease and it’s buffer area is much lower.
Type Location ID KMML TVM* KOCHI*
PM 10 SOX NOX PM10 SOX NOX PM10 SOX NOX
Com
merc
ial
CHAVARA-2016 64.08 8.08 8.16 PLAMOOD
2015 59.11 8.56 28.66 MG ROAD 2013 66.00 2.90 7.85
Ind
ust
rial
MS
PLANT(KMML)-
2016
58.08 8.64 10.0 VELI 2015 59.78 20.3 28.43 KALAMASERRY
2013 82.00 2.94 7.05
Sen
siti
ve VELLANATH -
URUTH
2016
53.88 8.16 10.2 COSMO
2015 60.83 8.61 31.19
Res
iden
tial
IREL GUEST
HOUSE
2016
52.96 8 9.75
VYTILLA 2013 77 2.85 9.85
Page 74
4-27
4.5 NOISE ENVIRONMENT
Noise measurements have been carried out using Sound level meter (Envirotech SLM 100).
The locations were selected keeping in view the probable noise prone areas (close proximity
to residential and sensitive zones, proposed project site, etc.). The measurements were taken
1 m from ground level, and carried out at each of these stations mentioned in Table below.
The study area includes a few places of worship, schools, health centers etc. (sensitive
locations).
Fig 4.7 Sound level meter
Table 4.9 Location and values of noise levels at different locations in core and buffer
zones
Sl no: Location of monitoring Average Noise
Value in dB
1 Mining road to Block IV EE 62
2 Primary Health Center 54
3 Amrithapuri Junction 69
4 Sree Kurukasseril Bhadra Devi temple 66
5 Alappad Panchayat Office 61
6 Cheriazikkal near to junction
(school,temple) 71
7 Pandarathuruthu 60
Page 75
4-28
8 Panikarkadavu bridge 70(cont. traffic)
57(normal)
9 Poockattu junction
(Panikarkadavu) 74
10 SV Market, Karunagappaly 54
11 Muncipal Corporation Office, Karunagapally 78
12 Karunagapally Junction 77
13 Karunagapply Govt.Hospital 68
14 KSEB Office, Puthiyakavu 75
15 Market Road, Karunagapallly 75
16 Karunagapally Railway station.(w/o train movement) 56
17 Kanetti Bridge 76
18 MES college of Arts & Science, Chavara (measured
at NH 47) 77
19 Titanium Junction 75
The permissible limits of noise at various localities are:
Table 4.10: Acceptable Outdoor Noise Levels: Norms of Central
Pollution Control Board
Area Code Category of Area Limits in dB (A)
Day time Night time
A Industrial Area 75 70
B Commercial Area 65 55
C Residential Area 55 45
D Sensitive zone 55 45
Note: 1. Day time is reckoned in between 6 A.M and 9 P.M.
Page 76
4-29
2. Night time is reckoned in between 9 P.M. and 6 A.M.
3. Silence zone is defined as areas upto 100 metres around such premises as
hospitals, educational institutions and courts.
NIIST study on 2008 on the same area, showed a maximum noise level ( 60-65) at NH 66
(KMML), KSRTC-Near Pearl hospital and Karunagapally which are busy junctions along the
National Highway. The higher ambient noise level is due to commercial activities,
movement of continuous vehicular and other traffic and location of bus stand of Kerala State
Road Transport Corporation and private bus Stand. The minimum ambient noise level during
study period was observed to be 35-40 dB at the Panmana Ashramom ( Mahasamadhi
Peedam). The low values could be attributed to considerably large vegetation cover and calm
atmosphere of religious Ashram. In general, on an average the noise levels are well within
prescribed limits.
Page 77
4-30
4.6 HYDROGEOLOGY
The coastal tract comprises thick pile of semi-consolidated to unconsolidated sediments of
recent to tertiary age, which consists of phreatic and confined aquifer systems. The study area
falls in the coastal sedimentary basin of Kollam – Ponnaniarea. The exploration by the
Central Ground Water Board (CGWB) indicated a maximum depth of 600m for the
sedimentary basin comprising 3 sedimentary formations: Warkallai, Quilon and Vaikom
beds. Of these, the Warkallai and Vaikom beds are the most potential aquifers. A subsurface
geological section along the coastal belt based on borehole data are shown (Fig 4.8 a).The
Vaikom beds form artesian aquifers between Kollam and Ponnani, and Workallai beds cater
to the requirements of drinking water of urban and rural population between Kollam and
Kochi.Water is fresh south of Cherthalla in Workable beds whereas it is fresh south of
Karuvatta in Vaikom beds. The quality of groundwater is brackish in nature at various places
along the coast and was considered due to seawater intrusion. But the detailed
hydrogeochemical survey by the CGWB revealed that the brackishness is also due to
leaching of salts from the formation materials.
Fig 4.8 (a): Subsurface geological section along the coastal belt based on borehole data
Page 78
4-31
Fig 4.8(b): Geological Map along W-E direction of block IVEE
Page 79
4-32
Fig 4.8 (c ): Tentative Section along E-W direction in block IV and Block IV EE
The recharge of the tertiary aquifers takes place from direct precipitation as well as by
downward percolation from the overlying recent to sub-recent formations all along the inland
margin of the coastal belt. Natural discharge from these aquifers takes place directly into the
sea or into the tidal lagoon all along the coastal line. The dug wells in the area tap the phreatic
aquifers in the recent sediments whereas the deep tube wells draw water from the semi-
confined to confined aquifers. Groundwater occurs in the porous granular formations such as
alluvium, laterite etc. The Tertiary sediments and weathered and decomposed crystalline
rocks as well as in the fissures, joints, and fractures in the fresh crystalline rocks. In the study
area, recent alluvium to tertiary sediments, groundwater occurs either in unconfined or semi-
confined/confined conditions. Phreatic conditions mainly exist in coastal alluvium.
Groundwater is mainly extracted through dug wells or filter point wells for domestic or
irrigation purposes. In the coastal region, the Quaternary alluvial deposits form potential
water table aquifers.
Laterite: The occurrence and movement of groundwater in laterite are mainly controlled by
the topography. Laterite forms potential aquifers along valleys and topographic lows where
Page 80
4-33
the thickness of saturated zone is more and can sustain large diameter open wells for
domestic and irrigation use.
Recent Alluvial Deposits: These constitute the most potential phreatic aquifer in the area and
are extensively developed by dug wells and filter point wells for domestic and irrigation
needs. The depth to water level in this formation ranges from 0.50 to 5.9 m which are 1 to 6
m above MSL. The depth of the wells ranges from 2.76 to 10.6 m BGL. The yield of the
shallow dug wells ranges from 15 to 50 m3/day. The area around Chavara, Karunagappally
where the saturated thickness exceeds 5.0 m form a promising area for filter point wells. The
filter point wells are constructed to a maximum depth of 12.0 m BGL and the yield ranges
from 20 to 60m3/day.
The shallow phreatic aquifers in alluvium are developed through dug wells and filter point
wells. Filter point wells are more economical in the alluvium areas in comparison to dug
wells. However, filter points can be constructed only in very restricted areas where the
saturated sand thickness in the shallow zone exceeds 5m. Filter point wells are feasible in
coastal areas especially along Chavara, Karunagappally blocks and the yield from these wells
ranges from 20 to 60m3/day.
4.6.1 Hydrogeological survey of the study area and buffer zone
The field data collection in core zone and buffer zone were carried out and traverse along the
buffer zone were made and groundwater and surface water samples were collected and
analysed. Hydrogeological survey of the project area and buffer zone was undertaken by
conducting a sample survey of the area taking field measurements at a minimum of 24 wells
in the buffer area including the nearby villages. The data generated during the previous study
(2014 to 2017) by CSIR-NIIST for the EIA study of KMML block III, was also taken into
consideration for ascertaining the hydrogeological impact.
The study area consisted of more than 300 wells. However, about Reduced level (RL’s) of
100 wells was taken at regular intervals. The data generated by the NIIST by an inventory of
100 wells previously during the Environmental Impact Assessment of Old Sludge Ponds of
Kerala Minerals & Metals (KMML), has been utilized in the present study (January 2014 to
May 2016).
Page 81
4-34
Hydrogeological survey of the project area and buffer zone was undertaken by conducting a
sample survey of the area taking field measurements of 22 wells in the study area including
the nearby villages keeping the ML area at the center. Of these 8 wells pertains to the project
area and 14 wells were in the buffer zone. The water levels in the 22nos of wells were
inventoried varies from 0.35 to2.30m .The depth of the wells varies from 1.59mto 5.78m .The
water level of the wells in the project varies from 0.61m to 2.18m and in the buffer zone the
water level varies from 0.35mto 4.53m The depth of the wells in buffer zone ranges from0.97
m to 5.78m It was observed that a in a few of the wells in proximity to the canal in project
area are shallow and with RL likely to be about 1m or even lesser .Thus based on actual
monitored data, it is evident that the working of the mine will intersect water table aquifer .of
the area
Groundwater is influenced by the difference in hydraulic head produced by topographic relief
and unconsolidated formations. The difference in the hydraulic head due to topographic relief
is the most significant driving force for groundwater flow. Along the western part of the area,
the aquifers flow towards the Sea. Water Level Contour maps are generated using this data.
With reference to GPS control points, the well location and its RL’s were determined by
using the total station instrument.
4.6.2 Ground Water level and Flow Pattern
The contours were generated with reference to water level RL’s of wells which are measured
during the field survey for Block no III. The water level RL of well is calculated from the
above table i.e., (Water level RL= Reduced level - (depth to water level from top of parapet -
Height of parapet). The location of the wells and the address of the inhabitants are provided
in Annexure .The contours were drawn for the water level RL’s for determining the ground
water flow direction in the study area extrapolating from the ground water contours in Block
III since contour of block IV EE was not available for reference. Usually sandy layers
facilitate the flow of water whereas clayey layer retards it. The contours were drawn for the
water level RL’s for determining the ground water flow direction in the study area. The
Ground water contour map ( Fig 4.9) indicated that the western part of the area comprising
the Block IV EE the water table aquifers flows towards the Lakshwadeep Sea in the west
and to the T- S canal in the east The ground water contours along the eastern side of the TS
canal show that the ground water flow pattern is generally towards west ie to the adjacent
Page 82
4-35
canal portion .Ground water is influenced by the difference in hydraulic head produced by
topographic relief and unconsolidated formations. The difference in hydraulic head due to
topographic relief is the most significant driving force for ground water flow.
The tentative geological section in west – east direction along Block IV EE (Fig 4.8 b, c)
also depicts the water table profile which is likely to be intersected by the mining pit
deepening/dredging activity in Block IV and Block IV eastern extension.
The GW flow is predominantly towards east in the T.S canal from the eastern extension
portion west of the canal and towards IRE block IV along the western margin towards
Arabian sea. From the portion of eastern extension on the eastern bank of the T.S canal the
GW flow is towards west into the canal and also to the Vattakayal along the south and south
western side.
Page 83
4-36
Fig 4.9: Water level contours and groundwater flow pattern of IREL block IV EE
Page 84
4-37
4.7 WATER ANALYSIS
4.7.1 Saltwater intrusion due to mining of mineral sands
Overexploitation of aquifers, both unconfined and confined may result in contamination of
the fresh water bearing aquifers by saline water intrusion from sea or estuary. The intra-
coastal canals and lacustrine extension of tidal effects add complexity in coastal tract
especially those of the phreatic aquifers. The fresh waters in rivers, block saltwater intrusion,
whereas blocking of the flow of the water in the upper reaches of the rivers by building dams,
sand mining in river bottoms and dredging of the estuarine beds increase the penetration of
brackish and saline water. The actual change in both the coastal penetration of salt water and
depth of subsurface saline layer will depend upon the configuration of the coastline, the
nature of the underlying geology and probable change in sea level and freshwater flow
reduction.
The coastal aquifer is in hydraulic continuity with the sea and thus there is a continuous flow
of subsurface water towards the sea. This flow prevents entry of the saline water into the
aquifer or towards land. The net result of this flow and counter seawater push towards land is
the existence of fresh water in the form of a lens floating on the saline water within the
coastal alluvium. The interfacial boundary within the aquifer is seldom sharp but a brackish
transition zone of finite thickness exists. The first physical formulations of saltwater intrusion
were made by W. Ghyben (1888, 1889) and A. Herzberg (1901), thus called the Ghyben-
Herzberg relation. The Ghyben-Herzberg ratio states, for every foot of fresh water in an
unconfined aquifer above sea level, there will be forty feet of fresh water in the aquifer below
sea level. The salt water is seen underground not at sea level but at a depth below sea level of
about 40 times the height of the fresh water above sea level. This distribution is attributed to a
hydrostatic equilibrium existing between the two fluids of different densities. Saline water
ingress is observed in the shallow alluvial aquifer in the western part of the district which is
in hydraulic connection with the backwater.
Page 85
4-38
Fig 4.10: the Ghyben-Herzberg relation.
Freshwater has a density of about 1.000 grams per cubic centimeter (g/cm3) at 20 °C,
whereas that of seawater is about 1.025 g/cm3. The equation can be simplified to z= 40h.
This denotes that any attempt to lower the fresh water level in the coastal alluvium by 1 m
will result in upcoming of the saline water boundary by 40 m towards the surface.
4.7.2 Sampling
As part of the field studies groundwater samples were collected and analyzed randomly from
the existing wells as well as from surface water within the study area during Jan 2015 to May
2016. Water samples were collected in pre-cleaned polyethylene bottles, tagged, stored in
ice-box and transported to the lab. The location of water sampling points in the core and
buffer zone keeping the block IVEE ML area at the center and related details are given below
in table 4.11.
Page 86
4-39
Table 4.11: Location details of sampling points
Sl.n
o
Lat. Long. Label of
sample
Type of
sample
Location Details Zone Remarks
1 9º 1'33.84'' 76º 33'53.34'' W1 sensitive Near health centre core NO
sediment
at
bottom.
Water
not been
used
after
tsunami
2 9º 01'49.44'' 76º 30'43.57'' W2 sensitive near temple core Used for
drinking
3 9º 02'08.60'' 76º 30'33.36'' W3 open well open well buffer Not
been
used
after
tsunami
4 9º 02'22.43'' 76º 30'27.34'' W4 residence buffer Not
been
used
after
tsunami
5 9º 02'15.57'' 76º 30'32.54'' W5 commercial surface water buffer under the
bridge
6 9º 06'04.11'' 76º 31'17.40'' W6 commercial Open well buffer high
sediment
load
observed
7 9º 03'57.19'' 76º 32'43.25'' W7 industrial drinking water buffer
8 9º 02'56.47'' 76º 32'03.22'' W8 residence Other purpose buffer Taste
differenc
e not
using for
drinking
purpose
9 9º 02'43.04'' 76º 31'22.05'' W9 sensitive drinking water for
school students
buffer Used for
drinking
10 9º 02'59.36'' 76º 31'13.03'' W10 residential drinking water buffer yellowis
h colour
observed
11 9º 02'15.23'' 76º 31'00.88'' W11 residential drinking water buffer turbid
used for
drinking
purpose
12 9º 02'02.33'' 76º 31'03.97'' W12 commercial open well buffer presence
of smell
and
yellowis
h colour
used for
gardenin
g
13 9º 02'40.32'' 76º 32'10.41'' W13 sensitive Drinking water buffer Clear
Page 87
4-40
near to temple and
hospital
water
Used for
drinking
purpose
4.7.3 Water quality
In order to assess the quality of water in the wells of the core and buffer zone, water samples
were collected and analysed for different parameters. The parameters tested in the quality
analysis include pH, conductivity, salinity, TDS, TSS, ammonia, chloride, alkalinity,
calcium, magnesium, hardness, potassium, sodium, sulfates, silicate, phosphate, iron, nitrite,
zinc and lead. According to Indian Standards and Specifications for Drinking Water (IS:
10500:2012) and World Health Organization (WHO), drinking water limits have been shown
below in table 4.12.
Fig 4.11 GW sampling points
Page 88
4-41
4.7.4 Physicochemical Properties of water samples
Water quality changes are widely considered to be the most significant consequence of
mining activities. This is partly because of the wide variety of undesirable contaminants that
are derived from mining operations and partly due to the frequency and persistence of these
problems.
Table 4.13 shows that all the samples were having pH within the permissible limits as per
Indian Standards. Sample IRE W 2 registered the lowest conductivity (0.202 mS/cm) while
sample IRE W5 showed the highest value of 23330 µS/cm. Portability of water with a TDS
Table 4.12 Standard water quality parameters
Sl.No Parameter Minimum
value(Acceptable Limit),
mg/L
Maximum value (in the
absence of permissible source),
mg/L
1 pH 6.5 8.5
2 Salinity, ppt 0.5 1
3 TDS, mg/L 500 2000
4 TSS, mg/L 100 500
5 Ammonia, mg/L 3 12
6 Chloride, mg/L 250 1000
7 Alkalinity, mg/L 200 600
8 Calcium, mg/L 75 200
9 Magnesium, mg/L 30 100
10 Potassium, mg/L 0.1 10
11 Sodium, mg/L 20 200
12 Sulphate, mg/L 200 400
13 Silicate, mg/L - -
14 Phosphate, mg/L 0.1 1.7
15 Iron, mg/L 0.3 1
16 Nitrite, mg/L 45 100
17 Zinc mg/L 5 15
18 Lead mg/L 0.05 0.05
Page 89
4-42
level of less than 500 mg/liter is generally considered to be good; drinking water becomes
significantly and increasingly unpalatable at TDS levels greater than 1000 mg/liter. The total
solid content was maximum in IRE W5 (1153 mg/L) sample and the total dissolved solid
contents were found to be the highest in the case of sample IREW6 (10.7mg/l) which is
reflected in its salinity and conductivity values. The minimum TDS was observed in IREL
W11(30mg/L) and similarly min TSS was observed in IREL W11 (1.1 mg/L). Sample IREL
W11 possessed the lowest TSS & TDS values which are in good agreement with its low
salinity and conductivity. All samples except IRE W1, IRE W5, and IRE W 12 exhibited
TDS values less than 500 mg/l. High calcium content was found in sample IRE W5, IRE W1
while samples IRE W5 possessed the maximum magnesium values. All samples except IRE
W5 contained chloride ions at levels less than 250 mg/l (permissible limit). Sulphate levels of
all samples were found within permissible limits (200mg/L) except for IRE W5.
IRE W5 is the sample collected from below pannickarkadavu bridge and from the table it can
be observed that this sample shows high values of salinity, EC, TDS etc.
This place is used as a boat anchoring location and the area is under continuous disturbance
caused by boat cleaning boat movement etc. This may be the reason for the increase in values
of parameters.
Page 90
4-43
Table 4.13Physiochemical parameters of water sample
Sample pH Conduct
ivity
Salini
ty
TDS Chlor
ide
Alkalinity Calci
um
Magnesi
um
Sodiu
m
Potassiu
m
Sulphat
e
TSS
ID µS/cm ppt mg/L mg/L Carbonat
e mg/L
Bicarbona
temg/L
mg/L mg/L mg/L mg/L mg/L mg/L
IRE-W1 7.87 1367 0.7 670 198.8 0 356 128.26 21.87 220.8 32.8 85.492 1.5
IRE-W2 7.86 26.1 0.1 128 39.76 0 70 28.06 9.72 30.43 2.5 9.553 1.1
IRE-W3 7.71 622 0.3 305 89.46 0 150 56.11 0 84.33 21.38 38.382 2.8
IRE-W4 7.67 543 0.3 266 74.55 0 150 56.11 19.44 57.29 9.42 15.641 1.5
IRE-W5 7.38 23330 14.3 1153 7057.4 0 40 132.26 493.29 7349 198 698.732 9.4
IRE-W6 7.60 506 0.2 248 54.67 0 110 52.1 0 64.1 18.71 70.221 10.7
IRE-W7 7.46 140.9 0.1 210 24.85 0 110 8.02 2.43 60 15 23.539 0.3
IRE-W8 7.57 338 0.2 165 29.82 2 116 40.08 13.61 28.54 12.22 27.03 0.8
IRE-W9 7.32 354 0.2 173 49.7 0 68 30.46 5.83 0.94 0.15 43.377 1.6
IRE-
W10 6.55 265.9 0.1 69 53.68 0 12 16.03 4.86 34.71 4.21 38.113 4.2
IRE-
W11 7.55 62.1 0 30 15.9 0 16 4.81 1.94 16.88 1.75 6.697 1.1
IRE-
W12 7.13 1545 0.8 757 308.14 24 360 73.75 25.27 221 21.46 14.984 1.5
IRE-
W13 7.68 371 0.2 182 59.64 0 66 43.29 1.94 33.12 28.69 72.567 8.6
Page 91
4-44
4.7.5 Physiochemical parameters of water samples of buffer zone (summer season
:2015):
The physiochemical parameters of water samples collected from buffer zone is presented
below. Table 4.14 shows that all the samples except sample KMW11, possess pH values
within the specified limit. Sample KMW9 registered the lowest conductivity (0.202 mS/cm)
while sample KM2 showed the highest value of 30.8 mS/cm. Potability of water with a TDS
level of less than 500 mg/litre is generally considered good.
Drinking water becomes significantly and increasingly unpalatable at TDS levels greater than
1000 mg/litre. Total solid content as well as the total dissolved solid contents were found to
be the highest in the case of sample W3 (523 mg/l) which is reflected in its salinity and
conductivity values. Sample W4 possessed the lowest TS & TDS values which are in good
agreement with its low salinity and conductivity. All samples except KM2, KMW5, KMW13,
and KMW15 exhibited TDS values less than 500 mg/l. KM2 is the sample collected from
dredging pit of adjacent block of KMML and since it shows high values of salinity, EC, TDS
etc, sea water intrusion is suspected. This is mainly due to poor management of mine pits by
KMML. High Calcium content was found in sample KMW1 and KM2 while samples KM2
and KMW13 possessed the maximum magnesium values. All samples contained chloride
ions at levels 250 mg/l (permissible limit) except for the mine pit water (KM2). KM2
exhibited high chloride value. Nitrite in all the water samples were within the prescribed
limits of specifications. High iron content was found in two of the water samples – KMW2
& KMW3. Phosphate was found in samples KMW2, KMW3, KMW9, KMW13 and
KMW15. Alkalinity and TSS were within the permissible limits in all samples. All samples
except KMW1 and KM2 exhibited high silica content.
Page 92
4-45
Table 4.14 Physiochemical parameters of water samples of buffer zone-(summer season of 2015)
Sample p
H
Conduct
ivity
Salini
ty
TDS Chlor
ide
T.Alkal
inity
Calci
um
Magnesi
um
Sodiu
m
Potassiu
m
Sulphate TSS Ammonia -N
ID µS/cm ppt mg/L mg/L mg/L mg/L mg/L mg/L mg/L mg/L mg/L mg/L
KMW1 8 931 0.5 456 89 77 82 15 140 20 150 2 BDL
KM2 8 30800 19.1 15082 9656 82 240 41 11198 5 2076 19 BDL
KMW2 8 456 0.2 223 36 58 46 10 55 22 22 1 BDL
KMW3 7 759 0.4 372 107 66 48 9 137 16 48 2 BDL
KMW4 8 259 0.1 127 22 28 12 8 44 21 30 0 BDL
KMW5 7 1428 0.7 701 162 134 44 28 267 2 65 1 BDL
KMW6 7 958 0.3 273 71 38 36 8 105 4 52 0 BDL
KMW7 7 520 0.3 255 44 70 32 13 72 3 57 5 BDL
KMW8 7 537 0.3 263 28 52 32 21 43 21 158 4 BDL
KMW9 7 202.7 0.1 99 20 28 10 9 25 1 23 10 BDL
KMW10 7 602 0.3 295 21 78 48 11 35 42 88 1 BDL
KMW11 6 325 0.2 159 53 14 8 11 33 3 11 2 BDL
KMW12 7 925 0.5 452 118 40 36 11 174 13 54 1 BDL
KMW13 8 1712 0.9 839 186 180 56 43 374 47 47 47 BDL
KMW14 8 419 0.2 419 21 73 22 19 26 3 33 0 BDL
KMW15 8 1101 0.5 539 69 118 46 0 24 2 49 0 BDL
Page 93
4-46
4.8 SOIL CHARACTERISTICS
4.8.1 Introduction
In general, the soils of Kerala are acidic, kaolintic and gravelly with low CEC, low water
holding capacity and high phosphate fixing capacity. Climate topography, vegetation and
hydrological conditions are the dominant factors of soil formation. On the basis of the
morphological features and physico-chemical properties, the soils of the State have been
classified into red loam, laterite coastal alluvium, riverine alluvium, Onattukara alluvium,
brown hydromorphic, saline hydromorphic, Kuttanad alluvium, black soil and forest loam.
(Source: Department of Agriculture and farmer’s welfare, Karsikha Keralam)
4.8.2 Soil properties of study area:
Since the study area belongs to Karunagapally taluk and it is a coastal area the soil category
of the area belongs to Onnatukara Alluvium.These soils are confined to the Onattukara region
comprising the Karunagapally, Karthikapally and Mavelikara taluks of Kollam and
Alappuzha districts. They occur as marine deposits extending to the interior up to the lateritic
belt. The soils are, in general, coarse textured with immature profiles. In low-lying areas, the
water table is high and drainage is a problem. These soils have very rapid permeability. They
are acidic in reaction and are extremely deficient in all the major plant nutrients.
4.8.1 Physicochemical characteristics
Chloride: It is a micronutrient essential for plant development. It is required in small
quantities by all crops .Chloride has a direct role in photosynthesis, is important in osmotic
adjustment of plant. The table 4.15 shows the chloride content of the soil in study area it
showed a range of 10.65% to 0.00018%.
Sulphur: In plants sulfur is essential for nitrogen fixing nodules on legumes, and necessary in
formation of chlorophyll. Plants uses sulfur in process of producing proteins, amino acids,
enzymes and vitamins. Sulfur also helps the plant’s resistance to disease. The table 4.15
shows the Sulphate content in soil of study area.KMW1 showed the highest Sulphate content
of 0.28% while IRES12 recorded the lowest value.
Page 94
4-47
pH: pH is simply a measure of how acidic or alkaline a substance is, and soil acidity or
alkalinity is important because it influences how easily plants can take up nutrients from the
soil. The pH of the core area and buffer zone ranges in between 5.1 to 8.5.
Table 4.15Physiochemical parameters of soil samples collected from core and buffer
zones
Sample
ID
pH Chloride Sulphate Moisture Silt Sand Clay
% % % % % %
IRES-S2 5.9 0.00018 0.09 11.46 59.14 30.78 10.07251
IRES-S9 8.5 0.00019 0.05 10.09 21.82 54.87 23.30794
IRES-10 8.0 0.00019 0.07 5.71 21.26 50.81 27.92974
IRES-11 8.0 0.00018 0.10 7.72 25.22 48.96 25.82036
IRES-12 7.5 0.00018 0.01 2.22 33.80 50.85 15.35079
IRES-13 8.2 0.00019 0.15 5.29 46.93 30.18 22.88604
KMW1 7.8 6.57 0.28 -- 15.45 84.93 BDL
KMW2 7.9 4.79 0.24 -- 30.28 74.16 BDL
KMW3 8.1 7.10 0.23 -- 11.90 90.68 BDL
KMW5 6.9 12.60 0.19 -- 11.04 92.39 BDL
KMW6 7.2 6.92 0.43 -- 32.09 76.87 BDL
KMW7 7.2 13.49 0.25 -- 17.64 88.13 BDL
KMW8 7.8 9.59 0.14 -- 28.16 73.09 BDL
KMW9 5.1 17.75 0.24 -- 24.82 81.79 BDL
KMW10 8.0 7.63 0.14 -- 58.96 50.85 17
Page 95
4-48
KMW11 7.9 14.20 0.13 -- 13.33 68.82 BDL
KMW12 7.3 17.75 0.19 -- 29.33 73.86 BDL
KMW13 7.1 13.31 0.25 -- 29.40 75.29 BDL
KMW14 8.2 8.17 0.19 -- 35.52 68.23 BDL
KMW15 7.5 7.81 0.24 -- 22.29 81.38 BDL
KMW16 8.1 10.65 0.15 -- 52 67.69 BDL
KMW17 7.2 8.17 0.14 -- 82.39 43.99 BDL
4.9 ECOLOGY
The ecology of block IVEE and surrounding buffer zone including block III of KMML was
considered for ecological study. A detailed ecological survey was conducted on buffer zone
of block IVEE considering all flora and fauna of the area.
4.9.1 Method of study
Transect walk was the tool used to assess the occurrence of the fauna at all these locations.
All the observations were recorded. The terrestrial, aquatic and aerial species were collected
using suitable contrivances and identified by direct observation and also by referring standard
literature. Discussions with the local natives, villagers, experts and officials were also made.
Page 96
4-49
Table4.16 :Locations selected for survey
Location
no. Area
Location
1. IRE mine site Block IV(Buffer Zone) 9o 02’ 3.80”N 76o 30’ 29.9”E
2. Block IV EE ( NW of KMML) (Core
Zone)
9 o 00’ 19.24”N 76º 31’ 39.70”E
3. KMML Block 3(Buffer Zone) 8o 59’ 34.74”N 76o 31’ 26.718”E
4.
Amrithapuri –
MathaAmritanandamayi math(Buffer
Zone)
9 o 5’ 15.87”N 76o 21’ 13.53”E
5. Amritapuri – Westside(Buffer Zone) 9 o 5’ 16.14”N 76o 21’ 13.28”E
6.
Kuzhamkulam – towards east side of
KMML along the road to
Shasthamcotta (residential area)
(Buffer Zone)
9 o 00’ 14.17”N 76o 33’ 47.33”E
7. Parimanam – Neendakara (in front of
temple)(Buffer Zone) 8 o 57’ 20.04”N 76o 31’ 57.25”E
8. Kavanad NH 66(Buffer Zone) 8 o 54’ 32.82”N 76o 33’ 37.56”E
4.9.2 Fauna:
A total of 102 animals were cited in the core and buffer area which includes 47invertebrates
and 55 vertebrates. Among invertebrates only two species of annelids were observed in the
core area. Among arthropods, maximum number was represented by insect (33 species), and
all other groups were represented by two species each in crustacean, myriapods and
arachinida. Maximum number of vertebrates was represented by the group aves with 32
species followed by fishes (15 species). Only 8species of mammals were observed in the
study area.
Since continuous mining activities are going on in the buffer area, there is no stability for the
soil habitat and that could be the reason for less soil organisms.
Page 97
4-50
The buffer consists of 127 animals including 64 invertebrates and 63vertebrates. Two
annelidan species were identified from this area. Insect represents the maximum number of
species (41) followed by crustacean with 7species, and two species each in Myriapoda and
Arachinida. There were four species of molluscans represented in this area. Birds are the
class with maximum number of species (36). A total of 26 species of fishes were observed
and among them, 8species were from brackish water and 7 species from fresh water. The
details are shown in table 4.17
Table 4.17 List of fauna observed in core area
INVERTEBRATES
Phylum – Annelida Whether belong to
Schedule I
1.
2.
Megascolexmauritii (Earth worm)
Pheretimaposthuma (Giant earthworm)
No
No
Phylum – Arthropoda
CLASS I Crustacea
1.
2.
Albunia sp.
Uca lacteal annulipes (Fiddler crab)
No
No
CLASS II MYRIAPODA
1.
2.
Scolopendramarsidents(Centepede)
Spirobolus sp. (Millipede)
No
No
CLASS III INSECTA
1.
2.
Pachlioptaaristolochia(Commomnatturose)
Papiliomormon(Common mormon)
No
No
Page 98
4-51
3.
4.
5.
6.
7.
8.
9.
10.
11.
12.
13.
14.
15.
16.
17.
18.
19.
20.
21.
22.
23.
24.
25.
26.
27.
Papiliopolytes(Common mormon )
Delias eucharis (Common Jezebel)
Bacillus Rosii(Grass hopper)
Gryllotalpa(Mole cricket)
Achetadomestica(House cricket)
Mantis religiosa(Praying mantis)
Phylliumcrucifolium(Leaf insect)
Forficula(Earwig)
Menoponpallidum(Fowl lice)
Leptoflebia(mayfly)
Labella (Dragon fly)
Aphids
Corixa(water boatman)
Notonecta(Back swimmer)
Belostomaindica(Giant water bug)
Myrmeleon sp. (Antlion)
Alcedes sp.
Kallima sp.
Apisindica(Domestic honey bee)
Oryctus rhinoceros (Cococnut beetle)
Rhynchophorus sp. (Red palm weevil)
Cincindella sp. (Tiger beetle)
Coccinellaseptumpunctata(lady bird beetle)
Mylabrisindica(Cantharids beetle)
Sternochaetusmangiferae(mangonutweevle)
No
No
No
No
No
No
No
No
No
No
No
No
No
No
No
No
No
No
No
No
No
No
No
No
No
Page 99
4-52
28.
29.
30.
31.
32.
33.
Myrmicarubra(Red ant)
Oecopheliasmargadina(Tailor ant)
Monomorumgracilimum(large black ant)
Muscadomestica(House fly)
Anophelusmaculipenis( Mosquito)
Culex sp.
No
No
No
No
No
No
Class IV ARACHINIDA
1.
2.
Palamnaeusawammerdami(Scorpion)
Araneusdiadematus(Garden spider)
No
No
1.
2.
3.
4.
PHYLUM – MOLLUSCA
Pilaglobosa(Apple snail)
Lamellidansmarginalis(Fresh water mussel)
Pernaviridis(brown mussel
Pernaindica(Green mussel)
No
No
No
No
1.
2.
PHYLUM ECHINODERMATA
Clypiasterhumilis(Sand dollars)
Echinodiscusauritus(Sand dollars)
No
No
VERTEBRATA
1.
2.
3.
CLASS I PISCES
Brackish Water Fishes
Gerresfilamentosus (Gerres)
Teraponjarbua
Ambassismola (Glass fish)
No
No
No
Page 100
4-53
4.
5.
6.
7.
8.
9.
10.
11.
12.
13.
14.
15.
Mugilparsia (Mullet)
Mugilcephalus (Grey mullet)
Scatophagusargus (Scat)
Etroplussuratensis (Pearl spot)
Etroplus maculates (Orengechromid)
Fresh water Fishes
Clariasgariepinus (African catfish)
Anabas testudineus (Climbing perch)
Tilapia mossambica (Tilapia)
Labeorohitha(Rohu)
Catlacatla (Catla)
Cyprinuscarpio (Common carp)
Cirrhinusmrigala (Mrigal)
No
No
No
No
No
No
No
No
No
No
No
No
1.
2.
3.
4.
5.
6.
7.
8.
CLASS II AVES
Centropussinensis(Greater Coucal )
Meropsorientalis(Green Bee-Eater)
Dicrurusleucophaeus(Ashy Drongo)
Calandrellaraytal ( Indian Short-toed Lark)
Turdoidesmalcolmi ( Large Gray Babbler)
Acridotheresfuscus (Jungle Myna)
Orthotomussutorius ( Common Tailorbird)
Phalacrocoraxniger (Little Cormorant )
Corvusmacrorhynchus (Jungle crow)
Acridotherestristis (Common Mynah)
No
No
No
No
No
No
No
No
No
No
Page 101
4-54
9.
10.
11.
12.
13.
14.
15.
16.
17.
18.
19.
20.
21.
22.
23.
24.
25.
26.
27.
28.
29.
30.
Cospichussaularis (Magpie robin)
Centropussinensis (Crow pheasant)
Nectariniaasiatica (Sunbird)
Turdoidesaffinis(Babblers)
Pychnonotuscafer(Red vented bulbul)
Dendrocittavagabunda (Indian tree pie)
Oriolusoriolus (Oriole)
Ploceusphilippinus (Baya)
Eudynamusscolopaceae (Indian koel)
Columba livia (Pigeon)
Haliaster Indus (Brahmini kite)
Milvusmigrans (Pariah kite)
Alcidoatthis (Small blue king fisher)
Dicrurusadsimilis( Black drongo)
Ardeolagrayii (Pond herone)
Ergettagarzetta(Little erget)
Bulbulcus ibis (Catta\le erget)
Larusridibundus (Black headed gull)
Upupaepops (Hoope)
Vanellusindicus (Red vatted lapwing)
Tringahypoleucos (Common sand piper)
Charadriusdubiusjerdoni (Little ringed plover)
No
No
No
No
No
No
No
No
No
No
No
No
No
No
No
No
No
No
No
No
No
No
CLASS III MAMMALIA
Page 102
4-55
INVERTEBRATES
Phylum – Annelida
1.
2.
Megascolexmauritii (Earth worm)
Pheretimaposthuma (Giant earthworm)
No
Phylum – Arthropoda
CLASS I Crustacea
1.
2.
3.
4.
5.
6.
7.
8.
Penaeusindicus( Indian White prawn)
Macrobrachiumrosenberghii(Giant freshwater prawn)
Balanus sp. (Rock barnacles)
Eupagurus Sp.(Hermit crab)
Macrobrachiumidella(Motta chemmeen)
Scylla serrata(Mud crab)
Albunia sp.
Uca lacteal annulipes (Fiddler crab)
No
No
No
No
No
No
No
No
1.
2.
3.
4.
5.
6.
7.
8.
Capra bus indicus (Cow)
Capra hiscus (Goat)
Bubalus (Buffallo)
Oryctolaguscuniculus (Rabbit)
Musmuscularis (Mouse)
Canisfamiliaris(Dog)
Felisdomesticus (Cat)
Herpestesedwardsii (mangoose)
No
No
No
No
No
No
No
No
Page 103
4-56
CLASS II MYRIAPODA
1.
2.
Scolopendramarsidents(Centepede)
Spirobolus sp. (Millipede)
No
No
Class III Insecta
1.
2.
3.
4.
5.
6.
7.
8.
9.
10,
11.
12.
13.
14.
15.
16.
17.
Pachlioptaaristolochia(Commomnatturose)
Papiliomormon(Common mormon)
Papiliopolytes(Common mormon )
Delias eucharis (Common Jezebel)
Euthaliaaconthea(Common baron)
Ctenolepisma(Silver fish)
Bacillus Rosii(Grass hopper)
Gryllotalpa(Mole cricket)
Achetadomestica(House cricket)
Mantis religiosa(Praying mantis)
Phylliumcrucifolium(Leaf insect)
Forficula(Earwig)
Menoponpallidum(Fowl lice)
Leptoflebia(mayfly)
Labella (Dragon fly)
Aphids
Corixa(water boatman)
No
No
No
No
No
No
No
No
No
No
No
No
No
No
No
No
Page 104
4-57
18.
19.
20.
21.
22.
23.
24.
25.
26.
27.
28.
29.
30.
31.
32.
33.
34.
35.
36.
37.
38.
Notonecta(Back swimmer)
Belostomaindica(Giant water bug)
Myrmeleon sp. (Antlion)
Alcedes sp.
Kallima sp.
Bombyxmori(Silk worm)
Apisindica(Domestic honey bee)
Apis florae (Little honey bee)
Apismellifera(Italian honey bee)
Leptocorisaacuta(Rice bug)
Aspengopus sp. (Pumkinbug)
Oryctus rhinoceros (Cococnut beetle)
Rhynchophorus sp. (Red palm weevil)
Cincindella sp. (Tiger beetle)
Brachinus sp. (Bombadier beetle)
Coccinellaseptumpunctata(lady bird beetle)
Mylabrisindica(Cantharids beetle)
Sternochaetusmangiferae(mangonutweevle)
Myrmicarubra(Red ant)
Oecopheliasmargadina(Tailor ant)
Monomorumgracilimum(large black ant)
No
No
No
No
No
No
No
No
No
No
No
No
No
No
No
No
No
No
No
No
No
Page 105
4-58
39.
40.
41.
Muscadomestica(House fly)
Anophelusmaculipenis( Mosquito)
Culex sp.
No
No
No
No
Class IV ARACHINIDA
1.
2.
Palamnaeusawammerdami(Scorpion)
Araneusdiadematus(Garden spider)
No
No
1.
2.
3.
4.
5.
6.
7.
8.
PHYLUM – MOLLUSCA
Pilaglobosa(Apple snail)
Lamellidansmarginalis(Fresh water mussel)
Sepia phoronis(Cuttle fish)
Pernaviridis(brown mussel
Pernaindica(Green mussel)
Sepia (cuttle fish)
Loligo(Squid)
Octopus sp. (Devil fish )
No
No
No
No
No
No
No
No
1.
2.
PHYLUM ECHINODERMATA
Clypiasterhumilis(Sand dollars)
Echinodiscusauritus(Sand dollars)
No
No
VERTEBRATA
CLASS I PISCES
Page 106
4-59
1.
2.
3.
4.
5.
6.
7.
8.
9.
10.
11.
12.
13.
14.
15.
16.
17.
Brackish Water Fishes
Gerresfilamentosus (Gerres)
Teraponjarbua
Ambassismola (Glass fish)
Chanoschanos (Milk fish)
Mugilparsia (Mullet)
Mugilcephalus (Grey mullet)
Scatophagusargus (Scat)
Etroplussuratensis (Pearl spot)
Etroplus maculates (Orengechromid)
Fresh water Fishes
Clariasgariepinus (African catfish)
Anabas testudineus (Climbing perch)
Tilapia mossambica (Tilapia)
Labeorohitha(Rohu)
Catlacatla (Catla)
Cyprinuscarpio (Common carp)
Cirrhinusmrigala (Mrigal)
Etrplussuratensis (Pearlspot)
No
No
No
No
No
No
No
No
No
No
No
No
No
No
No
No
No
Page 107
4-60
1.
AMPHIBIA
Rhacophorus
REPTILIA
1.
2.
3.
4.
5.
6.
7.
8.
9.
10.
11.
12.
13.
14.
15.
CLASS II AVES
Centropussinensis(Greater Coucal )
Meropsorientalis(Green Bee-Eater)
Dicrurusleucophaeus(Ashy Drongo)
Calandrellaraytal ( Indian Short-toed Lark)
Turdoidesmalcolmi ( Large Gray Babbler)
Acridotheresfuscus (Jungle Myna)
Orthotomussutorius ( Common Tailorbird)
Phalacrocoraxniger (Little Cormorant )
Corvusmacrorhynchus (Jungle crow)
Acridotherestristis (Common Mynah)
Cospichussaularis (Magpie robin)
Centropussinensis (Crow pheasant)
Nectariniaasiatica (Sunbird)
Turdoidesaffinis(Babblers)
Pychnonotuscafer(Red vented bulbul)
No
No
No
No
No
No
No
No
No
No
No
No
No
No
No
Page 108
4-61
16.
17.
18.
19.
20.
21.
22.
23.
24.
25.
26.
27.
28.
29.
30.
31.
32.
33.
34.
35.
36.
Dendrocittavagabunda (Indian tree pie)
Psittaculakarmeri(Red ringed parrot)
Oriolusoriolus (Oriole)
Ploceusphilippinus (Baya)
Eudynamusscolopaceae (Indian koel)
Columba livia (Pigeon)
Haliaster Indus (Brahmini kite)
Milvusmigrans (Pariah kite)
Alcidoatthis (Small blue king fisher)
Dicrurusadsimilis( Black drongo)
Ardeolagrayii (Pond herone)
Ergettagarzetta(Little erget)
Bulbulcus ibis (Cattle erget)
Amaurornisphoenicurus (White breasted water hen)
Larusbrunnicephalus (Brown headed gull)
Larusridibundus (Black headed gull)
Upupaepops (Hoope)
Dendrocopusnanus(Wood pecker)
Vanellusindicus (Red vatted lapwing)
Tringahypoleucos (Common sand piper)
Charadriusdubiusjerdoni (Little ringed plover)
No
No
No
No
No
No
No
No
No
No
No
No
No
No
No
No
No
No
No
No
No
Page 109
4-62
1.
2.
3.
4.
5.
6.
7.
8.
9.
10.
11.
CLASS III MAMMALIA
Capra bus indicus (Cow)
Capra hiscus (Goat)
Bubalus (Buffallo)
Oryctolaguscuniculus (Rabbit)
Musmuscularis (Mouse)
Canisfamiliaris(Dog)
Felisdomesticus (Cat)
Pteropusmedius (Fruitivorus bat)
Scotophilus (Insectivorous bat)
Funnambulus (Squirrel)
Herpestesedwardsii (mangoose)
No
No
No
No
No
No
No
No
No
No
No
The animals in this area are not included in Schedule I of Act 1972. No endangered or
endemic animals were found in the study area during the survey.
4.9.3Flora studies
Changes in the physical and chemical aspects of the environment will reflect in the flora of
the study area. Some of the plants are sensitive to environmental changes, but most of them
can gradually acclimatize to the environment. The ecological studies particularly the study
about the vegetation is very important for the conservation of the environmental quality. The
study area comprises of terrestrial habitat as well as aquatic. The aquatic habitat comprised of
sea beaches, canals and wetlands. The sea beach though a part of the terrestrial habitat is
described along with the aquatic habitat considering that a part of the project site is on the
beach. The large area covered by the wetlands and the canal, considerable extent of the study
area is covered by water. During the survey none of the threatened plant species are noticed.
Page 110
4-63
Altogether 107 plant species were identified in the buffer zone which includes herbs, shrubs
and trees. In the core zone 63 species of plants were recorded. There was no forest area
located in the area of survey. No endangered species or threatened species or plants included
in the Schedule I of wild life protection act of 1972were observed during the survey.
4.9.4 Mangroves
Mangroves are important floral component of any coastal ecosystems that play crucial roles
in the local ecology and also in livelihood security of human populations. Mangroves are
special kind of flora which can tolerate salinity and can grow in marshes due to the presence
of special kind of roots called pneumatophores. The most effective method for stabilising the
shore is through biological stabilisation provided by the existence of mangroves and its
diversity. The roots of the mangroves not only capture sand, shells, and sediment but trap as
well as reinforce the shore by root branch growth. Mangroves also build land and solidify it
against attacks by waves and currents. The other most important characteristics of mangroves
are its activity in offering breeding grounds for coastal fish and shell fish species. They grow
very quickly, often as much as two feet per year and form a forest of mangroves, which
provide an abode to not only aquatic species but also to various terrestrial and bird species.
Since the mangroves are located in the T.S canal, the area is out of the mining lease. As such
there are no effects of mining or supportive activities in the said area.
Characteristics and Functions: Mangroves
• Form biomass at rates equal to most intensively cultivated tropical agricultural lands, with
only marine grass beds, coral reefs, and tropical rain forests exceeding mangroves in
productivity;
• Export organic matter to adjacent coastal food chains, thereby playing a critical role in
sustaining life in environments such as coral reefs and sea grass beds;
Page 111
4-64
• Provide habitat for many birds, fish and invertebrates in their maze of trunks, prop roots,
and muddy substrates.
•Protect shorelines, boats, and land-based structures from erosion and wave damage,
particularly during tropical storms and hurricanes;
•Serve as physical and chemical filters for upland runoff and enhances water quality.
The riparian vegetation along TS canal were found to be flourished with mangrove species
where there is no human habitation. The TS canal was identified as National Water Way
(No.3) and NWAI carries out the widening and dredging of the canal for safe navigation.
Mangroves along the construction sites are being destroyed but the local natives are trying to
protect it since the awareness after the Tsunami event. The estuarine system has many island
formations by sediment deposit and many such islands also hold good mangrove vegetation.
Comparatively mangrove floral density was found to be low along the riparian areas of TS
canal, which may be due to the construction and up-gradation work of National Water Way.
Table 4.18 Mangroves and their density around estuarine system, Chavara, Kollam
Species
Density
(No./m2)
Acanthus ilicifolius 9
Avicenniaofficinalis 5
Bruguieraparviflora 7
Rhizophoramucronata 5
Salvadorapersica 3
Ceriopsdecandra 2
Exoecariaagallocha 1
Page 112
4-65
4.10 WILD LIFE
Wild life was not represented in the study area since there are no forests. The wild species
represented in this area are jungle cat, jackal and few captive elephants.
4.11 FISHERIES
The list of fishes that are commonly seen in this area is listed in table 4.19. Fisheries aspect of
the study was represented mainly by commercial fisheries from the area. Fishes and other
crustaceans like prawns and crabs represents commercial fisheries from the area. In addition
certain molluscan species were also included in the catches. Sampling from different fishing
vessels from different zones of the study area recorded 19 estuarine species of fin fishes, 31
marine species of fin fishes, 8 species of prawns and 4 species of crabs and 2 species of
commercial clams.
Samples from market nearby and Neendakara fishing harbor were also investigated for
assessment and fin and shell fish representation was fairly good when compared to other
landing centers along west coast of Kerala. Almost all commercial fish species were recorded
from the fish catches and other noncommercial fishes may also be present in the area
including migratory forms.
Table 4.19 Fish, shellfish and Fisheries along the Marine and Estuarine system, Kollam
(Fishes and shell fishes obtained from fishermen/Boats during sampling day and secondary
data on fisheries)
Page 113
4-66
Group/Species
Estuarine Fishes Marine Fishes
Gymnothoraxpseudothyrosidea
Glossogobiusgiuris
Liza tade
Liza parsia
Anabas testuidineus
Boleophthalmusdussumerri
Awaousstamineus
Mugilcephalus
Strongylurastrongylura
Horabagus sp.
Arius dussumeri
Etroplussuratensis
Etroplus maculates
Tilapia mossambicus
Chirocentrusdorab
Panchaxpanchax
Nandusnandus
Gerresfilamentosus
Hyporhampusxanthopterus
Stolephorusindicus
Stolephoruscommersoni
Stolephorusinsularis
Encrasicholinadevisi
Encrasicholinaheteroloba
Thryssamalabarica
Thryssamystax
Opistopterustadoore
Sardinellalongiceps
Sardinellagibbosa
Scomberomoruscommersoni
Scomberomorusguttatus
Sardaorientalis
Auxisthazard
Auxisrochei
Katsuwonuspelamis
Euthunnusaffinis
Carangoidesmalabaricus
Rastralligerkanagurta
Epinephelusareolatus
Epinepheluschlorostigma
Nemipterusrundalli
Coolaeolus japonicas
Psettoeserumei
Secutorinsidiator
Pelatesquadrillineauts
Teraponjarbua
Lutjanusgibbus
Lutjanusjohni
Fi
Leiognathusdussumeiri
Pampusargentus
Prawns Crabs
Peneaeusindicus
Peneaeus monodon
Peneaeusmarguiensis
Penaeusjaponicus
Metapenaeusaffinis
Metapenaeusdobsoni
Metapenaeusmonoceros
Metapenaeusbrivicornis
Scylla serrata
Metapograsussp
Portunussanguinolentus
Charybdis feriata
Clams
Meritrixcasta
Villorita cyprinoids
Page 114
4-67
4.12 MARINE AND ESTUARINE ENVIRONMENT
Marine and estuarine ecology forms an important part of this project as the proposed project
area is in coastal area. EIA is inevitable if estuarine or marine systems are directly involved
and/or affected due to various anthropogenic activity. Biological and ecological dynamics
forms the major component of any ecosystem, which acts as the major primary or secondary
productivity source of the ecosystem. The biological factors are directly or indirectly
controlled by the abiotic component, which includes physicochemical, and biological
characteristics of water and sediment of the aquatic ecosystem.
Marine and estuarine ecological survey for Environmental Impact Assessment (EIA) study
was carried out on May 2017. Previously a marine ecological survey was carried out during
February 2016.
A total of 6 stations were identified in the vicinity of Indian Rare Earth Ltd., Kerala Minerals
and Metals Ltd. (KMML), Chavara, Kollam district of Kerala state. Out of the 6 stations,
three were in marine system (Arabian Sea) and three were in TS Canal (backwater), parallel
to the coast. The first station was selected at 10 km off coast in the sea at western side of
IREL plant, (control station) and the second station was at the sea opposite to
Panikkarkadavu bridge (proposed mine lease location block IVEE). Third station was also
selected further north of IREL from sea near to coast, towards western side of IREL plant.
Rest of the three stations was selected in adjoining TS canal. Fourth station was selected
towards eastern side of IREL, (near to plant) Fifth station was at Vattakayal and sixth station
was beneath Panikkarkadavu bridge in TS canal. The figure 4.12 shows the sampling
locations. Biological aspects like phytoplankton and zooplankton diversity and abundance,
primary productivity, Chlorophyll and phaeophytin content, fish and shell fish fauna,
mangroves etc. were collected and analysed.
The data were collected through field investigations, laboratory analysis, desk research,
literature survey, data analysis and computation. The study area and the sampling stations for
marine sampling are shown in table 4.20. Keeping in view the proposed project location, the
inland navigational channel, shallow and deep regions of the ecosystem, point of inflow and
outflow of effluents, water and sediment sampling was carried out at six locations. Both
surface and bottom water samples were collected for analysis.
Page 115
4-68
Floats were anchored for identification of sample locations. The surface samples were
collected using a pre-acid rinsed plastic bucket and polyethylene bottle and glass bottle.
Bottom water samples were collected using a Von Dorn water sampler.
Parameters like atmospheric and water temperature, pH, total depth, light penetration,
dissolved oxygen, salinity, conductivity and productivity were measured onboard the
monitoring vessel. Samples for laboratory analysis were transferred in well rinsed and labeled
containers. The bottles were tightly capped and transported in iceboxes. Flow meter was used
to measure the velocity and the quantity of water sampled through plankton net. The flow
meter was attached with plankton net to know the actual amount of water passed through the
net.
Table 4.20 Sampling locations for marine and estuarine studies for IREL Block IVEE
Station
Location
Depth (m)
Light
penetration
(cm) Lat (0 ' ") Long (0 ' ")
S1 9 01 47.05 76 28 21.66 15 192
S2 9 02 05.04 76 30 07.45 8 110
S3 9 01 21.88 76 30 19.22 8 110
S4 8 59 29.65 76 31 28.62 3.5 60
S5 9 01 11.61 76 31 23.32 1 50
S6 9 02 17.32 76 30 33.27 2.5 55
Page 116
4-69
Fig 4.12 Marine sampling locations
Page 117
4-70
Table 4.21: MARINE ECOLOGICAL SURVEY FOR BLOCK IVEE OF IREL-KOLLAM (On Site) (May 2017)
Parameters
Station 1 Station 2 Station 3 Station 4 Station 5 Station 6
SW BW SW BW SW BW SW BW SW BW SW BW
Time 9.30 am 10.15 a.m 11.00 am 12.45pm 1.20p.m 2.10pm
Temp(degree
celcius) 29.19 28 29.7 29.7 29.8 29.3 35 34 35.7 35.1 36 34.5
Ph 7.2 7.7 7.2 7.68 7.7 7.8 7.8 7.5 6.8 7.5 7.3 7.6
Conductivity
59.9µs 59.2 58.1 56.83 56.14 54.96 11.1 17.7
8.5
milli
semens 8.6 13.3 14.7
Salinity 39.9ppt 39.4ppt 38.7 37.83 37.29 36.4 6.3 10.4 4.68 4.8 7.6 8.5
DO 6.7 5.14 6.89 5.75 6.9 6.3 8.1 6 7.68 7.8 7.5 7.4
TDS 38.94g/L 38.5g/L 37.7 36.9 36.5 35.72 7.2 11.5 5.4 5.6 8.6 9.5
Depth 15m 8 8 3.5 1 2.5
SSG 26.8 26.8 25.6 25.1 24 1.4
ORP 32.5 54.6 176 147 146.9 151 116 81.4 82 71 75 75
Page 118
4-71
Cont……
Table 4.22 : Physio-chemical parameters of marine &estuarine water (February 2016 )
Parameters pH Chloride Calcium Magnesium TSS TDS Sodium Pottassium
Units
mg/L mg/L mg/L mg/L mg/L mg/L mg/L
sw1 7.11 24850 320.6 631.8 276 37600 15637.500 590.000
sw2 7.60 20277.6 288.6 651.24 494 37200 14375.000 527.500
sw3 7.90 20078.8 328.7 602.64 486 38400 15570.000 500.000
sw4 6.90 4671.8 80.2 315.9 68 6800 3058.000 101.000
sw5 7.10 3081.4 52.1 284.31 332 5000 1799.000 67.000
sw6 5.75 5069.4 80.2 340.2 124 9000 3071.000 103.000
bw1 7.60 22265.6 360.7 631.8 342 38800 15657.500 492.500
bw2 7.70 22663.2 352.7 588.06 250 38000 16550.000 532.500
bw3 7.68 22066.8 380.8 571.05 304 37400 15250.000 477.500
bw4 6.75 6659.8 132.3 187.11 174 12400 14092.500 410.000
bw5 7.75 2982 96.2 208.98 150 4600 4515.000 172.500
bw6 7.70 5367.6 92.2 308.61 96 8600 7755.000 237.500
Page 119
4-72
4.13 Aquatic ecology
Aquatic ecology includes marine and estuarine ecology, which include assessment of
biological component of the ecosystem. The present status of the aquatic biological
components will reveal ecological dynamics and the rate of pollution of the system.
Ecological status of the system will be assessed by exploring each and every trophic levels
right from producer level to tertiary consumer level and the present study investigates the
phytoplankton, zooplankton, aquatic nekton including fishes and shell fishes along with the
estimations of primary productivity, chlorophyll and phaeophytin. Crude biomass is also
estimated to have knowledge on total biomass content over the area.
4.13.1 General methodology
Standard scientific methods were adopted for collection, transportation and preservation of
samples. Identification and analysis of samples were also done by standard keys and
procedures. Samples were collected from surface (SW) as well as bottom (BW) using a
bottom water sampler for all the stations. Results of all the parameters estimated are reported
for surface water and bottom water separately. Plankton samples were collected using
standard plankton nets for phytoplankton and zooplankton collection. Samples were
preserved in 5% formalin in situ and transported to laboratory for further qualitative and
quantitative analysis. Chlorophyll and phaeophytin were estimated adopting standard
filtration procedure. In situ productivity estimation in terms of Gross Primary Production
(GPP), Net Primary Production (NPP) and Community Respiration (CR) were done
employing standard Light and Dark bottle method by estimating dissolved oxygen and
converting it to carbon production per day. Biomass was estimated by dry weight procedure.
4.13.2 Results and assessment
Plankton Analysis
Plankton forms the basic producers in any aquatic environment. Both phytoplankton and
zooplankton constitute basic producer level and forms limiting factor for productivity of the
system. The entire dynamics, especially biological processes depend upon the diversity and
abundance of plankton in any aquatic system. Moreover, many plankton species act as
indicator organism for many abiotic and biotic parameters especially pollution, presence of
fishes/shell fishes etc.
Page 120
4-73
Phytoplankton composition, abundance and density form the basis of any aquatic ecosystem
as it forms the basic producers. Phytoplankton composition is depended upon many factors
like physicochemical parameters and the quality of the water, light availability, water current,
nutrient content, presence of other fauna and flora etc. Phytoplankton analysis can be used as
an indicator for pollution or health status of an aquatic ecosystem. Moreover, certain
pollutants are indicated by presence of certain species of phytoplankton.
Phytoplankton composition and abundance of Chavara area of Kollam obtained during the
preset study is given in table 4.23.A total of 27 phytoplankton species were identified during
the study period from all the stations including estuarine and marine species. Bottom water
phytoplankton were comparatively low along all the stations and Station 2 need special
mention in having lowest phytoplankton composition and density, which may be due to high
pollution from the mineral plant as well as due to a very low light penetration along with
other worse physico-chemical parameters. Station 2 registered a very low diversity of
phytoplankton, where only 14 species obtained from surface water and only 9 species
obtained from bottom water. Similarly, the total plankton density was also too low compared
to other stations under investigation. All other stations except station 2 registered more than
or equal to 15 species phytoplankton. All possible measures should be taken to reduce the
pollution rate at the site 2.
Table 4.23: Diversity and abundance of phytoplankton (Density Unit: Cells/litre)
recorded from Marine and Estuarine system, Chavara, Kollam
(Phytoplankton collected using 120 m mesh plankton net)
Species SW1 BW1 SW2 BW2 SW3 BW3 SW4 BW4 SW5 BW5 SW6 BW6
Rhizoso
leniasp 19 2 -- -- 11 4 23 11 331 121 332 215
Rhizoso
leniastyl
iformis
21 9 -- --- 02 10 20 2 187 45 141 47
Chaetoc
erossp --- 2 4 1 87 -- 80 24 218 211 22 --
Chaetoc
erosdeci
pens
10 -- -- -- -- -- 241 145 15 12 14 2
Page 121
4-74
Coscino
discus
sp
65 22 6 -- 54 24 517 347 14 12 201 146
Coscino
discusgr
anii
12 6 -- -- -- -- 112 95 32 15 11 --
Coscino
discus
gigas
55 -- -- -- -- 11 5 5 58 -- 42 11
Coscino
discus
wailesii
32 12 6 2 -- -- -- -- 65 60 28 12
Skeleton
emacost
atum
65 55 -- -- 56 24 54 25 343 214 158 88
Plankto
nella sol 235 14 10 8 136 36 236 114 251 236 147 123
Navicul
asp 99 88 33 13 165 54 405 125 154 124 256 214
Pleurosi
gmasp 122 17 2 -- 11 7 165 111 312 305 365 333
Nitzschi
acloster
ium
-- -- 2 -- -- -- 222 112 354 111 232 --
Stephen
opyxisp
almeria
na
-- 9 -- 3 -- -- -- -- 89 115 66 60
Dictylu
msp 69 12 25 12 -- -- 33 25 68 87 541 252
Dictylu
m sol 59 44 12 -- 35 12 -- -- 23 -- 55 --
Thallass
iothrixfr
aunfeldi
i
9 5 -- -- -- -- 33 23 113 -- 25 --
Astronei
lla
japonic
a
55 50 -- -- 25 -- 25 33 -- 22 36 66
Thallisi
oneman
itshiode
s
-- -- -- -- 22 02 -- -- 22 -- -- --
Biddulp
hiasp 324 225 44 21 -- 02 209 98 154 122 654 541
Biddulp
hiafavus -- -- -- -- 45 -- 12 11 -- -- 21 2
Ceratiu
msp 345 222 59 25 95 12 514 347 681 258 478 245
Page 122
4-75
Tricerat
ium
reticulu
m
65 55 --- --- 65 -- 309 154 -- -- 56 14
Tricerat
iumsp 254 147 19 -- 25 99 231 256 147 111 365 254
Peridini
umdiver
gens
44 14 -- -- -- -- -- -- 14 -- 8 --
Podium
sp 22 12 7 -- -- -- 6 5 33 -- 25 --
Odontel
lasp 12 -- -- -- 145 111 12 8 23 20 14 11
Unident
ified /
Parts
8 7 6 3 15 22 29 14 16 18 24 19
Total
Density 2001 1029 235 88 994 430 3493 2090 3717 2219 4317 2655
Total
Species 23 22 14 9 17 15 23 23 25 20 27 20
Zooplankton Analysis
Zooplankton composition, abundance and/or density also govern the ecosystem dynamics as
it controls phytoplankton composition and its abundance. Zooplankton forms the major
primary consumer of phytoplankton and graze upon them. Zooplankton composition also
depends upon very many factors like physico-chemical parameters and the quality of the
water, light availability, water current, presence of other fauna and flora etc. Zooplankton
analysis can also be used as an indicator for pollution level of an aquatic ecosystem and more
over the zooplankton abundance can be regarded as the ecosystem health status.
Zooplankton composition and abundance of Chavara area of Kollam obtained during the
preset study is given in table 4.24. A total of 26 zooplankton varieties were identified during
the study period apart from un-identified or plankton parts from all the stations including
estuarine and marine species. Bottom water zooplankton were comparatively low along all
the stations and Station 2 need special attention in having lowest zooplankton composition
and density, which may be due to high pollution along the area. Station 2 registered a very
low diversity of zooplankton, where only 10 groups were obtained from surface water and
only 9 varieties were obtained from bottom water. Similarly, the total zooplankton density
was also too low compared to other stations under investigation. All other stations except
station 2 registered more than or equal to 20 varieties of zooplankton.
Page 123
4-76
Table 4.24. Diversity and abundance of zooplankton (Density Unit: Cells/Litre) recorded from Estuarine system, Kollam
(Zooplankton collected using 180 µm mesh plankton net)
Species/Gr
oup
SW
1 BW1 SW 2 BW2 SW 3 BW3 SW 4 BW4 SW 5 BW5 SW 6 BW6
Tintinnopsis
sp 122 98 87 27 16 -- 35 -- 88 56 112 87
Favella sp. 159 69 102 24 123 25 325 135 265 222 252 212
Cresissp 11 -- -- -- 26 15 54 45 69 66 124 22
Calanussp 335 236 66 38 789 654 555 456 365 258 456 369
Eucalanuss
p 123 154 32 -- 198 178 236 245 147 123 159 146
Paracalanu
ssp 112 102 -- -- -- -- 23 22 56 -- 54 23
Acrocalanu
ssp 155 125 -- -- 124 78 101 99 36 25 145 155
Acartiasp 28 11 12 -- 234 222 189 178 35 -- 245 223
Other
Calanoids 265 105 47 14 589 458 456 258 369 357 298 287
Other
Cyclopoids 145 126 54 41 564 444 269 145 256 199 325 269
Page 124
4-77
Macrostella
sp 11 -- -- -- 22 -- 55 17 -- -- 26 23
Other
Harpaticoid
s
109 91 26 12 187 144 325 241 236 214 478 365
Other
Copepods 354 254 45 10 654 456 654 365 365 265 487 235
Cladocerans 225 168 -- -- 324 125 452 236 546 412 325 222
Mysids 88 29 10 03 22 14 54 34 26 22 45 25
Sagitta/Cha
etognaths 67 41 04 -- 54 11 87 11 36 33 65 28
Polychaete
larvae 12 124 -- 02 65 147 11 225 26 145 11 145
Decapod
larvae 08 25 -- 12 11 51 23 125 21 88 54 135
Copepod
nauplius 23 -- -- -- 56 23 55 23 147 111 245 187
Zoea larvae 36 -- 03 -- 254 154 325 -- 241 22 321 154
Schizopoid
larvae 32 12 -- -- 23 -- 254 123 222 121 211 22
Alima 56 14 06 -- 55 15 124 100 128 87 124 34
Page 125
4-78
larvae
Lamellibran
ch larvae -- 32 04 -- 23 88 11 147 23 254 21 145
Gastropod
larvae 04 54 -- 23 24 231 -- 154 -- 241 23 147
Fish eggs /
Larvae 10 -- -- -- 23 44 26 58 36 38 69 58
Other larval
forms 21 11 02 -- 25 23 26 33 145 112 178 169
Unidentifie
d/Parts 12 5 3 6 19 25 26 32 24 18 42 36
Total
Density
2523 1886 503 212 4504 3625 4751 3507 3908 3489 4895 3923
Total
Species 25 21 15 11 25 22 25 24 24 23 26 26
Page 126
4-79
Chlorophyll a and Phaeophytin
Chlorophyll a is the photosynthetic pigment present in green plant/ phytoplankton. The
productivity of a water body is directly proportional to the Chlorophyll concentration. The
abundance of plankton, especially phytoplankton indicates that the photosynthetic activity is
efficient and is largely responsible by phytoplankton rich in chlorophyll a values.
Chlorophyll and phaeophytin contents of the study area are given in table 4.25. The
chlorophyll a content of second station, where there was an influence due to effluent
discharge from KMML takes place was below detectable level and almost uniformly
distributed at other stations. For bottom water samples, a lesser value than surface water was
observed throughout the stations. Chlorophyll value for surface water ranged between 1.548
and 2.878 mg/L. For bottom water, the values ranged from 0.654 to 2.014 mg/L. The
Phaeophytin range varied from 1.087 to 2.014 mg/L and 0.752 to 1.564 mg/L for surface
water and bottom water respectively.
Page 127
4-80
Table 4.25: Chlorophyll ‘a’ and Phaeophytin content at Marine and Estuarine system,
Kollam
Water Sample Station Chlorophyll a
(mg/L)
Phaeophytin
(mg/L)
Surface Water
SW1 2.541 1.658
SW2 ND ND
SW3 1.548 1.087
SW4 2.341 1.998
SW5 2.014 1.875
SW6 2.878 2.014
Bottom Water
BW1 0.654 0.752
BW2 ND ND
BW3 1.091 0.789
BW4 1.582 1.104
BW5 1.112 1.147
BW6 2.014 1.564
ND – Lower than Detectable Level
Page 128
4-81
Productivity (Primary Production)
Primary production is the rate at which new organic matter is added to the existing
phytoplankton. Primary productivity depends on the chlorophyll pigments, which absorbs the
light and produces the energy through the process of photosynthesis. Therefore, the
estimation of these pigments is very much important to ascertain the productivity of aquatic
environment. It is expressed as mg carbon per cubic meter per light day (12 hr photoperiod).
Primary productivity is the total energy trapped from sunlight during the photosynthesis using
carbon dioxide and nutrients. Primary productivity is the major factor governing any
ecosystem dynamics. All other biological components depend on productivity, which relay
upon the abiotic factors.
The productivity values of the present study are given in table 4.26. The Gross and the net
primary productivity were found to be high along surface waters of all stations and little low
value was recorded in the bottom water samples as light penetration and phytoplankton
concentrations are maximum at surface waters. But bottom waters lack enough light
penetration and plankton concentration which lead to low productivity. Maximum surface
water productivity was found to be in station 1 followed by station 6 in the canal and the
lowest productivity recorded at station 2, where effluent discharge point located. Bottom
water productivity was lower than detectable level in station 2 due to lack of adequate light
penetration. Bottom water productivity was high along station 6 in TS water canal.
Page 129
4-82
Table 4.26: Primary Productivity (mg C/m3/12 Hr.) at Marine and Estuarine system,
Kollam
Water
Sample Station
Gross primary
production
(GPP)
Net primary
production
(NPP)
Community
respiration
(CR)
Surface
Water
SW1 8.65 6.96 1.60
SW2 0.26 0.19 0.07
SW3 1.56 1.00 0.56
SW4 3.56 2.56 1.00
SW5 5.66 3.98 1.68
SW6 7.25 6.11 1.14
SW7 6.54 5.44 1.10
Bottom
Water
BW1 4.11 2.56 1.55
BW2 ND ND ND
BW3 0.87 0.55 0.32
BW4 1.98 1.02 0.96
BW5 3.55 2.09 1.46
BW6 5.29 3.33 1.96
ND – Not detectable
Page 130
4-83
Biomass
Biomass of water in terms of dry weight of phytoplankton and zooplankton pooled from each
station was analysed. Dry weight of phytoplankton was calculated from the Chlorophyll
value, which is a direct indicator of phytoplankton biomass. It has been estimated that
chlorophyll forms 2% of the dry weight of phytoplankton (APHA, 1995).
Table 4.27depicts dry weight biomass, which is found to be high in station 1 followed by
station 7 along surface water and dry weight could not be estimated in station 2. Bottom
water biomass was also high in station 1. Ash weight of the samples was also followed same
pattern like that of dry weight biomass.
Table 4.27: Dry weight (mg/L) and ash weight (mg/L) of phyto- and zooplankton at
Marine and Estuarine system, Kollam
Water Sample Station Dry weight Ash weight
Surface Water
SW 1 0.065 0.044
SW 2 ND ND
SW 3 0.041 0.031
SW 4 0.045 0.035
SW 5 0.051 0.042
SW 6 0.057 0.040
Bottom Water
BW 1 0.048 0.028
BW 2 ND ND
BW 3 0.028 0.020
BW 4 0.045 0.028
Page 131
4-84
BW 5 0.044 0.021
BW 6 0.056 0.028
ND – Not detectable
4.14 Sediment Ecology
4.14.1 Sediment characteristics
4.14.2 Benthos
Benthos is a collective term referred to the organisms lying in or associated with aquatic
sediment comprising bacteria, plants and animals from almost all phyla. Benthic animals are
generally described on the basis of their position in the sediment. In fauna are the animals
living within the interstitial space or burrows. Those occupying the sediment surface are
termed as Epifauna. Again, benthos is categorized into three based on their body size, as
micro-fauna (1-100 µm) comprising bacteria, protophyta and protozoans other than
forminifera, Meio-fauna (100-1000 µm) including foraminifera, small metazoans, nematodes
and small invertebrates including crustacea and Macro- or Mega-fauna (above 1000 µm)
comprising of several macro invertebrates. Macro-benthos usually tends to concentrate in the
upper oxygenated layer of sediment except the true anaerobics.
Benthic fauna has been found to play a significant role in the trophic network, as they utilize
all forms of food material available in the sea-bed or estuarine base and form an important
link in the transfer of energy. The biodiversity of benthic fauna suggests the health of the
aquatic system. Hence one of the important aspects of the benthic studies is the assessment of
pollution through benthic fauna analysis. Since many pollutant settles down on sediments,
effect of pollution at once reflects on the standing crop and productivity. Relationship of
benthos with abiotic parameters especially with the sedimentological features has explained
most of the fluctuations in benthic abundance.
Page 132
4-85
4.14.3 Materials and methods
Sediment samples were collected from all stations using Peterson's dredge/grab having a
biting area of 16 x 17 cm. The sediment obtained was sieved through required meshes to
separate macrofauna (> 500 µ) and meio fauna (which pass through 0.5mm sieve and are
retained by a 1000 µ sieve). Each group of organisms was individually identified and a
quantitative and qualitative analysis has been done. Themeio-fauna is represented in
individuals/100 cm2.
4.14.4 Results and assessment
Meio-benthos
Table 4.28Meio-benthos recorded from six different locations of Marine and Estuarine
system, Kollam
MEIO FAUNA / FLORA (No./m2)
Group/Species I II III IV V VI
Foraminferan shells 16 08 187 356 354 177
Tintinnida -- 03 125 264 145 162
Bipalium sp. 06 05 45 56 24 102
Globigerina sp. 18 -- 22 88 39 --
Nematode worm 28 12 77 46 78 98
Gastropods 42 08 59 78 102 101
Diatoms
Coscinodiscus sp. 12 14 158 245 178 221
Pleurosigma sp. 33 05 156 111 138 97
Nitzschia sp. 09 -- 112 65 -- --
Skeletonema sp. 32 08 101 77 66 58
Navicula hasta 21 -- 98 36 44 --
Coccoliths 14 03 45 -- 12 12
Bacillaria sp. 22 -- 36 -- 16 08
Gastrotricha 18 15 41 12 -- 22
Copepods 16 12 122 286 258 267
Larvae/Eggs 29 -- 65 56 254 221
Unidentified/Parts 24 11 123 45 138 105
Page 133
4-86
Meio-benthos formed the important component of the benthic diversity. Analysis of meio-
benthos from six different stations is given in table 4.28. Meiofauna of the area was
represented by a wide variety of organisms representing different phyla and/or groups,
including zooplankton groups. More than 8 groups of organisms were identified from
sediment analysis of which diatoms formed the major part of organisms. Maximum
representation of meiofauna was recorded in station IV and the least was in station II, where
only 6 types of meio-benthos were identified. The reduced rate of meiobenthos along station
II might be due to the effluent deposition/siltation from the factories of KMML Ltd.
4.14.5 Macro-benthos
Larger benthic organisms form macro-benthos group and are listed in table 4.29. A total of 7
groups of organisms or parts of organisms were identified from all the six stations. Molluscan
shells formed majority of the macrobenthos. Other macrobenthos like crabs and other
crustaceans were found to be comparatively low along all the stations but represented in
fairly good number in stations III onwards. Station II recorded the least benthic diversity and
abundance, which might be due to the effect of effluent from the factory.
Page 134
4-87
Table 4.29: Macro- benthos recorded from six different locations of the Marine and
Estuarine system, Kollam
MACRO-BENTHOS (No./m2)
Group/Species
I II III IV V VI
Lamellibranchs shells 33 11 98 178 205 114
Gastropods shells 12 09 26 65 56 78
Bivalve shells 11 -- 15 08 36 25
Crustacea -- -- 12 23 14 16
Amphipods 04 -- 18 18 45 44
Worms 22 03 18 42 26 46
Other small shells 22 11 78 56 48 54
Unidentified/Parts 07 09 33 25 34 44
Conclusion
Marine ecological and sedimentological study from six stations from the vicinity of KMML
and IREL was assessed for the environmental impact study and the present status of the
biological properties of the six stations were investigated and reported. Station II near to
KMML was poorly represented by both fauna and other biological parameters like primary
productivity and chlorophyll. Abundance and diversity of benthic fauna were also low in
station II, which may be due to effluent discharge from KMML and is not a result of mining
and supporting activities. Proper mitigation measures should be adopted as as given in
chapter 5, to reduce pollution due to the effluent. Other options for effluent discharge should
also be explored to conserve the ecological balance of the micro-environment.
Page 135
4-88
4.15 COASTAL EROSION IN BUFFER ZONE OF STUDY AREA (BLOCK IV)
The shoreline of Kerala has been subjected to severe coastal erosion in recent times. In the
monsoons, two third of the shore line is vulnerable to dynamic changes. Recent experience
drives home the point that there can be events like Tsunamis. In a study by the AMDER in
Chavara deposit in the period 1970 to 1977, an extent of 177.04Ha of land was lost by marine
erosion with an average of loss of 0.86m2 per year. Hence uninterrupted sediment flow from
hinterland to the sea is a major factor to contain sea erosion, building of raised beaches.
The sand on beaches is not static. The wave action constantly keeps the sand moving in the
surface wash zones and when waves strikes the coast at an angle, the net result is long shore
current and beach drift which collectively move sand along the coast (Littoral drift). The sand
on the coastal beaches is supplied by the rivers which transport it from the areas up stream
where it has been produced by weathering of crystalline rocks. The material flow is hindered
by building dams in the upper reaches of the rivers that effectively trap the sand,
consequently the beaches are deprived of sediments.
Seawalls or concrete or rip rap may help to retard erosion, but are not always effective
because considerable erosion may occur at the extremity of the protective structure. Besides,
the sea walls tend to produce a narrower beach with less sand, particularly if the waves are
strongly reflected and unless adequately designed. Beach erosion along the coast may also be
due to heavy monsoons, unrestrained sand mining in rivers, estuaries / lakes etc.
Page 136
4-89
4.15.1 Sea Erosion in parts of Kollam to Alappuzha
The shoreline fluctuation studies over a time gap of 55 years (1910-1965) by Thrivikramji et
al. (1983) using Survey of India topo sheets have shown that the Kerala coast has gained 41
km2 by accretion and lost 22 km2 by erosion. Studies on beach profile conducted by
Thrivikramji.et al (1983) during the pre-and post-monsoon showed that all along the coast
from Cape Comorin to Mangalore, 30 million tons of sand were removed by waves from the
shore face of Kerala, while 11 million tons were added in different sectors.
Apart from natural phenomenon, the man-made structures along the coastline act as barriers
to the material' and energy balance, and produce adverse effects on the stability of the nearby
coast. Some of the man-made barriers are dredged channels, jetties, groynes, seawalls and
break waters. The structures constructed along ports and harbours have triggered many
environmental problems in addition to upsetting the sand balance in many locations of the
coastal zone. Eravipuram beach, south of Kollam is a narrow curved beach south of
Thankassery headland. The entire stretch of the beach is protected by sea walls. Ithikkara
river falls south of this beach and Ashtamudi Lake present on the north. The beach width is
about 50 m with a gently sloping backshore, covered with beach vegetation. The beach
undergoes rapid erosion during April to June followed by a slow accretion till July and
erosion during August to September. Subsequently the beach builds till December and shows
an erosional trend during December-January. The storage volume shows that the beach has a
maximum storage volume in April (425.4 m3/m), and a minimum storage volume in June
(371 m3/m) followed by a slight building up during July-August and erosion during
September (373.6 m3/m). This is followed by an accretional trend during October-December.
In general, the beach shows an erosional trend over a period of one year. At Kollam, the
average grain size, shows the presence of coarse sand (>5 mm). From March to June, the
sand size shows medium sand size class (0.30 mm - 0.38 mm) except in May (0.53 mm).
Two peaks of coarser grain size are present, one during the south-west monsoon season and
another during the north-east monsoon season with size class 0.95 mm during July and 0.96
mm during October. Medium size sand is observed during the other season. During July to
August, the sorting value shows a poor sorting tendency. The samples show negatively
skewed nature during most of the period except during April and June when they are
symmetrical. This shows that the beach in general undergoes erosion during the period of
study.
Page 137
4-90
4.15.2 Long-shore sediment transport:
The long-shore movement of beach sand poses a potential littoral problem. The important
factor governing the beach erosion is the long shore sediment transport which is controlled
predominantly by waves and near shore topography. An understanding of sediment transport
on beaches is also necessary for the analysis of formation of the geomorphic features such as
sand spits and barrier islands, to examine the tidal inlet processes and to understand their
irregularities in the shoreline. Interruptions of these natural movements of sands by manmade
barriers like groynes, breakwaters, jetties etc. result in sediment updrift side and removal of
sediments on deposition on the down drift side. This results in the necessity to study the long
shore sediment transport around inshore coastal areas, which is of fundamental interest to
coastal engineers in the planning of structures, dredging activities for ports and spoil disposal.
Page 138
4-91
Fig 4.13 Temporal changes of block IV EE boundary
Page 139
4-92
Fig 4.14: Shore line change detection of IREL Block IV (buffer zone)
A proper understanding of the seasonal littoral transport trend is important for the efficient
management and development of coasts. Beach erosion problems along this coast have been
the initial motivation for this study on sand transport by estimating the rate of sand
movement. Since estimation of the rate of littoral sand drift is one of the essential items
Page 140
4-93
necessary for the field investigation in regard to beach protection and sedimentation
problems, much effort has been made in establishing a method of estimation by coastal
engineers. The dynamics of sediment movement in the littoral zone is governed primarily by
the wave induced currents. Specific knowledge of these currents and associated circulation
patterns are helpful in better utilization of the coastal environment.
In the near shore area, waves arriving from offshore continuously bring in momentum,
energy and mass. Since the fluxes are dissipated in the surf zone, most of the energy is
converted into turbulence in the breaker zone but enough is left to drive a near shore current
system and move loose bed material. The momentum brought in by the waves will drive the
littoral current system and cause a local set-up or set-down of the mean water level. The
dynamics of sediment movement in the littoral zone depends mainly on four factors: the
nature of the material available for transport, orientation and other geomorphic features of the
shore, the angle of wave approach and the wave induced currents. Waves arriving at the shore
are the primary cause of sediment transport in the littoral zone. Higher waves break further
offshore, widening the surf zone and setting more sand in motion. Changes in wave period or
height result in moving sands onshore or offshore. The knowledge about the wave
characteristics- the combined distribution of wave height, period and direction during
different seasons is required for an adequate understanding of movement of sand in any
specific area. The cellular circulation patterns in the surf zone depend on the long shore
gradient in wave setup. Because of the turbulence due to breaking and surging of waves,
large volumes of sediments are placed in suspension or rolled along the bed in the surf zone.
The long shore movement of beach sand poses a potential littoral problem. The important
factor governing the beach erosion is the long-shore sediment transport which is controlled
predominantly by waves and near shore topography. An understanding of sediment transport
on beaches is also necessary for the analysis of formation of the geomorphic features and to
examine the tidal inlet processes, to understand the irregularities in the shoreline. This creates
a necessity to study the long-shore sediment transport around inshore coastal areas, which is
of fundamental interest to coastal engineers for management of various coastal activity.
Page 141
4-94
Fig 4.15: Sea eroded area of IREL block IV (buffer zone)
In order to assess the shore line changes as a result of sea erosion in the study area, the shore
line in Survey of India Toposheet (1968) and the cadastral maps (survey map prepared by the
Survey and Land Records department (prior to the resurvey) were geo referenced and
compared with the Google Earth image (2017) . It was observed that after span of nearly 50
years, the shoreline has changed towards landward side nearly 50 m near Panikkarkadavu
Page 142
4-95
bridge (northern limit of Block IV) and 374.40m along the southern side. It was also
estimated that an area of 17.5089 Ha out of the Block IV mining lease area 40 .566 Ha of
IREL was lost consequent to the sea erosion.
4.16 Traffic Survey
The traffic survey was monitored at five locations. The locations monitored are given in the
table 4.30 below. The locations selected are,
(1) Traffic between the Panikkarkadavu Jn to Block IV EE Mine office.
(2) Traffic on the Panikkarkadavu bridge
(3) Proposed alternate route traffic density
(4) S.V market road
(5) Traffic intensity at Karunagappally junction
The traffic survey data conducted on 12/10/17 is given below.
The main objective of conducting the traffic survey is to estimate the traffic load towards the
Block IV EE mine lease area, traffic on the Panikkarkadavu bridge which includes trucks to
the IREL plant and other vehicles towards Mata Amritha Madam, traffic at proposed alternate
routes and the traffic at the main junction of the NH. This survey helps in planning of traffic
routes of the tippers to avoid traffic congestions due to the activities of Block IV mining,
without disturbing the local inhabitants.
Page 143
4-96
Table 4.30: Traffic survey
Site Location Time
Vehicles
Sl
no
2/3
Whee
lers
4 w
hee
lers
LC
V
&
min
i
buse
s H
MV
Tota
l
1
Towards
Block IV
EE
Mining
site
Latitude
9°
2’
14.6
9”
9.50am
to 10.50
am
Towards
IREL block
IV at bus
stop
132 40 4 48
419
Longitud
e
76
º 30
’ 30.8
6”
From IREL
block IV
towards
Karunagapal
ly
136 12 3 44
Total 268 52 7 92
2
At
Panickar
kadavu
bridge
Latitude
9°
2' 1
4.6
9"
11am to
12 pm
Towards
Karunagapal
ly
136 16 3 4
319
Longitud
e
76°
30'3
0.8
6”
29.3
592"
From
Karunagapal
ly
120 28 8 4
Total 256 44 11 8
Page 144
4-97
Table 4.30 Cont.
3 Alternate
route
Latitude
9°
02' 1
9.5
7"
12.10
pm to
1.10p
m
Towards
S.V
market
40 8 4
101
Longitude
76°
30' 5
6.4
9"
From
S.V
market
40 4 4 1
Total 80 12 8 1
4
S.V
market
road
opposite
Manappu
ram
polyclini
c
Latitude
9°
02' 0
.41"
2.00p
m to
3.00p
m
Towards
Kanneti
bridge
32 6 3 1
73
Longitude
76°
31' 4
.52"
From
Kanneti
bridge
20 4 5 2
Total 52 10 8 3
LCV – light commercial vehicle HMV – Heavy motor vehicle
5 Karunaga
plly
Junction
(NH)
Latitude
9 2
59.0
3
4.00p
m to
5.00p.
m
Toward
s
Kollam
860 408 32 72 2576
Longitude
76 3
2 9
.47
From
Kollam
664 336 80 124
1524 744 112 196
Page 145
4-98
4.17 Land use of the study area
Land use involves the management and modification of natural environment or wilderness
into built environment such as settlements and semi-natural habitats such as arable fields,
pastures, and managed woods
For the proper understanding, planning and the decision making of a system, either spatial or
temporal, adequate information on many complex interrelated aspects and its activities are
needed. Land use is one of such aspects that help experts to make adequate decisions to
overcome the problems of hazards, uncontrolled development, deterioration of environment,
loss of prime agricultural land or change in land use. Hence for the proper understanding of
the study area a land use map is prepared by using spatial technology.
The land use map of the study area, with a buffer of 10km from the boundary of IREL
Block –IV EE mine lease was done by using GIS techniques. The land use was created by
using the software tool of Arc Map 10.3. The primary data used was the Linear Imaging Self
Scanning Sensor (LISS) of the year 2016 and is also compared and validated with the data of
the Bhuvan data explorer. LISS is considered as the base map for the production of the land
use in the present study. Land use was created by digitizing the features by visual
identification methods. Eight such primary features were identified and created and they are
• Mixed vegetation
• Water bodies
• Mining area
• Paddy converted
• Railway line
• Industrial area
Page 146
4-99
Fig4.16: Land use and landcover map of study area
Page 147
4-100
4.18 SOCIO-ECONOMIC SURVEY
In the study area/ ML area more than 550 families resides.For the survey a total of 300
families were selected and interviewed. It is to be noted that the people residing in and
around the site were not evacuated. In the proposed project, option for alternate mining site
has little relevance since it is mainly guided by the availability of mineral deposits.
The main objective of the study is to assess the extent of socio-economic impact of sand
mining in the lease area and its surroundings. The areas considered for the study are in
Alappad, Panmana and Ayanivelikkulangara Villages of Karunagappally taluk in Kollam
district.
Pilot Study:
With the intention of forecasting flaws and problems and the plausibility of the research, a
pilot study was conducted. Discussions with various people and officials concerned with
mining were carried out which helped to identify and understand the situations and problems.
Ten (10) families in mining area and ten (10) families in buffer zones were selected and
interviewed. The interview schedule was administered on these respondents to find out
whether the questions were simple enough for them and whether the data collected through
them were adequate, reliable and valid. With the use of simple statistics, analysis was carried
out. In the light of pilot study, the methodology and schedule were modified and finalised.
Pre-test
A pre-test was also conducted in Block-IVEE, Karunagappally, Kollam district by
administering the schedule to 10 families. It was found that some of the questions were
unnecessary and were not understood by the respondents, mainly among the less educated.
For some questions, the response was repetitive. The unreliable, ambiguous, suggestive and
repetitive questions were suitably modified or discarded. The questions were then finalised
and coded.
Data Collection
The field study was conducted in March, 2016. The Investigators were from the same place.
All the respondents were interviewed in their homes. Some respondents compelled the
investigators to raise the need for getting facilities form the concerned agencies. A few
Page 148
4-101
respondents’ particularly unemployed and old people were articulative about their problems
etc. In rare cases, a few respondents were hesitant to provide necessary details. However,
when the researchers could convince them of the real purpose, they fully cooperated. Usually,
the interview lasted for 50 to 60 minutes, depending on the time required to establish rapport.
4.18.4 Results and Discussion:
1. Age
Age of the people has prominent importance as this influence the accuracy and correctness of
information. Besides, maturity depends on age and this provides knowledge and analytical
power to understand the issues. All the respondents selected for the interview were head of
the families. It is seen that the most (28.3%) of the respondents interviewed belonged to the
age group 46-65 years followed by 36-45 (16.7%), above 75 years (15%), 66-75 years
(12.3%) and 26-35 years (6.7%).
2. Sex
Sex is also very important as far as information is concerned. From the table it is clear that
the majority (80.7%) of the respondents were males followed by females (19.3%). It is
because of the reason that the head of the families are generally males in Kerala and that is
why the most of the respondents availed were males. Actually, they are the main person in
the family and intervene in various issues. So, their information is important.
2. Marital Status
Marital status is also significant in providing correct information on issues and problems in
the society. The issues and problems related to mining mostly affect the families rather than
the individuals. From the table it is clear that the respondents under study are mostly married
(81.7%) while 14.7 percentages belonged to the category of widowers, widow (2%) and
unmarried (1.6%). The information provided by them is reliable and valid and highly
important to the concerned agencies.
3.Education
Education means not simply stuffing minds with information but to change the attitude and
outlook of a person. Education helps a person in his socialisation process. There is drastic
difference between educated and uneducated person. It contributes a lot to sophistication of
behaviour and understanding of issues. From the table it is understandable that 41.7
Page 149
4-102
percentages of the respondents were high school educated. This shows that they are having
average education and this makes them to analyse the issues to a certain extent. So, their
reaction and response are important related to the issues come out from mining.
4. Occupation
It is very essential to know the occupation and means of livelihood of the people in mining
area as this helps in formulating the policies and programmes of rehabilitation and
resettlement. So, question was asked and data collected. The analysis of the data showed that
the most (78.4%) of the respondents were engaged in fishing followed by unemployed and
employed either in government or private institutions (8.3% each). Fishing is the main
occupation of the most people residing here and generally mining affects much in this
category of occupation. This shows that the most people’s livelihood is affected seriously by
mining. This fact may be noted.
5. Annual Income
Income is an index of social status and life style of an individual. So, question was asked to
know their income and whether they are leading a satisfied life or not. This information is
very important while making programmes and policies for rehabilitation and resettlement.
From the table it is seen that the most (73.4%) of the respondents belonged to the income
group below Rs. 20,000/- per year while 14.3 percentage as Rs. 20,001- 40,000/-. This shows
that majority of the people are below poverty line. A large number of the respondents were
engaged in fishing and this work is interrupted to a certain extent through mining in the
locality. Hence, they are not able to get regular income which reduces their income. This
point may be noted and seriously considered
6. Language
Cent percentage of the members reported that they speak Malayalam, the state language
which is their mother tongue. From this it is clear that the respondents who reside in the
mining area are Malayalees.
7. Family Members
Today, it is quite natural that the families are small and members are less compared to olden
times. So, question was asked to know the number of members in the family and data
collected. From the table it is clear that a lot (71.3%) of the members had 3-4 members
Page 150
4-103
followed by 5-6 (14.4%), 7-8 (8.3%) and 1-2 (6%). It is quite natural that the families in
Kerala are nuclear and very few are joint and extended families
8. Type of Family
From the table it is seen that the majority (77.4%) of the respondents reported as their family
is nuclear followed by extended (14.3%) and joint (8.3%). This is in consonance with the
general pattern of families in Kerala. The joint and extended families were old type of
families. Now, it is very rare to see such families. It is due to various reasons like democracy,
industrialisation, modernisation and westernisation.
9. Type of Occupancy
To understand whether families live in own or rented, question was asked and data collected.
It is clear that 97.7 percentage of the respondent reported that their families are living in their
own building while 2.3 percentages as in rented house.
10. Nature of Ownership
Ownership includes either inherited or purchased. Those who get share from their parents are
called inherited. The parents may have the house already inherited or purchased that may be
transferred to their offspring. Purchased includes houses which are bought from their own
earned money. The findings got from the analysis showed that 94.7 percentage of the
respondents reported that the nature of ownership is inherited followed by purchased (5.3%).
This shows that almost all of them have availed the land as inherited. It is clear that their
families are living here for years and years ago. Traditionally, they are living here and
engaged in their own occupation. And they are socially and culturally accustomed to this
area. The sentimental attachment of the people of this soil necessarily compels them to stay
here. So, care and caution may be taken while evacuating them from this area.
11. Main Source of Personal Income
In order to find out the source of personal income questions was asked and data collected.
The analysis of data showed that the majority (78.4%) of them were engaged in wage based
jobs followed by salary and no income (8.3% each). They lead a life of difficulty due to
meagre income from wage.
12. Assets (Immovable)
Page 151
4-104
To know whether the inhabitants have land with pattayam or not, question was asked and
data collected. The analysis of the data showed that the cent percentage of the respondents are
having pattayam inside the study area while 22 percentage informed that they have pattayam
outside the study area while 76 percentage have no Pattayam. Here we were able to find out
that the majority of title holders belonged to the others category mostly women and only 8
percentages reported that the title holder was men (husbands)
13. Creation of social unrest in your area due to mining
Social unrest is an index of social problem which has to be eradicated for smooth functioning
of the society and peaceful family life. The findings are given in the table regarding this. It is
seen that 66 percentages reported that that there is no social unrest among the public due to
mining followed by to a great extent (18%) and to some extent (16%).
14. Unfavourable Impact on health due to mining
It is very important question whether there is any unfavourable impact on health due to
mining. The analysis of the data shows that the 66.6 percentage of the respondents reported
that there is not at all unfavourable impact on health due to mining while 26.7 percentages as
to some extent. So, adequate and proper action plan has to be formulated for avoiding such
negative impact of mining.
15. Increase of lungs/kidney diseases among the public
Question was asked whether there is any increase of lungs/kidney diseases among the public
and 86.7 percentage of the respondents reported that there is not at all followed by to some
extent (7.3%) and to a great extent (6%). This may be due to mining and proper defensive
action has been taken, failing this will lead to social resistance against mining.
16. Decrease of cancer diseases among the public due to mining.
It is very interesting to note that 70.7 percentage of the respondents reported that there is no
decrease of cancer among the public due to mining followed by to some extent (20.7%) and
to a great extent (8.6 %).
17. Increase of mosquito problem after the mining
Question was asked to know whether there is an increase of mosquito problem or not for
which data collected. It is seen that the 41 percentage of the respondents reported that there is
no increase of mosquito problem followed by to some extent (40.7%) and to a great extent
Page 152
4-105
(18.3%). The findings showed that there is such problem either to a great extent or to some
extent. Various methods are available to avoid the problem of mosquitoes but not made
available here from the side of mine operators. So, steps have to be taken to eradicate
mosquito problem.
18. Spread of Filariasis among the public
Filariasis is a disease that emerges from mosquito problem. So, question was asked. The
analysis of the data shows that the most (66.7%) of the respondents reported as there is no
spread of filariasis here followed by to some extent (24.7%) and to a great extent (8.7%).
This may be due to the fact of prevention programmes of the Health Department,
Government of Kerala.
19. Whether the mine operators have approached you to purchase the land
To know whether the mine operators approached to the people to purchase the land majority
(91.7%) of the respondents reported that the mine operators have not approached to purchase
the land. From the study it is found out that there is 8.3 percentages of the families living here
reported yes.
20. Are the mine owners willing to give the existing market price, if so what is your plan
It is seen that a lot (61.7%) reported that their plan is to retain the land for better prospects
followed by to sell it off to the mine owners (30%), IRE should back fill the area after mining
(5%) and wait and see (3.3%). So, adequate and special steps have to be taken to vacate them.
Summary and Conclusion of Socio Economic Studies
Mining Area
The IRE is an important concern has its own pros and cons. The industry attracts foreign
currency, but the socio-economic impact due to the extraction process of the soil necessarily
invites a good number of issues-both positive and negative.
The air emissions in the area and the frequent movement of the vehicle necessarily invite air
and sound pollution which affects the people in the locality on their health and family life. It
is a fact that the company is very cautious in reducing the pollution at all means. More and
more precautions are to be taken to reduce the pollution in the least manner. Moreover, the
company has to take steps to intensify the water cleaning process and the like issues.
Page 153
4-106
It is a matter of the fact that the income of the family is comparatively low and all inhabitants
are compelled to find out alternative source of income to meet their daily bread. Though the
quantum of the land under their disposal is limited as well as the fertility of the soil is
diminishing due to mining. So, land utilisation for agricultural purpose is insignificant.
The people in the area have different occupational skill. It is understood that almost all people
in this area are using potable water. The vehicle carrying the water is reaching the area at a
particular time and the people have to wait to collect water from the distributors. If due to
unseen circumstances, they are unable to collect their share of water they will lose the chance
to collect the pot water for their daily needs. Most of the wells have dried and if little is
available. it is contaminated. The survey reveals the fact that due to mining sea erosion is
common. The people are to be protected from this catastrophe. This problem has to be
addressed without delay.
Majority of them reported that their income from the traditional jobs is diminished. Though
they are sparing more time compared to pre-mining period the income is less. So, in the
formulation in the R&R, this fact may be given much priority which will reduce their anxiety
as well as upbringing of their family. It is fact that the mining has invited a lot of health
issues among the people especially in the spreading up of cancer, kidney and lung diseases.
The allergic and skin ailments are also increasing among the people. Another important
sensitive issue of the locality is resettlement. The existing families in the mining area are still
not willing to vacate the present place of settlement. If the resettlement problem is found
essential the company has to take adequate and reasonable decision in the matter of the land
under their disposal.
Buffer Zone
The Buffer Zones around the mining area were taken for the study which has been subjected
to mining. As far as the agriculture is concerned, like in the mining area, there are no special
agriculture but coconut and palm groves only and supported with pot water irrigation. They
have no agricultural loan or subsidy as they do not have large scale farming. Regarding the
duration of the occupancy of the present place, majority of them are of opinion that they were
occupied the land years and years ago. Their main occupation is fishing followed by driving,
electrical repair etc.
Page 154
4-107
The poor and innocent people are always fond of religious ceremonies and have close
connection with religious leaders. The people as a whole in this area revealed that they were
not influenced either by politicians, social activists or the like in the matter and hence the
religious institutions are free from any troubles.
During the pre-mining period, the majority of the people were engaged in fishing, daily
labours and driving. After the mining process started the life situation of the people has not
been changed much. They followed more or less the same job and earned their daily needs.
But, the mining has created some problems in the matter of their daily income. The people
outside the mining zone are hesitating to purchase the fish, coconut and such products from
the mining area. This resulted in the decline of their daily income. Though they are
compelled to spare more time and energy to cope with new situation, they are struggling to
meet both ends.
As far as their social stratification is concerned they are able to keep up with old relations as
it is and hence there won’t be any feud and faction among the people or social unrest. Mining
has created some problems on their health matters and lion share of them have reported that
the diseases like cancer/kidney or lungs are not on its increase. Proper defensive action on the
matter of pollution problem is on the dire need of the hour. Otherwise the social unrest
among the people will be unbalanced.
The stagnant water in the mine pits has created the problem of increasing the mosquito and
related diseases like filariasis, skill ailments and allergic disorders. Another serious issue of
the area is the depletion off well water, its quality, and dust pollution. There are other issues
like soil erosion, land degradation, land slide, fear about vehicle accident, increase in traffic
load etc. The survey made it clear that effective and time bound proper action to resolve the
issues are of urgent nature.
Though, there are problems confronted with people of this buffer zone area, they are not
willing to let the land acquire for the mining project. A small portion of the people in the
locality is of opinion that they are willing to let the land on certain conditions especially in
the land value and proper R&R.
Page 155
4-108
4.19 Radiation Survey
Pre-Operational Radiological Monitoring at the proposed mining site of IREL, Chavara at
Vellanathuruthu coastal region of Kollam District, Kerala
The pre operational radiological monitoring of the proposed mining area at Vellanathuruthu
region was carried out by Health Physics Unit (HPU) of IREL Udyogamandal along with
HPU of IREL, Manavalakurichi. The site is located in the Alappad village of
Karunagappally and lies between the latitude of N 9002’ 44 to 9003’ 74 and longitude 760 50’
61 to 760 56’ 77.
4.19.1 External Gamama radiation monitoring
An extensive radiation survey of the mining area was carried out using a sensitive Geiger
Muller tube detector integrated with Global Position System (GPS) and a pocket size
radiation survey meter (Rad Eye PRD) which incorporates a high sensitivity NaI (Tl) detector
with an integrated photo multiplier tube. Measurements were recorded at 1m above the
ground level. Gamma ray exposure rate at eighteen locations along with latitude and
longitude values is given in Table 4.31
Table 4. 31: External Gamma radiation monitoring
Sl No Location Radiation Field
(µ Gy/h)
Latitude Longitude
1 Pushpamangalam House 0.4 9.0244 76.5139
2 Kunnumpurath House 1.7 9.0244 76.5129
3 Thuppassery House 1.7 9.0267 76.5112
4 ThekkeThuppassery 2.0 9.0271 76.5115
5 New Mining area 1.2 9.0285 76.5108
6 Pandarathuruthu 1.7 9.0300 76.5096
7 Mukkumpuzha junction 0.5 9.0308 76.5122
8 Panamoottil 1.2 9.0305 76.5095
9 Haribhavanam 1.1 9.0310 76.5093
Page 156
4-109
10 AlappadGovt L P School 1.7 9.0328 76.5085
11 Alappad church 1.7 9.0357 76.5073
12 PanikkarKadavu 0.7 9.0374 76.5061
13 KurusumMoottil 2.7 9.0362 76.5069
14 Nishalayam 1.4 9.0348 76.5677
15 Kollampurath 1.3 9.0314 76.5095
16 Edayil House 1.3 9.0314 76.5095
17 Padattedath 1.35 9.0318 76.5080
18 Ramanamadam 1.4 9.0320 76.5084
4.19.2 Soil Sample Analysis
Soil samples were collected from 10 different locations extending from MRP tailings area to
Panikkarkadavu Bridge in the proposed mining area which covers 2 km length and 300 m
width. Locations are identified based on the population density and accessibility of the
region. Three samples were collected from each location. Three composite samples were
analyzed for Gross alpha and Gross beta activity. The results are given in table 4.32.
Table4.32: Gross alpha and gross beta activity in soil samples
Sl No Location Gross α (Bq/g) Gross β (Bq/g)
1 NishalayamPandarathuruthu 8.7±2.4 4.1±0.7
2 HaribhavanamPandarathuruthu 4.8±2.0 6.3±1.4
3 KurushumoottilPanickerkadavu 6.7±2.1 2.8±0.9
4 Panamoottil, Pandarathuruthu 7.6±2.4 5.3±1.1
5 Edayileveedu, Pandarathuruthu 7.3±2.4 4.6±0.9
6 Panamootitil south Pandarathuruthu 4.2±2.2 3.4±0.8
7 Kollapurathu, Pandarathuruthu 8.9±2.3 1.9±0.9
8 Padattedathu, Pandarathuruthu 8.6±2.2 4.5±1.2
9 Ramanamadam, Pandarathuruthu 5.7±2.4 3.8±1.0
10 Pushpamangalathu Vellanathuruthu 3.9±2.4 3.3±1.3
Page 157
4-110
4.19.3 Water sample Analysis
Well water samples collected from sampling locations were analyzed for gross alpha and beta
activity, results are given in table 4.33.
Table 4.33:Gross alpha and gross beta activity in well water sample
Sl No Location Gross α (Bq/g) Gross β (Bq/g)
1 Kunnumpurathu, Vellanathuruthu 0.013±0.007 0.10±0.02
2 Santhibhavanam, Vellanathuruthu 0.012±0.007 0.049±0.018
3 Mangalathu, Pandarathuruthu 0.007±0.004 0.34±0.018
4 Kollapurathu, Pandarathuruthu 0.012±0.007 0.44±0.018
5 Panamoottil, Pandarathuruthu 0.019±0.008 0.087±0.02
6 Thuppasseril, Vellanathuruthu 0.007±0.004 0.085±0.02
7 ThekkeThuppasseril, Vellanathuruthu 0.016±0.008 0.34±0.018
8 PadattedathPandarathuruthu 0.011±0.007 0.78±0.019
9 PanamoottilPandarathurhu 0.012±0.007 0.34±0.018
10 KanakalayamPandarathuruthu 0.010±0.007 0.109±0.02
4.19.4 Conclusion
The pre operational radiological monitoring of the proposed mining area of IREL chavara at
Vellanathuruthu region was carried out by Health Physics Unit (HPU) of IREL
Udyogamandal and Manavalakurichi during September-October 2017. External gamma
radiation monitoring and analysis of well water and soil samples were carried out.
The radiation field in the proposed site ranged 0.4 – 2.7 µGy/h depending on the monazite
content in the soil. The gross alpha activity in the soil samples ranged from 3.9 – 8.9 Bq/g
and the gross beta activity ranged from 1.9 – 6.3 Bq/g. The gross alpha activity in the well
water samples ranged from 0.007 – 0.016 Bq/lit and the gross beta activity ranged from 0.034
– 0.109 Bq/lit.
Page 158
5-1
CHAPTER 5
IMPACT ASSESSMENT
5.1 General
Impact assessment describes the beneficial and adverse effects of the 180 Ha mining
project. The proposed method of mining is similar to the dredge mining conducted by the
company.
IREL has been granted renewal of mining lease to collect heavy mineral sand
from NK Block IV EE (Alappad, Panmana and Ayanivenikkulangara) in Kollam district
for an area of 180 Ha vide G.O (Rt) No 746/07/ID dated 08.06.2007 upto 10.08.2031
The production is to be expanded to 7,50,000 tons of raw sand by inland mining only and
in which about 6 to 6.6 lakh tons will be discarded as tailings.
The environmental impact assessment process ensures identifying the key
developmental and operational activities/hazards resulting from the proposed mining &
mineral processing.
There will be only one pond of working length 30m and width of 14m. Once
DWUP (Dredge and Wet Upgradation Plant) is in place, the dredging will progress as a
strip of 50 meters. The proposed activity is purely a wet process and there is no
significant impact on air except fugitive emissions due to material transport.
The water system consists of surface and ground water domains. The land system
consists of human settlements, existing land use patterns, fragile shoreline, sensitive
locations like temple and a school and eco-protective land cover. Air aspects include
emissions due to transportation of mineral heavies from the location. No other dust
emissions are expected as the mine operates under wet condition.
Noise includes sound generated by trucks during transportation and other mining and
separation activities. Other significant impacts include socio-economic impacts and road
traffic congestion.
All these are prone to multiple changes from time to time, in tune with the
prevalent socio-economic scenario, systemic anomalies in the seasons and coastal
dynamics and anthropogenic activities. The impacts of mining of heavy mineral sand in
environment have been evaluated and possible measures to mitigate their adverse
impacts have been worked out.
However considering various activity components, the impacts on the
environment, either beneficial or deleterious due to the proposed mining activity are
Page 159
5-2
identified. The aspects on the environment, which are likely to be disturbed or damaged
due to the implementation of this project, are represented with mitigation measures.
Mathematical models have been used to quantitatively predict the impacts on air and
noise quality. Battelle environmental system is used for evaluation of various impacts of
environmental pollution, ecology, human interest and Aesthetics.
The environmental impacts due to the mining can be summarised as follows:
Air Environment
Topography and Land use
Drainage
Water Environment
Ecology
Traffic
Radiation
Socio-economic & Rehabilitation & Resettlement
5.2 Air
5.2.1 Air environment
Beach sand extraction, upgradation and back filling do not cause appreciable rise
in gaseous or particulate pollution level in ambient and work zone environment. Sand
extraction process (dredging) is a wet primary process and back filled mass is moist in
form and do not release dry dusts in mining area. Therefore in the proposed area
pollution will be insignificant. Ambient Air Quality monitored at Vellanathuruthu PHC,
Project Location, Amrithananthamai math and Maravana Junction for PM10,SO2 and
NOx and are well within respective permissible limits. The meteorological data have
been generated at the mining site from the NCESS station for the study period. Other
Met data have been collected from IMD, Trivandrum.
5.2.2 Modelling of Dust Emissions
Modeling of air emissions
The air pollutants of interest in this project are PM10. The main sources are
emissions during mining and transportation. However dust emission is not significant in
Page 160
5-3
dredge mining as the ore and rejects are in wet or slurry form. Road transportation of ore
on the haul road is the only source of dust emission.
Fugitive Emissions Estimation
Dust clouds due to the movement of trucks on roads can cause very significant
transient dust nuisance. In this project, the transportation of mined material is through
rural unpaved single lane road and concentrate is transported from inland mining area to
MS plant partly through unpaved roads and partly through bituminous topped public
roads connecting Karunagappally and the mine lease with six meters width. The
projected average inland mining in the area is 7,50,000 MT (maximum) per year. The
Heavy Mineral concentration ie. THM content for mined out minerals by inland mining
is 15% on an average and range between 10 to 18%.
The collection of mineral rich sand takes place during a span of 300 working
days with the upgradation plant working for 1600 hours per year from 8am to 5pm. Thus
the transportation of concentrated mineral sand per day from the inland mining is 375
MT.
The material transported is heavy mineral rich beach sand, and its silt content is
very low. Therefore dust raised from entrainment of spilled materials will be relatively
less compared with the transportation of excavated soil or clay as commonly seen on
roads in Kerala.
Dust can be assessed using emission factor equation for both paved and unpaved
roads. The emission factor equations are given below. The equation is according to ‘AP
42 on emission factors of unpaved roads’.
5.165.0
32
WsLkE
Where:
E = Particulate emission factor (having units matching the units of k),
sL = Road surface silt loading (grams per square meter) (g/m2)
W = average weight (tons) of the vehicles traveling the road
k = is the particle size multiplier as given in the table below
Page 161
5-4
Size range Particle Size Multiplier k
g/VKT
PM- 2.5 0.66
PM-10 4.6
PM-15 5.5
PM-30 24
The equation given below for paved road is taken from the ‘AP 42 for paved roads’,
neglecting correction factor for tire and break wear.
02.191.0WsLkE
Where,
E, sL and W are the same as above
The particle size multiplier k is as given in the table below
Size range Particle Size Multiplier k
g/VKT
PM- 2.5 0.15
PM-10 0.62
PM-15 0.77
PM-30 3.23
The silt loading, refers to mass of less than 75µm particles collected by brooming
and vacuuming the road. This has not been measured. Silt loading is taken as 20 g/m2 for
the unpaved road area and 10 g/m2 for the paved road.
Page 162
5-5
Table 5.1: Estimated increase in emissions by emission factor method
Road Traffic (day
time)
Pannikerkadavu to
mine lease
Total
Number
of trips
Avg.
vehicle
weight
Silt
loading
g/m2
E Total
emission
g/km/day
PM10
g/ VKT
For Unpaved Road 30 12 20 164.37 4931.1
For paved Road 30 12 10 63.55 1906.5
AFTER EXPANSION
For Unpaved Road 76 12 20 164.37 12492.12
For paved Road 76 12 10 63.55 4829.8
Modeling of SPM due to dust emissions from traffic has been done using
Gaussian Plume modeling method for which the general equation is given below. The
Gaussian model is the most commonly used model for the air dispersion modelling. The
Gaussian equation for point source emission is
The Gaussian equation applicable for the line source is
Where,
C (x,y,z)= Pollutant concentration as a function of downwind position (µg/m3)
Q = Emission rate (g/s)
q = Emission rate (g/s/m)
u = Average wind speed (m/s)
σy,σz = Standard distribution of the concentration distributions in the Horizontal and
vertical directions
z = Vertical distance from ground level, (m)
y = distance in horizontal direction (m)
H = Vertical distance from ground level, (m)
Page 163
5-6
Dust emissions have been modeled using MoEF approved Envitrans FDMpro software.
It would suffice to calculate the increase in PM10 from increase in total emission
calculated above, using the measured baseline values. The isopleth plots are obtained for
the baseline and the incremental increase in pollution due to truck traffic is shown in
figure 5.1. The isopleth plot obtained after expansion of mining activity is shown in
figure 5.2.
Figure 5.1 Isopleth plot for the air quality before expansion
Figure 5.2 Isopleth plot for the air quality after expansion
Page 164
5-7
The model shows incremental increase in pollution caused due to the area due to truck.
However the incremental values are within the CPCB limit prescribed for PM10, which
is 100µg/m3 for 24 hour. This value is based on the prediction obtained without any
control measures. The maximum incremental value from the area after expansion of
mining is 35µg/m3 in addition to the ambient quality observed (maximum value)
5.2.3 Mitigation Strategies
Existing level of air pollution in the proposed core zone area is below the permissible
limits (National Ambient Air quality norms). The dredge is electric driven and therefore
has no gas or dust emissions. The only source of air pollution is emissions during road
transportation in haul roads of heavies from mine to MSP. The following listed methods
are being advised to adopt for minimizing the air impacts
Usage of TS canal for transport of heavies
Air pollution and road congestion can be totally avoided by using water transport
through the TS Canal. The suggested method is the use of country boats which are the
most environment friendly and having a very positive socio-economic impact.
Traffic Diversion
Alternate route for the Tipper transport. For the loaded vehicles a route is suggested and
for unloaded vehicles another route is suggested which will help in avoiding the traffic
congestion (Figure 5.3)
Page 165
5-8
Figure 5.3 Alternate route for truck Transport
Page 166
5-9
Pumping of heavies
As an alternate method of transportation of materials from Block IV EE to Chavara plant
against the present method of transportation of using contract tippers, pumping of the
spiral concentrate is proposed. It will be done by 7 stage pumping at a rate of 65 tph.
Three pumps will be located in the IREL lease owned area and 4 pumps in the KMML
lease hold areas. Power supply is to be sourced from the proposed dedicated feeder from
Chavara substation to Block IV area. The total estimated cost of the project is Rs.500
lakhs. The pumping system is designed for pumping 65 tph solids having specific gravity
of 4.0 and the solid concentration of 26 %. The total volume of the slurry pumped is 201
cu.m / hr and the total head of the system is 315 meters.
The alternate plan for transportation of mineral concentrates using HDPE pipes have
been added as figure 5.4
Page 167
5-10
Figure 5.4 Alternate plan for transportation of heavies using HDPE pipeline
The pumps are located at 750 m apart. The discharge of the first pump will be connected
to the suction of the second pump and so on. The pipe line will be 160 mm HDPE pipe
Page 168
5-11
of PNPE80 grade. The lines will be laid along the TS canal side and also through the
KMML mining area depending upon the terrain available for laying the pipes. The
maximum working pressure in the pipe line will be 5.5 bar. The advantage of the
pumping method is that there will be no traffic congestion, dust generation and accidents
can be avoided. An aquatic ecological survey may be carried out before laying the
pipeline for its environmental feasibility.
The following measures are recommended to reduce pollution for road transport
During the transportation from the segregated area, the material may be wetted
thoroughly to avoid dispersion.
The segregation area where the material is stored should be covered completely
to avoid wind dispersion.
During transportation, the loaded vehicles should be secured with a covering over
the loaded material to avoid spillage, which on drying may cause dispersion.
Provision of water trough at the exits of roads for tyre washing .
Good preventive maintenance schedule for equipment & vehicles.
It is suggested that the vehicles strictly follow the stipulations for their vehicular
exhausts, both diesel and petrol vehicles.
Ensure leak-proof transport equipment. Vehicles transporting the minerals shall
be provided with tarpaulin cover.
Supply of face masks to workers and staff to prevent dust inhalation.
Overloading of transport equipment must be prevented.
The 35% Calcium chloride solution can be sprayed on the unpaved part of roads
to prevent the rise of dust particles into the atmosphere. This shall be done in the
summer months when the soil is dry and subject to dispersion.
Gaseous pollutants in the exhaust fumes generated by the dozers and other
machinery shall be minimised by ensuring vigorous maintenance and stringent
overhaul schedules. The repair workshop and maintenance garage should be
equipped with all necessary facilities.
Page 169
5-12
5.3 Noise
The sound generated from any process becomes polluting when the sound generated
tends to disrupt and intrude into the day-to-day activities of people. Noise is measured in
terms of decibels (dB). The ambient measure of sound in an industrial area is 75 dB and
the sound value in residential area is 55 dB in the daytime. The noise was measured in
different locations (LEQ) in and around the area of mine lease.
Table 5.2 The value of noise measured from different locations
Sl no: Location of monitoring Average Noise Value
in dB
1 Mining road to Block IV 59
2 Primary Health Center 54
3 Amrithapuri Junction 69
4 Sree Kurukasseril Bhadra Devi temple 66
5 Alappad Panchayat Office 61
6 Cheriazheekkal near to junction
(school, temple) 71
7 Pandarathuruthu 60
8 Panikarkadavu bridge 70(cont.traffic)
57(normal)
9 Poockattu junction
(Panikarkadavu) 74
10 SV Market,Karunagappaly 54
11 Muncipal Corporation Office, Karunagapally 81
12 Karunagapally Junction 78
Page 170
5-13
13 Karunagapply Govt.Hospital 75
14 KSEB Office,Puthiyakavu 75
15 Market Road, Karunagapallly 75
16
Karunagapally Railway station.(w/o train
movement) 56
17 Kanetti Bridge 76
18 MES college of Arts & Science, Chavara (measured
at NH 66) 77
19 Titanium Junction 75
Table 5.3 Standards for noise calculation according to CPCB Norms
Acceptable Outdoor Noise Levels: Norms of Central Pollution Control Board
Area Code Category of Area Limits in dB (A)
Day time Night time
A Industrial Area 75 70
B Commercial Area 65 55
C Residential Area 55 45
D Sensitive zone 55 45
5.3.1 Noise Modelling
Environmental noise modelling describes the process of theoretically estimating noise
levels within a region of interest under specific set of conditions. But the variation in real
Page 171
5-14
world conditions will give an estimate for a snapshot of the range of actual
environmental noise level that could occur in time and space.
In order to predict the impact of noise generated due to the proposed DWUP, a
systematic survey of the ambient noise levels existing in a similar DWUP system at
IREL mine lease was conducted. The overall impact was predicted and calculated using
hemispherical model for sound wave propagation.
LW = Lp + [20 × log10 (r)] + 8
Where,
Lw= Sound power level (dB), Lp = Sound pressure level at a receiver
r = distance from source
The predicted values have been shown in table 5.5.
The noise level at dredge is averaged at 70 dB. The modelling of noise has been carried
out using the hemispherical model equation. The Noise values have been calculated at a
distance of 1m, 2m, 5m, 10m, 20m, 40m etc. The Table 5.4 shows the variation of noise
from source with distance. This shows a logarithmic variation of noise. As the distance
increases, the reduction in noise also is observed.
Table 5.4 Change of noise from source with distance
Location
of
monitoring
Value
record
ed in
dB
Calculated values at distances
1m 2
m 5m
10
m
20
m
30
m
40
m
50
m
60
m
70
m
80
m
90
m
Noise from
Machinery 70 62 56 48 42 36 32 30 30 30 30 30 30
Page 172
5-15
Fig 5.5 Plot for the change of noise v/s distance
From this, it is understood that the noise levels does not cross the standard limits as
prescribed by CPCB. Figure 5.5 shows the outburst of the noise from the DWUP Plant.
The values reaches the ambient level at a distance of about 40 to 50m from the DWUP.
5.3.2 Mitigation Strategies
The noise level at DWUP was about 70 db. The value reaches the ambient level at a
distance of about 40 to 50m from the DWUP. Nearest habitation is beyond 100m
distance. Hence, there is no need for noise control measures.
Traffic noise from trucks is a nuisance for which there are no simple control measures. If
transportation of mined heavies by waterways, preferably by using country boats or by
pumping of mineral heavies in a slurry form, there will be no further traffic noise or
congestion. However, exposure of workers at DWUP and excavators needs to be
minimised. This could be achieved by:
Conducting audiometric examination once a year.
The noise level should be monitored at the key locations once in a month and
values to be recorded. The workers shall be provided with the noise protection
earphones or plug.
Job Rotation, Automation, Protective Devices
Distance from Source in metre
Pre
dic
ted
N
ois
e le
vel
Page 173
5-16
5.4 Ground water quality
Core Zone
Groundwater samples were collected randomly from the existing wells as well as from
surface water sources within the study area during Jan 2015 to May 2016 as part of the
field studies.
The sample collected from below the panickarkadavu bridge shows high values of
salinity, EC, TDS etc. this location is used for boat anchoring and the area is under
continuous disturbance caused by boat cleaning boat movement etc. This location is
closer to the sea mouth. This may be the reason for the increase in salinity, TDS values
etc.
Buffer Zone
In a study conducted by Central Ground Water board, a well located at Chavara recorded
an EC value of 1370 mS/cm at 25ºC and chloride value of 298mg/l. However in the bore
wells, the quality of water is generally good, mostly the Electrical conductivity (EC) in
the range of 50 to 250 mS/cm at 25ºC. The fluoride value is also within the permissible
limits. The shallow phreatic aquifers in alluvium are developed through dug wells. Filter
point wells are more economical where the saturated thickness of the shallow zone
exceeds 5m. These are feasible in the coastal areas along Chavara and Karunagappally
and the yield ranges from 20 to 60m3/day. In areas very near to the coast and tidal zones,
the water samples have reported EC above 1000 μS/cm at 25ºC. Chloride in phreatic
groundwater is below 60 mg/l in major part of the district. Higher values of chloride
were observed as localised patches in the coastal plain in the close vicinity of the
backwaters. The chloride content is observed as 298 mg/l in Chavara area.
Table 5.5 Analytical data on samples from GWM wells
Location ECin
us/cm
at250C
Total
hardness
as
CaCO3
( mg/l)
Ca
( mg/l)``
Mg
( mg/l)
Cl
( mg/l)
F
( mg/l)
Karunagappally 325 110 35 49 60 0.02
Chavara 1370 465 162 14 298 0.26
Page 174
5-17
Table: 5.6 Tubewell details constructed at Chavara
Sl.no Depth drilled
Depth
constructed
(m)
Static water
level
(m)
Aquifer Discharge
(lpm)
I 189.53 185 12.91 Warkallai 30
II 160.0 143 9.18 Quilon 1.83
III` 101.45 48 2.89 Vaikkom 0.02
Table: 5.7 Ground Water Quality
Location
EC in
(us/cm
at250C)
Total
hardness
as
CaCO3
( mg/l)
Ca
( mg/l)``
Mg
( mg/l)
Cl
( mg/l)
F
( mg/l)
Karunagappally 325 110 35 49 60 0.02
Chavara 1370 465 162 14 298 0.26
5.4.1 Ground water level trend:
Ground water level trends analysed through water level data of 10 observation wells in
Karunagapally block for 5 years (2006 to 2010) indicate that the fluctuation ranges from
0.02 to 2.37 meters during SW monsoon and from 0.62 to 2.97 meters during the North
East monsoon.
Ground water depletion: The hydrological surveys and exploration for ground water
carried is in Kollam district by the Central Ground Water Board(CGWB) to assess the
capabilities of the aquifers , water quality and ground water potential. The stage of
ground water development in Chavara Panchayat and Karunagappally Municipallity
Page 175
5-18
were assessed as safe. However the prevalence of large scale pumping of wells along
the western area have resulted in the depletion of the water table aquifers as evidenced
from the steep gradient of the water table contours. The increase in urbanization,
industrial uses and continued influx of tourists have lead to ground water resources
depletion particularly the water table aquifer.
5.4.2 Ground Water level and Flow Pattern
The contours were generated with reference to water level RL’s of wells which are
measured during the field survey for Block no III . The water level RL of well is
calculated by (Water level RL= Reduced level - (depth to water level from top of parapet
- Height of parapet). Usually sandy layers facilitate the flow of water whereas clayey
layer retards it. The contours were drawn for the water level RL’s for determining the
ground water flow direction in the study area. The Ground water contour map indicated
that the western part of the area comprising the Block IV EE , the water table aquifers
flows towards the Arabian Sea in the west and to the T- S canal in the east The ground
water contours along the eastern side of the TS canal show that the ground water flow
pattern is generally towards west ie. to the adjacent canal portion . Ground water is
influenced by the difference in hydraulic head produced by topographic relief and
unconsolidated formations. The difference in hydraulic head due to topographic relief is
the most significant driving force for ground water flow.
The tentative geological section in west – east direction along Block IV EE (figure 4.8
b) also depicts the water table profile which is likely to be intersected by the mining pit
deepening/dredging activity in Block IV and Block IV eastern extension .
5.4.3 Impact on water quality
Physicochemical parameters were determined on the 13 well water samples collected
from the core and another 12 from buffer zone. Data generated was compared with the
Indian Standards and specifications for Drinking Water (IS: 10500:2012) and World
Health Organizations (WHO) drinking water limits. The analysis results were interpreted
based on IS: 10500 (2012).
From the analysis of samples from core zone it can be seen that pH recorded for all 13
samples were within permissible limits. Sample IREW2 registered the lowest
conductivity (0.202 mS/cm) while sample IREW5 showed the highest value of 23330
µS/cm The total solid content was maximum in IRE W5 (1153 mg/L) sample and the
Page 176
5-19
total dissolved solid contents were found to be the highest in the case of sample IRE W6
( 10.7 mg/l) which is reflected in its salinity and conductivity values. All samples except
IRE W1, IRE W5, and IRE W 12 exhibited TDS values less than 500 mg/l.
In buffer zone all the samples except sample KMW11, possess pH values within the
specified limit. Total solid content as well as the total dissolved solid contents were
found to be the highest in the case of sample W3 (523 mg/l) which is reflected in its
salinity and conductivity values. Sample W4 possessed the lowest TS & TDS values
which are in good agreement with its low salinity and conductivity. All samples except
KM2, KMW5, KMW13, and KMW15 exhibited TDS values less than 500 mg/l. KM2 is
the sample collected from dredging pit of adjacent block of KMML and since it shows
high values of salinity, EC, TDS etc. sea water intrusion is suspected.
5.4.3.1 Water environment
The mining lease is on a narrow strip of sandy formation being surrounded by saline
water on either sides and fresh water has been very thin in the locality. Water from
dredge pond will be utilised for primary circuit in DWUP. No water is consumed and the
entire water will be recycled for the process except for very minor evaporation loss. The
water balance is shown in figure.
Return water quantity (740 cum./hr)
Figure 5.6: Water balance diagram
Dredge Pump
Input
(390 cu.m/hr)
+
Make-up Water
Input
(350 cu.m/hr)
Concentrate Tailings All Bins
Overflow
Hydrocyclone
Over-flow
(56 cu.m/hr)
Hydrocyclone
Under-flow
(4 cu.m/hr)
Tailings
Discharge
(103 cu.m/hr)
Tails Bin
Over-flow
(93 cu.m/hr)
Surge-bin
Over-flow
(327 cu.m/hr)
Other Bins
Over-flow
(133 cu.m/hr)
Trommel
Spray
Water
(24 cu.m/hr)
Input water Qty. from
Pond
(740 cu.m/hr)
Page 177
5-20
5.4.4 Impact of inland mining on ground water conditions due to Saline Water
Intrusion
Bicarbonates and carbonate ions are abundant in ground water but Chloride generally
occurs in small amounts but is abundant in sea water. Salt water intrusion may be
identified by the relative concentrations of some of the characteristic ions of sea water
such as Cl-, Na and Mg. The Cl- / (CO32- + HCO3
-) ratio is recommended as a criterion to
evaluate salt water intrusion aspect. This ratio is considered to be indicative of ground
water contamination by sea water
Table 5.8: Range of Cl-/ (CO32- + HCO3- ) vs Saltwater contamination level
Range of Cl-
/(CO32- +
HCO3- )
Remarks with reference to salt
water contamination
Sample no’s
< 0.5 Normal
ground water
(no salt water contamination ) IRE-W2, IRE-W3,IRE-
W4,IRE-W6,IRE-W7, IRE-
W8, IRE-W9, IRE-W10,
IRE-W11, IRE-W13
0.5 - 1.30 Slightly contaminated ground water IRE-W1, IRE-W12
1.30 - 2.80 Moderately contaminated ground
water
2.80 - 6.60 Injuriously contaminated ground
water
6.60 - 15.50 Highly contaminated ground
water(near sea water)
IRE-W5
> 200.0 Sea water
Above cited results shows that the ground water in the study area is hard with
bicarbonate alkalinity. Since water samples showed Cl-/(CO32- + HCO3
- ) ratio ranging
from 0.99 to 176.4, brackish / salt water intrusion is not ruled out. The contamination
level in the water samples is from slightly contaminated and the water sample is highly
contaminated at one location.
Page 178
5-21
5.4.5 Beach erosion in the buffer zone
Beach erosion is a major environmental and public issue in the area and indeed
throughout the Kerala coast. The shoreline of Kerala has been subjected to severe coastal
erosion in recent times. In the monsoons, two third of the shore line is vulnerable to
dynamic changes. The mining and removal of sand will, prima facie, have a negative
impact on the coastal topography. But there is no evidence to state that beach sand
mining is the primary cause of erosion in this area. Moreover, the dredging operation
will not lead to any erosion at any point of time and the project under consideration is
aimed at dredging operation only.
Coastal protection measures undertaken here include sea wall construction by the State
Government and IREL in its mining areas.
Mitigation measures proposed
To reclaim the shore in Block IV, it is proposed to construct Groyenes in the NK Block
IV EE area between Thazchakadavu (IREL Boundary) and the VT bus-stand. It covers a
distance of 700 meters. Four groyenes will be constructed in this stretch with a distance
of around 200 meters apart. The groyene on the southern side will have a length of 75
meters, and on the northern side will be of 40 meters. The groyenes in between will have
a length of 100 meters and 75 meters. The groyenes will be constructed through the
Irrigation department. The total cost is Rs. 10 crores.
Page 179
5-22
Figure 5.7: Groynes proposed in the buffer zone
The figure 5.8 shows an example of formation of beach due to construction of groynes at
KayankulamPozhi.
Fig 5.8 Beach formation due to construction of groynes
Page 180
5-23
5.5 Topography and Landuse
The Mining operations go in tandem with reclamation. About 85% of the raw sand will
be deposited back to the mining area and will be used for reclamation of the mined out
area. Original Topography of the beach sand mining area will change due to removal of
15% heavies. Since the land elevation is not more than 1 to 2.50 m above the high tide
line and also since water table is not more than 1 to 2.00m belowground level a small
change in topography will have significant impact. It is recommended that the back fill
and tailing alone be used to bring the land to the original elevation and to leave a part of
the area as shown in the EMP plan as wetland.
The mining and recovery of heavy mineral will eliminate the radioactive mineral
(monazite) present in the raw sand.
As the back filling is integrated into the mining process. Thus the excavated land will be
subsequently reclaimed and the ground surface of the reclaimed land will be brought
back to the contours matching with the surrounding topography. No temple or any
sensitive locations will be disturbed. The reclamation will improve the overall landscape
considerably in a phased manner by green belt development and ponds for water
conservation and ground water recharge, to improve the water quality / quantity. It will
also be a sustainable source for water, availing infiltration of water wherever feasible.
This area is not a forest and there are no historical monuments in the lease area or near it.
Overall landscape shall improve in a phased manner when greenbelt development,
plantation cover, mangrove afforestation, wetlands etc stretches subsequent to
backfilling.
5.6 Impact on Ecology
5.6.1 Fauna
Animals included in Schedule I of Wildlife Protection Act 1972 was not observed in the
study area. No endangered or endemic animals were also observed during the ecological
survey.
5.6.1.1 Flora
At present, no endangered species or threatened species or plants included in the
Schedule I of wild life protection act of 1972 was observed. There are no forest in the
Page 181
5-24
core or buffer zone. There are no significant impact on the ecology due to the mining or
DWUP plant.
5.6.2 Impacts on soil and agriculture
The core zone soil is basically sandy soil. The mining will involve extraction of this
sandy soil, and dumping back the tailings in the mined out areas. Since the heavy mineral
extraction is a simple physical process, the sand which is dumped back will not differ
chemically from the pre-mining sand except that the heavy minerals are no longer
present. The physical changes which will occur will be minor and will have no lasting
impacts. Mining will involve cutting down of coconut trees leading to loss in coconut
production. These trees if required can be replaced by new saplings of improved variety
to improve the agricultural yield.
5.6.3 Socio Economic Impacts
The survey was conducted with the prime intention to know the effect of mining among
the people residing at the site as well as the people inhabited in the IREL Block IV EE
core and buffer zone. It is to be noted that the people residing in and around the site were
not evacuated and waiting for getting reasonable compensation as per the existing R&R
policy of the government and the company. There are more than 550 families residing in
the area and a sample of 300 families were selected and interviewed to get socio-
economic impact of mining and other needed information related to the objectives
mentioned in the study. Here, it is seen that most of the respondents are reluctant to
vacate on the presumption that the face value of the land has been increased to a large
extent.
In the proposed project, option for alternate mining site has little relevance since it is
mainly guided by the availability of mineral deposits. The local residents follow the
traditional job of fishing. The project is likely to bring about positive changes in life style
and quality of people located in the area, especially around the proposed blocks.
The socio-cultural scenario of the people is highly fabricated as there is no tussle among
the people and the religious group.
The following types of data were collected for the study
i. Documentary evidence mainly from published materials
ii. Interview data from the families in Mining Area and Buffer Zone
Page 182
5-25
iii. Field notes by the researcher through observation and discussion with the
knowledgeable persons, local leaders, Local Self Government Officials
and other persons authentic in this area.
5.6.4 Socio economic impact mitigation suggestions:
After the commencement of the mining operation, the geography of the area has
drastically changed. The result is that the earning pattern of the people changed
significantly, which adversely affected their day-to day life. Hence the people migrated
to other places but few of them have become labourers in the sand mining firm (KMML
/IREL) and its allied activities. So support may be given by the company either by
providing employment to the members of the family who face eviction or other self-
employment programs have to be provided. This will necessarily reduce the anxiety and
resistance from the people.
2. It is a matter of the fact that the land acquisition dispute line with the court may be
settled at the earliest. This is possible by paying adequate and reasonable compensation
in line with more or less present market price to the people in the mining area.
3. Another major demand of the people is to return the land after the mining is over to
the concerned land owners with provision of resettlement at suitable places near to their
own land.
4. Regular medical checkup and provision of free medicines are of urgent need to reduce
the fear and anxiety of the people that cancer and other diseases are on the rise in the
mining area.
5. Educational facilities for at least primary and upper primary level may be established.
In addition to this adequate incentives for the student may also be provided.
6. The conveyance of the mined sand is done through trucks and should use the TS canal
for transporting the heavies. Another method is pumping for transporting the sand have
been suggested.
7. Regarding the drinking water problem, the present system of supply of potable water
is unsatisfactory to the level of the expectation of the people. Regular water supply is an
essential need. So effective water supply schemes have to be formulated and
implemented.
Page 183
5-26
8. The fishing and agricultural activities are very scarce in the mining area. This reduced
their income drastically. So alternative income generating programs may be suggested
and implemented at the earliest.
9. The mining and mineral processing involves transportation activities for day-today
operation. This will fetch a substantial amount of money. So, as an alternative the project
authorities shall take steps to engage the local people for transportation by trucks or by
means of barges/ country boats. They can also employ the local people for loading and
unloading the concentrates. Employment should be given to the local in appropriate to
their qualification. A system of reservation of job or indirect employment may be
reserved for the project affected families.
10. The company shall provide training from time to time for improving the skills, agro-
techniques and first aid and safety to the inhabitants.
11. The company shall earmark a part of their profit for corporate social responsibility
12. IREL shall provide regular grant to neighbouring schools, hospitals and encourage
them for their upliftment.
12. The land owner who is interested in resettling in their own area may be given the
land free of cost at the backfilled areas.
13. Even though, a few numbers of families are already in the mining area, the mining
process of the company will not be affected in any manner. The company will provide
necessary precautionary measures to keep the people not to be affected with their
peaceful life and on health matters.
14. Proper infrastructure development like road development has to be taken into
consideration.
15. The environment pollution has to be reduced by taking proper action in this direction
5.7 Risk hazard
IREL has adopted a mining method that has minimum risks. The operations for beach
mining are conducted on the ground and it involves manual loading of heavy mineral
sands deposited by the wave action of the sea. Loading of sand on the trucks is done
semi mechanically. In inland mining, using DWUP the sand is dredged out from the
pond. The process does not involve drilling or blasting. The upgraded sand is transported
Page 184
5-27
using trucks and the rejects are simultaneously refilled. The mining methods deployed in
IREL are predominantly wet process resulting in low dust emission.
5.8 Environmental radioactivity
The impact of mining project in terms of environmental radioactivity can only be
considered positive. The beach sand, rich in monazite deposits is the cause of anomalous
background radiation is mined and the beaches are refilled back through reclamation
with sands free of radiation. The mining activity will reduce the existing levels of
radiation and radioactivity. On the other hand it is expected to reduce the background
radiation level of the mined and refilled areas and thus the proposed action is expected to
have a net positive impact.
5.8.1 Recommendations to mitigate environmental risks
5.8.2 Post mining land use and reclamation
In general, mining in India is conducted in land that belongs to the Government. In the
present instance almost all the land that is used for mining is on lease. IREL proposed to
purchase the land for mining under the Rehabilitation and Resettlement (R&R) package.
• The DWUP will be setup at the mine lease and the concentrate will be transported to
the Mineral Separation Plant at Chavara.
SAFEGUARD MEASURES TO BE PROVIDED.
In dredge mining, the dredge works in an artificial pond and the sand is dredged out from
the pond. This will not pose any danger because the dredge is at a distance from any type
of structure. Any other method like drilling and blasting would have caused more
dangers to man power and nearby structures.
The operations are closely supervised by a team of competent personnel qualified to
perform these functions, by virtue of possessing the qualifications prescribed for the job
under Mines Act 1952. They include Mines foremen possessing statutory Mines
Foreman Certificate issued by Directorate General Of Mines Safety (DGMS), Assistant
Managers and Mines Managers with Mine Managers Certificate issued by DGMS.
Total number of persons holding Certificates of competency from DGMS is as below:
Page 185
5-28
Table 5.9 Number of Persons Holding certificates of competency from DGMS
Manpower calculation for NK-IV EE, Ilmenite Mine
Sl. No. Operations No. of Persons required per day
Departmental
1 Mines Manager 1
2 Asst. Mines Manager & Mining Engineer 9
3 Geologist 1
4 Mines Foreman 3
Sub-total 14
5 Un Skilled (Female) 3
6 Un Skilled 15
5.9 Environmental Impacts
The study has observed the following.
1. Based on the measured reduced levels of 25 wells in the core and buffer zone area, the
flow of groundwater direction was predominantly towards south western and eastern
direction.
2. The well water samples from the buffer zone and core zone is within the permissible
limit (pH values in the range 6.5-8).
3. The highest contamination was found near the Panikkerkadavu bridge where the
anchoring location of boats and is under constant disturbance.
4. During operation stage, no wastewater is generated due to operation of the plant ie.
DWUP.
5. Coastal erosion is being observed in the buffer zone of the block although sea walls
are being laid a much more effective mitigation plan is needed.
6. Socio economic problems were observed people were complaining about water
scarcity, dust pollution, unemployment etc and the area is thickly populated.
Page 186
5-29
5.9.1 Mitigation measures suggested
The present study proposes the following remedial measures
1. Coastal protection measures must be undertaken in the area. Coastal protection
measures against erosion are a major part of the environmental management measures
required in this area. The method of the construction of seawalls on regular basis by the
State Irrigation Department/IREL is already in practice.
2. To reclaim the shore in the buffer area of the minelease, it is proposed to construct
Groyenes in the NK Block IV EE area between Thazchakadavu (IREL Boundary) and
the VT bus-stand. It covers a distance of 700 meters. Four groyenes will be constructed
in this stretch with a distance of around 200 meters apart. The total cost is expected to be
Rs. 10 crores.
3. In addition the consultant recommends the construction of groynes in the 22 km
stretch between Kayamkulam and Neendakara. The construction of groynes can be made
at a spacing of 1.2km. The expenditure can be shared between IREL and KMML.
4. The option of putting up sandbars may be examined in lieu of groynes.
5. One possible environmental impact is the dust that could be raised during truck
transport of the ore and the rejects. To avoid dust generation, all haul roads are sprayed
with water. This will mitigate the dust in haul roads, method is to spray 35% CaCl2,
which is effective for mitigation of dust emissions in mines.
6. Inorder to eradicate the dust emission due to truck traffic, company is planning to
implement pumping of the heavies by laying pipe lines to MS plant from mining site, by
adopting this air pollution can be mitigated to a larger extent.
5.10 Evaluation by Battelle Environmental Evaluation System (BEES)
The first step in such a process is the identification of impacts that are likely to occur as a
result of this mining project i.e. scoping process. Environmental impact assessment
process begins by identifying the developmental and operational activities due to the
proposed activity at Allapad, Ayanivelikulangra and Panmana. The probable impacts on
the environment, community, economy etc are identified. Wherever possible,
interrelationship and combined effects are identified. The following proposed activity /
parameters have been identified for prediction of impacts due to the proposed expansion
of mining activity.
Page 187
5-30
For this project 15 environmental parameters have been identified as the significant ones
for evaluation of impacts. Battelle Environmental Evaluation system (BEES) is the
methodology used for evaluation of impacts. The parameters have been assigned
parameter importance unit (PIU). The objective measurement of the environmental
qualities prior to and after the implementation of the project are then presented into a
subjective interpretation of Environmental quality based on a scale of 1.0 for good
quality and 0.0 for poor quality (EQ).
Environmental Impact unit (EIU) = (EQ) * (PIU)
Where, EIU= Environmental Impact Unit for the parameter
EQ = Environmental quality scale factor for the parameter
PIU= Parameter Importance units for the parameter
This method evaluates the expected future condition of the environmental quality both
“With” and “Without” the project. A difference in Environmental Impact Units (EIU)
between these two conditions constitutes either an adverse impact, which corresponds to
a loss in EIU or a beneficial impact, which corresponds to a gain in EIU. The identified
parameters have been classified into four major categories i.e. Environmental Pollution,
Ecological Environment, Aesthetics & Human Interest.
Table 5.10 : Checklist of anticipated impacts due to the proposed Project
Sl.no.
Proposed activity/Parameter
IMPACTS
Negative No
impact
Positive
1 AIR QUALITY
i) DWUP emissions **
ii) Fugitive emissions due to
loading / unloading / traffic
**
2 LAND Environment
Land cover **
Beach erosion **
Agriculture **
3 ECOLOGY
i) Terrestrial **
Page 188
5-31
ii) Aquatic **
iii) Forestry **
iv) Wild life **
v) Fisheries **
4 WATER QUALILTY **
Lake area **
5 NOISE ENVIRONMENT **
6 SOCIO-ECONOMIC
i) Change in social status **
ii) Change in economic
status
**
iii)Employment generation **
iv) Traffic **
v) Medical facilities **
vi) Infrastructural facilities **
7 Radiation **
5.10.1 Environmental Pollution
No significant environmental pollution is anticipated during construction of DWUP
except traffic and fugitive emission due to transportation of DWUP components. During
operation phase the air emissions are expected though insignificant since it a wet based
process. Suitable control measures are suggested in the EMP to keep the dust emission
levels within the prevalent norms. No ground water is tapped.
Table 5.11: Environmental Pollution (450)
Paramete
rs
Weight
(PIU)
Existing
(EIU)
After project
EIU with
EMP
Change
in EIU
with
EMP
EIU
withou
t EMP
Change
in EIU
without
EMP
Water 100 20 40 20 25 -5
Air 200 160 160 0 40 -120
Noise 50 25 20 -5 13 -12
Landuse
pattern 100 40 50 +10 16 -24
Total 450 255 270 15 94 -161
Page 189
5-32
Noise, air and water pollution shall be mitigated by curbing emissions at the source and
other management measures as suggested in EMP. In addition groins are proposed to
curtail sea erosion. To eliminate traffic related issues, the consultant recommends
transportation of mineral to Chavara plant through barges, country boats or by the means
of pumping.
5.10.2 Ecological
No rare or endangered species exists and species found here are found in other parts of
the core area and likewise, there is no National park or wildlife sanctuary in the core
area. The project site consists of loose unconsolidated sandy soil with sparse vegetation.
Mangroves are found to exist as per CRZ mapping. The dredged area will be filled by
DWUP rejects and well planned reclamation programme will ensure improved land use
pattern, improved crop yield, aesthetics and overall improvement.
5.10.3 Human interest
The following sections give the socio-economic impacts (on population growth, density,
aesthetics, standards of living, infrastructure etc.) likely as a result of the project.
During the mining phase, the following interpretations can be arrived at:
short - term as well as long term employment opportunities will be created during
construction and operation phase of the project;
improvement in socioeconomic status, communications and transportation sectors
is expected to occur;
local, long-term betterment of human welfare will take place;
Medical and drinking water supply facilities will improve.
Table 5.12: Human interest (400)
Parameters
Weight
(PIU)
Existing
(EIU)
After project
EIU
with
EMP
Change
in EIU
with
EMP
EIU
without
EMP
Change
in EIU
without
EMP
Economy output 60 18 30 12 18 0
Employment 70 21 42 21 21 0
Page 190
5-33
5.10.4 Aesthetics
The development of green belt and wet land, construction of rip rap along the banks of
canal and enhancement of mangroves would augment diversity of vegetation and
aesthetics. The proposed project hence promotes overall positive impact aesthetically
converting the unplanned land into planned systematic plantation, added mangrove
forestation for improved aquatic ecology etc.
Table 5.13 : Aesthetics (150)
Parameters
Weight
(PIU)
Existing
(EIU)
After project
EIU
with
EMP
Change
in EIU
with
EMP
EIU
without
EMP
Change
in EIU
without
EMP
Topography 60 18 36 18 15 -3
Vegetation 90 30 58 28 23 -7
Total 150 48 94 46 38 -10
Human welfare
schemes
60 24 36 12 18 -6
Overall
development
80 24 36 12 24 0
Traffic 65 30 20 -10 13 -17
Radiation 65 13 45 32 26 13
TOTAL 400 130 209 79 120 -10
Table 5.14 : Summary of Evaluation of Impacts
Sl.no.
Category
Weight
(PIU)
Change in EIU
Without
EMP
With
EMP
1 Environmental
Pollution
450 -161 15
2 Aesthetics 150 -10 46
3 Human interest 400 -10 79
Total 1000 -181 140
Page 191
5-34
5.10.5 Impact identification summary
Based on the above aspects, the observations in impact identification have been
summarized below for the proposed mining activity .Due to the use of state of art
technology in the mining process as well as pollution control equipment, the emission
levels will be within permissible limit. Due to the above, the air quality would not be
affected significantly. Health and welfare services are the major areas to experience
impact due to the additional employment potential and the resultant social and cultural
development.
Page 192
5-35
Table 5.15: Impact identification matrix during operation Mining
Identification Matrix for
Operation Phase
P - permanent impact
T - Temporary impact
Environmental
parameters
DW
UP
Com
mis
sionin
g
Wat
er R
equir
emen
t
Eff
luen
t D
isch
arge
Gas
eous
Em
issi
ons
Fugit
ive
Em
issi
on
Soli
d W
aste
D
isposa
l
Raw
Mat
eria
l st
ora
ge
Raw
mat
eria
l H
andli
ng
Spil
ls a
nd L
eaks
Shut
dow
n/
Sta
rt o
ffs
Equip
men
t fa
ilure
Tra
ffic
Tra
nsp
ort
of
wo
rker
s
Movem
ent
of
veh
icle
s
Med
ical
and o
ther
nee
ds
Educa
tional
nee
ds
Rec
reat
ional
n
eeds
Imm
igra
tion
Pow
er nee
ds
Land use T P P P T T
River water Resources
GroundWater Resources p
Odour Problem
Air Quality T P P T T P T T
Solid Waste P
Noise T T T T T
Animal Life
Marine Ecology T P
National
Park/Forests/Sanctuary
Human Settlement T
Page 193
5-36
Employment P P P P
Housing
Infrastructure P P
Culture P
P P
Water Supply P P
P
Power situation P P
P
Health facilities P T
R&R T P P P
Ecology T P P P
Page 194
6-1
CHAPTER 6
ENVIRONMENTAL MONITORING PROGRAMME
6.1 ENVIRONMENTAL MONITORING PROGRAMME
Monitoring is essential to ensure that the mitigation measures planned for environmental
protection, function effectively during the entire period of the mining and reclamation. The
aim of the monitoring programme is to develop an "early warning" system of indicators to
detect when pollution begins to approach or exceed permitted levels.
However, changes external to the activity may at any future stage endanger environmental
conditions rendering the existing mitigation measures inadequate. Hence, the necessity of
remaining vigilant through a well planned and meticulously implemented environmental
monitoring programme becomes essential.
Such indicators can be categorized under three groups: physical, chemical and biological, as
applicable to each mode of pollutant transmission, viz. air, water, traffic, radiation, sea
erosion, and noise. Monitoring program will be followed till the mining operations continue;
every year as per the schedule given below:
6.2 METEOROLOGICAL OBSERVATORY
A small automatic meteorological observation station to record daily continuous synoptic
data has to be setup. Wind speed data would help in making changes if required for
stabilisation of sand dunes & plantations. Arrangements for recording temperature, humidity,
wind direction, speed and rainfall would be required at the project site. The cost of the
instrument will be around Rs.20.00 lakhs and Rs.3.0 lakhs for annual maintenance. An
automatic wave height and direction recorder is suggested to generate data on coastal erosion.
As Blocks IV & IV EE are adjacent mine leases, the data generated for Block IV could be
used for these mine leases also.
Block IV EE is situated away from the coastal stretch in the inland area, the buffer zone area
extends to coastal stretch. The management measures suggested for Block IV could be
extended to this block also. The instruments procured can be utilized here too. However for
replacement and maintenance of instruments , a budget of Rs.16.00 lakhs and Rs.10.00 lakhs
has been kept.
Page 195
6-2
6.3 TOPOGRAPHY
Periodic contour mapping of dunes and topography should be undertaken on a seasonal basis:
Pre-monsoon and Post monsoon period. An amount of Rs.10.0 lakhs is estimated per year.
An external agency can be engaged for this.
6.2.6 Greenbelt development
The green belt as per the environmental management plan is recommended. A provision of
Rs. 10.00 lakhs per year is estimated for development of green belt as suggested in the EMP.
Three locations in the estuarine portion are recommended for mangrove afforestation.
After mining only about 80% rejects is available for refilling. It is proposed to make up this
20% by dredging the sides of T.S canal and thereby canal widening for conversion to wetland
and lake. The ecology of these areas has to be monitored every year.
6.4 COASTAL PROTECTION
Monitoring of shoreline evaluation provides valuable data on the accretion and sediment
transport rates. As this is a specialized area, an external agency can be engaged for this. The
activities should include the following:
Regular photographic images from the same positions which will look at changes in
beach alignment, sand levels, and sand movement. Photographs are to be taken at regular
intervals and at high impact times especially during storms. Photographic monitoring is to be
done prior to commencement of any works being undertaken.
In addition, tides, beach slopes, winds, wave climate, current regime, and sand grain
sizes having mineral fractions are to be monitored once in every six months.
Monitoring on adjacent shorelines as well as those immediately within the Groynes
scheme.
Assessment to be carried out bi-annually to check the beach-dune evolution and the
success of the scheme relative to the objectives.
Construction of sea-walls and their maintenance on regular basis may be taken into
consideration.
Page 196
6-3
An amount of Rs.40.00 lakhs is estimated per year for coastal protection.
The consultant recommends construction of groynes all along the 22.5 km stretch (i.e
between Kayamakulam Pozhi and Neendakara) at a spacing of 1.9 km with a length of
250m.The expenditure can be shared between IREL and KMML.
The coastal protection measures provided in block IV could suffix the requirements and no
separate budget is allocated except provision of Rs.10.00 lakhs for minor equipments /
replacements and maintenance.
6.5 WATER
6.5.1 Drinking water supply for the local people
At present IREL provides drinking water to locals as and when required based on the
demand. After completion of mining, refilling and providing rehabilitation IREL will provide
drinking water by laying pipe lines for rehabilitated colony. A provision of Rs.15.00 Lakhs
capital and Rs.5.00 lakhs for annual maintenance.
6.6 SOCIO-ECONOMIC DEVELOPMENT
The authorities should be in regular touch with people residing around the, Block IV EE to
support and monitor the various development schemes. IREL will also consider any emergent
requirements by the affected people. A provision of Rs.20 Lakhs per year is earmarked under
this head.
6.7 OCCUPATIONAL HEALTH & BIOLOGICAL MONITORING
Normal medical check-up for workers will be done. Pre medical examinations and periodical
medical examinations are being carried out by the company medical team headed by
company doctor. It is proposed to have a systematic program for medical check-up at regular
intervals for all workers. Biological monitoring to find out the effects of mining on the plants
also will be done. A provision of Rs.18.00 lakhs is estimated per year. This can be done in-
house or through engaging an external expert.
6.8 RADIATION SURVEY
The pre-operational radiological monitoring of the proposed mining was carried out by health
Physics unit (HPU) of IREL Udyogmandal along with HPU of IREL. An extensive radiation
survey of the area was carried out by Geiger Muller Tube detector integrated with GPS and
pocket size radiation survey meter. Measurements are recorded at 1 m above the ground
level. External Gamma radiation exposure, Soil sample analysis and water sample analysis
Page 197
6-4
will be done for the area along with the IREL Block IV An amount of Rs 10 lakhs is
estimated as recurring expenditure.
6.9 GUIDELINES & TRAINING
The updated Environmental & safety regulations / norms and guidelines should be kept in the
possession of the Environmental Engineer and should be available for ready reference to
other employees. Budget provision for periodic training and provision for attending seminars
/ conferences related to environmental issues, updating of skills etc. should be made. A
provision of Rs.5.0 lakhs may be earmarked annually.
6.10 ORGANISATIONAL SET-UP & STAFF REQUIREMENT FOR POST -
PROJECT MONITORING
A separate Environmental Division shall be formed under the control of Head of the
department, Mining .The composition of this cell shall be from following disciplines:
- Environmental Engineer
- Occupational Health Engineer
- Industrial Safety Expert
This division would work full time for the maintenance and operation of pollution control
system, collection of meteorological data, monitoring of coastal erosion, management of
groynes, water quality, social impact assessment and R&R, occupational health & biological
monitoring, radiation exposure monitoring , disaster management, development of green belt
and maintenance of environment & safety equipment.
This set of personnel could comprise of officials belonging to maintenance, industrial safety
and waste management units. A provision of Rs 40.0 lakhs is earmarked per year. Minimum
number of personnel required to meet the responsibilities associated with the environmental
aspects is recommended below.
1. Environmental Engineer- (1 no)
2. Occupational Health Expert
3. Industrial Safety Officer
3. Horticulture Adviser (1 no - Consultant )
4. Technical Officer ( Lab) – (3 nos)
Page 198
6-5
The engineers and supporting staff appointed for block IV could be utilized for this blocks
also. However an additional budget of Rs.10.00 lakhs is provided for extra manpower and
they can be taken on daily wages or contract,
Local people for casual labor could also be engaged. In addition to this a separate
environmental monitoring committee (EMC) will be organized comprising senior officers,
external experts, a citizen of the local area, and representative of the LSG to ensure
implementation of recommendations as per the EMP. This committee shall meet once in six
months.
Table 6.1: Recommended composition of the EMC
Job Description Designation
Managing Director or his nominee or the unit head Chairman
General Manager (HOD mining) Member
Environmental Engineer Convener
Health & Safety Officer Member
External Expert Member
Representative from Government Member
Representative from local people Member
Page 199
6-6
ENVIRONMENTAL MANAGEMENT CELL
UNIT HEAD
MANAGER (OPERATIONS) / HOD MINING
ENVIRONMENT MANAGEMENT CELL
TECHNICAL
ASSISTANT
ENVIRONMENTAL
ENGINEER
COLLECTION AND
ANALYSIS OF SAPMLES
FOR AIR QUALITY, WATER
AND WASTEWATER NOICE
AND SOIL MONITORING
OCCUPATIONAL
HEALTH EXPERT
TECHNICAL
ASSISTANT
COLLECTION OF DATA
ON RADIATION AND
PUBLIC HEALTH,
MONITORING OF
RADIATION LEVELS
INDUSTRIAL SAFETY
EXPERT
TECHNICAL
ASSISTANT
MAINTENANCE OF
SAFETY EQUIPMENTS &
PERSONAL SAFETY
MONITORING
Page 200
6-7
6.12 COST ESTIMATES
An amount of Rs.150.5 lakhs will be required for post-project monitoring which includes the
capital expenditure of about 34 lakhs and the recurring of about Rs. 116.5 lakhs / year. The
details are given in table 6.2.
Table 6.2 : Cost estimate for Environmental monitoring programme
Sl no. Parameters Cost in Lakhs
Capital Recurring Total
1 Meteorology including
wave monitoring
16.00 10.00 26.00
2 Topography - 10.00 10.00
3 Coastal Protection - 10.00 10.00
4 Water 15.00 5.00 20.00
5 Ecological Survey - 5.00 5.00
6 Mangrove and wetland
development
15.00 - 15.00
7 Green belt
development
10.00 10.00
8 Occupational Health &
Biological Monitoring
- 18.00 18.00
9 Radiation Survey - 10.00 10.00
10 Organisation Setup
including salary (Only
for additional man
power)
- 10.00 10.00
11 Training and meeting
etc of the
organizational Setup.
5.00 5.00
12 Socio-economic
development schemes
20.00 20.00
Total 46.00 113.00 159.00
Page 201
7-1
CHAPTER 7
ADDITIONAL STUDIES
The following additional studies have been conducted as part of the EIA report.
CRZ Report prepared by NCESS Trivandrum.
Mine-plan constituting Risk assessment and Mine closure plan.
Hydrogeology Study for NK block IV EE
Page 202
8-1
CHAPTER- 8
PROJECT BENEFITS
1. Block-IV EE with a total mine lease area of 180 Ha. The area has been prospected and
the average thickness of the deposit is seen to be 7.7 meters. The mineable reserve of
sand containing ilmenite, rutile, zircon, Sillimanite and leucoxene is about 6.02 MT as of
1/04/2016.The area available for inland mining in Block IVEE as per current land use is
will be 162.5 Ha (undisturbed area + inhabited area).The life of mining is restricted upto
30 years.
2. The IREL proposal is for Mining of heavy mineral sand in Alappad, Panmana and
Ayanivelikulangara villages in Karunagapally Taluk, Kollam district for an area of 180
Ha, in the Eastern Extension of NK Block IV.
3. Geological reserve in Block-IVEE is worked out to be 6.025 Million Tons on the basis of
the geological details.
4. About 45 acres plots of land are under the possession of IREL.
5. The heavy mineral sand deposits of the coastal stretch of Kollam district are one of the
richest in the world. These sands contain Illmenite, sillimanite, rutile, leucoxene, zircon
and the highly radioactive monazite which were being mined and separated by the IREL/
KMML during the last decade and value added by IREL during the last thirty years.
6. This heavy rare earths in economic proportion is available only in this stretch of Kerala
starting from Neendakara to Kayamkulam.
7. This is the only deposit on the Indian coast having heavy mineral contents ranging as
high as 60 to 70 % renowned as world class deposit
8. The deposits has been divided into two major parts viz. (1) The Beach zone (consists of
beach-front and mid-zone) (2) Inland zone .As per the AMD report, the economically
valuable minerals occur dominantly in the beach zone with width 122 to 183 m. The
evidence indicates that the reserves and highest grade occur in this zone and economic
grade occur up to about 8 m above clay bottom. It is reported that the beach is subject to
intermittent marine erosion and replenishment of heavy mineral takes place from
abundant off-shore and submarine deposits.
Page 203
8-2
9. Nearest Railway Station: Karunagapally (6 km), Nearest Airport: Thiruvananthapuram,
International Airport (110 km), NH 66 is about 3.45 km from the project site
10. IREL plant situated approximately at a distance of 15 km from the lease.
11. Monazite (a radioactive mineral) rich fraction separated in the Mineral Separation Plant is
stocked as per the procedure approved by Atomic Energy Regulatory Board in the Plant
premises.
12. IREL is one of the reputed and one of the most important production and export centers
of rare minerals and its value added product in the world. IREL helps in generating
revenue to the government.
13. The company gives top priority in employing the local people and also in suitably
compensating the people whose lands were/are acquired by IREL.
14. Mining sites are being regularly inspected by the statutory officials from the directorates
of Dept. of Atomic Energy/ Director General of Mines Safety, Atomic Energy
Regulatory Board, Indian Bureau of Mines, etc. for ensuring the implementation of the
statutes.
15. A number of social welfare schemes are envisaged and executed taking into consideration
the needs and aspirations of the local people. The main objective of CSR and
sustainability policy is to lay down guidelines for the company to make CSR a key
business process for substantial development for the society and environment with a
balanced emphasis on all aspects of CSR and Sustainability – equally with regard to its
internal operations, activities and processes, as well as in their response to externalities.
CSR and Sustainability activity is applicable equally to all stakeholders including
employees.
Some of such welfare measures being carried out for local people are listed below:
Drinking water distribution to the resettlement colony
Free medical camp at Vellanathuruthu
Construction of toilets under Swatch Bharath Vidyalya
Fishing Shelter in Pandarathuruthu
Page 204
8-3
Contribution to mining welfare board.
Figure 8.1 CSR activities of IREL
Page 205
9-1
CHAPTER 9
ENVIRONMENTAL MANAGEMENT PLAN
9.1 General
The aim of the environmental management plan (EMP) is to maintain ecological
balance and check harmful effect due to the inland mining mining. It ensures
integration of environmental control measures into the process of mine planning. The
Environmental Monitoring Programme detailed in chapter 6 includes institutional set-up
for effective implementation of environmental management activities.
Many of the areas of environmental management planning require
multidisciplinary approach. Therefore the measures envisaged in the report are to be
regarded as guidelines and continued advice is proposed to be taken from experts of
relevant fields like environmental pollution, meteorology, coastal management,
hydrology, mine planning, ecology, soil chemistry, socio-economics, radiation,
rehabilitation & resettlement etc. The suggested schemes are to be detailed and if
necessary, be modified from time to time to meet statutory requirements. The changes
warranted as per site specific conditions are to be accounted for, during actual
implementation. Further, in the light of experience likely to be gained during the initial
years of operation, proposed schemes may require periodic modification/updating.
In this chapter all technical, biological and socioeconomic control measures have
been envisaged. In the present project, the total environmental management plan for the
proposed 180 ha mining project can be divided into the following categories:
Air Environment;
Water Environment;
Solid Waste Disposal;
Noise Environment
Land Environment
Green belt development.
Page 206
9-2
9.2 Air Environment
Existing level of air pollution in the proposed core zone area is far below the
permissible limits (National Ambient Air quality norms). The dredge is electric driven
and therefore has no gas or dust emissions. The only source of air pollution is emissions
during road transportation of heavies from mine to Mineral Seperation Plant at Chavara
which is about 15.4 km from the 180 Ha mine lease (north west end).No spills or
emissions are expected from the loaded heavies as they are covered and transported in
moist form.
Air pollution can be totally avoided by using water transport through the TS
Canal. The suggested method is the use of country boats which are the most
environmentally friendly and having a very positive socio-economic impact. The
consultants recommends to undertake a field trial to work out the economics.
A field trial was undertaken by IREL to transport the material by boat on
05.10.2009 to check the depth and other obstruction in the canal water way. The material
was loaded at the project site in jumbo bags of 1 tonne capacity onto the boat. However,
on arrival of the boat at the plant site, the locals ( about 60 persons) objected to the
unloading of the materials from the boat raising unrealistic demands.
Presently the IWAI is in the process of capital dredging of the channel (NW3) to
provide two lane channel with planned width of 32 meters remains to be done in 3.00
km. This length of 3K.m’s is spread over two locations 1.00 km in Kayamkulam Kayal
requiring0.50 Lakh cu m. of dredging, which can be taken up with departmentaldredgers
after removal of fishing nets by State Govt.; and 2.00 km requiring1.47 Lakh cu m.
dredging including widening near Chavara. For completingthe work in Chavara area,
work has been awarded and the agency aftermobilizing at site, has commenced the work
since February, 2016. 0.11 lakhcu m. dredging in Kayamkulam Lake and 0.25 lakh cu m.
dredging in Chavara area has been completed with planned width of 32 meters remains
to be done in 3.00 km.
Another option to be considered is the use of two separate roads for truck
movement. The current path will be used as an empty truck route and another path has
been identified passing through S.V market road which will reach NH66, this route will
be used for loaded trucks. The alternate route was having a width of 615cm while village
Page 207
9-3
road was having only 530cm.All roads are tarred roads, but road widening is necessary
in those areas of truck movement as this will minimize the dust emissions to a great
extent. The existing roads should be widened, resurfaced and should be maintained in
good condition. (Reff fig: 5.3 in chapter 5)
However if road transport is to be persisted with, the following measures are
recommended to reduce pollution.
The existing roads should be widened, resurfaced and in good condition. Trees
should be planted on sides.
Ensuring transport equipment to be leak-proof. Vehicles transporting the minerals
shall be provided with tarpaulin cover
Provision of water trough at the exits of roads for tyre washing. This is specially
recommended at the exit of Chavara factory, for the return vehicles.
Good preventive maintenance schedule for equipments & vehicles
Supply of face masks to workers and staff to prevent dust inhalation
Overloading of transport equipment shall be prevented.
Gaseous pollutants in the exhaust fumes generated by the dozers and other
machinery shall be minimized by ensuring vigorous maintenance and stringent
overhaul schedules. The repair workshop and maintenance garage should be
equipped with all necessary facilities.
As an alternate method of transportation of materials from Block IVEE to Chavara
plant against the present method of transportation using contract tippers, pumping of the
spiral concentrate is proposed. It will be done by 7 stage pumping at a rate of 65 tph.
Three pumps will be located in the IREL's own lease area and 4 pumps in the KMML
lease hold areas. Power supply is to be sourced from the proposed dedicate feeder from
Chavara sub station to Block IV area. The total estimated cost of the project is Rs.500
lakhs.
The pumping system is designed for pumping 65 tph solids having specific gravity of
4.0 and the solid concentration of 26 %. The total volume of the slurry pumped is 201
cu.m /hr and the total head of the system is 315 meters. The pumps are located at 750
mts apart. The discharge of the first pump will be connected to the suction of the second
pump and so on. The pipe line will be 160 mm HDPE pipe of PNPE80 grade. The lines
Page 208
9-4
will be laid along the TS canal side and also through the KMML mining area depending
upon the terrain available for laying the pipes. The maximum working pressure in the
pipe line will be 5.5 bar.
9.3 Water Environment and coastal zone management
The existing and proposed core zone is a part of narrow strip of land between sea
and T.S. canal/Kayakulam Kayal. The soil is mostly sandy. The area receives heavy to
very heavy rainfall during the south west monsoon.
In addition, DWUP (Dredge and Wet Upgrading Plant) which is proposed to be
used at 180 ha ML area has a capacity of 125 t / h (15-16 hrs operation per day). The
manpower requirement is 8 operators and 3 engineers. The total manpower envisaged
including unskilled, clerk, electrician will be 18 nos.
During operation stage, no wastewater is generated due to operation of the plant.
The quantity of wastewater generated from domestic source is about 2.4 m3/day. It is
proposed to utilize the already existing toilet blocks with septic tanks/ soak pit
arrangement at Vellanathuruthu IRE site office.
Coastal protection measures against erosion are a major part of the environmental
management measures required in this area.The method of the construction of seawalls
on regular basis by the State Irrigation Department/IREL is already in practice.It is
recommended that sea walls may be substituted by groyns, which comes under the
purview of State Harbour Engineering Department. IRE can defray part of the
expenditure in the construction of groynes. The company is now planning certain steps to
recover the land lost to the sea. To reclaim the shore in Block IV EE and Block IV, it is
proposed to construct Groyenes in the NK Block IV EE area between Thazchakadavu
(IREL Boundary) and the VT bus-stand.It covers a distance of 700 meters. Four
groyenes will be constructed in this stretch with a distance of around 200 meters apart.
The groyene on the southern side will have a length of 75 meters, and on the northern
side will be of 40 meters. The groyenes in between will have a length of 100 meters and
75 meters. The groyenes will be constructed through the Irrigation department of Kerala
Government. The total cost is expected to be Rs. 10 crores.
Figure 9.1 shows EMP of the proposed ML area after mining. As per this plan, in
the post mining scenerio the land earmarked for proposed, conversion to wet land will be
Page 209
9-5
3.52 ha, green belt: 5.82 ha, Mangrove afforestation: 2.73 ha and mixed plantation: 130
ha.
9.4 Solid waste management
There are no solid wastes generated during the mining operation.During dredging
of canal and backwater, the dredged mud in the upper layers of sediment are likely to be
anaerobic and foul smelling.It should be disposed off at a site where it does not cause
odour nuisance.Disposal into sea may be considered as an option that is preferable to
land disposal.
In-house control measures should be adopted.These could be avoidance of
spillage of any material either solid or liquid and wherever possible, solid wastes should
be handled in a dry state in order to reduce water pollution. On commissioning of the
mining activity there will be an increase of 46 numbers of trips. The trucks shall be
properly covered to avoid spillage of raw material when transversed from mining
location to factory site.
NIIST has worked out a lab scale experiment for recovery of sand for
construction purpose as there is acute shortage of construction sand in the state. However
this may not be feasible as reject sand is required for refilling the mined out area.
The entire raw mineral sand mined from the inland mining areas is transported to
the HUP through tippers. The tailing/waste generated at the HUP (mostly consisting of
quartz in its native state) is used for back filling of inland mined out areas to bring the
land profile to the near original topography. The mined out inland areas near to sea are
back filled with an elevated height followed by plantation activities.
From all the mine leases the total raw sand quantity will be about 13,70,150 tonne
per annum, of which, the raw mineral sand contribution from 180.00.0Ha ML area alone
will be 7,50,000 tonne. Around 12lakh tonnes of tailing will be produced by feeding the
13.7 lakh tonne of raw sand throughput. These tailing will be utilized for back filling in a
scientific manner in the inland mined out areas. Tailings production annually from
180Ha ML area will be around 6.0 –6.6lakh ton from 7.50lakh ton of ROM and this
tailing will be used for back filling.
Mining activity in the inland deposits are carried out with simultaneous
back filling of mined out areas and hence it is an eco-friendly mining operation.
Page 210
9-6
The closure plans were reviewed for adequacy. It is seen that the material for
refilling will be the tailings from Inland mining and from BWC in other areas. The
quantity has been estimated on the basis of available geological information. This
material will be generally sufficient for refilling the mined out voids. Refilling of the
mined out area will address all the environmental concerns.
9.5 Noise Environment
Noise pollution like air and water pollution can be mitigated by controlling the
pollution source, curbing emissions at source and utilizing the land around them to
reduce its impact. However, unlike air and water pollution, noise does not accumulate
but dissipates within a short time and distance from its point of generation. The approach
to mitigation of noise levels therefore are: (1) mitigate noise at source (2) reduce noise
level at specific receiving points.
In order to predict the impact of noise generated due to the proposed DWUP, a
systematic survey of the ambient noise levels existing in a similar plant of IRE was
conducted. The overall impact was predicted and calculated using hemispherical model
for sound wave propagation. The predicted values showed the noise levels were
subsequently low comparing with the source noise level when the noise is reaching a
distance of 100m, Reffer table no.5.4 in chapter no.5
The predicted values were compared with actual measurement at IRE site.The
noise level at dredge was about 70 db.Noise levels were measured at various distance on
four sides and the average value is presented in figure 5.5 of chapter no.5. As seen from
the graph, the noise due to dredge operation fades off at less than 50 meters. Nearest
habitation is beyond 100m distance. Hence, there is no need for noise control measures.
The predicted values are comparable with the actual field measurements (ground
truthing) .Traffic noise from trucks is a nuisance for which there are no simple control
measures. If transportation of mined heavies by waterways, preferably by country boats
or by pumping is adopted, there will be no further traffic noise. However, exposure of
workers at dredge ( 70 db) needs to be minimized.This could be achieved by :
job rotation
automation
protection devices and
Page 211
9-7
sound proof control rooms.
9.6 Land Environment
The area proposed for Mining in the 01-05 years is in the South-Western part of
the lease. The mine will be operated as a mechanized mine with a dredge. The dredge
will be working in a pool which will advance with the mining operation of the dredge.
The rejects from DWUP will be used for refilling the pool. The heavies will be
mechanically / manually loaded into trippers for transport to Chavara Plant. The pond
will progress by the cutting action of the dredge.Figure-2.5 in chapter 2 gives the typical
dredge operation which will be followed at the 180 ha ML area.
The surface road is black topped upto Vellanathuruthu health centre which helps
to a large extent in avoiding fugitive dust.A new road is under construction from health
centre to site office. Adequate provisions should be made for the timely repair of the
roads by IRE. A good road would also reduce HC, NOx and CO emissions from the
vehicles also. Extraneous materials and objects should be removed from the site and the
ground surface maintained up to its original level.
One major problem anticipated in this project is the traffic congestion at
panchayat road connecting Pannikkarkadavu bridge to mine site and also in the PWD
road connecting NH 47 to Pannikkarkadavu bridge. The width of the road is very less
and it is not possible to widen it as there are many houses and establishments close to the
road. Frequent traffic blocks are experienced in this route which is partially due to
tippers transporting mineral concentrate from the mine lease.The deterioration of the
roads may be reduced by use of rubberized or plastic mixed bitumen.The traffic block is
very intense during the various temple festivals.
Frequent road accidents are reported in this area. It should be ensured that the
speed limit is 30km/h along the road connecting Pannikkarkadavu bridge to mine site.
Alternatively, the consultant suggests that IRE should develop a system in future
for transportation of heavies through waterways or pumping.The distance from 180 ha
mine lease area to existing IRE plant is only 6.85 km by T.S canal as compared to 15.4
kms by road (figure-5.5). Figure-5.6 gives the inland canal distance to Chavara IRE
plant. Transportation via country boats could provide job to the fishermen.
Page 212
9-8
The proposed site is not part of any national park, wildlife sanctuary, natural
reserve or biosphere reserve.No forest land too is being encroached. Hence, no
compensatory afforestation is required.
9.6.1 Land use planning
Back filling is integrated into the mining process.Backfilling has to be carried out
to original elevation, considering that the land is only a few meters above the high tide
level and the water table. Backfilling should also be carried out with sand alone in order
to preserve the ecology of the area. Since sand for backfilling to original elevation, will
leave some area unfilled, the extent of water body and wetland will increase. The
wetland will be planted with mangrove. The widening of the TS canal in the post mining
phase will also increase the water body extent. All these measures will result in a net
improvement of the land environment.
9.6.2 Water Transport
Water transport is an effective solution to the present road congestion observed in the
study area extending from the present Mine Lease area to Chavara plant. Main
advantages are:
No environmental pollution (zero contribution to air,water,noise pollution)
Provide job to the locals
Re-deployment of the displaced fishermen folk.
Less time for transportation due to less distance
Proximity to waterways
The main infrastructure – the waterways - NW3 – is available adjacent to ML
area and stretches upto IRE plant and this can be advantageously made use of
avoiding heavy traffic .
Thus consultant recommends country boats/barge on environmental and socio-economic
grounds. The loading and unloading of mineral heavies from country boats has to be
worked out. This equipment may be customed designed. The local fishermen societies or
the local panchayat may be engaged to provide the transport services. Another option for
loading and unloading is to have bins or 1t FIBC bags that can be loaded on and
unloaded from the country boat using cranes.
Page 213
9-9
West Coast canal system in Kerala is one of the currently designated National
Waterways in the country as indicated in table 9.1. The potential for this mode of
transport has been unquestioned over the years and it forms a significant fraction of
goods movement.. In Germany IWT constitute 20% [WB, 2005] and in Bangladesh it is
32% [Rahman Mushfequr, 1994]. However, in India, it is very meager (0.15%).
[Raghuram G, 2004] of the overall transport movement.
Table 9.1: National Waterways of India
Sl.
No
National Waterway Location
1 NW-1 Ganga-Bhagirathi-Hooghly -
Allahabad to Haldia
2
NW-2
Brahmaputra system in Assam
3
NW-3
West Coast canal system in Kerala
IREL had explored the possibility of adopting the water transport method in 2006. A
Public Tendering was done in this respect in the year 2006. The L1(Lowest Party) quoted
rate was Rs 246/- per ton against the prevailing rate of Rs 158.85/- per ton which reveals
that the water transport rate was 55% higher than the Road Transportation cost. In
addition to this the unloading cost from the barge and its subsequent transportation to the
stack yard is also to be taken in to consideration to arrive at the final end cost.However
consdering traffic conjestion in the existing road, availability of canal adjacent to the ML
area , shorter distance to plant via water transport and provision of local employment to
fishermen community a trail run using water transport to arrive at the feasibility is
recommended.
Further, the increase of forty six trips to the existing traffic due to the capacity expansion
to 7,50,000 will not cause any significant impact (Refer 5.2.2 in chapter 5).
Page 214
9-10
9.7 Greenbelt Development
Tree cover is not a significant issue in this project unlike in other mining projects.
The area is clear of natural vegetation that grows sparsely on nutrient poor sand. No sand
dunes are found in this project area and coconut plantations are found available here. An
important environmental issue of the coastal regions of Kerala is the loss of sand dunes
due to conversion to farmland. Hence, this project offers opportunity to restore sandy
expanses and natural vegetation, if replanting is avoided. White sandy expanses have
high aesthetic and tourism value and provides alternate livelihood instead of non-
remunerative.
Mangroves are recommended to be developed in area contiguous to Vattakayal.
These measures, if implemented will be an environmentally better option in this area
than traditional greenbelt and tree cover. Green belt is reccommended on the eastern part
of the ML area. Figure 9.1 gives the environmental Management Plan for the lease area.
Inland Waterways Authority is in the process of deepening and widening of the TS canal
as part of canal improvement programme.About 80% rejects is available for refilling and
to compensate for 20% heavies, the consultants recommend conversion of a part of ML
area to wet land and widening of TS canal. The management plan is formulated in line
with CRZ norms (Figure 9.1).
9.8 Occupational safety and health
Occupational safety and health is very closely related to productivity and good
employer-employee relationship. The main factors of occupational health in
Chavara Beach sand project are noise and radiation. Safety of employees during
operation and maintenance etc shall be as per mines rules and regulations. To
avoid any adverse effects on the health of workers due to various pollutants,
sufficient measures have already been addressed in this chapter. The following
measures relating to safety and health which are practised in Chavara project
shall be continued in proposed 180ha expansion programme also:
Provision of rest shelters for mine workers with amenities like drinking water
All safety measures like use of safety appliances, safety awards, posters, slogans
related to safety etc.
Page 215
9-11
Training of employees for use of safety appliances and first aid.
Regular maintenance and testing of all equipment as per manufacturers’
guidelines.
Periodical Medical Examination (PME) of all workers by a medical specialist so
that any adverse effect may be detected in its early stage.
9.9 Socio-economic measures
9.9.1 Measures for project Affected People (Rehabilitation and Resettlement)
The R & R scheme has been formulated after tripartite discussion between district
administration, affected people and project authorities. The scheme has been approved
by district authorities. The following have been decided about the scheme.
1. Basic land value shall be fixed by revenue authorities.
2. Value of trees, buildings and other structures shall be added to the above to obtain
market value. The market value obtained (by adding to the basic land value of
structures, trees and other improvements) will be enhanced to obtain the
compensation price. Over and above the following rehabilitation benefits and
shifting/good will charges will be provided.
3. A list of evictees will be maintained to provide employment on priority basis
wherever there is an opportunity.
9.9.2 Measures for fishermen community
The local fishermen shall be engaged in transporting the mineral heavies from 180 ha
ML area to Chavara IRE plant. Substantial amount of revenue as well as employment
can be generated for the local fishermen community.
The local fishermen could be associated to monitor ecology of the area as well as for
planting of mangroves/trees.
Increased fishing activity due to better approach to sea face as well as improved
inland fisheries due to more mangroves productive area.
Conversion of non-productive area into a tourist white sand natural ecological area
with sand dunes, management measures against sea erosion, Back water bank
protection using Rip Rap, increased income from TS canal.
Page 216
9-12
Provisision of four groins in Block IV mine lease would enhance the formation of
beach and also protect the inhabition from the hazards of sea eraosion.
9.9.3 General Measures (for people, in general, of the region)
Mining and mineral processing involve transportation activity for day to day
operation. Substantial amount of revenue is expected to be generated by
transportation activities along with employment e.g. labour, helper etc. Project
authorities shall engage (on contract) the local people for transportation or at least
can arrange for loading and unloading heavies/tailings by local people.
In case of direct manpower required for mining and mineral processing operations,
local people shall be employed as much as possible especially in the categories of
unskilled and semi skilled labours subject to rules and procedures in vogue for
PSU’s.
A section of local youth shall be trained in phases so that they can take up some jobs
(mining contractorship, building contractorship, supply of mining/MSP materials and
also small scale rural business developments) of their own (self employment) or in
mines (on contract basis) or elsewhere.
IRE shall provide training from time to time for improved agrotechniques, first aid
and safety, adult literacy programme to the villagers.
IRE shall provide regular grant to neighboring schools and constant encouragement
for cultural activities in local villages.
Page 217
9-13
9.10 Radiation aspects
The pre operational radiological monitoring of the proposed mining area at
Vellanathuruthu region was carried out by Health Physics Unit (HPU) of IREL
Udyogamandal along with HPU of IREL, Manavalakurichi.Post project radiological
survey will be carried out in similar manner.This radiation studies will help to analyse
the overall reduction in radiaoactivity by mining in the project site.
Page 218
9-14
Figure 9.1: Environmental Management Plan IRE – 180 ha ML area
Page 219
9-15
Figure 9.2 : Demarcation of HTL, LTL and CRZ
Page 220
CHAPTER 10
SUMMARY & CONCLUSION
1. IREL proposes to mine NK Block IVEE, Karunagapally having a mine lease area 180 Ha by
inland mining by using Dredge Wet Upgradation Plant (DWUP). The company has already
accorded EC & CRZ clearance for mining of 2,37,150 TPA . Now as per the request of the
public for return of the land at the earliest, the company propose for enhancement of mining
from 2,37,150 TPA to 7,50,000 TPA. The reserves of mineable deposit based on prospecting
by AMD is around 6.02 MT.
2. IREL has appointed CSIR - NIIST, a NABET Accredited Govt.of India Category-A EIA
consultant organisation, Thiruvananthapuram, to evaluate the environmental aspects and their
possible associated impacts that would arise due to the proposed heavy mineral sand mining
and to work out mitigation measures to prevent/ minimize/ control the adverse environmental
impacts envisaged from the proposed mining. CSIR-NIIST has carried out the studies as per
the TOR during the period of 2015-2017.
3. IREL has obtained surface rights of 45 acres of land, which is sufficient for the first five
years. The company is in the process of acquiring the remaining land on lease.
4. The method of mining is open cast inland mining or by using dredge or excavators.. Inland
mining will be done by using dredge. The dredge has a working length of 30 meters and
width of 14m. The separation is through physical process and no chemicals are used. The
semi mechanized mining includes refilling of mined area using tailings from pre
concentration plant and mineral separation plant.
5. After studying the proposed project and its activities the consultant along with the approved
empanelled experts has generated baseline data of the core and buffer zone. This includes
analysis of air, soil, water, noise, traffic, hydrology, geology, ecology, and socio economic
parameters. Envirodesigns Eco Labs Ernakulum an NABL/MoEF accredited laboratory is
10-1
Page 221
also associated for generation of primary data. The significant aspects include dust emissions
due to traffic movement, increase in traffic and social impact assessment
6. The present air quality has been monitored and the results for PM 10, SO2, NOx shows these
parameters are under the limit prescribed by CPCB. Noise quality of the environment has
also been evaluated and the result shows that all the values were within the limits.
7. Various impact models include Envitrans Fugitive Dust Modelling Pro for air quality
modelling, hemispherical model equations for noise modelling and GIS applications for
landuse are depicted for prediction of impacts due to mining and related activities. PM10
concentration might increase in future during the full-fledged mining operations. This can be
remedied by adapting the EMP measures suggested in the report.
8. Due to the full-fledged mining activities, there will be additional truck movement of 46 trips.
This will increase the traffic congestion and risk associated in the panchayat road connecting
the mine lease with the NH. For the control of traffic, an alternate traffic management plan
for carrying the minerals to the Chavara IREL plant has been suggested.
9. The consultant recommends the use of TS Canal (NW3) which is adjacent to mine lease for
transportation of the concentrate to IREL plant instead of the pathway presently used. IREL
may explore this option of Water transportation, which could reduce the dust emission due to
increase in trucks and minimize overstraining of the existing pathway. As an alternative. the
pumping of mineral concentrate using piping conduits is also recommended.
10. The surface and ground water characteristics have been established through field
monitoring data at 13 locations generated during the study with respect to physicochemical
characteristics and pollutant levels and the same has been compared with quality criteria for
drinking water. The results showed limited increase in the water quality parameters above the
prescribed limit. The Ground water contour map generated indicates that the flow/movement
of water is predominantly towards South West and to the eastern side of the lease. Various
remedial measures for overcoming this problem has been suggested in Environmental
Management Plan chapter.
10-2
Page 222
11. Socio economic aspects has been studied by an independent NGO group called SISSR. This
aspects has been carefully analysed by considering all social impact elements and the survey
indicates that people are partially losing their traditional jobs due to mining. Some reported
that the company is not offering the right value for their property and it is difficult to
purchase land elsewhere with the lesser amount given by the company. The consultant
suggests measures for improving the socio economic aspects of the people in core and buffer
zone. This involves the formulation of a well acceptable R&R policy, supply of drinking
water and providing direct / indirect jobs to locals. However IREL has a long history in
attending the problem by way of providing potable water to surrounding locality and by
giving preferential chance to the locals for employment.
12. The consultant has developed an effective Environmental Management Plan for mitigating
the impacts observed in all respective environmental field relevant to this project. For dust
suppression remedial measures like usage of alternate road /water way/road widening /
pumping of concentrate was suggested. For suppressing of dust on the roads, the consultant
suggests the use of 35% calcium chloride (dust suppressants) on the haul roads between mine
lease and the panchayat road. Construction of Groins are suggested to mitigate sea erosion.
13. As a management measure NIIST suggests the formulation mangrove afforestation for an
area about 2.17 Ha. In the current project there is limited scope for development of green belt
as the company is proposing to return back the land to owners after mining.
14. Additional studies conducted includes marine ecological survey, detailed hydrological
studies, and mining issues of open cast mining of Block –IVEE prepared by a Mining
engineer.
15. Implementation of a post project monitoring with the cost estimation is suggested in the
report. Post Project Monitoring will help to understand whether the mitigation measures
suggested are effective to control the impacts. An amount of Rs. 159 lakhs is estimated for
post project monitoring which include capital and recurring expenditure.
10-3
Page 223
11-1
CHAPTER 11
DISCLOSURE OF CONSULTANTS 11NAME OF THE CONSULTANTS:
11.1 CSIR-NIIST: The National Institute for Interdisciplinary Science and Technology
(NIIST), Thiruvananthapuram, is a constituent Laboratory of the Council of Scientific and
Industrial Research(CSIR).Initially established in 1975 as a CSIR Complex ,it was named as
the Regional Research Laboratory in 1978 and later renamed as NIIST in 2007.Its mandate is
to conduct research and development activities of the highest quality in areas related to
effective utilization of resources of the region and of fundamental importance to the country.
Currently NIIST is engaged in R & D programmes in areas related to Agroprocessing,
Chemical Sciences ,Materials Science and Technology, Biotechnology, Process Engineering
and Environmental Technology. The institute has established state-of-the- art facilities for
conducting advanced research in the areas of interest .Pilot plant facilities for research
training and process/product development in the areas of spices and oilseeds have been
established. The institute has also been playing a significant role in Human Resource
Development by training post graduate/graduate students, with over 252 Ph.D degrees
awarded till date, based on research conducted in the institute.
The R&D activities are now broadly classified into five major areas :
Agro-Processing and Technology Division
Materials Science and Technology
Chemical Sciences & Technology
Environmental Technology Division
Microbial Processes and Technology Division
11.1.1 ENVIRONMENTAL TECHNOLOGY DIVISION (ETD) The ETD Division develops innovative processes and technologies for value addition to
resources of the region and for the management of the region’s environment. ETD comprises
engineers, chemists, physicists, mathematicians, biologists and computer scientists. These
multi-disciplinary skills come together to address real problems.
Page 224
11-2
The CSIR-NIIST is the first organization to get NABET Accreditation in Kerala and on the
process of acquiring NABL Accreditation also. NIIST has an MOU with Environment &
ECO CARE, a NABL/ MOEF approved laboratory at Cochin to collaborate in EIA studies. A
panel of highly qualified NABET approved empanelled experts are involved in the various
environmental management studies.
ETD is engaged in the development of processes for odour control, anaerobic treatment of
solid waste, industrial water purification, biofuel from marine microalgae, bioremediation of
perchlorate in waste water and Environment Impact Assessment (EIA) studies. The
Computational Modelling group provides computational tools and services for designing
engineering and chemical processes and investigating the complex phenomena in biological
systems. The Dioxin Research Unit is focusing on the monitoring, control and phase out of
Persistent Organic Pollutants (POPs) with special reference to dioxins and furans from
various industrial and non-industrial activities in Southern states of the country.
The institute has an active programme targeting societal development. Recently CSIR has
identified CSIR-800 as a thrust area with a vision of inclusive growth and improvement in the
quality of life of the 800 million people at the bottom of economic pyramid, through S & T
interventions. Under this scheme CSIR-NIIST has taken up a project named Green
Enterprises for Micro-Sector(GEMS). A number of technologies that have the potential to
crate green micro-enterprises that generate income and employment for low income groups
and are at the same time beneficial to the environment, have been identified, namely
i)environment friendly extraction of natural fibers ,ii)natural fiber based biodegradable
household articles, iii)value addition of under-exploited and under-utilized agro products,
iv)agro-technologies for cultivation and post-harvest management of medicinal, aromatic
plants and v)development of green household sanitation devices. Linkages are being built up
with NGOs and appropriate Governmental bodies for delivery of the technologies in a way
that would benefit large number of people in the low income group .The institute has also
been supporting in Kerala Tile Sector in modernization of infrastructure, training manpower
and setting up quality control laboratories. Studies on industrial feasibility for preparation of
coir and banana fiber reinforced polymer composite panels and building components have
also been conducted
Page 225
11-3
Consultants Name & Address
CSIR-National Institute for Interdisciplinary Science & Technology
Industrial Estate PO
Pappanamcode
Trivandrum-695019
Kerala
Page 226
11-4
11.2 NABET LETTER OF ACCREDETATION
Page 227
11-5
11.3 DECLARATION OF EXPERTS
CSIR-NIIST
EIA: IRE PROJECT – DECLARATION OF EXPERTS
Project Proponent Indian Rare Earths Ltd
(A Govt. of India Undertaking)
An ISO Certified Company
Chavara- 691583
Kollam, Kerala
Project Proposal
EIA study for Mining of Beach Sand Mineral with enhancement of production capacity from 2,37,150 to 7,50,000 TPA in Alappad, Panmana and Ayanivelikulangara villages in Kollam district for an area of 180 ha in NK block IV EE by Indian Rare Earths, Chavara, Kollam, Kerala
Project Location Alappad, Panamana and Ayanivelikulangara Villages Kollam district,
Kerala state.
EIA Coordinator Dr.Jamal .Ansari