1 Export of Services: Indian Experience in Perspective Barry Eichengreen and Poonam Gupta Working Paper No. 2012-102 March 2012 National Institute of Public Finance and Policy New Delhi http://www.nipfp.org.in
Transcript
1
Export of Services: Indian Experience in Perspective Barry Eichengreen and Poonam Gupta
Working Paper No. 2012-102 March 2012
National Institute of Public Finance and Policy New Delhi
http://www.nipfp.org.in
2
Exports of Services: Indian Experience in Perspective Barry Eichengreen and Poonam Gupta1
March 2012
Abstract We survey India’s experience with exporting services. We show that its experience is unique in that modern tradable services are a significantly larger share of GDP than in other countries at comparable levels of economic development. This has not always been the case, however: India’s out-performance is limited to recent years. Policy initiatives, from trade reform to liberalization of domestic industrial and service sectors, were important for jump-starting the process. Regression analysis of a cross section of countries points to the importance of a range of additional factors: overall economic development, communications infrastructure, access to foreign technology, and spillovers between the merchandise and service exports. Importantly, however, these factors, jointly or individually, do not eliminate Indian exceptionalism. Not only is India a significant outlier but it becomes more so as the period proceeds.
1 University of California, Berkeley and National Institute of Public Finance and Policy, Delhi, respectively. We thank Honey Karun for excellent research assistance. Comments are welcome at [email protected] and [email protected]
3
1. Introduction
In this paper we examine India’s experience with exporting services. We show that its experience is distinctive in that services, especially modern tradable services, comprise a significantly larger share of GDP than in other countries at comparable levels of economic development. This has not always been true, however; India’s out-performance in services is limited to recent years. While India is not entirely unique, in that a number of other developing countries have similarly become increasingly successful at exporting services, it is enough of an outlier that its experience warrants detailed attention.
What determines whether a developing country succeeds in exporting services, perhaps
even before it succeeds to a similar extent in exporting manufactured goods? What unique advantages does India possess, and why have they not always been equally effective in stimulating the production of tradable services? Previous researchers have pointed to factor endowments, especially the availability of an adequate supply of relatively highly-skilled English-speaking labor; to infrastructure suitable for the production and export of modern services, such as the adequacy of telecommunications services and extent of internet penetration; and to supportive policies specific to services, such as favorable tax treatment and special economic zones, of which India’s Software Technology Parks (STPIs) are an example. They have sought to establish the relevance of these factors by estimating the determinants of services exports using panel data for a sample of countries, including measures of these variables in gravity models of bilateral services trade, and conducting country case studies.
This paper reviews the literature and evidence. It takes a close look at the Indian service sector and specifically information-technology-related (IT) services, seeking to situate India’s experience in its comparative context. We document the role that exports of services have played in the performance of the economy in recent years. We seek to pinpoint the “take-off” in Indian services output and establish the extent to which the country’s success in exporting services is exceptional from an international point of view. And we discuss the extent to which India’s performance as an exporter of services has been shaped by policies liberalizing the service sector itself as well as the manufacturing sector.
Section II starts with an overview of India’s experience as a producer of services. Section
III then looks more closely at exports of services, both by India and other countries. Section IV provides a snapshot of the growth of information technology services, where India is an outlier. Section V describes the public-policy innovations that have shaped the country’s recent service sector performance. With this material as context, Section VI presents new empirical work designed to shed light on the role of public policy and other factors in explaining the rapid growth of India’s service exports. Section VII, concludes.
II. Overview
While the share of services in India’s GDP has risen over much of the post-independence period, there was a marked acceleration in the trend in the early 1990s. The service sector then grew at an annual average rate of 10 percent a year in 2006-10, as compared to 7.7 percent in the
4
1990s and 8.8 percent during 2000-2008, and faster than the economy as a whole.2 Services contributed 2/3rd of GDP growth during this period, constituted a large and increasing share in India’s exports basket (about 35 percent in 2010), successfully weathered the global financial crisis, and provided employment for an increasingly large percentage of Indian labor force. Services accounted fully 59 percent of GDP in fiscal year (FY) 2012 (See Figure 1).3
Figure 1. Shares of Agriculture, Industry and Services in India
Note: Data are from Central Statistical Organization (CSO) for FY1951-FY 2012. The data upto 2009-10 is actual, the data for FY 2011 is “quick estimate” and the data for FY 2012 is “advanced estimate.” To place India’s experience in perspective, we follow Eichengreen and Gupta (2009),
plotting the share of services in GDP against per capita income in a sample of low-, middle- and high-income countries. We regress services/GDP on multiple powers of per capita income in order to let the data speak. The fitted values in Figure 2 suggest the service sector of GDP rises in two phases. It first begins to rise at relatively modest incomes but at a decelerating rate as growth proceeds, before leveling out at roughly US $1,800 per capita income (in year 2000 US purchasing-power-parity dollars). At a per capita income of roughly US $4,000 the share of the service sector then begins to rise again before eventually leveling off a second time.4 For sake of comparison, note that India’s per capita income (in year 2000 US purchasing-power-parity 2 Which grew at 8.5 percent, 5.7 percent and 6.6 percent respectively during these periods. 3 Services includes trade, transport, storage, communication, financial services, insurance, real estate and business services, hotels and restaurants, education, health, other personal services, public administration and defense. It does not include construction, and utilities such as electricity, gas and water, which is included in industry in Indian national accounts. 4 In addition, it appears that there was an upward shift in the second wave of service-sector growth after 1990. That is to say, the second wave starts at lower levels of income after 1990 than before.
0
10
20
30
40
50
60
70
1951 1961 1971 1981 1991 2001 2011
Agriculture Industry Services
Year
5
dollars) was about $1,300 in 1990, when its service-sector share first converges to the international norm; per capita income in 2010 (in year 2000 US purchasing-power-parity dollars) is about $3,400.
Benchmarking India to this cross-country norm shows that the service sector was stunted
all through the 1950-1990 period, with the gap in fact widening further after 1960. Initially that gap can be explained by Nehru’s heavy-industry drive, but one would have to attribute an unusually long-lived legacy of those policies for them to explain the fact that the service sector remained undersized throughout the 1970s and 1980s. More likely is that other policies limiting access to imported inputs utilized by the service sector, inadequate infrastructure, and continued heavy regulation of manufacturing (which limited that sector’ derived demand for services) hindered the sector in these decades. We return to this below.
Figure 2. Service Sector Share in GDP and Log Per Capita Income
Note: The charts extend the analysis in Eichengreen and Gupta (2009) through 2006 . The estimated relationship is based on a regression of share of services in GDP on a quartic polynomial in log per capita income, and country fixed effects. The regressions allow for a different intercept in the three periods indicated and different slope parameters in 1990-2006.
Whatever the explanation for this earlier performance, there was then convergence to the international norm starting in the 1990s. By 2005, the share of India’s service sector had risen to a level slightly above that predicted by international experience. Currently it is significantly
204
06
08
02
040
6080
6 7 8 9 10
6 7 8 9 10
1950-1969 1970-1989
1990-2006
Linear prediction India
6
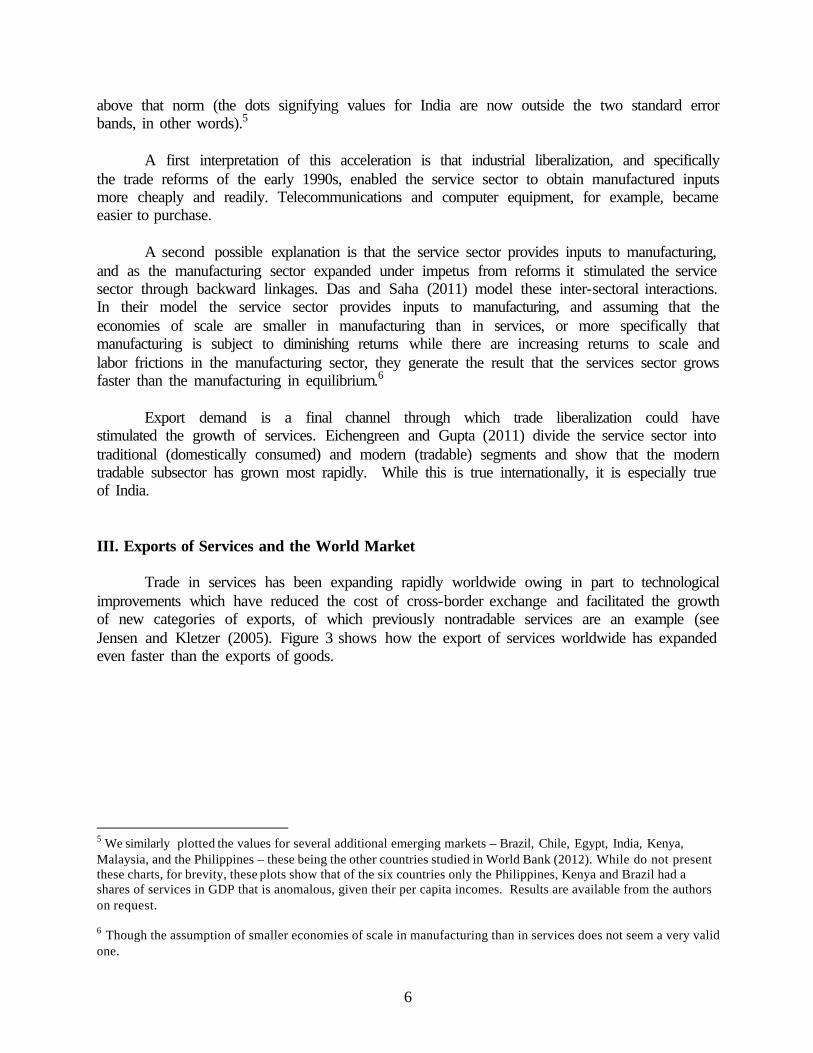
above that norm (the dots signifying values for India are now outside the two standard error bands, in other words).5
A first interpretation of this acceleration is that industrial liberalization, and specifically
the trade reforms of the early 1990s, enabled the service sector to obtain manufactured inputs more cheaply and readily. Telecommunications and computer equipment, for example, became easier to purchase.
A second possible explanation is that the service sector provides inputs to manufacturing,
and as the manufacturing sector expanded under impetus from reforms it stimulated the service sector through backward linkages. Das and Saha (2011) model these inter-sectoral interactions. In their model the service sector provides inputs to manufacturing, and assuming that the economies of scale are smaller in manufacturing than in services, or more specifically that manufacturing is subject to diminishing returns while there are increasing returns to scale and labor frictions in the manufacturing sector, they generate the result that the services sector grows faster than the manufacturing in equilibrium.6
Export demand is a final channel through which trade liberalization could have
stimulated the growth of services. Eichengreen and Gupta (2011) divide the service sector into traditional (domestically consumed) and modern (tradable) segments and show that the modern tradable subsector has grown most rapidly. While this is true internationally, it is especially true of India.
III. Exports of Services and the World Market
Trade in services has been expanding rapidly worldwide owing in part to technological improvements which have reduced the cost of cross-border exchange and facilitated the growth of new categories of exports, of which previously nontradable services are an example (see Jensen and Kletzer (2005). Figure 3 shows how the export of services worldwide has expanded even faster than the exports of goods.
5 We similarly plotted the values for several additional emerging markets – Brazil, Chile, Egypt, India, Kenya, Malaysia, and the Philippines – these being the other countries studied in World Bank (2012). While do not present these charts, for brevity, these plots show that of the six countries only the Philippines, Kenya and Brazil had a shares of services in GDP that is anomalous, given their per capita incomes. Results are available from the authors on request. 6 Though the assumption of smaller economies of scale in manufacturing than in services does not seem a very valid one.
7
Figure 3. Global Exports of Goods and Services in Current USD (Index 1975=100)
Source: Constructed using the data from the World Development Report. In India itself, exports of both goods and services have been increasing more rapidly than
global exports and imports, but the growth of the country’s exports of services has outpaced even the growth of its merchandise exports (Figure 4).
Figure 4. Trends in World Exports and Indian Exports of Goods and Services in current USD (Index=100 in 1990)
0
500
1000
1500
2000
2500
1975 1980 1985 1990 1995 2000 2005 2010
World Goods Exports(Current US $)World Services Exports (Current US $)
0
500
1000
1500
2000
2500
3000
1990
1991
1992
1993
1994
1995
1996
1997
1998
1999
2000
2001
2002
2003
2004
2005
2006
2007
2008
2009
2010
India(Goods Exports) World (Goods Exports)
India (Serivices Exports) World (Services Exports)
8
Source: Constructed using the data from the World Development Report. In Figure 5 we compare the annual growth rate of exports of services across countries and
over the two most recent decades. While the growth of exports of services has accelerated across a wide range of countries, it has risen fastest of all in India in the most recent decade. 7
Figure 5. Growth Rate of Services Exports, Various Countries
Source: Constructed using the data from the World Development Report.
The fast pace of growth of service exports is reflected in the rising share of India in global markets for tradable services. Starting from ½ percent of the global demand for services in the early 1990s, the country’s share has risen to 3.3 percent as of 2010 (Figure 6). By comparison, India’s share of merchandise exports, which was similarly on the order of ½ percent of global merchandise exports in 1990, inched up to only 1½ percent in 2010, or less than half the share of services.
7 During the crisis services exports were more resilient to the impact of the crisis than trade in goods. Moreover according to UNCTAD during the crisis the foreign investment prospects in services were more stable than in other activities.
14.118.6
7.215.4
11.47.7
9.47.3
8.73.5
5.05.5
3.86.1
22.518.2
9.19.2
7.64.8
9.16.3
14.79.6
11.07.8
10.49.8
IndiaChina
AustraliaMalaysia
Turkey
CanadaHong Kong SAR, …
United StatesSingapore
NorwaySwitzerland
Japan
Euro areaWorld
Average Growth Rate of Exports of Services
Average Growth Rate 2001-2010 Average Growth Rate 1991-2000
9
Figure 6. India’s Share of World Exports of Goods and Services
Source: Constructed using the data from the World Development Report.
The value of exports of services is reported by the Reserve Bank of India (RBI) separately for traditional and other services (where traditional services include such things as travel, transportation and insurance). Exports of modern services such as software, other business services, financial services and communications were clubbed together with other services until 1999-2000, after which the RBI reported software exports separately. Only from 2004-05 does the RBI also provide the data separately for different categories of modern services.
Figure 7, which shows the composition of exports of services at ten year intervals, indicates that the share of exports of modern services in the total rose from 44 percent in 1991 to 63 percent in 2000/01 and further to 74 percent in 2010/11.8 Figure 8 shows similarly that the share of modern services (software, other business services, communications and financial services) in the country’s total export basket has increased from about 8.7 percent in FY1991 to 20 percent in FY 2000 and to 26 percent in FY 2012. The importance of the information technology/business products subsector has been growing at a particularly rapid rate. Thus, the share of software services in Indian exports basket has increased from 10 percent in 2001 to 15 percent in 2011.
8 The share of traditional services in total services exports, the exports of which are likely to be correlated closely and to increase in tandem with the export of goods exports, has correspondingly declined.
0.5 0.6 0.71.0
1.50.5 0.5
1.1
2.0
3.3
1990 1995 2000 2005 2010
Share in Goods Exports Share in Services Exports
10
Figure 7. Composition of Services Exports from India (in 1990, 2000 and 2001)
Source: Authors’ calculations based on Reserve Bank of India Balance of Payments Data.
Travel32%
Transportation22%
Insurance2%
44%
Software + Misc.services(Busi., Fin.,
1990/91; Services Exports = $ 4,551 million
22%
13%
2%
41%
22%Travel
Transportation
Insurance
Software
Misc. services(Busi., Fin., Comm.)
2000/01; Servics Exports= $ 16,268 million
Travel12%
Transportation12%
Insurance2%
Software services
48%
Misc. services(Busi., Fin.,Comm.)
26%
2010/11; Services Exports = $ 131,972 million
11
Figure 8. Composition of India’s Exports Basket
Source: Authors’ calculations based on Reserve Bank of India Balance of Payments Data.
IV. A Snapshot of the Indian IT Sector
The IT sector (sometimes referred to as the IT-BPO sector, where BPO denotes business process outsourcing) is one of the most dynamic segments of the Indian economy. Until the mid-1980s growth of the subsector was modest due to high tariffs on imported inputs and lack of access to foreign exchange due to the provisions of the Foreign Exchange Regulation Act. Following relaxation of these constraints it took off, increasingly rapidly as other regulations affecting production and exports were relaxed and growth in the global demand for information technology-related services accelerated.
In the last decade the IT sector has grown impressively. Revenue in nominal US dollars
rose eleven fold between 2000 and 2011. The IT sector primarily caters to the international market; two-thirds of revenues derive from exports. That said, both domestic and export revenue have risen strongly (Table 1). While the average annual rate of growth of the domestic segment, at 19 percent in nominal US dollar terms, is slower than the 31 percent average annual growth of export revenues, it is impressive nonetheless.
0%
10%
20%
30%
40%
50%
60%
70%
80%
90%
100%
FY1991 FY2000 FY2012
Manufacturing
Others (Primary, Petroleum, other)
Traditional Services(Travel, Insurance, transportation)
Modern Services(Software,Busi., Fin., Comm.)
12
Table 1. Revenues of the IT sector in Domestic and Export Markets (US$ billions)
The Indian IT sector has grown in three waves: a first wave consisting of IT services, a second dominated by BPO, and a third extending to knowledge services outsourcing (or KSO, which consists of business research, data analysis, market research, data management, and legal research). (See Figure 9) 9 . Expansion of KSO has been rapid since the turn of the century: globally, a sector that generated revenues of $1.2 billion in FY 2006 now generates some $2.9 billion (circa 2010); India accounts for nearly 70 per cent of this global market, reflecting an impressive rate of growth of 24 percent per annum over the past 5 years. Indian KSO employs some 70,000 workers, some of them highly skilled, and is expected to grow at a similarly robust pace and to employ nearly twice as many people by 2015.
In terms of regional dispersion, Indian IT is increasingly spread across as well as within
states. Further expansion of the industry is likely to be in smaller cities such as Chandigarh, Nagpur, Coimbatore, Pune, Jaipur, Mysore, and Ahmadabad due to the cost advantages that these cities enjoy, including relatively low land prices and wages.
9 This according to the National Association of Software and Services Companies (NASSCOM), the trade association of Indian Information Technology (IT) and Business Process Outsourcing (BPO) industry.
13
Figure 9. Composition of IT Exports
Source: NASSCOM As Table 2 shows, the market for Indian IT exports is geographically concentrated, with
the US taking 60 percent. The UK takes another 18 percent, leaving less than a quarter for the rest of the world. Although Indian exporters have been seeking to penetrate other national markets, their efforts have been hindered by the additional obstacles of exporting to non-English-speaking countries.10 Table 2. Destination of IT exports
FY 2002 FY 2009 USA 69 60 UK 14 18 Continental Europe 8 13 Rest of the World 9 9
Source: NASSCOM
10 Consistent with this, Tharakan et al (2005) compare gravity-model-theoretic estimates of the determinants of exports of software services and merchandise from India in the period 1998-2001, finding a positive and highly significant coefficient on their English language dummy for software exports but not for total goods exports. (In the latter case the coefficient is again positive but insignificant.) They also find that distance does not have a significant impact on exports of software (consistent with the intuition that it should matter less than for merchandise trade) and that measures of the India Diaspora enter positively and significantly (both the UK and US have large Indian Diasporas).
6.6 8.3 9.6 10 11.37.6
9.9 11.7 12.4 14.117.1
22.225.8 27.3
33.5
0.5
0.5
0.40.4
0.4
31.7
40.9
47.550.1
59.4
FY2007 FY2008 FY2009 FY2010 FY2011E
Software Products and ER&D BPO IT Services Hardware
USD billion
14
Some observers have expressed concern about the limited employment potential of
Indian IT. NASSCOM reports that employment totaled 2.2 million in FY 2009. 11 What will happen next is of course a matter of speculation, although service-sector sales and employment experience in other countries provides one basis for estimating the employment elasticity, i.e. the percentage increase in employment for one percent increase in the value added or sales growth. Eichengreen and Gupta (2011) report relatively high employment elasticities in modern tradable services, and especially the IT sector, for the OECD countries. Data on sales growth and employment growth in the Indian IT industry yields an employment elasticity of 0.90, similar to that for the OECD countries.
Not only manufacturing but also other sectors are heavy end users of IT services.
Globally, banking and financial services absorb some 40 percent of the Indian IT exports, while manufacturing in contrast absorbs only 16 percent (Table 3). What is true of India’s service exports is similarly true of its domestic sales: in Eichengreen and Gupta (2011) we show that outsourcing from manufacturing accounts for only a small percent of service sector growth. At the same time, that the manufacturing sector has been slow to outsource service sector activities traditionally undertaken in house and that manufacturing production has tended to lag imply that there is a large potential domestic market yet to be exploited.
Table 3. IT-BPO Exports by Activity/Industry Percent of total IT-BPO
Exports in 2002 Percent of total IT-BPO Exports in 2009
Banking and Financial Services 36 40 Hi-tech Telecom 15 20 Manufacturing 12 16 Retail 4 9 Other 33 15
Source: NASSCOM.
Observers point to several explanations for the expansion of the global IT market and the shift toward countries like India: shortages of skilled labor due to adverse demographics in the advanced countries; time to market becoming shorter; and that the companies are mastering the challenges of outsourcing a growing range of activities. India’s specific advantages include the availability of educated work force (2 million graduates each year who can speak English); occupancy costs (especially in smaller cities) that are a fraction of those in developed countries; low compensation costs; and a favorable time-zone differential. The literature also points to the challenges that India will face in maintaining its competitive edge, including weak intellectual property rights, a high attrition rate of companies, nascent talent shortages, and rising land prices. While the global market for these services is growing, it has been growing less rapidly than the 11 Workers in the IT sector are young: one third employees are between 18-25 years of age, while 40 percent are 25-30 years old. About a third of professional employees are women
15
Indian IT sector. The latter has been expanding at 30-40 percent a year, while the global market is growing at a considerably slower rate, so there would be natural limits to how far this sector can grow and result in overall prosperity.12 Sustaining the growth of the Indian IT sector will therefore require an ever larger market share for the country’s exporters. How long this can continue is to be seen.
Section V. Public Policy Framework
In India the issue is often posed as: why services rather than industry? Typically, answers start by pointing to labor market regulation and infrastructure limitations.13 The service sector does not face the same heavy labor market regulation as the industrial sector, such as the measures included in Chapter VB of the Industrial Disputes Act requiring firms employing more than 100 workers to obtain the permission of state governments in order to retrench or lay off workers in industries.14 Services are not subject to the Factories Act, which regulates the working conditions of employees in the industrial sector; instead firms producing services are governed by the Shops and Establishment Act, with its less stringent conditions. In addition, trade unions are relatively few in services, aside from limited sectors like banking and government-run air transport.
In addition, the software and business process sectors, with more limited energy needs and access to satellite telephony, have been able to circumvent the infrastructure problems that have hindered the growth of manufacturing. Revealingly, while India has also been able to export software services without being constrained by a relatively low level of internet penetration, it has done less well in exporting transport and travel services, given their more intensive use of physical infrastructure (World Bank 2011).
The development of modern services initially suffered from the “self-sufficiency-
oriented, insular development strategy of India since 1950” (Saxenian 2000). The impact on the IT sector was mainly felt through high tariffs and limits on foreign exchange allocations under the Foreign Exchange and Regulation Act (FERA), which limited imports of computer hardware. Dehejia and Panagariya (2011) report evidence consistent with this hypothesis.
Some commentators argue that since the major policy initiatives of the post-liberalization period were concentrated in the industrial sector, industry should have responded most vigorously.15 In fact, however, there were also a large number of post-1991 policy changes that fostered the growth of services. These aimed at easing entry, simplifying the rules of the game, and enhancing competition. The first such announcements in 1984 and 1986 under Prime Minister Rajiv Gandhi marked a turning point in the policy environment for the software and IT 12 NASSCOM Strategic Review (2011) reports that the total spending worldwide on technology products and related services is expected to grow at 4 percent in 2010, while global sourcing is expected to increase at a somewhat higher rate (e.g. in 2010 the market for IT outsourcing is expected to increase by 2.4 percent but global sourcing by 10.4 percent in 2010). 13 See Krueger (2005), comments in India Policy Forum. 14 Permission that is often difficult to get. 15 This section draws on Saxenian (2000), Srinivasan (2005), Kapur (2002), Arnold et al (2010), budget speeches and economic surveys for various years .
16
industries. The Computer Policy Announcement of November 1984 recognized software as an industry, extending it the same investment incentives available to manufacturing. It also lowered import tariffs on software and personal computers. This also made it easier to access foreign exchange for purchasing imported inputs by allowing the use of a larger percent of software export earnings. It eased entry by allowing private companies, including foreign-owned companies, to produce high-performance computers, which only state-owned companies were previously allowed to do. These reforms were then elaborated by the Computer Software, Development and Training Policy of 1986, which further liberalized imports of software and allowed for wholly foreign owned software companies.16
Software import policy then changed with the 1988-89 budget, which permitted inputs
imported under the software export policy to pay lower duty. In 1988 software firms exporting more than Rs. 100 million ( US$ 7.1 million) were allowed to pay off export obligations in any manner they chose, a provision that was extended also to small firms in 1993. In the 1991 reforms, foreign investment in Indian software and electronics industry was further eased: up to 51 per cent of total capital was permitted to enter under the automatic route.17 The five-year export-import policy of 1992 then allowed the free export and import of all products except those on the negative list.
While IT firms were permitted to operate from export processing zones (EPZs) as early as
late 1970s, an entirely-software-services-focused EPZ, the first of a series of Software Technology Parks (STPIs), was started only in 1986. Firms operating in STPIs were allowed to import computer hardware free of duty, received tax exemptions, and enjoyed high-speed satellite links and reliable electric power.18 The first STPI was established in Bangalore, subsequent ones in Pune and Bhubaneswar. In 1992, the government permitted the construction of private STPIs anywhere in the country. By 1995, about 400 companies were recognized as companies situated in STPIs, and by 2008-09, 8,455 units were registered as operating units in STPI’s, of which 7,214 were registered as exporting units.
Services have historically been taxed lightly. Despite accounting for close to 60 percent
of GDP, service taxes amount to only 1 percent of GDP, less than 10 percent of indirect taxes and about 6 percent of total tax revenue in recent years. The corresponding percentages were even smaller in the early post liberalization period, when the services growth took off. Service tax was introduced in 1994, with the taxation of three service subsectors at the outset (telephone bills, premium charges on non life insurance, and on commission charged by brokers on security market transactions), at a rate of 5 percent. The number of services subject to tax has increased over time; currently 120 plus services are taxed. The government is now moving away from a “positive” list of services to be taxed to a negative list of services which would be exempt. It is expected to bring a large segment of services under the tax purview.
16 Subject to their being 100 per cent export oriented. 17 Subject to the value of investment exceeding the value of capital goods imported. 18 There were also flexible rules on the repatriation of capital investment, royalties and dividends for the foreign firms operating in STPIs.
17
Figure 10: Service tax and Indirect Taxes as percent of GDP
Source: Central Board of Excise and Customs, Department of Revenue, Ministry of Finance.
Deregulation of banking and financial services has also been important for the growth of output and employment. The Indian banking sector is predominantly owned by the government. After the independence in 1947, public ownership of banks was increased in three stages, resulting ultimately in full nationalization of the largest banks. By 1982 private and foreign banks accounted for less than 10 percent of the assets of the banking system. The Indian banking sector was also heavily regulated until the early 1990s. In addition to high entry barriers, interest rates were regulated, and there were regulations on asset allocation via a minimum cash reserve requirement which required the banks to hold cash and other liquid assets, and the Statutory Liquidity requirement, which required them to hold safe, liquid assets, mostly government securities.19 Liberalization began in 1991. Reforms included the removal of controls on interest rates, reductions in reserve and liquidity ratios, entry deregulation, relaxation of credit controls, and the introduction of an inter-bank money market as well as auction-based repos and reverse repos.20
Using data from Abiad, Detragiache and Tressel (2010), one can compare financial liberalization in India and other countries (Figure 11).21 Their index shows that while the Indian financial sector was quite repressed until the late 1980s, subsequent convergence in regulatory
19 See Gupta, Kochhar and Panth (2011) for details. 20 Significant reforms were also enacted in the government securities market (introduction of primary dealers, delivery versus payment settlement, floating rate bonds, interest rate derivatives etc); and the foreign exchange market (convertibility for current account transactions, gradual opening up of capital account, currency swap market, foreign currency accounts). Other reforms tackled important aspects of the stock market, insurance sector, and non-bank financial entities. 21 Abiad et al, using the data for 91 economies in 1973–2005, record financial policy changes along the following seven dimensions: credit controls and reserve requirements, interest rate controls, entry barriers and state ownership, policies on securities markets, banking regulations, and restrictions on capital account, and aggregate these in a composite index of financial liberalization for each country, which they normalize between zero and one.
0
2
4
6
8
10
1219
94-9
5
1995
-96
1996
-97
1997
-98
1998
-99
1999
-00
2000
-01
2001
-02
2002
-03
2003
-04
2004
-05
2005
-06
2006
-07
2007
-08
2008
-09
2009
-10
2010
-11
Service Tax (%of GDP) Indirect Tax(% of GDP)
18
practice was quite rapid. By the late 1990s the gap between India and the average of all countries, and in particular emerging Asia, had narrowed substantially.
Figure 11: Financial Liberalization in India
Source: Gupta, Kochhar and Panth (2011).
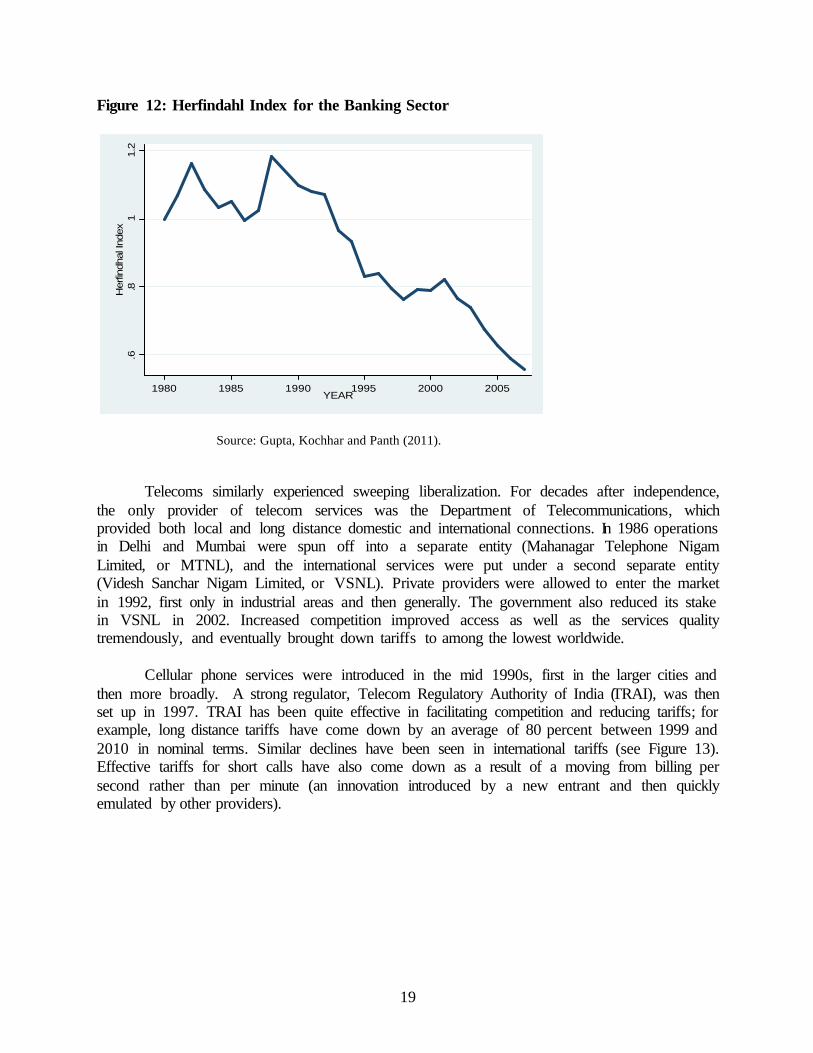
With liberalization, more liberal entry of private and foreign banks was allowed. The share of private banks in banking sector assets consequently increased from 3.5 percent in 1991 to about 20 percent in 2010. Concentration has meanwhile declined; Figure 12, which presents the Herfindhal Index based on the shares in assets for all banks (including foreign banks), shows a sharp decline in concentration since the early 1990s, with a second decline starting in the early 2000s. Increased competition and other liberalization measures improved banks’ efficiency as well. As has been documented elsewhere, all Indian banks including the public sector banks made remarkable progress in improving profitability, see Gupta et al (2011) for evidence on this.
0
0.2
0.4
0.6
0.8
1973 1977 1981 1985 1989 1993 1997 2001 2005
Financial Reform Index (Normalized)
India EM_Asia World
19
Figure 12: Herfindahl Index for the Banking Sector
Source: Gupta, Kochhar and Panth (2011).
Telecoms similarly experienced sweeping liberalization. For decades after independence,
the only provider of telecom services was the Department of Telecommunications, which provided both local and long distance domestic and international connections. In 1986 operations in Delhi and Mumbai were spun off into a separate entity (Mahanagar Telephone Nigam Limited, or MTNL), and the international services were put under a second separate entity (Videsh Sanchar Nigam Limited, or VSNL). Private providers were allowed to enter the market in 1992, first only in industrial areas and then generally. The government also reduced its stake in VSNL in 2002. Increased competition improved access as well as the services quality tremendously, and eventually brought down tariffs to among the lowest worldwide.
Cellular phone services were introduced in the mid 1990s, first in the larger cities and
then more broadly. A strong regulator, Telecom Regulatory Authority of India (TRAI), was then set up in 1997. TRAI has been quite effective in facilitating competition and reducing tariffs; for example, long distance tariffs have come down by an average of 80 percent between 1999 and 2010 in nominal terms. Similar declines have been seen in international tariffs (see Figure 13). Effective tariffs for short calls have also come down as a result of a moving from billing per second rather than per minute (an innovation introduced by a new entrant and then quickly emulated by other providers).
.6.8
11.
2H
erfin
dhal
Inde
x
1980 1985 1990 1995 2000 2005YEAR
20
Figure 13: Average Tariff for Outgoing Call on Cellular Phone Services (in Indian Rupees)
Source: TRAI Annual Report 2009-10.
The subscriber base of telecom services, in particular that of cellular services, has
increased exponentially (Figure 14). Starting from a zero base in the mid 1990s, the number of subscriptions has now risen to more than 800 million, an average annual growth of 58 percent between 2005-06 and 2010-11.22
Figure 14: Subscriptions for Cellular Phone Services
Source: TRAI Annual Report 2009-10.
22 Two other services which have been liberalized through easing up of the entry barriers are air transport and insurance services. See Arnold et al (2010) for details.
0
4
8
12
16
20M
ar-9
9
Mar
-00
Mar
-01
Mar
-02
Mar
-03
Mar
-04
Mar
-05
Mar
-06
Mar
-07
Mar
-08
Mar
-09
Mar
-10
Mar
-11
Jun-
11
Sep-
11
Average Outgo per Outgoing minute (Rs.)
010
20
30
40
5060
70
1999
-00
2000
-01
2001
-02
2002
-03
2003
-04
2004
-05
2005
-06
2006
-07
2007
-08
2008
-09
2009
-10
2010
-11
Mobiles subcriptions (% of total population)
21
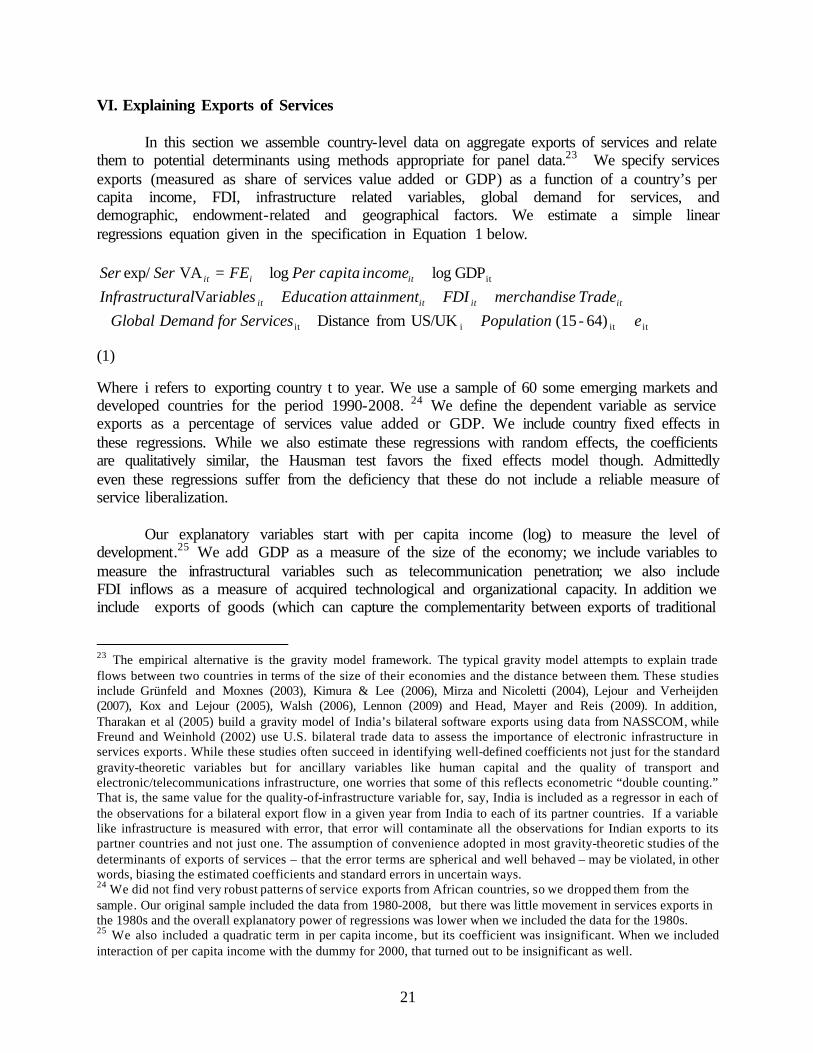
VI. Explaining Exports of Services In this section we assemble country-level data on aggregate exports of services and relate
them to potential determinants using methods appropriate for panel data.23 We specify services exports (measured as share of services value added or GDP) as a function of a country’s per capita income, FDI, infrastructure related variables, global demand for services, and demographic, endowment-related and geographical factors. We estimate a simple linear regressions equation given in the specification in Equation 1 below.
itit iit
it
64)-(15 US/UKfrom Distance Var
GDP log logVA exp/
ε+++++++
+++=
Population ServicesDemand forGlobalTradeemerchandisFDIattainmentEducationiablesturalInfrastruc
incomecapitaPerFESerSer
itititit
itiit
(1)
Where i refers to exporting country t to year. We use a sample of 60 some emerging markets and developed countries for the period 1990-2008. 24 We define the dependent variable as service exports as a percentage of services value added or GDP. We include country fixed effects in these regressions. While we also estimate these regressions with random effects, the coefficients are qualitatively similar, the Hausman test favors the fixed effects model though. Admittedly even these regressions suffer from the deficiency that these do not include a reliable measure of service liberalization.
Our explanatory variables start with per capita income (log) to measure the level of development.25 We add GDP as a measure of the size of the economy; we include variables to measure the infrastructural variables such as telecommunication penetration; we also include FDI inflows as a measure of acquired technological and organizational capacity. In addition we include exports of goods (which can capture the complementarity between exports of traditional
23 The empirical alternative is the gravity model framework. The typical gravity model attempts to explain trade flows between two countries in terms of the size of their economies and the distance between them. These studies include Grünfeld and Moxnes (2003), Kimura & Lee (2006), Mirza and Nicoletti (2004), Lejour and Verheijden (2007), Kox and Lejour (2005), Walsh (2006), Lennon (2009) and Head, Mayer and Reis (2009). In addition, Tharakan et al (2005) build a gravity model of India’s bilateral software exports using data from NASSCOM, while Freund and Weinhold (2002) use U.S. bilateral trade data to assess the importance of electronic infrastructure in services exports. While these studies often succeed in identifying well-defined coefficients not just for the standard gravity-theoretic variables but for ancillary variables like human capital and the quality of transport and electronic/telecommunications infrastructure, one worries that some of this reflects econometric “double counting.” That is, the same value for the quality-of-infrastructure variable for, say, India is included as a regressor in each of the observations for a bilateral export flow in a given year from India to each of its partner countries. If a variable like infrastructure is measured with error, that error will contaminate all the observations for Indian exports to its partner countries and not just one. The assumption of convenience adopted in most gravity-theoretic studies of the determinants of exports of services – that the error terms are spherical and well behaved – may be violated, in other words, biasing the estimated coefficients and standard errors in uncertain ways. 24 We did not find very robust patterns of service exports from African countries, so we dropped them from the sample. Our original sample included the data from 1980-2008, but there was little movement in services exports in the 1980s and the overall explanatory power of regressions was lower when we included the data for the 1980s. 25 We also included a quadratic term in per capita income, but its coefficient was insignificant. When we included interaction of per capita income with the dummy for 2000, that turned out to be insignificant as well.
22
services, as well as the network effects, the rationale being that a country which has a high penetration in goods markets is likely to be able to use its networks to export its services). Alternatively, in place of merchandise exports from each country we consider instead merchandise imports or total merchandise trade. We include exports of services worldwide as a percentage of world GDP to account for the global demand (and supply) of tradable services.26 While it controls for the world wide trend in the exports of services, it also means that we cannot include year fixed effects in the regressions. Nevertheless we estimate certain specifications by including year fixed effects and dropping the world trend in services and find that the results for the other variables are robust.
Most of these variables are downloaded from the World Development Indicators data
base of the World Bank. More details on summary statistics and correlations of these variables are provided in the data appendix B.
Column 1 of Table 4 starts with per capita income and GDP. We then add additional variables, one at a time, in subsequent columns. Country size enters with a significant negative coefficient throughout; evidently, larger economies export a smaller share of services value added. FDI inflows are positively and significantly associated with exports of services. An economy that exports more goods also exports more services, due perhaps to network effects and the fact that the exports of traditional services are linked closely with and arise due to the export of goods (though this effect appears to have weakened over time). A similarly large effect is obtained if we replace exports of goods with import of goods or total trade in goods (all variables calculated as percent of GDP). The telecommunication penetration rate is positively and significantly associated with exports of services. Exports are higher when the global demand for services exports is high. In the last column we include the dummy for India interacted with a time trend. The coefficient is positive and significant, showing that the growth of services exports from India has been more rapid than that of the other countries, after controlling for the income levels and size of the countries, as well as the factors which are typically thought to be associated positively with growth of services exports. 26 Most of the data used are from the WDI, and the per capita income is measured in constant PPP USD. For some of these variables there are more than one proxy available, which are unsurprisingly highly correlated with each other. In such cases we use the one for which data availability is better. We also include level of educational attainment; proficiency in English language as additional variables. For some of the variables, such as those related to education outcomes, the time series available is short and patchy. Thus we also estimate specifications similar to those in equation 1 using only the cross sectional data. In these cross sectional regressions we also include geographical variables such as the distance from the major financial centers, and composition of population.
23
Table 4. Explaining Service Exports/Service Value Added (Panel Data) (1) (2) (3) (4) (5) (6) Dummy for 2000s 1.08*** 0.96*** 0.4 0.27 0.22 0.19 [3.55] [3.17] [1.26] [0.85] [0.67] [0.6] Log Per Capita Income (constant PPP USD)
[5.13] [4.72] [5.30] [5.41] [5.57] [5.78] Log GDP in PPP USD -9.30*** -8.74*** -14.4*** -14.9*** -15.9*** -17.8*** [-3.81] [-3.44] [-4.61] [-5.00] [-5.27] [5.83] Foreign Direct Investment net inflows (% of GDP)
0.08*** 0.07** 0.06* 0.05* 0.05*
[3.18] [2.28] [1.94] [1.78] [1.78] World Demand for services (Services Exports/GDP)
1.74*** 1.50*** 1.57*** 1.81***
[4.40] [3.58] [3.77] [4.3] Goods exports/GDP 0.09*** 0.08*** 0.09*** [2.69] [2.67] [2.91] Telephone lines (per 100 people) 0.04* 0.06** [1.66] [2.2] India dummy*Time Trend 0.71*** [6.28] country fixed effects Yes yes yes yes yes yes year fixed effects No no no no no no observations 980 963 963 963 963 963 adjusted R squared 0.88 0.88 0.88 0.89 0.89 0.90 number of countries 61 61 61 61 61 61 Notes: Robust t statistics are given in parentheses. *, **, *** indicate the coefficient is significant at 10, 5, and 1 percent levels respectively. Source: see text .
As robustness checks we add lagged values of the right hand side variables, substitute population for aggregate GDP, and add the age structure of the population and share urbanized. None of these additional variables has a significant coefficient, and none of these changes alters the previous results.
Data for some variables, such as education, physical infrastructure and internet or
broadband width, are available only since 2000. When we include these limited values in the panel regressions their coefficients are insignificant. But since some of these variables move
24
slowly over time, it might be more appropriate to include them in cross sectional regressions. Therefore we estimate the same regressions using cross section data for 2000 and 2005.27
The results are in Tables 5 and 6. As before, size, FDI inflows, merchandise exports and telephone penetration all appear to be significant determinants of service exports. But even after controlling for these variables, the dummy variable for India remains positive and significant, implying that these factors together cannot fully explain the extent of the country’s service-sector exports.28 Interestingly, when we include the age structure of the population, we now find that a younger population is associated with more exports of services, perhaps due to a lower wage and cost advantage and perhaps also because domestic demand (for, inter alia, health-care) is less.
Since per capita income is correlated with some of these variables, in columns 4 we drop it from the specification. We include variables related to education attainment; distance from U.S. or UK, the major trade and financial centers; and internet penetration. In the robustness tests we also include alternative proxies for penetration of telecommunication and internet technology.
Table 5: Explaining Service Exports/Service Value Added (Cross Section for 2000)
Variables (1) (2) (3) (4) (5) (6) Log Per Capita Income (constant PPP USD) -0.58 -0.07 0.21 -1.05 -0.53 [-0.31] [-0.04] [0.09] [-0.55] [-0.28] Log GDP in PPP USD -3.1*** -2.4*** -3.4*** -3.4*** -3.2*** -3.0*** [-4.29] [-3.97] [-4.19] [-4.35] [-4.59] [-3.93] Foreign Direct Investment net inflows (% of GDP) 0.13*** 0.08** 0.13*** 0.13*** 0.16*** 0.11*** [3.70] [2.24] [3.59] [3.65] [4.25] [2.74] Goods exports/GDP 0.17*** 0.18*** 0.18*** 0.18*** 0.15** 0.18*** [3.02] [3.79] [2.87] [3.03] [2.49] [2.82] Telephone lines (per 100 people) 0.21** 0.26** 0.26*** 0.17** 0.17* [2.39] [2.36] [2.80] [2.03] [1.84] India Dummy 7.24** 6.71*** 7.47** 7.28*** 6.89** 7.27** [2.58] [2.72] [2.43] [3.12] [2.56] [2.46] International Internet Bandwidth (bits per person), Log 1.41* [1.95] School Enrollment, tertiary(% of gross) -0.1 -0.09 [-1.17] [-1.22] Population ages 15-64 (% of total) 0.45* [1.95] Distance from UK/US, in log -1.28
27 Considering two cross sections also allows us to see if there have been any changes in the relationship overtime between service exports and these additional variables. Since global demand for services does not vary across countries we cannot include it here. 28 Among other variations we include population as a proxy for size, and as before its coefficient is significant similar to the one obtained for GDP.
25
[-1.65]
Observations 60 57 51 51 60 58
R-squared 0.56 0.61 0.62 0.62 0.58 0.56 Robust t statistics are given in parentheses. *, **, *** indicate that the coefficients are significant at 10, 5, and 1 percent level respectively.
26
Next we estimate similar regression for 2005. Tthe effects of FDI and
telecommunications infrastructure are much larger than in 2000. The dummy variable for India also has a larger coefficient in 2005. In contrast, the coefficient of trade is similar in the two years, and the effect of size is smaller in 2005
In sum, cross-section and panel regressions point to the importance in explaining service
exports a range of variables: per capita income (as a measure of economic development), telephone connections (as a measure of infrastructure development), inward FDI (as a measure of access to foreign technology), and merchandise exports (as a measure of spillovers between different classes of exports). Importantly, these explanatory variables, in any combination do not wipe out the significance of the dummy variable for India. India is a significant outlier by any measure, even more as the period proceeds. Table 6: Explaining Service Exports/Service Value Added (Cross Section for 2005) (1) (2) (3) (4) (5) (6) Log Per Capita Income (constant PPP USD) -2.29 0.35 -1.9 -2.53 -2.3 [-1.03] [0.09] [-0.62] [-1.10] [-0.95] Log GDP in PPP USD -2.56*** -2.34*** -3.06*** -3.21*** -2.62*** -2.59*** [-3.42] [-3.11] [-2.95] [-3.30] [-3.41] [-3.34] Foreign Direct Investment net inflows (% of GDP)
0.54** 0.48* 0.43* 0.40* 0.54** 0.54**
[2.45] [1.98] [1.77] [1.72] [2.38] [2.38] Goods exports/GDP 0.16* 0.15* 0.16* 0.15* 0.15* 0.16* [1.99] [1.76] [2.02] [1.87] [1.70] [1.96] Telephone lines (per 100 people) 0.29** 0.30* 0.24 0.28** 0.29** [2.28] [1.94] [1.55] [2.17] [2.14] India Dummy 11.91*** 11.49*** 10.99*** 11.78*** 11.86*** 11.98*** [3.83] [3.21] [3.02] [3.88] [3.74] [3.26] International Internet Bandwidth (bits per person), Log 1.05 [0.78] School Enrollment, tertiary(% of gross) -0.04 -0.06 [-0.37] [-0.68] Population ages 15-64 (% of total) 0.24 [0.94] Distance from UK/US, in log -0.02 [-0.01]
Observations 55 51 48 48 55 53
R-squared 0.49 0.43 0.53 0.52 0.49 0.47 Robust t statistics are given in parentheses. *, **, *** indicate that the coefficients are significant at 10, 5, and 1 percent level respectively.
27
VII. Conclusion
In this paper we surveyed India’s experience with exporting services. The paper also reviews the empirical literature; takes a close look at the Indian service sector and specifically information-technology-related (IT) services, seeking to situate the growth in service exports from India in its comparative context; and documents the role that exports of services have played in the performance of the Indian economy in recent years. We discuss the country’s major policy initiatives, such as trade reforms and liberalization of domestic industrial and service sectors, and their importance for jump-starting the process of services growth and its exports. Regression results show that, in addition to these, policies other factors such as overall economic development, communications infrastructure, access to foreign technology, and spillovers between the merchandise and service exports were important as well.
But India cannot take the growth of services exports for granted. The growth of service exports globally and from India specifically slowed in the recent global crisis, suggesting that service exports remain vulnerable to fluctuations in global demand. In addition, service exports from India are disproportionately destined for the two largest English speaking countries, the United States and United Kingdom, which renders Indian exports vulnerable to demand conditions as well as trade policies in these countries. Indian exporters have not been able to penetrate the market in non-English speaking countries, further limiting market potential.
Finally, and as emphasized in the paper, trade liberalization as well the liberalization of
the domestic space in industry and services has been instrumental in unleashing high growth in services value added and the exports of services; the slowing of liberalization in the last few years does not have reassuring implications for future growth.
28
References Abiad Abdul, Enrica Detragiache, Thierry Tressel, 2010. "A New Database of Financial Reforms," IMF Staff Papers, Palgrave Macmillan Journals, vol. 57(2), pages 281-302.
Arnold Jens, Beata Javorcik, Molly Lipscomb and Aaditya Mattoo, 2010, Services Reform and Manufacturing Performance: Evidence from India. Anderson, J. (1979), “A theoretical foundation for the gravity model,” The American Economic Review, Vol. 69 (1), 106-116. Bergstrand, J. (1989), “The generalized gravity equation, monopolistic competition, and factor proportions theory in international trade,” The Review of Economics and Statistics, Vol. 71 (1), 143-153. Bergstrand, J. (1985), “The gravity equation in international trade: Some microeconomic evidence and empirical evidence,” The Review of Economics and Statistics, Vol. 67 (3), 474-481. Das, Satya P. and A. Saha, (2011), “Trade in Goods and Services and Economic Growth”, Indian Statistical Institute. Dehejia, Rajiv and Arvind Panagariya (2011)., “Services Growth in India: A Look Inside the Black Box,” Columbia–NCAER Conference on Trade, Poverty, Inequality and Democracy. Eichengreen, Barry and Poonam Gupta, (2011)., “The Service Sector as India’s Road to Economic Growth,” NBER Working Papers 16757, National Bureau of Economic Research, Inc. Eichengreen, Barry and Poonam Gupta, (2009)., “The Two Waves of Service Sector Growth,” NBER Working Papers 14968, National Bureau of Economic Research, Inc. Freund, C. and D. Weinhold (2002), “The internet and international trade in services,” The American Economic Review, Vol. 92 (2), 236-240. Gupta, Poonam, Sanjay Panth and Kalpana Kochhar, (2011)., “Bank Ownership and the Effects of Financial Liberalisation: Evidence from India,” IMF Working Papers 11/50, International Monetary Fund Grünfeld, L.A. and A. Moxnes (2003), “The intangible globalisation: Explaining the patterns of international trade in services,” Working Paper 657, Norwegian Institute of International Affairs. Harrigan, James. 2002. ‘Specialization and the Volume of Trade: Do the Data Obey the Laws,’ NBER Working Paper 8675, December 2001, Also in Kwan Choi and James Harrigan eds., The Handbook of International Trade, London: Basil Blackwell.
29
Head, K., T.Mayer and J. Ries (2009), “How remote is the offshoring threat?,” European Economic Review, Vol. 53 (4), 429-444. Jensen, B. J., and Kletzer, L. G. (2005), “Tradable Services: Understanding the Scope and Impact of Services Outsourcing”, Brookings Trade Forum, 75-116. Kapur, Devesh. 2002. "The causes and consequences of India's IT boom", India Review, 1(2), pp. 91 – 110 Kimura, F. and H.-H. Lee (2006), “The gravity equation in international trade in services,” Review of World Economics, Vol. 142 (1), 92-121. Kox, H. and Lejour, A. 2005. ‘Regulatory Heterogeneity as Obstacle for International Services Trade,’ CPB Discussion Paper, No. 49. Lejour, A. and J.-W. De Paiva-Verheijden (2007), “The tradability of services within Canada and the European Union,” The Service Industries Journal, Vol. 27 (4), 389-409. Lennon, C. (2009), “Trade in services and trade in goods: Differences and complementarities,” WIIW Working Papers 53, Vienna Institute for International Economic Studies. Mattoo, Aaditya, Randeep Rathindran, Arvind Subramanian, 2006, Measuring Services Trade Liberalization and its Impact on Economic Growth: An illustration, Journal of Economic Integration, Vol. 21, No. 1, 64-98 Mirza, D. and G. Nicoletti (2004), “What is so special about trade in services?,” GEP Research Paper 2004/02, Leverhulme Centre for Research on Globalization and Economic Policy. NASSCOM, (2011), Strategic Review. Saxenian, AnnaLee (2000)., “Bangalore: The Silicon Valley of Asia?,” Conference on Indian Economic Prospects: Advancing Policy Reform, Center for Research on Economic Development and Policy Reform, Stanford, May 2000. Srinivasan, T. N. (2005) "Information-Technology-Enabled Services and India’s Growth Prospects,” Brookings Trade Forum Tharakan, P.K.M., I. Van Beveren and T. Van Ourti (2005), “Determinants of India’s software exports and goods exports,” The Review of Economics and Statistics, Vol. 87 (4), 776-780 Walsh, Keith, 2006. “Trade in Services: Does Gravity Hold? A Gravity Model Approach to Estimating Barriers to Services Trade,” IIIS Discussion Paper, No. 183, October 2006. World Bank (2011), “World Development Indicator Database.” Washington, D.C.: The World Bank.
30
World Bank (2012), “Exporting Services: A Developing Country Perspective”, Washington, D.C.: The World Bank. . Appendix A: Chronology of Reforms in the Services Sector 1984-85 Computer policy announced which declared software development as an industry,
entitling it to the same privileges as available to manufacturing. It lowered import tariff on computers and software and eased availability of exchange rate and eased entry of new players.
1986-87 Computer software development and training policy announced which further liberalized imports of computer inputs, and liberalized entry in the sector. It also allowed for the setting up of Software Technology Parks of India (STPIs).
1988-89 The foreign exchange constraints relaxed for exporters of software under the software export policy.
1991-92 The measures announced earlier continued via easier entry in the sector, relaxed foreign exchange constraint and access to foreign exchange.
1992-93 STPIs (and other EPZs) were allowed to convert their foreign exchange earnings at market rates.
1993-94 Communication: the first private operators come up. Air transport: The new Air Corporation Act 1994 enabled entry in domestic air services, thus abolishing the state monopoly of more than four decades. Banking: The rules for establishing new private sector banks were introduced, with the publication of the RBI guidelines on this issue.
1994-95 New telecom policy announced, FDI rules relaxed, private cellular service providers emerge and the numbers increase. Nine new private banks (Bank of Punjab Ltd, Centurion Bank Ltd, Global Trust Bank, HDFC Bank, ICICI Bank, IDBI Bank, Indusland Bank Ltd, UTI Bank Ltd, and Times Bank Ltd) were founded between 1994 and 1996. STPIs (as well as other EPZs) allowed to retain foreign exchange from export earnings more flexibly.
1995-1996 The government decides to set up a statutory Telecom Regulatory Authority of India (TRAI).
1996-1997 Import duty reduced on imports of computers, parts of telecommunication equipment (handsets and cellular phones).
1997-1998 Air transport: FDI upto 40 percent allowed in the air transport. A flexible policy for the provision of internet services announced allowing for no license fee for five years and a nominal fee thereafter. Further import tariff reduction on imports of computer parts, telecommunication equipment. Extended the tax holiday for units in STPIs.
1998-1999 New Telecom Policy announced allowing for multiple fixed service operators and opens domestic long distance services to private operators.
1999-2000 New telecom policy issued laying out the road map of a complete opening of national and international long distance market. Banking: New foreign banks entered the market and existing foreign banks were allowed to open additional branches. In the period from 1990 to 2001, the number of foreign banks increased from 21 to 42. During the past ten years, foreign banks acquired 51 additional offices, bringing up the total number of their branches from 151 in 1992 to 202 in 2001.
31
2000-2001 Further reduction on computers, parts, and telecom equipments. 100 percent FDI permitted in many services such as courier, hotel and tourism.
2001-2002 Further reduction in import tariff to 15 percent on IT and telecommunication products under the Information technology Agreement (ITA) schedule.
2002-03 Communication: national long distance markets opened with no restrictions on the number of operators
2004-05 Air transport: competition increases with private airlines permitted to serve on international routes
2005-2006 Import duty required to be brought down to zero on 217 ITA bound items.
In addition, as documented in Gupta et al (2011) there were several measures aimed at liberalizing the interest rates setting up mechanism by the banks (resulting in lowering of interest rates), reduction in required cash and liquidity ration (which resulted in banks determining their asset portfolio more flexibly and enhancing their competiveness and efficiency) between mid 1990s-early 2000s.
32
Appendix B: Summary Statistics and Correlation Coefficients
Table B1: Summary Statistics of the Variables used in Regression Table 4
Number of
observations Mean Min Max
Services exports/services value added 980 13.36 0.92 48.71 Log Per Capita Income PPP USD 1063 9.22 6.52 10.81 Log GDP in PPP USD 1062 25.47 22.36 30.08 Foreign Direct Investment net inflows (% of GDP) 1003 3.04 0.00 92.67 Goods exports/GDP 1034 26.74 4.10 106.25 World Demand for services (Services Exports/GDP) 1064 4.93 3.96 6.40 Telephone lines (per 100 people) 1055 27.79 0.19 74.46 Table B2: Correlations between Variables used in Regression Table 4
Services
Exports Per Capita Income
GDP FDI Goods Exports
World Services Exports
Log Per Capita Income 0.09 1 Log GDP in PPP USD -0.36 0.53 1 Foreign Direct Investment 0.28 0.15 -0.05 1 Goods exports/GDP 0.50 0.18 -0.20 0.35 1 World Services Exports 0.16 0.14 0.06 0.21 0.27 1 Telephone lines 0.08 0.91 0.55 0.13 0.11 0.09
Note: All correlation coefficients are significant at least at 1 percent level of significance. Table B 3: Summary Statistics of the Variables used in Regression Table 5
Number of observations
Mean Min Max
Services exports/services value added 55 15.42 2.63 40.04 Log Per Capita Income in PPP USD 59 9.35 6.97 10.76 Log GDP in PPP USD 59 25.54 22.81 30.02 population between age 15-64 59 65.51 52.60 71.60 Foreign Direct Investment (% of GDP) 59 4.10 0.07 26.76 Goods exports/GDP 58 32.26 7.14 102.79 Minimum distance from US/UK 57 7.96 5.77 9.55 Tertiary School Enrollment 51 49.38 4.47 91.87 Internet bandwidth, bits per person, log 55 5.91 -0.94 10.46 Telephone lines (per 100 people) 59 29.56 0.70 66.43
33
Table B 4: Correlations between Variables used in Regression Table 5
Services exports
Per capita income
GDP population b/w 15-64
FDI Goods exports
Minimum distance
Tertiary Enrollment
internet bandwidth
Per Capita Income 0.13 1 GDP -0.40 0.45 1 Population b/w age 15-64