City of Traverse City Eighth Street Public Opinion Survey Results, October 2015 Page 1 City of Traverse City Public Opinion Survey Regarding Eighth Street Restriping Pilot Project October 2015 Executive Summary Purpose and Methodology The City of Traverse City hired Parallel Solutions LLC to conduct an online survey to help assess the public’s perceptions and opinions regarding a pilot project that included restriping Eighth Street from a fourlane street to a threelane street with two travel lanes, a center turn lane, and bike lanes between Lake Street and Woodmere Avenue. The City’s Planning and Engineering departments helped to identify survey questions. The City also reached out to several business owners along Eighth Street to ask for their feedback on draft survey questions. Feedback from city staff and from these individuals was incorporated into the survey questions. City staff also selected and provided the images that were used in the visual preference survey question. The survey consisted of 12 questions. Some questions provided space for openended comments. The City released the survey on September 11, 2015. Local media outlets promoted the survey and the link. The City also promoted and provided the link via its own social media outreach. The deadline for the public to participate in the survey was 12:00 p.m. on September 25, 2015. This report shares some highlights of some public opinions shared in the survey. City staff has the raw survey data and may conduct additional analysis to help inform decisionmaking. The City is also gathering and analyzing quantitative data such as vehicle counts, traffic speed, and crash data as part of its assessment of the Eighth Street restriping pilot project. Participation and Results There were 2,388 responses to the survey. Of that total: • 712 (29.8%) indicated they lived in a downtown Traverse City neighborhood • 203 (8.5%) indicated they lived, worked, or owned a business on Eighth Street • 2,080 (87.1%) indicated they drive the street more than once daily, once a day, or a few times a week • 227 (9.5%) indicated they bike the street more than once daily, once a day, or a few times a week • 183 (7.7%) indicated that they walk/use the sidewalk along the street more than once daily, once a day, or a few times a week • 1,590 (66.5%) indicated they use Eighth Street to pass through the downtown area to get to destinations located outside of the downtown area • 648 (27.1%) provided a Traverse City address when completing the survey (Note: Respondents were not required to supply an address as a condition of completing the survey.)
Transcript
City of Traverse City Eighth Street Public Opinion Survey Results, October 2015
Page 1
City of Traverse City Public Opinion Survey Regarding Eighth Street Restriping Pilot Project
October 2015
Executive Summary
Purpose and Methodology The City of Traverse City hired Parallel Solutions LLC to conduct an online survey to help assess the public’s perceptions and opinions regarding a pilot project that included restriping Eighth Street from a four-‐lane street to a three-‐lane street with two travel lanes, a center turn lane, and bike lanes between Lake Street and Woodmere Avenue. The City’s Planning and Engineering departments helped to identify survey questions. The City also reached out to several business owners along Eighth Street to ask for their feedback on draft survey questions. Feedback from city staff and from these individuals was incorporated into the survey questions. City staff also selected and provided the images that were used in the visual preference survey question. The survey consisted of 12 questions. Some questions provided space for open-‐ended comments. The City released the survey on September 11, 2015. Local media outlets promoted the survey and the link. The City also promoted and provided the link via its own social media outreach. The deadline for the public to participate in the survey was 12:00 p.m. on September 25, 2015. This report shares some highlights of some public opinions shared in the survey. City staff has the raw survey data and may conduct additional analysis to help inform decision-‐making. The City is also gathering and analyzing quantitative data such as vehicle counts, traffic speed, and crash data as part of its assessment of the Eighth Street restriping pilot project.
Participation and Results There were 2,388 responses to the survey. Of that total:
• 712 (29.8%) indicated they lived in a downtown Traverse City neighborhood
• 203 (8.5%) indicated they lived, worked, or owned a business on Eighth Street
• 2,080 (87.1%) indicated they drive the street more than once daily, once a day, or a few times a week
• 227 (9.5%) indicated they bike the street more than once daily, once a day, or a few times a week
• 183 (7.7%) indicated that they walk/use the sidewalk along the street more than once daily, once a day, or a few times a week
• 1,590 (66.5%) indicated they use Eighth Street to pass through the downtown area to get to destinations
located outside of the downtown area
• 648 (27.1%) provided a Traverse City address when completing the survey (Note: Respondents were not required to supply an address as a condition of completing the survey.)
City of Traverse City Eighth Street Public Opinion Survey Results, October 2015
Page 2
Perceptions Related to Users’ Experiences and Satisfaction Levels Survey participants were asked to rate their experiences and also to report on their levels of satisfaction related to driving, biking, and walking uses before and after the restriping.
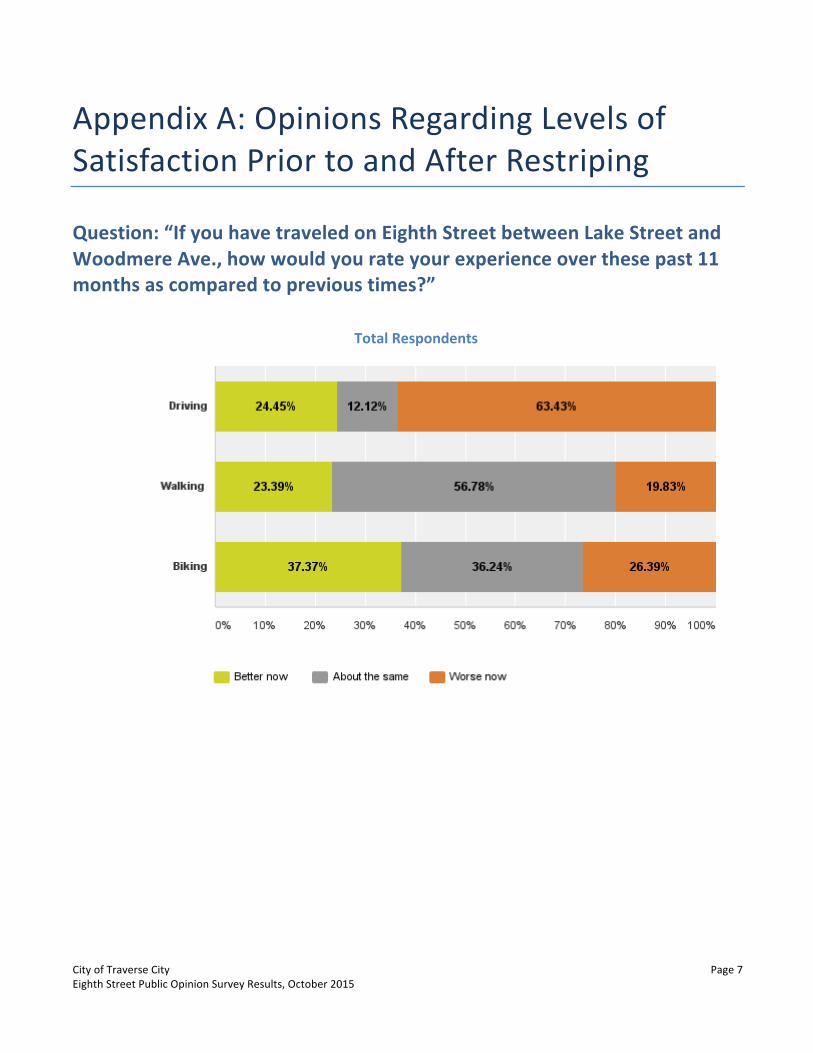
Experience Ratings Survey participants were asked: “If you have traveled on Eighth Street between Lake Street and Woodmere Ave., how would you rate your experience over these past 11 months as compared to previous times?” There were three response choices: better now, about the same, and worse now. Some response highlights:
• 63.43% of total respondents reported that the street was “worse now” for driving; 24.45% rated it as “better now”
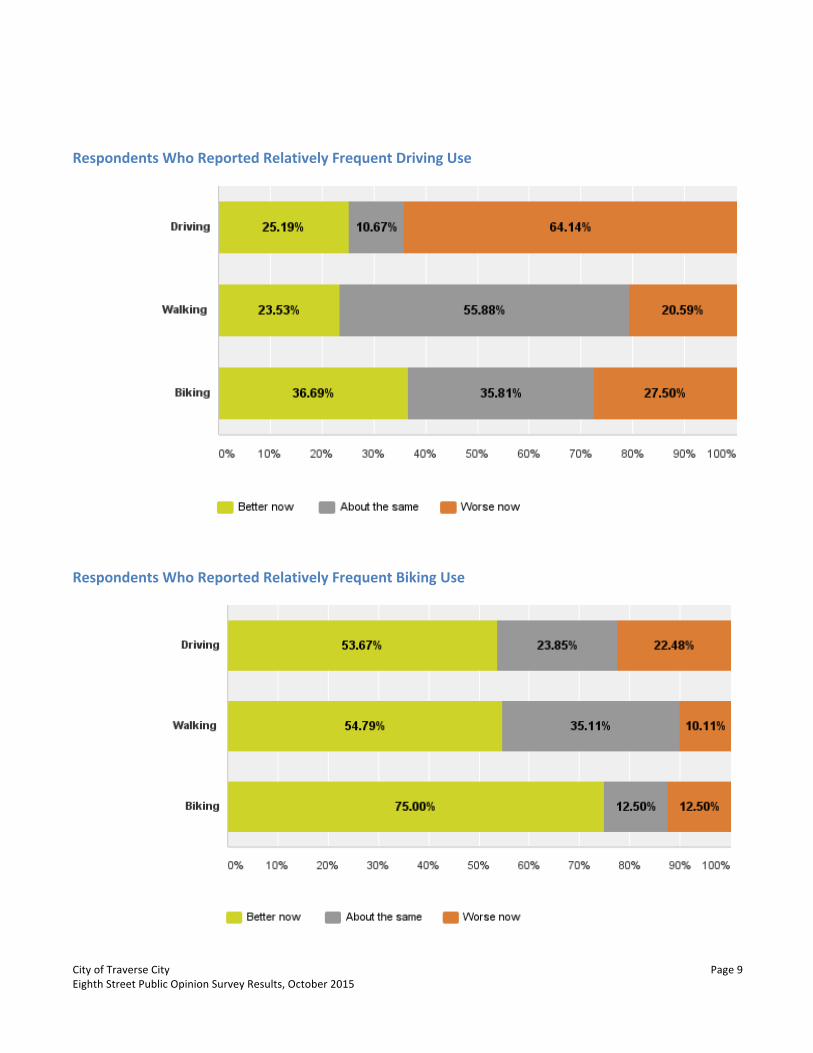
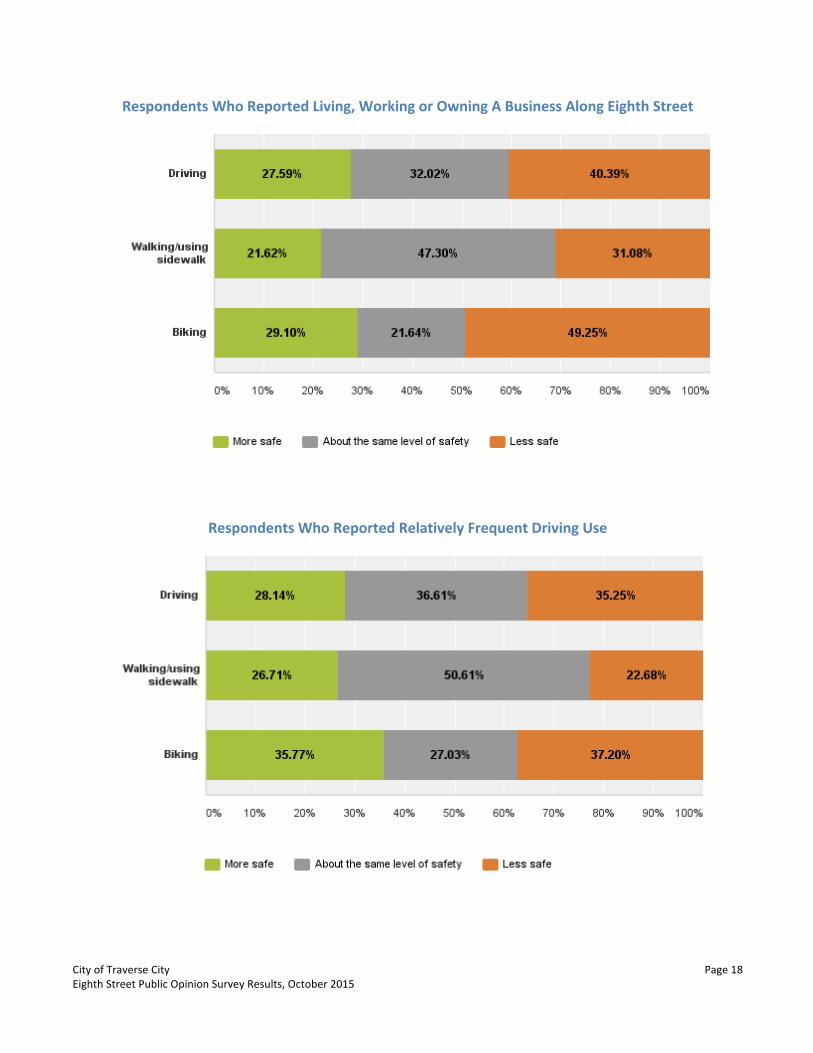
• Among respondents who reported relatively frequent driving use, 64.14% reported that the street was “worse now” for driving; 25.19% rated it as “better now”
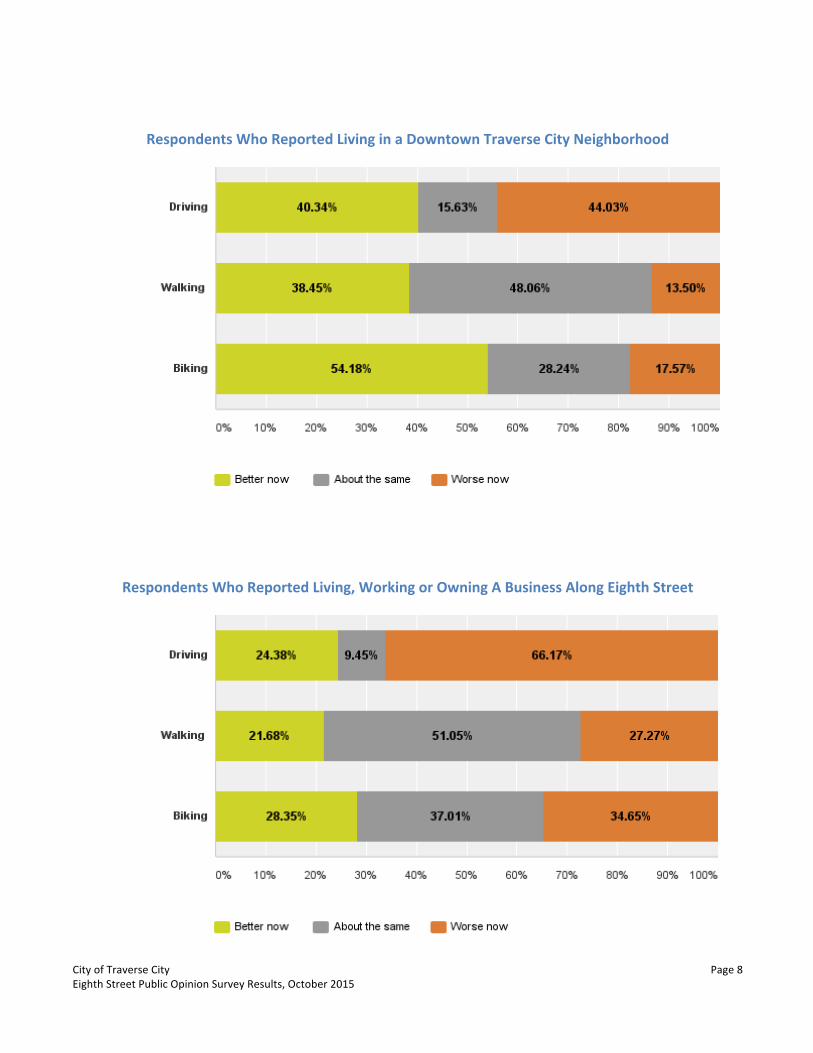
• Among respondents who reported living, working or owning a business on Eighth Street, 66.17% indicated that the driving experience was “worse now”; 24.38% rated it as “better now”
• Among respondents who indicated they lived in a downtown Traverse City neighborhood, 54.18% reported that the experience was “better now” for biking; 28.24% reported that it was “about the same”
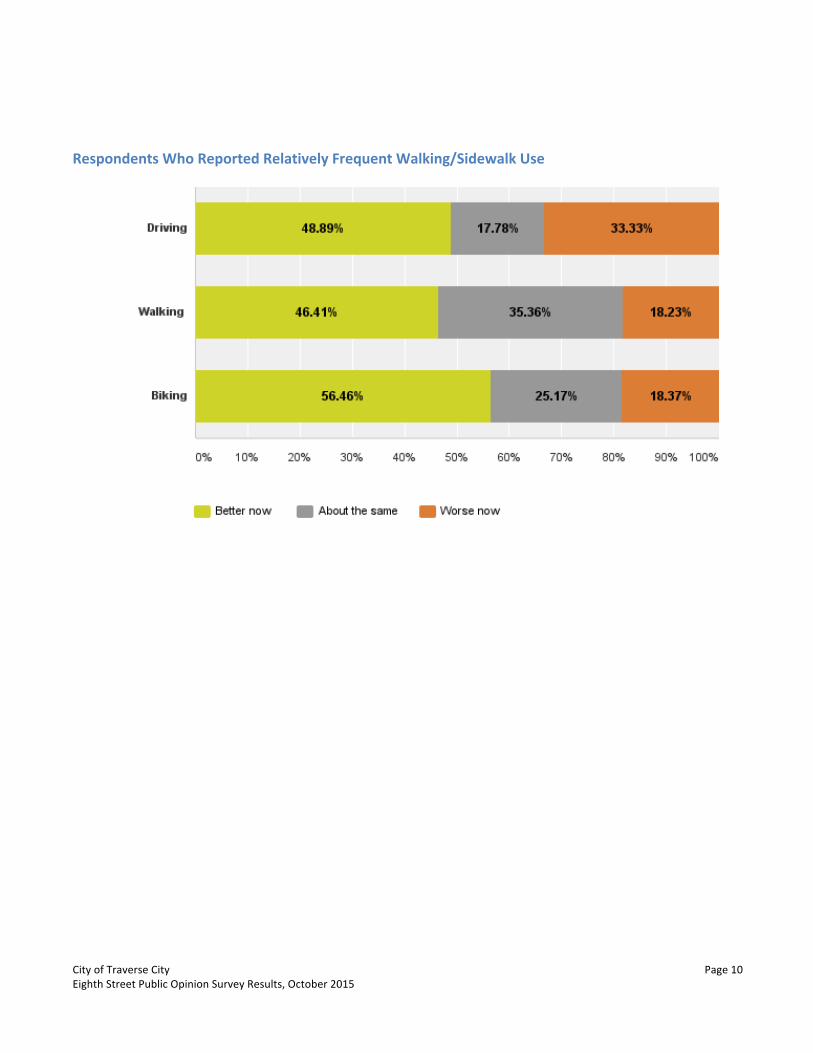
• Among respondents who reported relatively frequent walking use, 46.41% rated the walking experience as “better now”; 35.36% responded that it was “about the same”
• Among respondents who reported relatively frequent biking use, 75% rated their the experience for biking as “better now”; 12.5% reported it as “worse now”
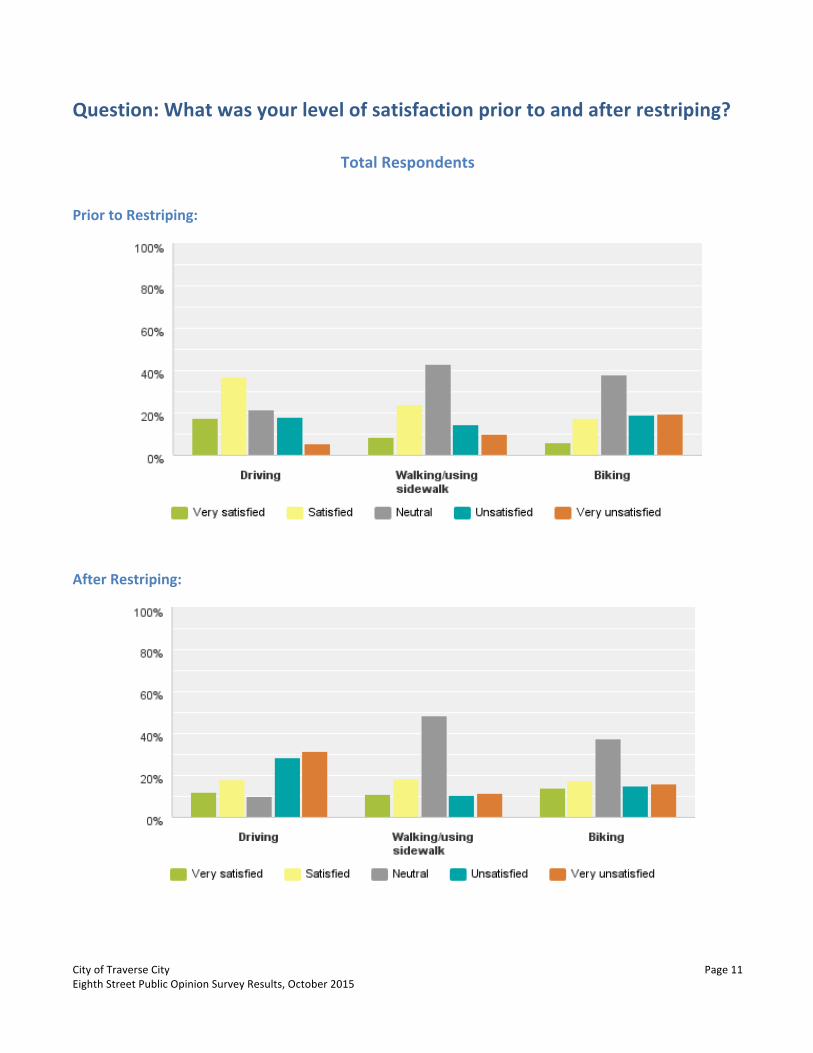
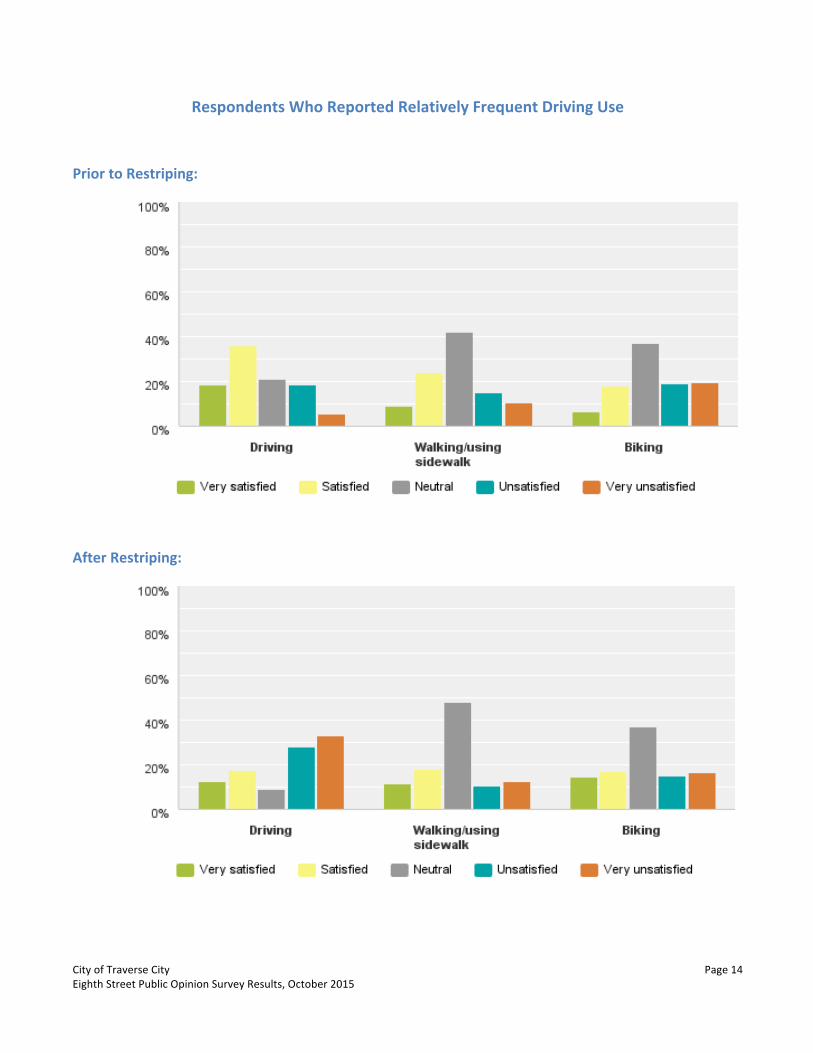
Levels of Satisfaction Prior To and After Restriping Survey participants were invited to report their levels of satisfaction while driving, biking, and walking/using the sidewalk prior to and after the restriping. Some response highlights:
• Among total respondents, there was a 25.56% net decrease in the percentage who reported feeling “very satisfied” and “satisfied” with driving before and after restriping
• Among total respondents, there was a 36.54% net increase in the percentage who reported feeling “very unsatisfied” and “unsatisfied” with driving before and after restriping
• Among total respondents, there was a 7.49% net increase in the percentage who reported feeling “very satisfied” and “satisfied” with biking before and after restriping
• Among total respondents, there was a 2.72% net increase in the percentage who reported feeling “very satisfied” and “satisfied” with walking/sidewalk use before and after restriping; responses rating the experience as “neutral” increase by 5.42%
• Among respondents who reported relatively frequent driving use, there was a 25.17% net decrease in the percentage who reported feeling “very satisfied” or “satisfied” with driving before and after restriping
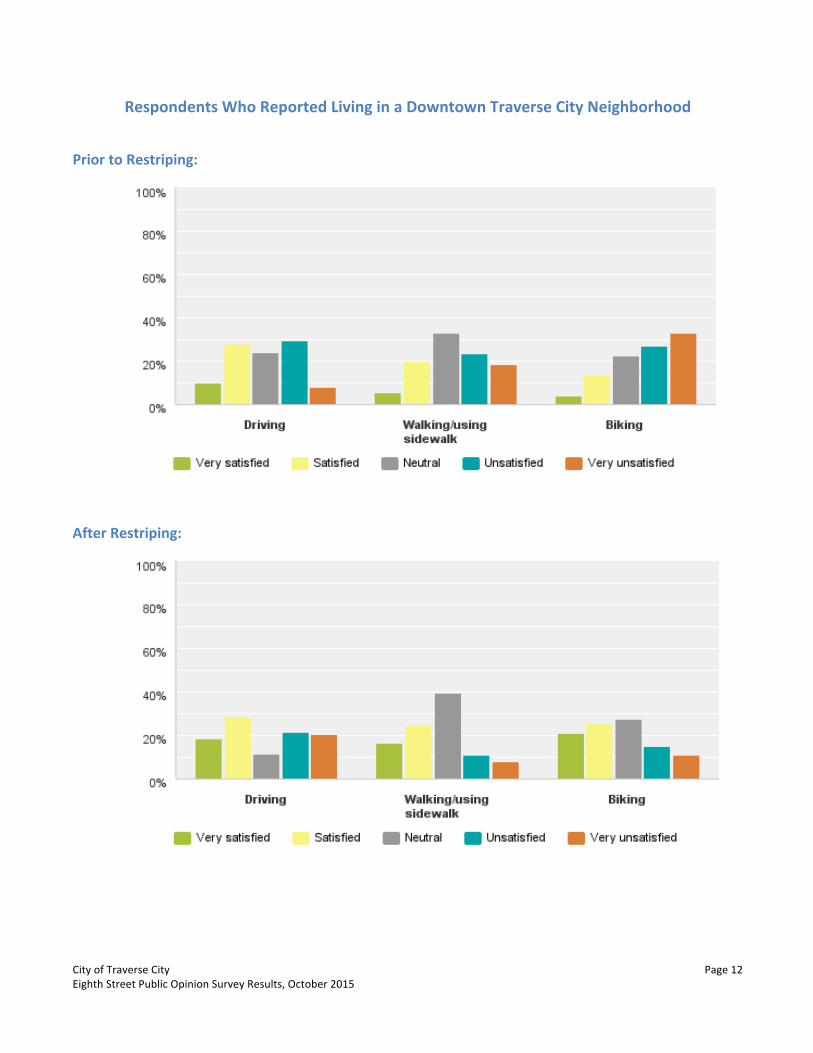
• Among respondents who reported living in a downtown Traverse City neighborhood, there was an 8.54% net increase in the percentage who reported feeling “very satisfied” and “satisfied” with driving before and after restriping; there was also a 4.28 % net increase in the percentage who reported feeling “very unsatisfied” and “unsatisfied” with driving before and after restriping
City of Traverse City Eighth Street Public Opinion Survey Results, October 2015
Page 3
• Among respondents who reported living in a downtown Traverse City neighborhood, there was a 29.15% net increase in the percentage who reported feeling “very satisfied” and “satisfied” with biking before and after restriping
• Among respondents who reported living in a downtown Traverse City neighborhood, there was a 16.13% net increase in the percentage who reported feeling “very satisfied” and “satisfied” with walking/sidewalk use before and after restriping
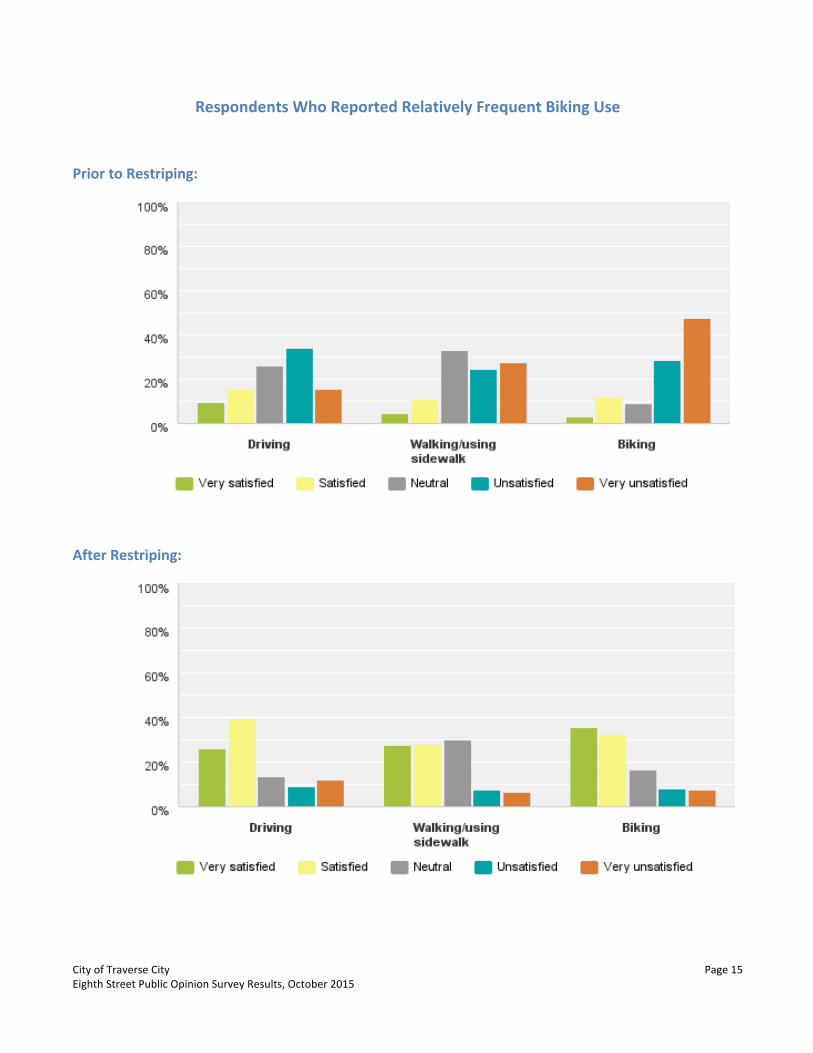
• Among respondents who reported relatively frequent bike use, there was a 54.41% net increase in the percentage who reported feeling “very satisfied” or “satisfied” with biking before and after restriping
• 38.25% of total respondents reported feeling “very unsatisfied” or “unsatisfied” with biking experiences prior to restriping; 23.94% reported feeling “very satisfied” or “satisfied”
• 31.43% of total respondents reported feeling “very satisfied” or “satisfied” with their biking experience after restriping; 30.84% reported feeling “very unsatisfied” or “unsatisfied”
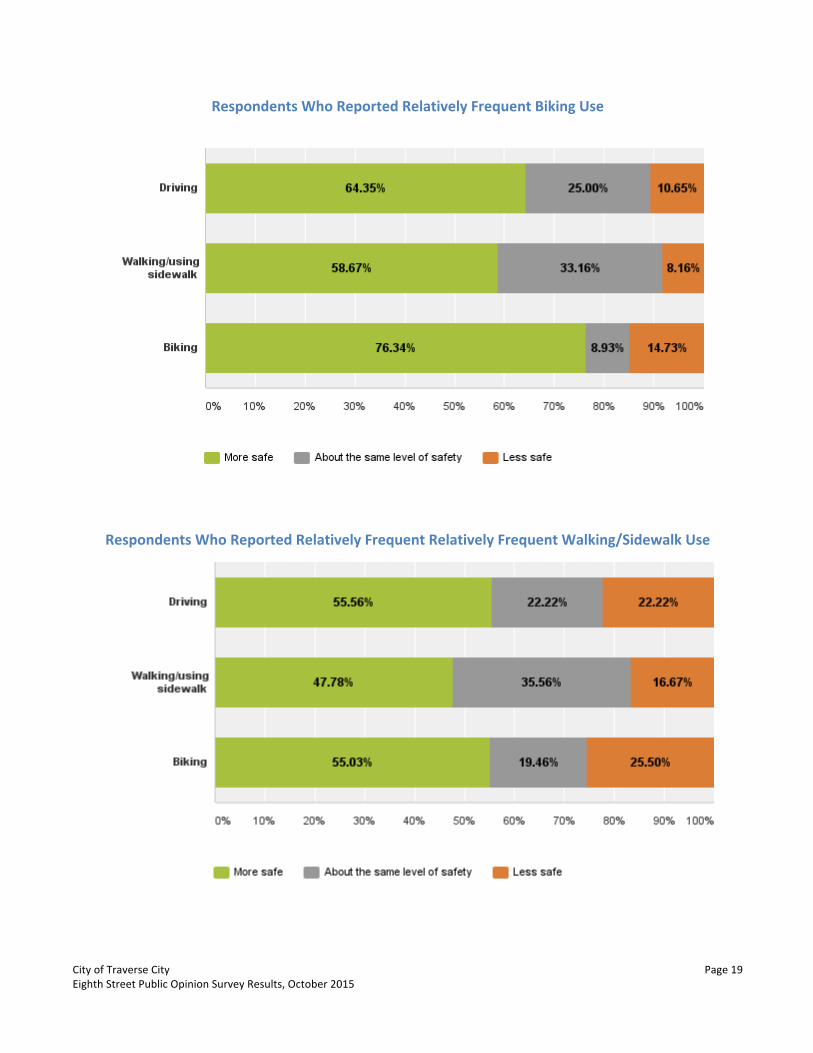
• Among respondents who reported relatively frequent walking/sidewalk use, there was a 29.58% net increase in the percentage who reported feeling “very satisfied” or “satisfied” with walking/sidewalk use before and after restriping
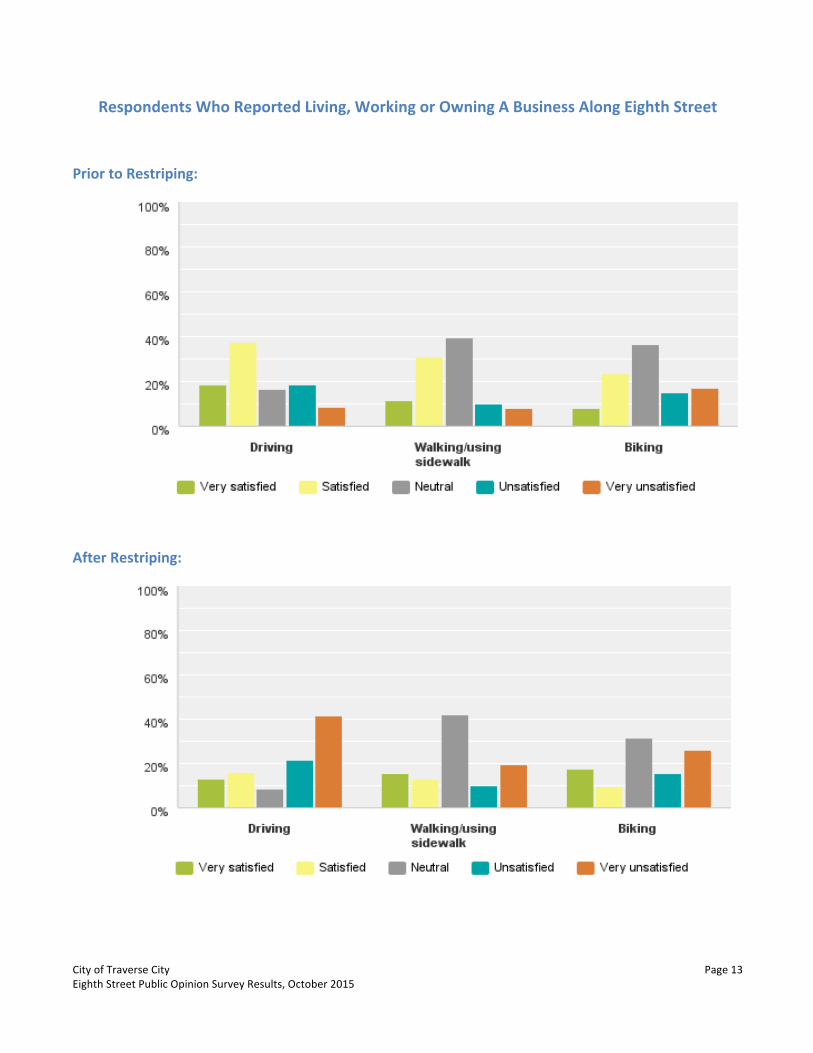
• Among respondents who reported living, working, or owning a business along Eighth Street, there was a 27.59% net decrease in the percentage who reported feeling “very satisfied” or “satisfied” with driving use before and after restriping; there was a 35.96% net increase in reported feelings of “very unsatisfied” or “unsatisfied” related to driving use
• Among respondents who reported living, working, or owning a business along Eighth Street, there was a 6.15% net decrease in the percentage who reported feeling “very satisfied” or “satisfied” with biking use before and after restriping; there was a 9.48% net increase in reported feelings of “very unsatisfied” or “unsatisfied” related to biking use
• Among respondents who reported living, working, or owning a business along Eighth Street, there was a 13.83% net decrease in the percentage who reported feeling “very satisfied” or “satisfied” with walking/sidewalk use before and after restriping; there was a 10.83% net increase in reported feelings of “very unsatisfied” or “unsatisfied” related to walking/sidewalk
Open-‐Ended Comments Related To Experience Ratings and Satisfaction Levels Respondents shared several hundred open-‐ended written comments to survey questions. These comments were evaluated for themes. One of the themes in the responses related to ratings and satisfaction levels was traffic flow. Some respondents wrote about traffic flow issues and described their observations on the same traffic flow pattern in different ways. For example, when describing traffic flow, some respondents characterized the traffic flow after restriping as “congested,” “very backed-‐up, “slow,” and “frustrating.” Others described the traffic flow after restriping as “calmer,” “safer,” and “traveling at the speed limit.” There were also written comments related to the relatively poor condition of the pavement on Eighth Street and how it impacted individual driving and biking experiences and levels of satisfaction. The written comments included a number of responses by people who shared their observations that they see more people biking on the sidewalk than on the street. There were also written comments about turning movements, including challenges turning into and out of streets and businesses along Eighth Street. There were some comments about the impacts of the center turn lane and the left-‐hand turn lane at Lake Street.
City of Traverse City Eighth Street Public Opinion Survey Results, October 2015
Page 4
Additional Information The charts in Appendix A illustrate the total responses, as well as the responses by different cohort groups of respondents related to experience ratings and satisfaction levels prior to and after restriping. Respondents may be members of one or more cohort group. For example, a respondent who indicated that they drive the corridor once a day may also have reported that they live in a downtown Traverse City neighborhood, and a person who reported relatively frequent driving use may have also reported relatively frequent biking or walking use, etc.
Perceptions of Safety Respondents were asked “When you travel along this section of Eighth Street today, how do you feel about your level of safety?” Some perceptions and opinions about safety varied by cohort group. Some response highlights after restriping:
• 76.34% of respondents who reported relatively frequent biking use reported feeling “more safe” biking • 51.77% of respondents who reported living in a downtown Traverse City neighborhood reported feeling
“more safe” biking • 49.25% of respondents who reported living, working, or owning a business along Eighth Street reported
feeling “less safe” biking • 40.39% of respondents who reported living, working, or owning a business along Eighth Street reported
feeling “less safe” driving • 31.08% of respondents who reported living, working, or owning a business along Eighth Street reported
feeling “less safe” walking Appendix B includes charts and data regarding respondents’ perceptions of safety.
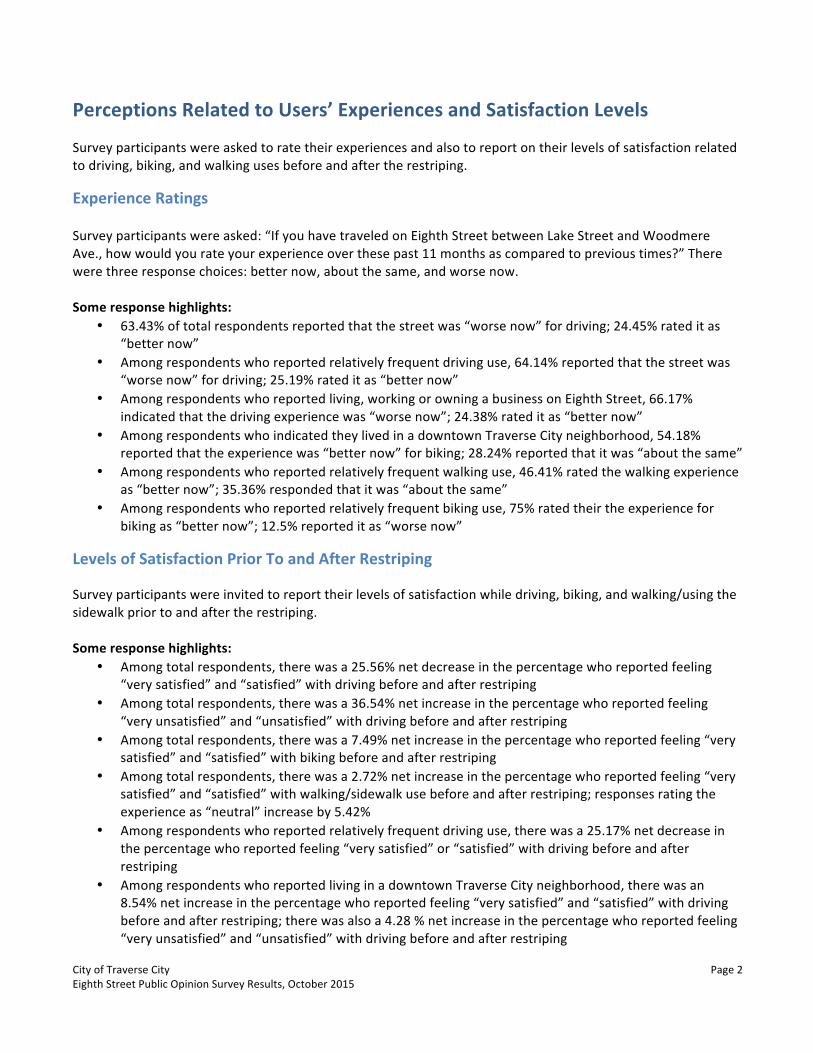
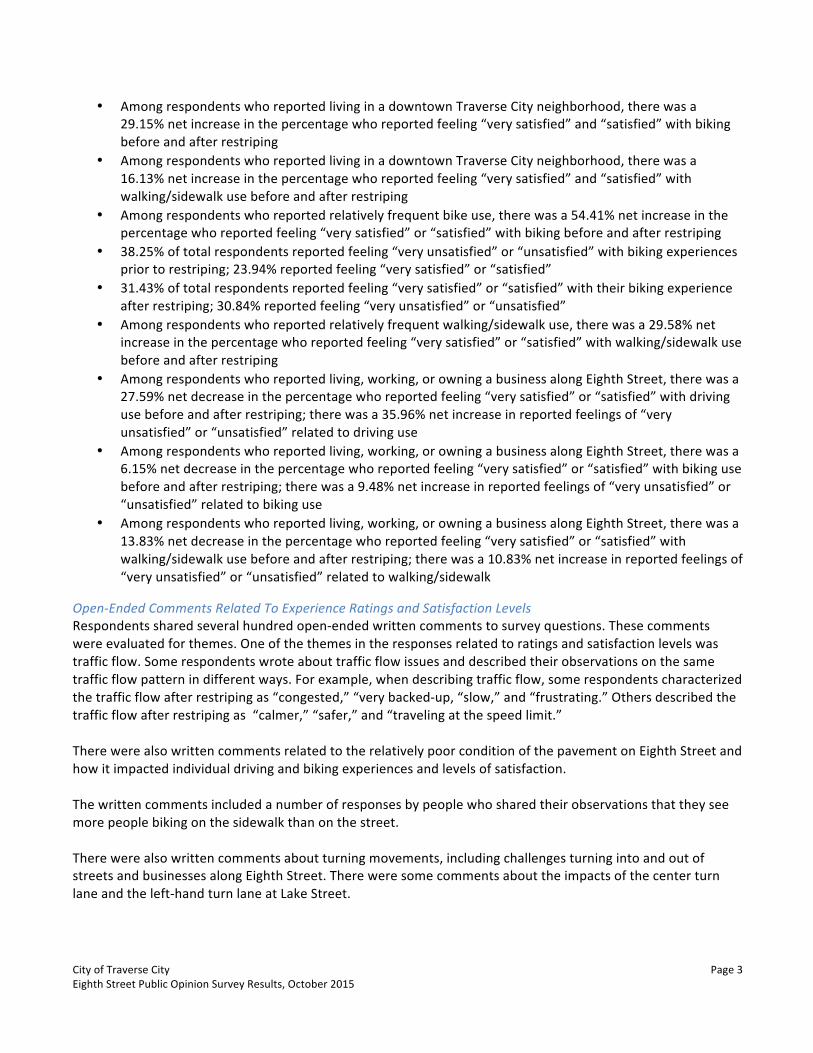
Visual Preferences Survey participants were asked to rank a series of photographs based on their visual preferences. Photo C received the highest average visual preference score; it was ranked as a higher preference by a relatively higher percentage of respondents. However, there was not a significant distinction in the rating levels of images provided by the City. The average rating for each image was relatively similar among total respondents. Photo D received the lowest average rating. The photographs chosen by the City for inclusion in the survey are included below for reference. Visual Preference Rank and Average Rating
1. Photo C (2.76) 2. Photo A (2.51) 3. Photo B (2.45) 4. Photo D (2.36)
City of Traverse City Eighth Street Public Opinion Survey Results, October 2015
Page 5
Photo A (Average Rating: 2.51) Photo B (Average Rating: 2.45)
Photo C – Highest Average Rating (2.76)
Photo D – Lowest Average Rating (2.36)
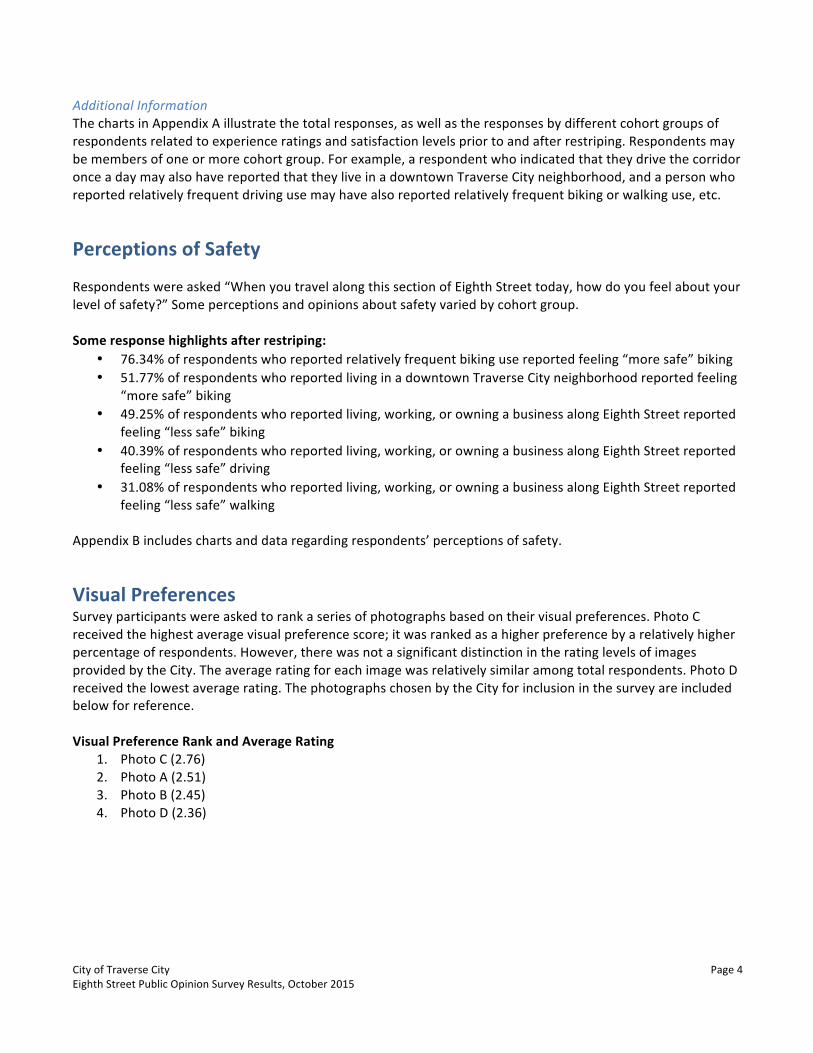
Bike Trail and Cycle Lane Preference Question 12 asked survey participants to respond to the following question and answer choices:
“ Please select the option that best describes your bike use preference related to the following statement: If the City developed a designated bike trail or cycle path as part of Eighth Street's reconstruction, I would use it instead of riding my bike on Eighth Street.”
− Yes, I would choose to ride on a designated bike trail or cycle path instead of the street. − No, I would choose to ride on Eighth Street instead of the cycle path. − I do not use my bike or plan to use my bike to travel the Eighth Street corridor.
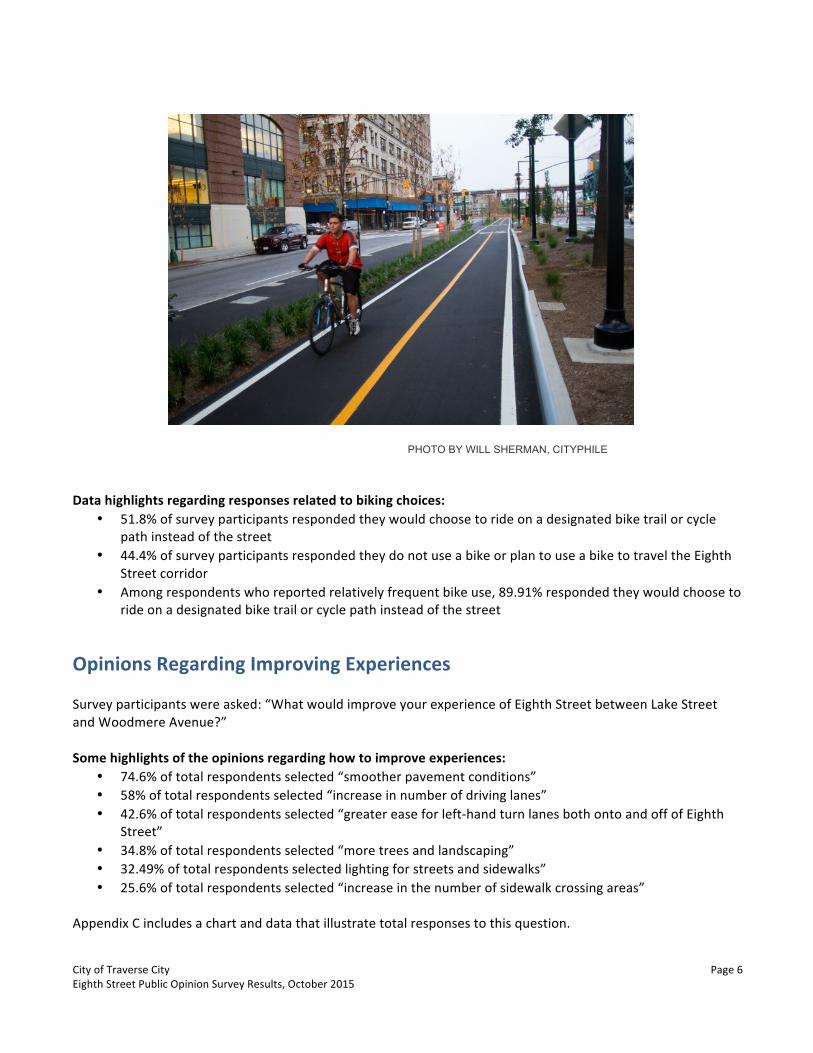
The image below of a sample bike trail/cycle path was selected and provided by the City and was included in the survey.
City of Traverse City Eighth Street Public Opinion Survey Results, October 2015
Page 6
PHOTO BY WILL SHERMAN, CITYPHILE
Data highlights regarding responses related to biking choices:
• 51.8% of survey participants responded they would choose to ride on a designated bike trail or cycle path instead of the street
• 44.4% of survey participants responded they do not use a bike or plan to use a bike to travel the Eighth Street corridor
• Among respondents who reported relatively frequent bike use, 89.91% responded they would choose to ride on a designated bike trail or cycle path instead of the street
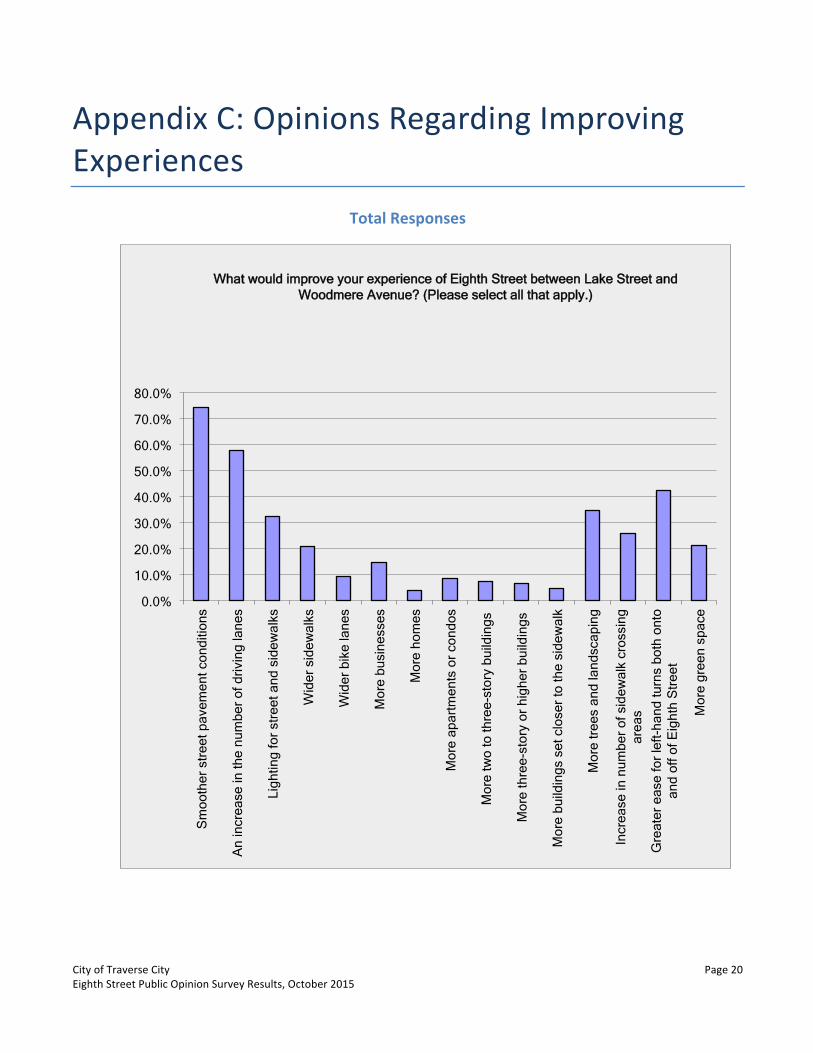
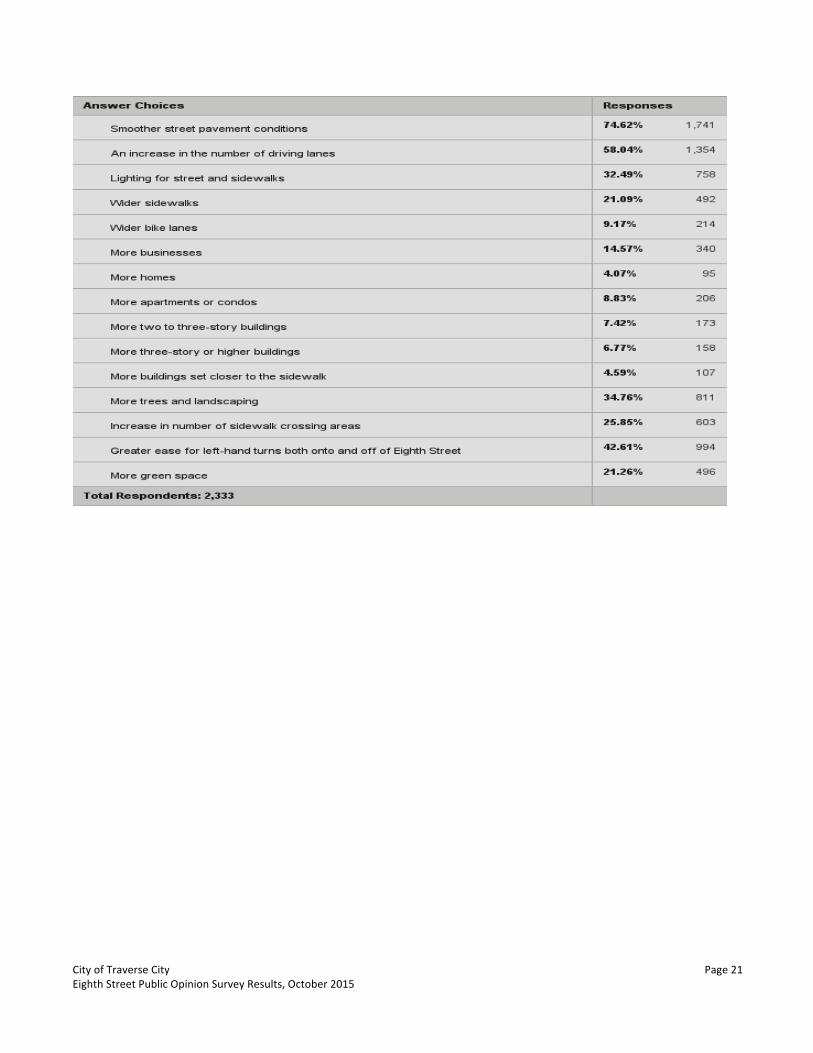
Opinions Regarding Improving Experiences Survey participants were asked: “What would improve your experience of Eighth Street between Lake Street and Woodmere Avenue?” Some highlights of the opinions regarding how to improve experiences:
• 74.6% of total respondents selected “smoother pavement conditions” • 58% of total respondents selected “increase in number of driving lanes” • 42.6% of total respondents selected “greater ease for left-‐hand turn lanes both onto and off of Eighth
Street” • 34.8% of total respondents selected “more trees and landscaping” • 32.49% of total respondents selected lighting for streets and sidewalks” • 25.6% of total respondents selected “increase in the number of sidewalk crossing areas”
Appendix C includes a chart and data that illustrate total responses to this question.
City of Traverse City Eighth Street Public Opinion Survey Results, October 2015
Page 7
Appendix A: Opinions Regarding Levels of Satisfaction Prior to and After Restriping
Question: “If you have traveled on Eighth Street between Lake Street and Woodmere Ave., how would you rate your experience over these past 11 months as compared to previous times?”
Total Respondents
City of Traverse City Eighth Street Public Opinion Survey Results, October 2015
Page 8
Respondents Who Reported Living in a Downtown Traverse City Neighborhood
Respondents Who Reported Living, Working or Owning A Business Along Eighth Street
City of Traverse City Eighth Street Public Opinion Survey Results, October 2015
Page 9
Respondents Who Reported Relatively Frequent Driving Use
Respondents Who Reported Relatively Frequent Biking Use
City of Traverse City Eighth Street Public Opinion Survey Results, October 2015
Page 10
Respondents Who Reported Relatively Frequent Walking/Sidewalk Use
City of Traverse City Eighth Street Public Opinion Survey Results, October 2015
Page 11
Question: What was your level of satisfaction prior to and after restriping?
Total Respondents
Prior to Restriping:
After Restriping:
City of Traverse City Eighth Street Public Opinion Survey Results, October 2015
Page 12
Respondents Who Reported Living in a Downtown Traverse City Neighborhood
Prior to Restriping:
After Restriping:
City of Traverse City Eighth Street Public Opinion Survey Results, October 2015
Page 13
Respondents Who Reported Living, Working or Owning A Business Along Eighth Street
Prior to Restriping:
After Restriping:
City of Traverse City Eighth Street Public Opinion Survey Results, October 2015
Page 14
Respondents Who Reported Relatively Frequent Driving Use
Prior to Restriping:
After Restriping:
City of Traverse City Eighth Street Public Opinion Survey Results, October 2015
Page 15
Respondents Who Reported Relatively Frequent Biking Use
Prior to Restriping:
After Restriping:
City of Traverse City Eighth Street Public Opinion Survey Results, October 2015
Page 16
Respondents Who Reported Relatively Frequent Walking/Sidewalk Use
Prior to Restriping:
After Restriping:
City of Traverse City Eighth Street Public Opinion Survey Results, October 2015
Page 17
Appendix B: Opinions about Safety Before and After Restriping
Total Respondents
Respondents Who Reported Living in a Downtown Traverse City Neighborhood
City of Traverse City Eighth Street Public Opinion Survey Results, October 2015
Page 18
Respondents Who Reported Living, Working or Owning A Business Along Eighth Street
Respondents Who Reported Relatively Frequent Driving Use
City of Traverse City Eighth Street Public Opinion Survey Results, October 2015
Page 19
Respondents Who Reported Relatively Frequent Biking Use
Respondents Who Reported Relatively Frequent Relatively Frequent Walking/Sidewalk Use
City of Traverse City Eighth Street Public Opinion Survey Results, October 2015


![[Vacated opinion. Please see 2010-Ohio-5428.] Court of Appeals … · 2011. 2. 24. · Court of Appeals of Ohio EIGHTH APPELLATE DISTRICT COUNTY OF CUYAHOGA JOURNAL ENTRY AND OPINION](https://static.documents.pub/doc/80x56/610537a335a65338e843b0de/vacated-opinion-please-see-2010-ohio-5428-court-of-appeals-2011-2-24-court.jpg)