16
EirGrid Group Customer Conference 2009 Key Industry Changes A new entrant’s perspective 13 th October 2009 Miguel Gonzalez Engineering Manager Endesa Ireland
| Date post: | 21-Dec-2015 |
| Category: |
Documents |
| View: | 213 times |
| Download: | 0 times |

EirGrid Group Customer Conference 2009
Key Industry ChangesA new entrant’s perspective
13th October 2009
Miguel GonzalezEngineering Manager
Endesa Ireland

Note: YE08 proforma figures (considering asset disposals to Acciona and including ESB)
Presence in 10 countriesPresence in 10 countries
Installed capacity: 39 GW Installed capacity: 39 GW
Output: 147 TWhOutput: 147 TWh
Customers: 24 millionCustomers: 24 million
Employees: 27 thousandEmployees: 27 thousand
Core business: energy
No.1 in Spanish electricity sector. Leading private electric utility in Latin
America
Present throughout the entire electricity and natural gas value chain
A global dual power operatorA global dual power operator
2

~ 40% Endesa ~ 60% Endesa
Latin America
15 GW of installed capacity
Output of 61 TWh
12 million customers
Europe
24 GW of installed capacity
Output of 86 TWh
12 million customers
Note: YE08 proforma figures (considering asset disposals to Acciona and including ESB)
A geographically diverse asset baseA geographically diverse asset base
3

Endesa installed capacity: 39GW
Breakdown by technology 49% of the generation mix is carbon-free
49% carbon-free
51% fossil fuelsRenewables 3%
Nuclear 17%
CCGTs 17%
Hydro 29%
Fuel gas 13%
Coal 21%
Note: YE08 proforma figures (considering asset disposals to Acciona and including Endesa Ireland)
A diversified energy mixA diversified energy mix
4

0
2,000
4,000
6,000
8,000
10,000
12,000
14,000
16,000
18,000
Fin
lan
d
Lu
xem
bu
rg
Sw
eden
Bel
giu
m
Au
stri
a
Fra
nce
Ger
man
y
Ave
rag
e
Net
her
lan
ds
Den
mar
k
UK
Irel
and
Sp
ain
Ital
y
Gre
ece
Po
rtu
gal
KW
h p
er c
apit
a
Ireland in the context of European gas and electricity markets Ireland in the context of European gas and electricity markets (i)(i)
In the European context, Ireland is a small market:
Total installed capacity: 7,000 MW
Peak load: 4,800 MW
Total annual consumption: 27,000 GWh
Around 2 million customers
Demand growth in the last 10 years > 4% annual
2009 demand has decreased and it is expected to take 4 years to return to 2008 demand levels.
Electricity demand 1997 - 09
Demand per-capita EU 15
> 20 GWGermanySpainFranceUKItalyNetherlandsSwedenNorwayPoland
10-20 GWAustriaBelgiumDenmarkFinlandGreecePortugalCzech Rep.RomaniaSwitzerland
< 3 GWLuxemburgCyprusEstoniaLatviaSlovenia
Installed capacity by country
-6.0%
-4.0%
-2.0%
0.0%
2.0%
4.0%
6.0%
8.0%
0
5,000
10,000
15,000
20,000
25,000
30,000
35,000
1996 1997 1998 1999 2000 2001 2002 2003 2004 2005 2006 2007 20082009e
GW
h
Total Electricity Requirement Growth rate
Source: Eurelectric, EirGrid, International Energy Agency 5

Ireland in the context of European gas and electricity markets (ii)Ireland in the context of European gas and electricity markets (ii)
Ireland prices are still sensitive to Oil prices during winter peak, while NBP gas prices seem to be ruling during summer
New CCGT capacity will also link Irish electricity prices to NBP gas during winter time
Italy still shows the influence of Brent prices, as piped gas is mainly indexed to Brent
Spain enjoys low prices due to increasing levels of wind energy, in addition to a well diversified piped gas and LNG supplies
6

7
Ireland regulatory frameworkIreland regulatory framework
In summary, a relatively well balanced framework, with room for some improvements...In summary, a relatively well balanced framework, with room for some improvements...
• Reasonably covers Capital Cost of Marginal Units (Distillate GT BNE)
• Needs to develop stability and predictability
• Tariff based, but this tariff doesn’t reflect real costs
• Market bids would better represent costs and would optimize total system cost (mainly for operative reserves)
• Needs improving to incentivize the most flexible(and expensive)
technologies
• SMP based on Short-Run Marginal Cost• Merit Order dispatch is an incentive for efficient technologies
• Variable costs naturally hedged• Some costs not included (gas transmission costs)
... but any change has to take into account the whole picture to avoid instability.... but any change has to take into account the whole picture to avoid instability.

A great opportunity within reach …A great opportunity within reach …
Wind power installed capacity in Europe in MW (2008)
7,0%
11,8%
1,7%
1,2%
1,8%
21,2%
9,3%
3,4%
1,3%
8,4%
3,3%
3,7%
3,8%
Wind share of demand (2007)
Source: EWEA (European Wind Energy Association), Eurostat
....and also the framework to make it happen:
• REFIT Tariff
• Capacity Payments
Ireland has some of best European wind areas with optimum conditions…
8
c. 5400 MW by 2020
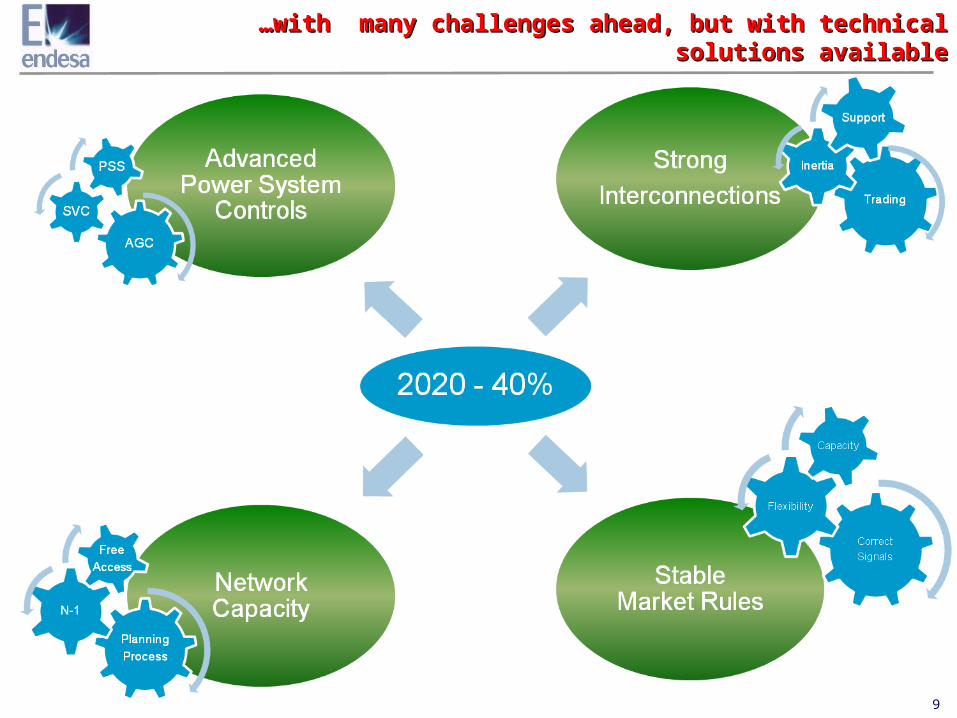
……with many challenges ahead, but with technical solutions availablewith many challenges ahead, but with technical solutions available
9
……with many challenges ahead, but with technical solutions availablewith many challenges ahead, but with technical solutions available
10
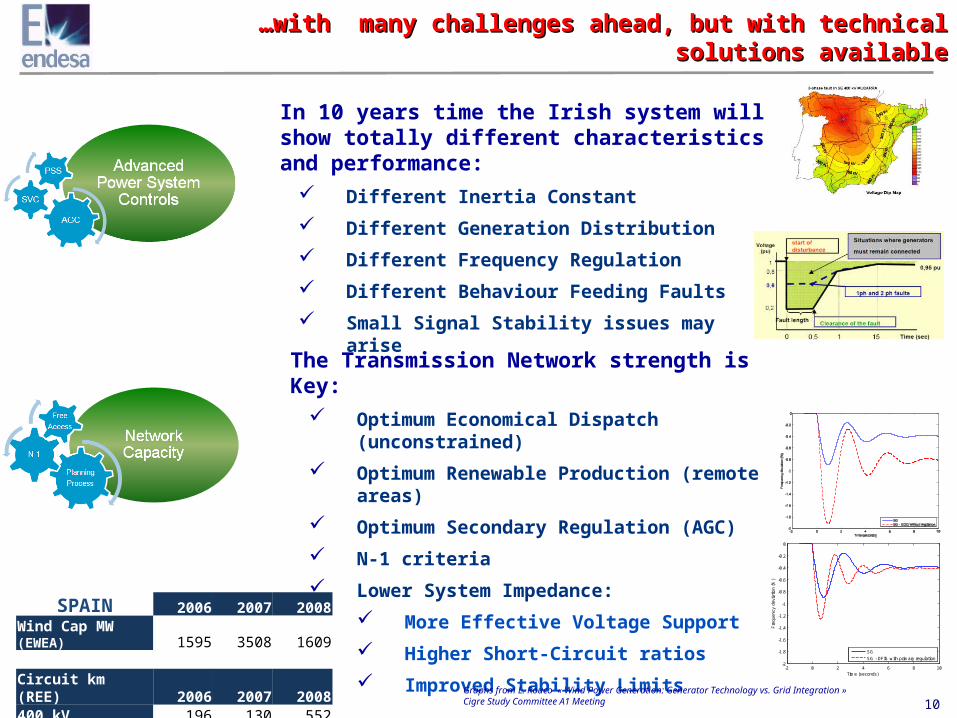
In 10 years time the Irish system will show totally different characteristics and performance:
Different Inertia Constant
Different Generation Distribution
Different Frequency Regulation
Different Behaviour Feeding Faults
Small Signal Stability issues may arise
The Transmission Network strength is Key:
Optimum Economical Dispatch (unconstrained)
Optimum Renewable Production (remote areas)
Optimum Secondary Regulation (AGC)
N-1 criteria
Lower System Impedance:
More Effective Voltage Support
Higher Short-Circuit ratios
Improved Stability LimitsSPAIN 2006 2007 2008Wind Cap MW (EWEA) 1595 3508 1609 Circuit km (REE) 2006 2007 2008400 kV 196 130 552220 kV 210 37 101
Graphs from L. Rouco « Wind Power Generation: Generator Technology vs. Grid Integration » Cigre Study Committee A1 Meeting
-2 0 2 4 6 8 10-2
-1.8
-1.6
-1.4
-1.2
-1
-0.8
-0.6
-0.4
-0.2
0
Time (seconds)
Fre
quen
cy d
evia
tion
(%)
SG
SG - DFIG with primary regulation

……with many challenges ahead, but with technical solutions availablewith many challenges ahead, but with technical solutions available
11
The development of interconnections:
Improved inertial response
Instantaneous support in emergency conditions
HVDC links can provide additional control features
Interconnection Trading as a source of:
Flexibility
Renewables Production optimization (when excess)
Flexible plants economical feasibility may improve
Long term plan for Regional Market development
Interconnection Trading rules must be revised
Firm capacity must be maintained
Harmonization on Gate Closure with BETTA
Market Rules must be stable, predictable and comprehensive:
Modifications in small steps with overall view
Capacity payments need some adjustments
Ancillary Services should be market based
Develop a Balancing Market for System Operative Reserves
Current Tariffs are not an incentive

……without forgetting the remaining 60% for Security and Flexibilitywithout forgetting the remaining 60% for Security and Flexibility
12
Resources available in the country that provide security
Resources providing flexibility
Critical aspect is the performance of the national Gas System
With diversified resources:
Resources from geopolitically stable origins and proved long term reserves
LNG & depleted gas fields used as storage are a valuable sourceof flexibility

13
……special mention to the gas systemspecial mention to the gas system
The Gas System will be critical to meet the challenge as a major source of security and flexibility.
Natural Gas is a cleaner fuel than Distillate
Dry Low NOx burners don’t need water injection
The implicit storage in the pipe itself can accommodate sudden peaks of consumption
Ireland has potential storage in depleted fields which are valuable resources to shave market peaks and secure strategic reserves
LNG facilities are a great source of flexibility for the gas system, as well as security of supply
100 MW Aeroderivative GT latest technology needs:
• 220 HL/hour of Distillate
• 68 HL/hour of Demin Water
• 17 T/hour CO2 emissions
higher than natural gas
One typical truck carries 300 HL
• At full load, one truck would
be needed every 1 h 20 min
In the event of a extended
period of calm weather, the
replacement of, i.e. 1.000 MW
with this units would make
circa 80 Distillate trucks on
the roads per day.
Distillate GT’s as BNE?

……and with the right technologies.and with the right technologies.
14
With attention to:
Electric Vehicles
Domestic Fuel Cells
Microgeneration
Smart Metering
Efficient Demand
As potential sources of:
• Flexibility
• Network Optimization
• Peak/valley shaving
kip
Smartenergybyendesa
kip
Smartenergybyendesa

15
The target is getting a balanced and competitive mixThe target is getting a balanced and competitive mix


