23
EIS Storage Guide April 19, 2016
EIS Storage Guide
April 19, 2016

Page 2 of 23
Document Control Information
Document Location
The latest version of this document is located in the Product Management Portal on SharePoint.
FILE NAME EIS Storage Guide.docx
LOCATION
CONTACT SAN Development Engineer, Alpharetta, GA
Document Change History
The following is a history of changes to this document:
Version Date Authors Summary of Changes
1.0 4/19/2016 Robert Billeaud
Document Creation
User Responsibilities
The following apply to users of this document:
Do not make unauthorized alterations to your copy of the document
Destroy entire document when recalled, obsolete, or no longer needed
Verify the version prior to use – version is found on title page of this document
Verify completeness prior to use – all pages numbered sequentially as page x of y
Report deviations from these procedures to document owners

Page 3 of 23
Table of Contents
Table of Contents ........................................................................................ 3
1. Introduction .......................................................................................... 4
2. Performance Collection and Analysis ................................................. 4
3. Paragon Storage ................................................................................. 5
3.1. Paragon Storage Layout ............................................................................................. 5
3.2. Benchmark Testing Paragon Storage ........................................................................ 5
3.3. Diskspd Test File Cleanup ......................................................................................... 7
4. One Content Storage ........................................................................... 7
4.1. One Content Layout ................................................................................................... 7
4.2. Benchmark Testing One Content Storage ................................................................ 8
5. Collecting Storage System Statistics .................................................. 10
5.1. Collecting Storage System Statistics EMC VNX ...................................................... 10
6. Windows Performance Monitor ....................................................... 12
6.1. Viewing storage performance real-time or manually. ............................................ 12
6.2. Creating a Disk Performance Data Collector .......................................................... 13
7. VMware Storage .................................................................................. 16
7.1. Virtual Storage Designs ........................................................................................... 16
7.2. Physical Storage Designs .......................................................................................... 17
7.3. RDM Raw Device Maps and Cluster Considerations ............................................. 18
7.4. SCSI Addressing and Settings ................................................................................. 20
7.5. Native Multipath...................................................................................................... 20
7.6. Physical vs Virtual SAN Performance ..................................................................... 21
7.7. Performance of Single vs Multiple Devices ............................................................. 22
7.8. Multiple Host IO Contention .................................................................................. 23
7.9. Paravirtual SCSI Perfomance Comparison ............................................................. 23

Page 4 of 23
1. Introduction
This consolidated storage guide CSG provides a single source for commonly requested information, best practices and tools. It is not intended as a detailed guide.
2. Performance Collection and Analysis
McKesson recommends a benchmark test of the storage system prior to production to verify the solution can satisfy minimum IO performance requirements.
This document describes the tools used to measure and analyze performance before and after the solution has entered production.
In the first example applications are idle. The storage system capabilities can be accurately measured using the approved disk benchmark tool.
Performance results can be collected in a number of ways. The disk benchmark program will generate a report based on the results of the workloads it generates. It cannot measure the workload of other programs or applications.
Both the system performance monitor and the hardware performance logging in the SAN array can measure any workload generated by a program or application.
Once the solution is in production the application workloads will skew the benchmark tool results.
At this point storage performance should be captured by the system performance monitor or the SAN array logging feature.
The results may be submitted to the appropriate support team for analysis. The system report will help the application team identify potential issues and the SAN collection will help storage support identify hardware issues or performance hot spots in at the array level.
.
Page 5 of 23
3. Paragon Storage
3.1. Paragon Storage Layout
This is a general description of how Paragon storage is configured at the server-application level not a comprehensive guide. Please refer to the Paragon mount points document for more information. A Paragon environment consists of 3 to 4 servers which include Live, Test and Report with 9 mount points and the Audit server with 8 mount points. Only 6 mount points per server have specified performance requirements and 5 of those are used.
The minimum performance requirement is identical for all four servers. The following sections provide instructions for testing and measuring the capability of the storage system . Table 3-1 contains a sample of the information found in the mount points document.
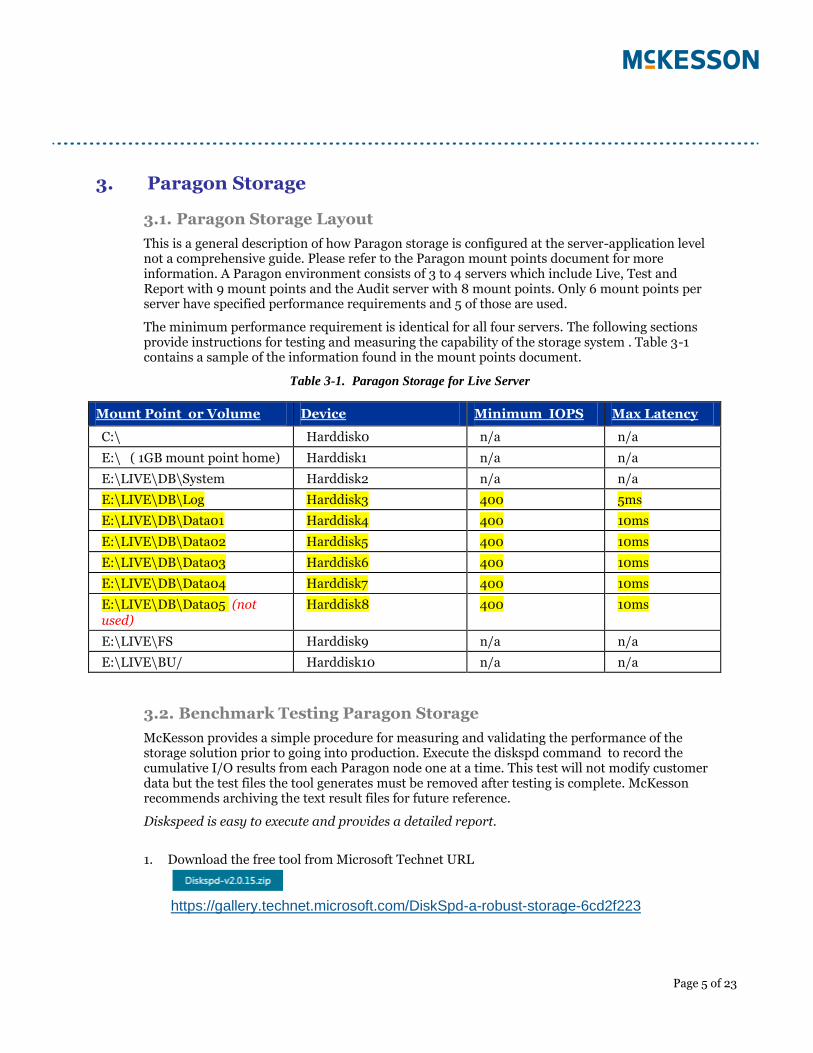
Table 3-1. Paragon Storage for Live Server
Mount Point or Volume Device Minimum IOPS Max Latency
C:\ Harddisk0 n/a n/a
E:\ ( 1GB mount point home) Harddisk1 n/a n/a
E:\LIVE\DB\System Harddisk2 n/a n/a
E:\LIVE\DB\Log Harddisk3 400 5ms
E:\LIVE\DB\Data01 Harddisk4 400 10ms
E:\LIVE\DB\Data02 Harddisk5 400 10ms
E:\LIVE\DB\Data03 Harddisk6 400 10ms
E:\LIVE\DB\Data04 Harddisk7 400 10ms
E:\LIVE\DB\Data05 (not used)
Harddisk8 400 10ms
E:\LIVE\FS Harddisk9 n/a n/a
E:\LIVE\BU/ Harddisk10 n/a n/a
3.2. Benchmark Testing Paragon Storage
McKesson provides a simple procedure for measuring and validating the performance of the storage solution prior to going into production. Execute the diskspd command to record the cumulative I/O results from each Paragon node one at a time. This test will not modify customer data but the test files the tool generates must be removed after testing is complete. McKesson recommends archiving the text result files for future reference.
Diskspeed is easy to execute and provides a detailed report.
1. Download the free tool from Microsoft Technet URL
https://gallery.technet.microsoft.com/DiskSpd-a-robust-storage-6cd2f223

Page 6 of 23
2. Unpack and locate the diskspd.exe for your platform.
3. Create a simple program folder and copy the executable to that location. example: C:\diskspd\diskspd.exe
Determine the minimum of 5 mount points to test on a single Paragon server then execute the following command from a command line window. C:\diskspd\diskspd -b64K -h –d600 -r -t2 -o4 -w40 –c16G -L
E:\LIVE\DB\Data01\data1.dat E:\LIVE\DB\Data02\data2.dat
E:\LIVE\DB\Data03\data3.dat E:\LIVE\DB\Data04\data4.dat
E:\LIVE\DB\Log\datalog.dat > Live_Results.txt
Command Options: -b64K transfer size, -h disable host caching, -d600 run time in seconds , -r random test pattern, -t2 number of threads, -o4 outstanding I/Os, -w40 40% write ratio, -c16G test file area in GB, -L measure latency statistics.
Example: Command to test 5 mount points concurrently on the Report server.
4. Repeat the test procedure on each Paragon system and archive the results.
5. Analyze the results file. In this example 5 mount points are measured and the cumulative IOPS of 11,676 far exceeds the Paragon requirement of 2000IOPS for 5 mount points per server. The response times for data and log mount points also exceed the requirement. Please note in most cases these devices are provisioned from the same storage tier. There are some cases where the log mount point may be provisioned on a higher tier. This is when analyzing the individual mount point measurements will be more useful than the grand totals.
6. Individual read and write statistics may be analyzed as needed.

Page 7 of 23
3.3. Diskspd Test File Cleanup
The diskspd test files can be large and must be removed prior to handing the system over to the customer. Delete the files and empty the recycle bin if necessary.
4. One Content Storage
4.1. One Content Layout
This is a general description of how One Content storage is configured at the server-application level and not a comprehensive guide. The purpose is to ensure the storage I/O performance will meet the requirements of the application.
Table 4-1. One Content Storage Layout
Server Drive Usage Average Latency
R/W Ratio Transfers sec
DB Server C OS 40/60 150

Page 8 of 23
Server Drive Usage Average Latency
R/W Ratio Transfers sec
G Cabinet 10ms 20/80 1300
H Audit DB 10ms 5/95 150
I HIS, EIWD,WFE, EIS, EMS_JMS
10ms 20/80 600
K TempDB 5ms 50/50 150
L Cabinet Logs 5ms 5/95 600
M Audit Logs 5ms 5/95 150
N WFE, EIS, EMS_JMS, Logs
5ms 5/95 150
DB Totals 5ms Test Ratio 15/85 3250 Combined
File Server C 10ms 20/80 150
I Images 5ms 80/20 600
J Def Images 10ms 20/80 600
File Server Totals
10ms Test Ratio 40/60 1350 Combined
Farm Servers 1&2
C 5/95 150
D 5/95 100
Farm Totals 10ms Test Ratio 5/95 250 Combined
UI Servers 1& 2 C 10ms 5/95 150
D 10ms 5/95 100
Test Ratio 5/95 250 Combined
4.2. Benchmark Testing One Content Storage
This procedure describes how to use the diskspd utility to measure storage performance capability prior to going into production. The tool will be executed on each one content system to verify storage system capability. After the systems have gone into production the diskspd tool will be less effective and unable to measure external workloads. In those cases the performance should be measured from the Windows performance monitor or SAN array statistics.
Diskspeed is easy to execute and provides a detailed report.

Page 9 of 23
1. Download the free tool from Microsoft Technet URL.
https://gallery.technet.microsoft.com/DiskSpd-a-robust-storage-6cd2f223
2. Unpack and locate the diskspd.exe for your platform.
3. Create an simple program folder and copy the executable to that location. example: C:\diskspd\diskspd.exe
Determine the drive letters to be tested on the One Content system. In this example we’re testing the DB server G,H,I,K,L,M drives. We could optionally add the C drive to the test list if provisioned from the same SAN resource.Our objective is achieving 3250 cumulative IOPS with an average response time below 5ms. If the G, H and I drives could be located on a lower performance storage tier and should meet the 10ms requirement. C:\diskspd\diskspd -b64K -h –d600 -r -t2 -o4 –w85 –c16G -L G:\G.dat
H:\H.dat I:\I.dat K:\K.dat L:\L.dat M:\M.dat C:\C.dat
DB1_Results.txt
Command Options: -b64K transfer size, -h disable host caching, -d600 run time in seconds , -r random test pattern, -t2 number of threads, -o4 outstanding I/Os, -w85 write ratio, -c16G test file area in GB, -L measure latency statistics.
4. Repeat the test procedure on each One Content system and archive the results.
In this example we far exceed the minimum requirements for IOPS and latency for the DB server.
Page 10 of 23
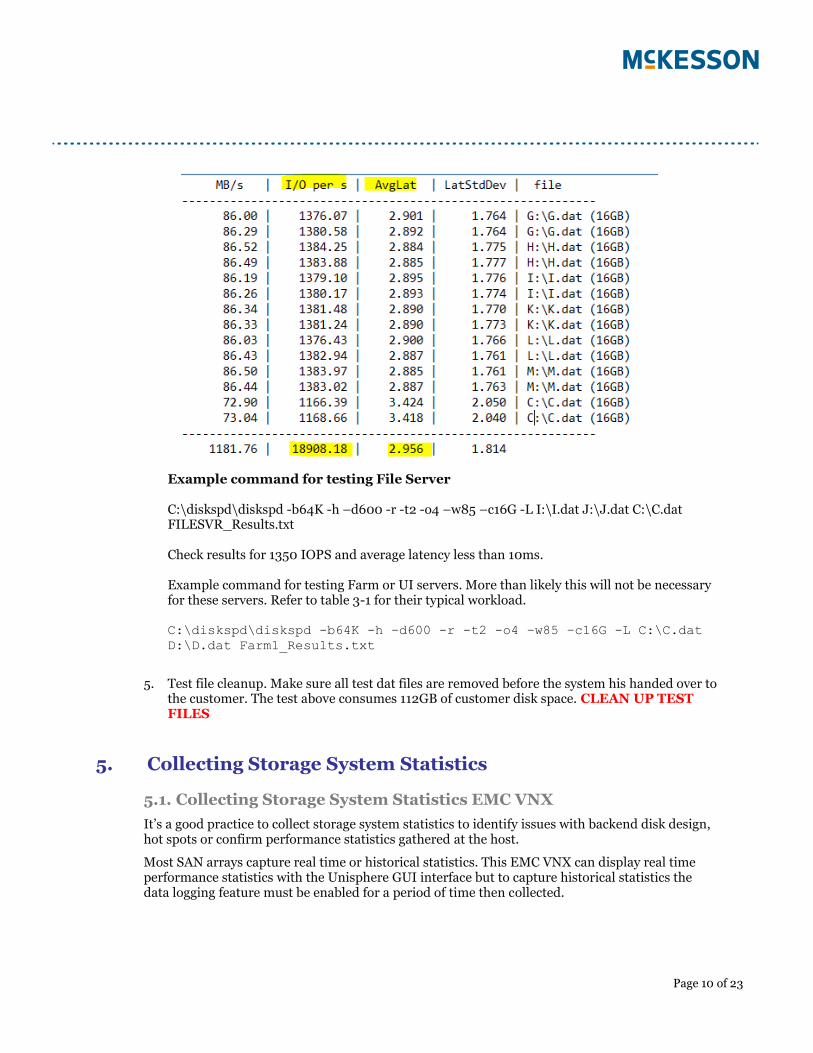
Example command for testing File Server C:\diskspd\diskspd -b64K -h –d600 -r -t2 -o4 –w85 –c16G -L I:\I.dat J:\J.dat C:\C.dat FILESVR_Results.txt Check results for 1350 IOPS and average latency less than 10ms. Example command for testing Farm or UI servers. More than likely this will not be necessary for these servers. Refer to table 3-1 for their typical workload. C:\diskspd\diskspd -b64K -h –d600 -r -t2 -o4 –w85 –c16G -L C:\C.dat
D:\D.dat Farm1_Results.txt
5. Test file cleanup. Make sure all test dat files are removed before the system his handed over to the customer. The test above consumes 112GB of customer disk space. CLEAN UP TEST FILES
5. Collecting Storage System Statistics
5.1. Collecting Storage System Statistics EMC VNX
It’s a good practice to collect storage system statistics to identify issues with backend disk design, hot spots or confirm performance statistics gathered at the host.
Most SAN arrays capture real time or historical statistics. This EMC VNX can display real time performance statistics with the Unisphere GUI interface but to capture historical statistics the data logging feature must be enabled for a period of time then collected.

Page 11 of 23
Summary performance statistics can be viewed real time.
Diagnostic and Performance reports NAR files can be transferred from the storage system and submitted to EMC support or web-based trending analysis tools.
Page 12 of 23
6. Windows Performance Monitor
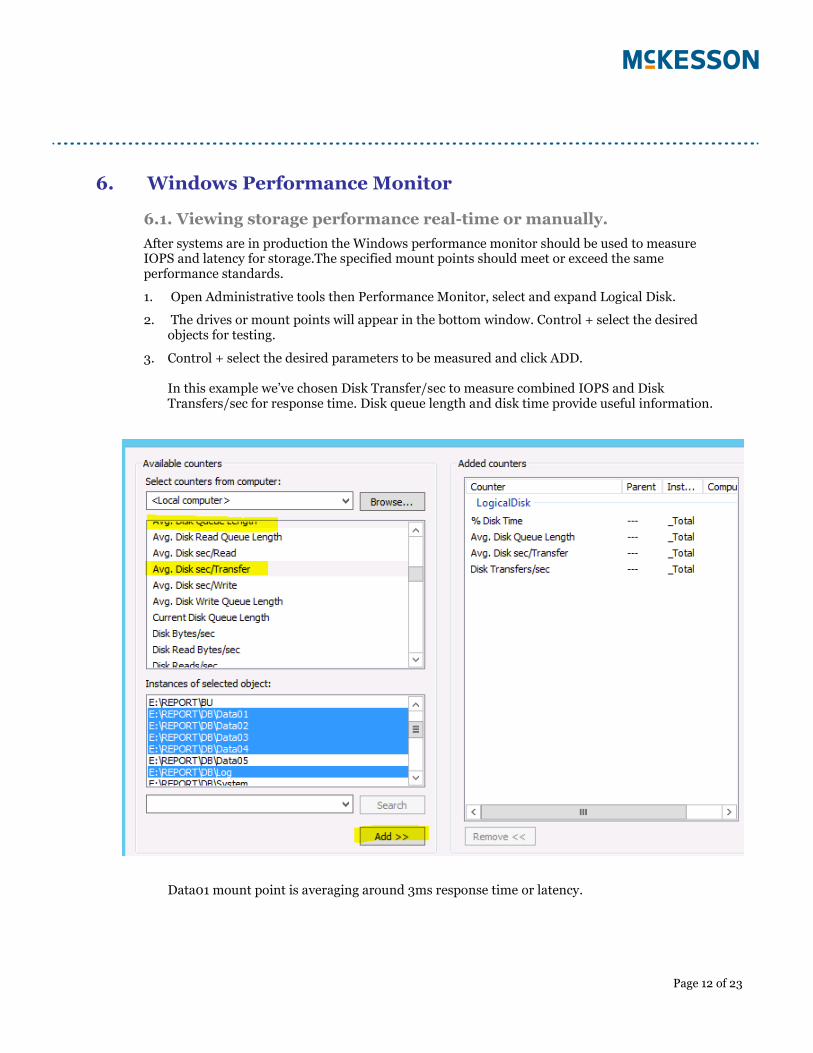
6.1. Viewing storage performance real-time or manually.
After systems are in production the Windows performance monitor should be used to measure IOPS and latency for storage.The specified mount points should meet or exceed the same performance standards.
1. Open Administrative tools then Performance Monitor, select and expand Logical Disk.
2. The drives or mount points will appear in the bottom window. Control + select the desired objects for testing.
3. Control + select the desired parameters to be measured and click ADD. In this example we’ve chosen Disk Transfer/sec to measure combined IOPS and Disk Transfers/sec for response time. Disk queue length and disk time provide useful information.
Data01 mount point is averaging around 3ms response time or latency.

Page 13 of 23
Data01 mount point is averaging more than 3000IOPS and far exceeding the 400IOPS requirement.
6.2. Creating a Disk Performance Data Collector
Follow these instructions to record disk performance statistics for analysis and playback.
1. Create a new data collector set under Windows performance monitor.
2. Provide a customer name and select create manually.
3. Select Performance counter option then FINISH.

Page 14 of 23
4. Double click the new data collector and add counters. These are the minimum counters needed to analyze performance.
5. Right click and edit properties for new data collector. Note the location where the collector file will be saved.

Page 15 of 23
6. Select desired options to control length of test, maximum file size and start stop rules.
7. Start the data collector.
8. Stop the data collector and clean up files when work is complete.
Page 16 of 23
7. VMware Storage
7.1. Virtual Storage Designs
McKesson develops recommended designs and best practices that ensure maximum reliability and compatibility. Each design and software release is carefully validated using all recommended best practices published by VMware, Microsoft as well as the system and storage manufacturers.
McKesson has no specific requirement for the RAID or disk types used in the back-end storage design as long as the solution meets or exceeds the minimum performance requirements. In this example a RAID5 pool has been provisioned with the capability of servicing 10,000 transfers per second and average latency under 5ms.
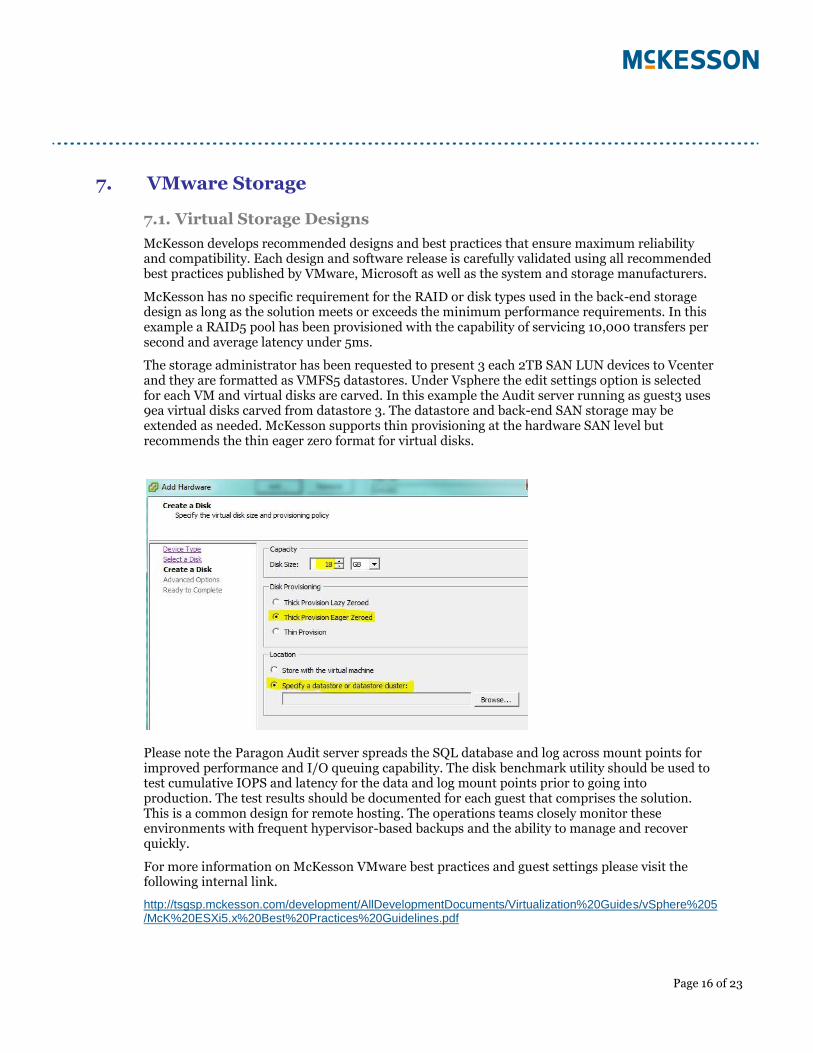
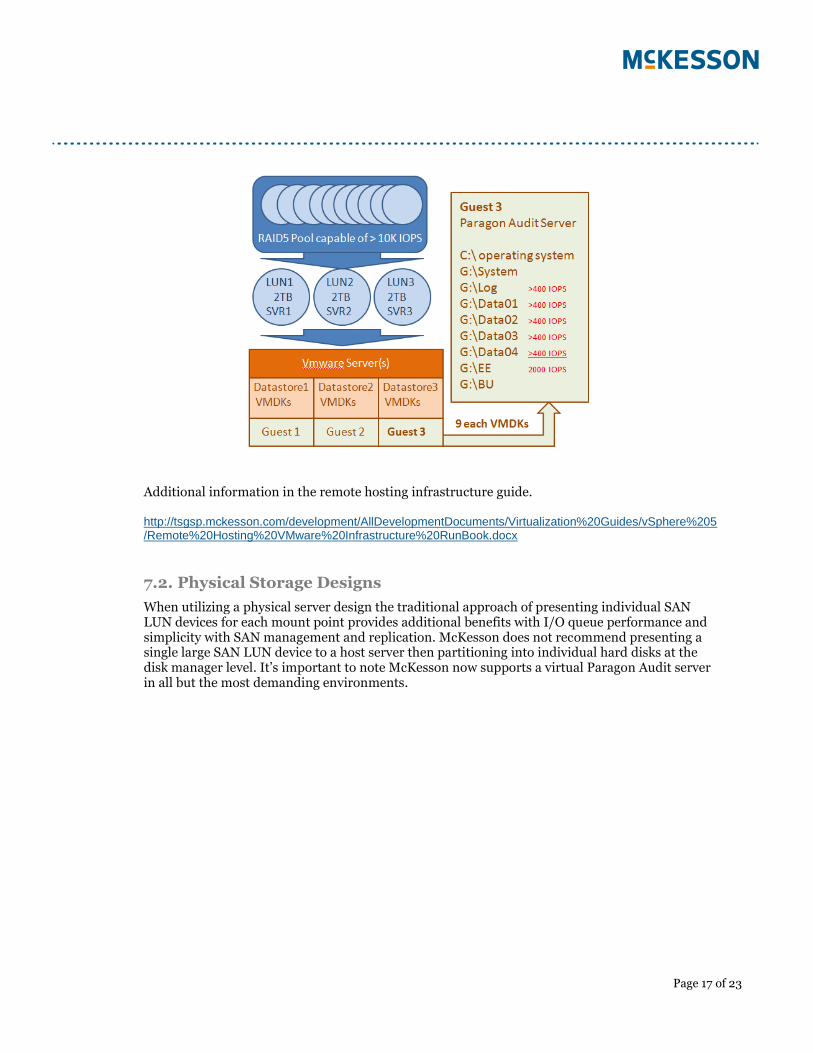
The storage administrator has been requested to present 3 each 2TB SAN LUN devices to Vcenter and they are formatted as VMFS5 datastores. Under Vsphere the edit settings option is selected for each VM and virtual disks are carved. In this example the Audit server running as guest3 uses 9ea virtual disks carved from datastore 3. The datastore and back-end SAN storage may be extended as needed. McKesson supports thin provisioning at the hardware SAN level but recommends the thin eager zero format for virtual disks.
Please note the Paragon Audit server spreads the SQL database and log across mount points for improved performance and I/O queuing capability. The disk benchmark utility should be used to test cumulative IOPS and latency for the data and log mount points prior to going into production. The test results should be documented for each guest that comprises the solution. This is a common design for remote hosting. The operations teams closely monitor these environments with frequent hypervisor-based backups and the ability to manage and recover quickly.
For more information on McKesson VMware best practices and guest settings please visit the following internal link.
http://tsgsp.mckesson.com/development/AllDevelopmentDocuments/Virtualization%20Guides/vSphere%205/McK%20ESXi5.x%20Best%20Practices%20Guidelines.pdf
Page 17 of 23
Additional information in the remote hosting infrastructure guide. http://tsgsp.mckesson.com/development/AllDevelopmentDocuments/Virtualization%20Guides/vSphere%205/Remote%20Hosting%20VMware%20Infrastructure%20RunBook.docx
7.2. Physical Storage Designs
When utilizing a physical server design the traditional approach of presenting individual SAN LUN devices for each mount point provides additional benefits with I/O queue performance and simplicity with SAN management and replication. McKesson does not recommend presenting a single large SAN LUN device to a host server then partitioning into individual hard disks at the disk manager level. It’s important to note McKesson now supports a virtual Paragon Audit server in all but the most demanding environments.

Page 18 of 23
7.3. RDM Raw Device Maps and Cluster Considerations
McKesson supports a virtual Microsoft cluster design that requires RDM raw devices mapped to back-end SAN LUNs. This allows the cluster software exclusive access to the SCSI devices. This overall configuration provides application high availability and the ability to perform rolling software upgrades at the cost of more complexity in implementation and administration.
For more detailed information please reference the hypervisor, cluster and storage guides from the following internal location. http://tinyurl.com/MCKVIRTUAL
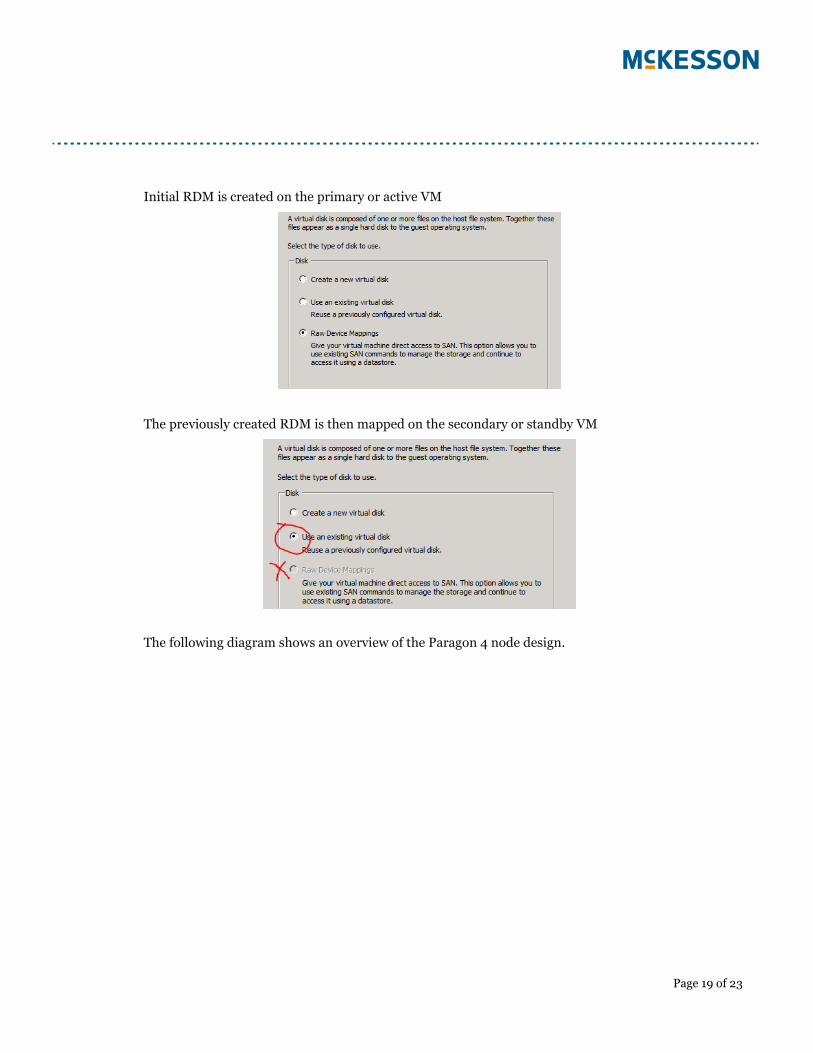
The following diagram shows how SAN devices are presented to the ESX servers then provisioned as an RDM on the primary active cluster VM followed by mapping the same *.vmdk mapping file to the secondary failover VM. The vmdk virtual disk file will by default be stored on the same OS_Base datastore used by the VM. The result in this example is 9 RDM mapping files located in the primary VM folder.
Page 19 of 23
Initial RDM is created on the primary or active VM
The previously created RDM is then mapped on the secondary or standby VM
The following diagram shows an overview of the Paragon 4 node design.

Page 20 of 23
7.4. SCSI Addressing and Settings
The recommended best practice is to reserve the default SCSI0 virtual controller for operating system and misc virtual disks. The remaining RDM and data disks containing application data will be evenly distributed across the target address range of SCSI controllers 1,2 an 3. With ESX 5.5 the SCSI Paravirtual feature is not supported for clustered systems. All four controllers will remain in the default LSI mode.
7.5. Native Multipath
Native multipath is the recommended option for most customers although some will chose 3rd party software from EMC or other storage manufacturers. When using native multipath both round robin PSP and most recently used path selection options are supported. Storage arrays

Page 21 of 23
supporting ALUA mode may benefit from I/O distribution across all SAN paths. Multipath for standard virtual disks are managed at the datastore level but RDM raw devices will be managed in the VSphere client edit settings for each hard disk. Prior to 5.5 the most recent path selection was the only supported option for RDM raw devices. That restriction has been lifted in current versions.
Round Robin vs Most Recent Path Performance
With ESX 5.5 and above round robin multipath is supported with RDM devices. Running round robin RDMs with previous versions was unsupported and may experience degraded performance. With ESX 5.5 and above performance should increase with round robin for RDM devices. The following test was performed on EMC VNX, EMC XTremIO and HP 3PAR with similar results. Not a single test with round robin indicated a performance degradation and the IO traffic was more evenly distributed across SAN fibre host paths.
7.6. Physical vs Virtual SAN Performance
This performance test was performed on a traditional EMC VNX-5500 pool to compare physical and virtual server performance. In this case write performance is more robust on the physical server. Even with this limitation most current generation storage solutions far exceed the application requirements on a virtual platform.

Page 22 of 23
7.7. Performance of Single vs Multiple Devices
It may be possible to achieve higher performance using individual datastores. This is typically not required in virtual designs but important to note a device being overloaded with IO workloads may benefit from being migrated to a separate datastore. For the same reasons having multiple SCSI devices will usually perform at a higher level and absorb heavier workloads than a single large device partitioned into smaller containers. If a single device has an IO queue depth of 64 then 8 devices will be much better served using their own dedicated queue depth rather than 8 devices sharing a single queue.

Page 23 of 23
7.8. Multiple Host IO Contention
In this study an additional full workload added from a second Paragon DB server showed some performance degradation but the overall write capability held steady and overall performance remained far above acceptable levels.
7.9. Paravirtual SCSI Perfomance Comparison
By enabling the Paravirtual SCSI feature for the virtual SCSI controllers the hypervisor and guest operating system are able to utilize the high performance host drivers. This results in a considerable performance boost for virtual disks. As of ESX 5.5 the feature is not supported with RDM devices.


