S. Naga Sujani, K. Phanisha, N. Mohana Rupa, Sunita Sarkar, M.Nageswari, P.Poluraju/ International Journal of Engineering Research and Applications (IJERA) ISSN: 2248-9622 www.ijera.comVol. 2, Issue 2, Mar-Apr 2012, pp.832-837832 | P a g e Determinati on of Performance Level of G+5 Building Situated In Zone III Using Pushover Analysis by Sap2000S. Naga Sujani * , K. Phanisha * , N. Mohana Rupa * , Sunita Sarkar * , M.Nageswari * , P.Poluraju ** *(student, Department of Civil engineering, KL University, Guntur, AP, and India) ** (Assistant professor, Department of Civil engineering, KL University, Guntur, AP, and India) A BSTRACT Earthquakes are very common in every part of the world. Geographical statistics of India show that almost 54% of the land is vulnerable to earthquakes. A World Bank & United Nations report estimates that around 200 million city dwellers in India will be exposed to earthquakes by 2050.Due to these earthquakes large destruction was caused to the infrastructure and buildings.In order to resist the buildings from the severe motions many analysis methods were developed. Pushover analysis is a method to evaluate the performance level of building. In this paper, pushover analysis is carried out for a G+5 building situated in ZONE III to check the seismicity effect and performance level of a building by SAP2000.Pushover Analysis produces a Pushover curve consists of capacity spectrum, demand spectrum and performance point. It shows the performance level of the building components and also maximum base shear carrying capacity of the structure. From the result shown that demand curve intersects the capacity curve between the point B and C i.e. life safety level. Therefore, some residual strength and stiffness left in all stories. Damage to partitions. Building may be beyond economical repair. In some building parts need to be retrofitted. Keywords-Capacity curve, Demand curve, Pushover analysis, Rehabilitation, Retrofitting. 1.INTRODUCTION Indian buildings built over past two decades are seismically deficient because of lack of awareness regarding seismic behavior of structures. In general, most earthquake code provisions implicitl y require that str uctures be able to resist minor earthquakes without any damage, moderate earthquakes with negligible structural damage and some nonstructural damage, and major earthquakes with possibly some structural and nonstructural damage. In most structures that are subjected to moderate-to strong earthquakes, economical earthquake-resistant design is achieved by allowing yielding to take place in some structural members. Estimating the maximum lateral displacement of the structures in the wake of massive earthquakes is considered to be widely important for seismic design. Due to economic reason, the present seismic codes allow structures to undergo inelastic deformations in the event of strong ground motions. Consequently, the demand lateral strength is lower than the strength maintaining the structure in the elastic range. According to the seismic codes, the buildings are allowed to use over strength against strong earthquakes. It is well known fact that the distribution of mass and rigidity is one of the major considerations in the seismic design of moderate to high rise buildings. Invariably these factors introduce coupling effects and non linearity in the system; hence it is imperative to use pushover analysis approach by using SAP2000.This paper highlights the performance evaluation of a structure subjected to seismic loads and Step by step procedure of the pushover analysis to determine the capacity curve, demand curve and performance point. In present study a model was designed in SAP2000 and step by step procedure was followed to get capacity curve and demand curve. 1.1Pushover analysis The pushover analysis of a structure is a static non-linearanalysis under permanent vertical loads and gradually increasing lateral loads [1]. The equivalent static lateral loads approximately represent earthquake induced forces. A plot of the total base shear versus top displacement in a structure is obtained by this analysis that would indicate any premature failure or weakness. The analysis is carried out up to failure, thus it enables determination of collapse load and ductility capacity. On a building frame, and plastic rotation is monitored, and lateral inelastic forces versus displacement response for the complete structure is analytically computed. This type of analysis enables weakness in the structure to be identified. Consequently, at each event, the structures experiences a stiffness change as shown in Fig 1, where IO,LS and CP stand for immediate occupancy, life safety and collapse prevention respectively. Fig.1 Load–Deformation curve [2]
S. Naga Sujani, K. Phanisha, N. Mohana Rupa, Sunita Sarkar, M.Nageswari, P.Poluraju/ International
Journal of Engineering Research and Applications (IJERA) ISSN: 2248-9622 www.ijera.com Vol. 2, Issue 2, Mar-Apr 2012, pp.832-837
832 | P a g e
Determination of Performance Level of G+5 Building Situated In Zone
III Using Pushover Analysis by Sap2000
S. Naga Sujani
*
, K. Phanisha
*
, N. Mohana Rupa
*
, Sunita Sarkar
*
, M.Nageswari
*
,P.Poluraju
**
*(student, Department of Civil engineering, KL University, Guntur, AP, and India)
** (Assistant professor, Department of Civil engineering, KL University, Guntur, AP, and India)
ABSTRACTEarthquakes are very common in every part of the
world. Geographical statistics of India show that almost
54% of the land is vulnerable to earthquakes. A World
Bank & United Nations report estimates that around 200
million city dwellers in India will be exposed to
earthquakes by 2050. Due to these earthquakes largedestruction was caused to the infrastructure and
buildings. In order to resist the buildings from the severe
motions many analysis methods were developed.
Pushover analysis is a method to evaluate the
performance level of building. In this paper, pushover
analysis is carried out for a G+5 building situated in
ZONE III to check the seismicity effect and performance
level of a building by SAP2000. Pushover Analysis
produces a Pushover curve consists of capacity
spectrum, demand spectrum and performance point. It
shows the performance level of the building components
and also maximum base shear carrying capacity of the
structure. From the result shown that demand curveintersects the capacity curve between the point B and C
i.e. life safety level. Therefore, some residual strength
and stiffness left in all stories. Damage to partitions.
Building may be beyond economical repair. In some
building parts need to be retrofitted.
Keywords - Capacity curve, Demand curve, Pushover
analysis, Rehabilitation, Retrofitting.
1. INTRODUCTIONIndian buildings built over past two decades are seismically
deficient because of lack of awareness regarding seismic
behavior of structures. In general, most earthquake code provisions implicitly require that structures be able to resist
minor earthquakes without any damage, moderate
earthquakes with negligible structural damage and somenonstructural damage, and major earthquakes with possibly
some structural and nonstructural damage. In most
structures that are subjected to moderate-to strong
earthquakes, economical earthquake-resistant design is
achieved by allowing yielding to take place in some
structural members. Estimating the maximum lateraldisplacement of the structures in the wake of massive
earthquakes is considered to be widely important for seismic
design. Due to economic reason, the present seismic codes
allow structures to undergo inelastic deformations in theevent of strong ground motions. Consequently, the demand
lateral strength is lower than the strength maintaining the
structure in the elastic range. According to the seismic
codes, the buildings are allowed to use over strength againststrong earthquakes. It is well known fact that the distribution
of mass and rigidity is one of the major considerations in the
seismic design of moderate to high rise buildings. Invariably
these factors introduce coupling effects and non linearity in
the system; hence it is imperative to use pushover analysisapproach by using SAP2000.This paper highlights the performance evaluation of a structure subjected to seismic
loads and Step by step procedure of the pushover analysis to
determine the capacity curve, demand curve and
performance point. In present study a model was designed in
SAP2000 and step by step procedure was followed to get
capacity curve and demand curve.
1.1 Pushover analysis
The pushover analysis of a structure is a static non-linear
analysis under permanent vertical loads and gradually
increasing lateral loads [1]. The equivalent static lateral
loads approximately represent earthquake induced forces. A plot of the total base shear versus top displacement in a
structure is obtained by this analysis that would indicate any
premature failure or weakness. The analysis is carried out up
to failure, thus it enables determination of collapse load and
ductility capacity. On a building frame, and plastic rotationis monitored, and lateral inelastic forces versus displacement
response for the complete structure is analytically computed.
This type of analysis enables weakness in the structure to be
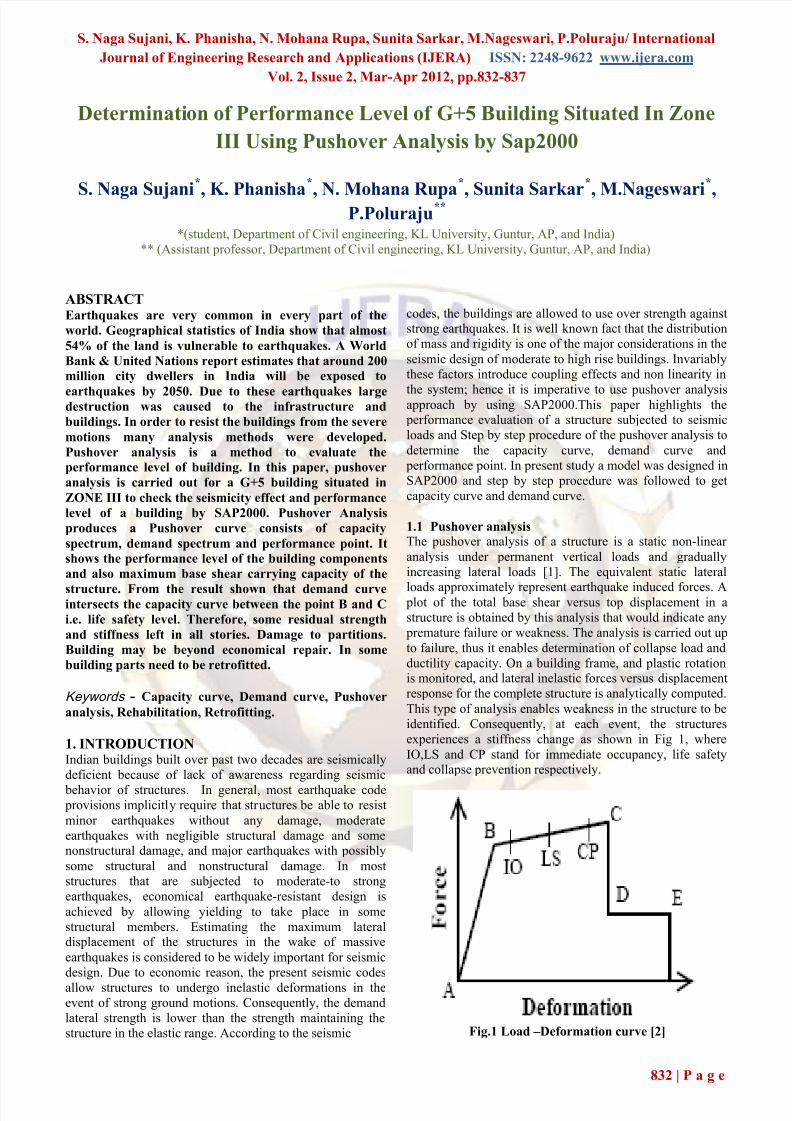
identified. Consequently, at each event, the structures
experiences a stiffness change as shown in Fig 1, where
IO,LS and CP stand for immediate occupancy, life safetyand collapse prevention respectively.
S. Naga Sujani, K. Phanisha, N. Mohana Rupa, Sunita Sarkar, M.Nageswari, P.Poluraju/ International
Journal of Engineering Research and Applications (IJERA) ISSN: 2248-9622 www.ijera.com Vol. 2, Issue 2, Mar-Apr 2012, pp.832-837
833 | P a g e
1.1.1 Capacity
The overall capacity of a structure depends on the strength
and deformation capacities of the individual components of the structure. The mathematical model of the structure is
modified to account for reduced resistance of yielding
components. A lateral force distribution is again applied
until predetermined limit is reached. Pushover capacitycurves approximate how structure behaves after exceeding
the elastic limits.
1.1.2 Demand
Ground motions during an earthquake produce complex
horizontal displacement patterns in structure that may vary
with time. For nonlinear method it is easier and more direct
to use a set of lateral displacement as a design condition for
a given structure and ground motion, the displacement is an
estimate of the maximum expected response of the building
during ground motion.
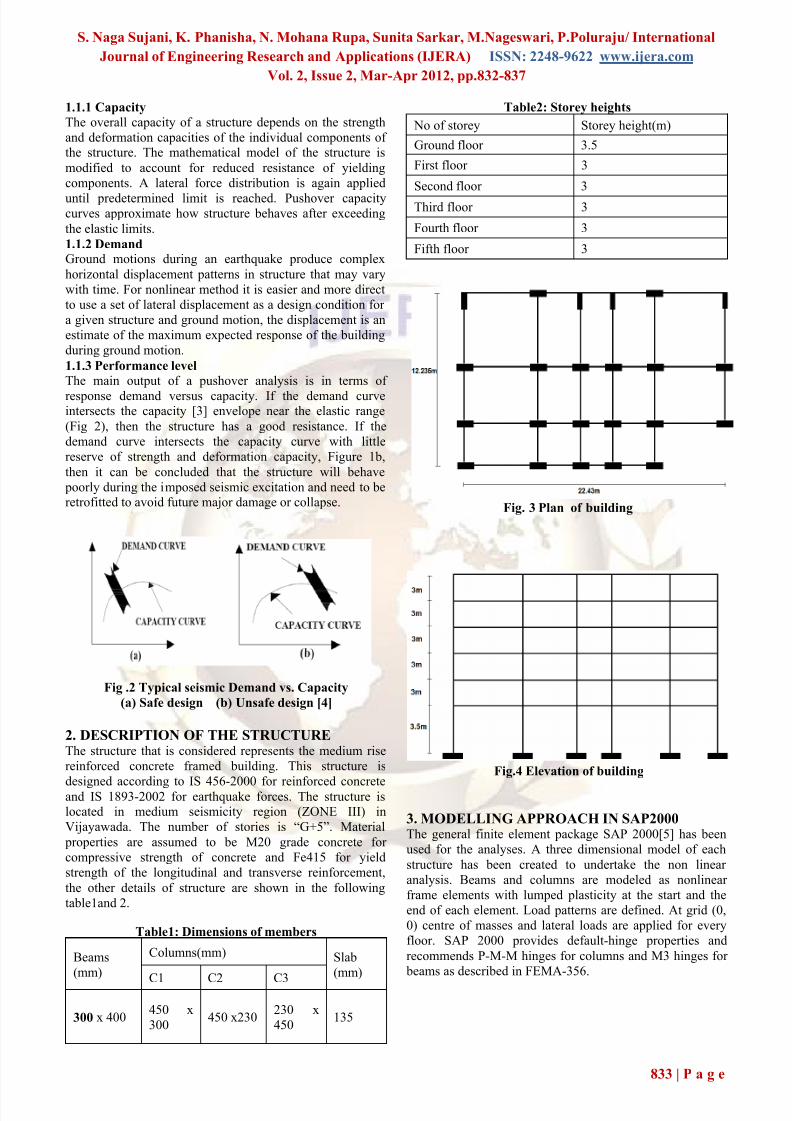
1.1.3 Performance level
The main output of a pushover analysis is in terms of
response demand versus capacity. If the demand curveintersects the capacity [3] envelope near the elastic range
(Fig 2), then the structure has a good resistance. If the
demand curve intersects the capacity curve with little
reserve of strength and deformation capacity, Figure 1b,
then it can be concluded that the structure will behave
poorly during the imposed seismic excitation and need to be
retrofitted to avoid future major damage or collapse.
Fig .2 Typical seismic Demand vs. Capacity
(a) Safe design (b) Unsafe design [4]
2. DESCRIPTION OF THE STRUCTUREThe structure that is considered represents the medium rise
reinforced concrete framed building. This structure is
designed according to IS 456-2000 for reinforced concreteand IS 1893-2002 for earthquake forces. The structure islocated in medium seismicity region (ZONE III) in
Vijayawada. The number of stories is “G+5”. Material
properties are assumed to be M20 grade concrete for
compressive strength of concrete and Fe415 for yield
strength of the longitudinal and transverse reinforcement,
the other details of structure are shown in the following
table1and 2.
Table1: Dimensions of members
Beams
(mm)
Columns(mm) Slab
(mm)C1 C2 C3
300 x 400450 x
300450 x230
230 x
450135
Table2: Storey heights
No of storey Storey height(m)
Ground floor 3.5
First floor 3
Second floor 3
Third floor 3
Fourth floor 3
Fifth floor 3
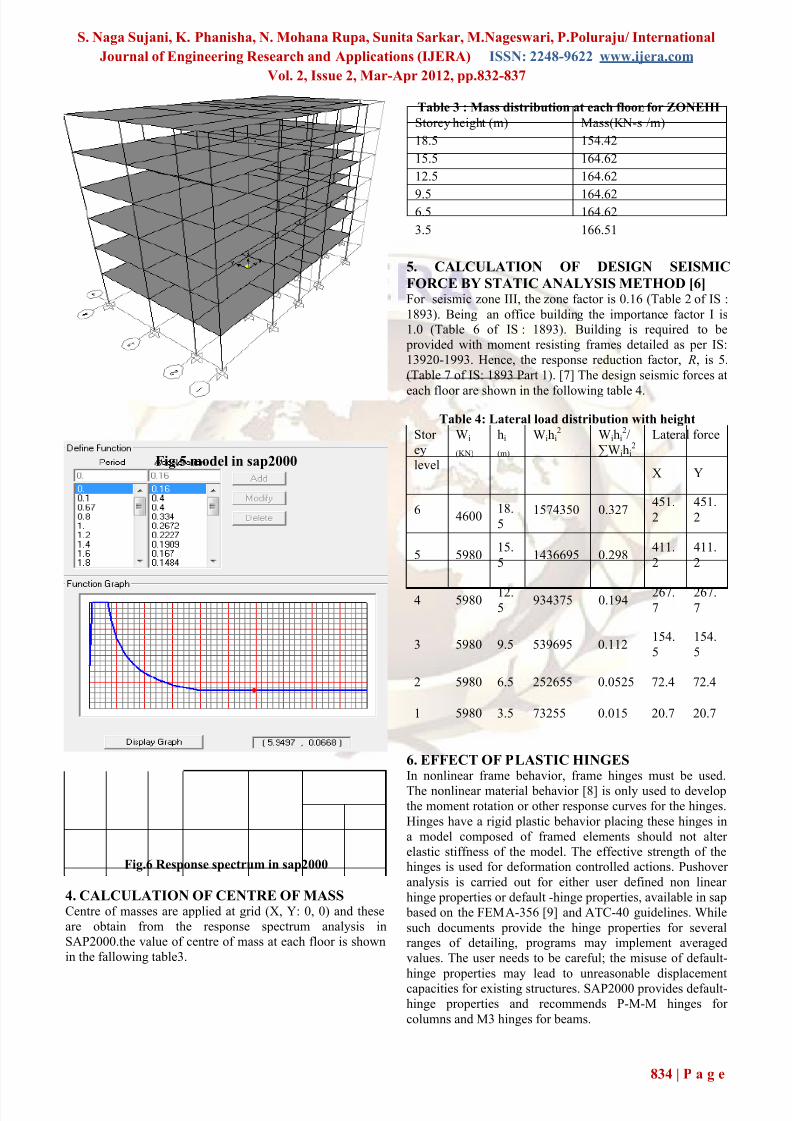
Fig. 3 Plan of building
Fig.4 Elevation of building
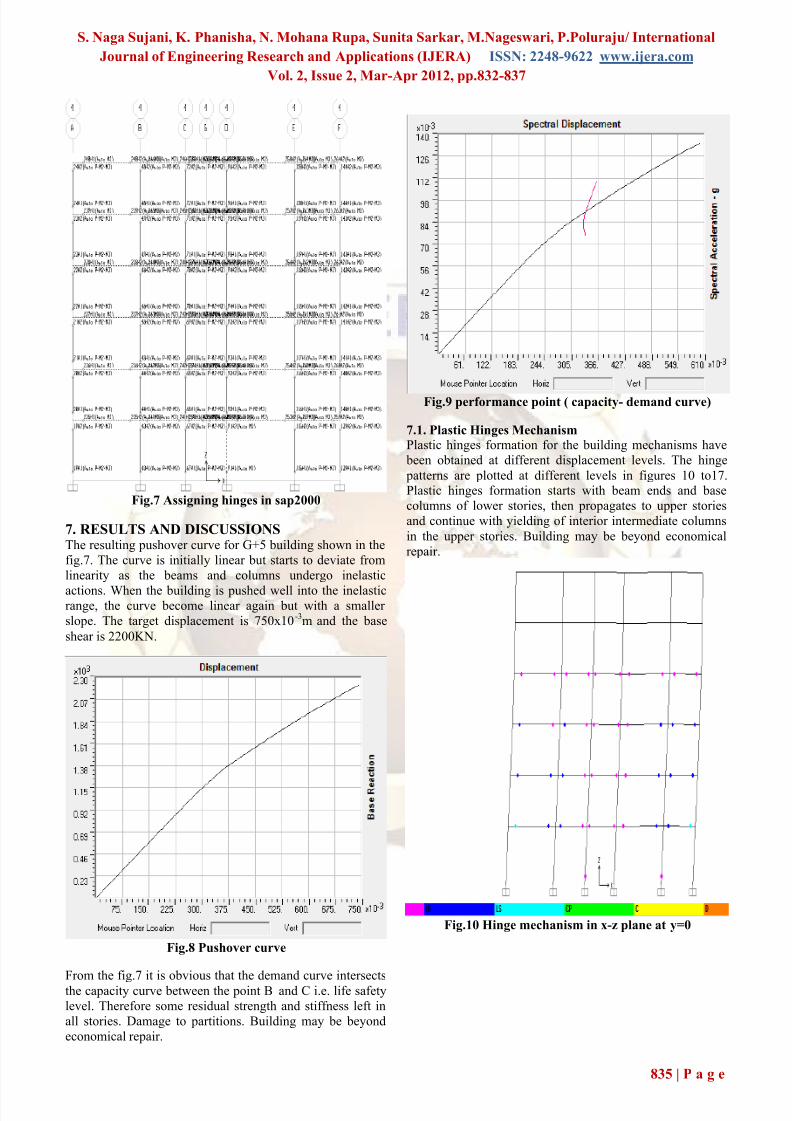
3. MODELLING APPROACH IN SAP2000The general finite element package SAP 2000[5] has been
used for the analyses. A three dimensional model of each
structure has been created to undertake the non linear
analysis. Beams and columns are modeled as nonlinear
frame elements with lumped plasticity at the start and the
end of each element. Load patterns are defined. At grid (0,
0) centre of masses and lateral loads are applied for every
floor. SAP 2000 provides default-hinge properties and
recommends P-M-M hinges for columns and M3 hinges for