21
El IMPACTO DE UN FTA ENTRE EU Y RSA SOBRE BOTSWANA ANÁLISIS DEL EXP Nº 4 Junio 2006

El IMPACTO DE UN FTA ENTRE EU Y RSA SOBRE BOTSWANA
ANÁLISIS DEL EXP Nº 4
Junio 2006

Model RegionModel Region Model CommoditiesModel Commodities
bwa bwa BotswanaBotswana cropscrops cropscrops
xscxsc Rest of SACURest of SACU aagaag Animal AgricultureAnimal Agriculture
sadsad SADCSADC minemine MineralsMinerals
xafxaf Rest of AfricaRest of Africa foodfood FoodFood
eureur EuropeEurope textex TextilesTextiles
nafnaf NAFTANAFTA hmanhman Heavy ManufacturesHeavy Manufactures
mermer MERCOSURMERCOSUR lmanlman Light ManufacturesLight Manufactures
xeuxeu Rest of EuropeRest of Europe utilsutils UtilitiesUtilities
xamxam Rest of AmericasRest of Americas cnscns ConstructionConstruction
xwoxwo Rest of WorldRest of World servserv ServicesServices
Model Commodities and Regions

Model and Closure
The model is an adaptation of the GTAP comparative static CGE model
The standard closure rules for the GTAP model were adjusted to provide a better reflection of the economies in southern Africa.
Three fundamental changes were made to the closure: Fixing the trade balance, unskilled labour, prices and quantities on the world market of certain special commodities.
Experimento Nº 4
Liberalización parcial, eliminación del 50% de aranceles de EU sobre sus importaciones (de RSA) de productos alimenticios y agrícolas y reducción 100% sobre otros productos.

PRINCIPALES RESULTADOS

Changes in Real GDP %qgdp (Sim)bwa -0.001 4,619 4,619 0xsc 0.628 138,762 139,633 871sad -0.008 39,336 39,333 -3xaf -0.003 369,280 369,269 -11eur 0.004 7,958,080 7,958,381 302naf 0 8,965,226 8,965,220 -6mer -0.001 1,134,726 1,134,710 -16xeu -0.001 709,675 709,665 -10xam -0.001 375,132 375,130 -2xwo -0.002 9,286,855 9,286,680 -175
Partial Liberalisation

Welfare decomposition (PL)WELFARE 1 alloc_A1 2 endw_B1 3 tech_C1 4 pop_D1 5 tot_E1 6 IS_F1 7 pref_G1 8 taxpool Total1 bwa 0.35 -0.39 0 0 0.18 10.72 -0.07 -53.72 -42.932 xsc 161.45 708.74 0 0 -182.57 44.12 7.49 53.63 792.863 sad -2.46 -0.72 0 0 6.98 0.8 0 0 4.64 xaf -4.44 -6.85 0 0 -7.79 -0.97 0 0 -20.055 eur 301.72 0 0 0 496.14 -27.37 0 0 770.496 naf -6.47 0 0 0 -67.04 -17.91 0 0 -91.427 mer -16.01 0 0 0 -24.76 -9.14 0 0 -49.918 xeu -10.13 0 0 0 -40.71 -0.39 0 0 -51.239 xam -1.99 0 0 0 -7.02 -2.58 0 0 -11.5910 xwo -69.71 -105.18 0 0 -174.22 2.94 0 0 -346.16Total 352.31 595.59 0 0 -0.83 0.23 7.43 -0.09 954.65

Terms of trade effect (PL)TOT 1 bwa 2 xsc 3 sad 4 xaf 5 eur 6 naf 7 mer 8 xeu 9 xam 10 xwo Total
1 crops -0.05 7.36 -1.9 -1.29 4.9 -4.28 -3.78 0.09 -2.43 2.38 0.992 aag -0.01 0.32 -0.02 -0.02 0.74 -0.31 -0.18 -0.14 -0.02 -0.24 0.133 mine 0 5.07 -1.59 -2.4 0.23 3.21 -0.65 1.03 -2.25 -3.12 -0.464 food 0.06 -31.23 -0.57 -0.15 37.38 -1.87 -5.53 -1.3 -0.67 1.31 -2.585 tex -0.01 -8.05 0.59 -0.95 20.61 8.2 -1.33 -2.52 -0.38 -18 -1.846 hman 0.34 -81.6 5.2 -0.41 86.58 -7.05 -4.56 -13.97 0.05 12.81 -2.627 lman 0.17 -52.01 7.84 -0.87 174.18 -23.09 -3.71 -18.2 1.57 -90.18 -4.298 utils 0 -1.08 -0.11 -0.05 2.31 -0.15 0.15 -0.53 -0.23 -0.3 0.029 cns -0.01 -0.13 -0.05 -0.03 4.48 -0.48 -0.02 -0.19 -0.02 -3.55 -0.0110 serv -0.2 -21.74 -2.35 -1.63 164.73 -41.23 -5.19 -4.99 -2.65 -75.34 9.41Total 0.28 -183.09 7.03 -7.8 496.16 -67.05 -24.79 -40.73 -7.03 -174.22 -1.24
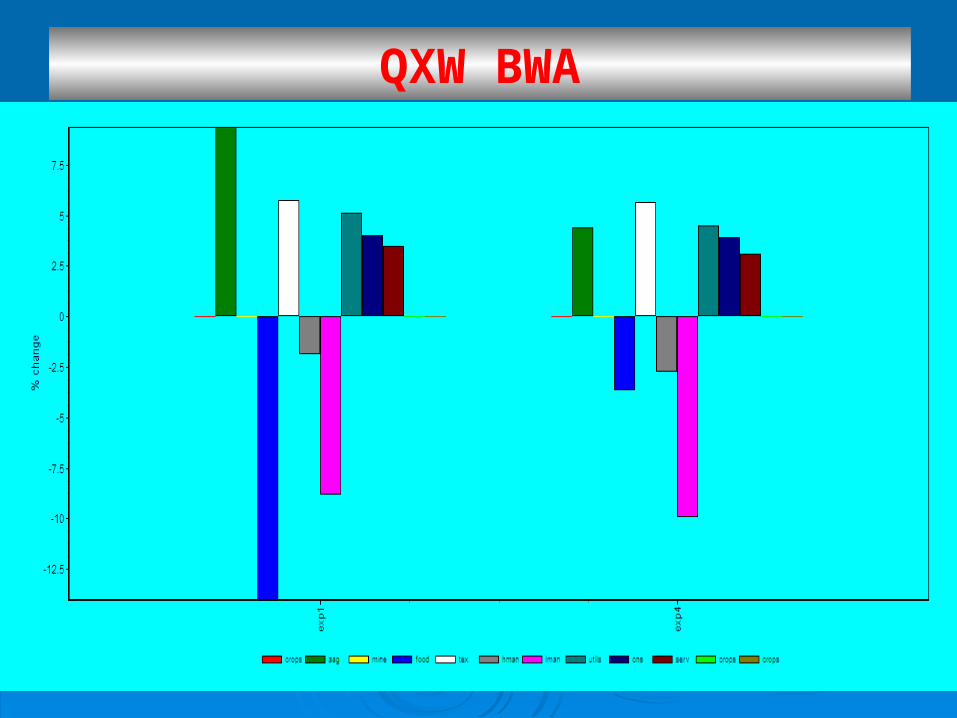
QXW BWA
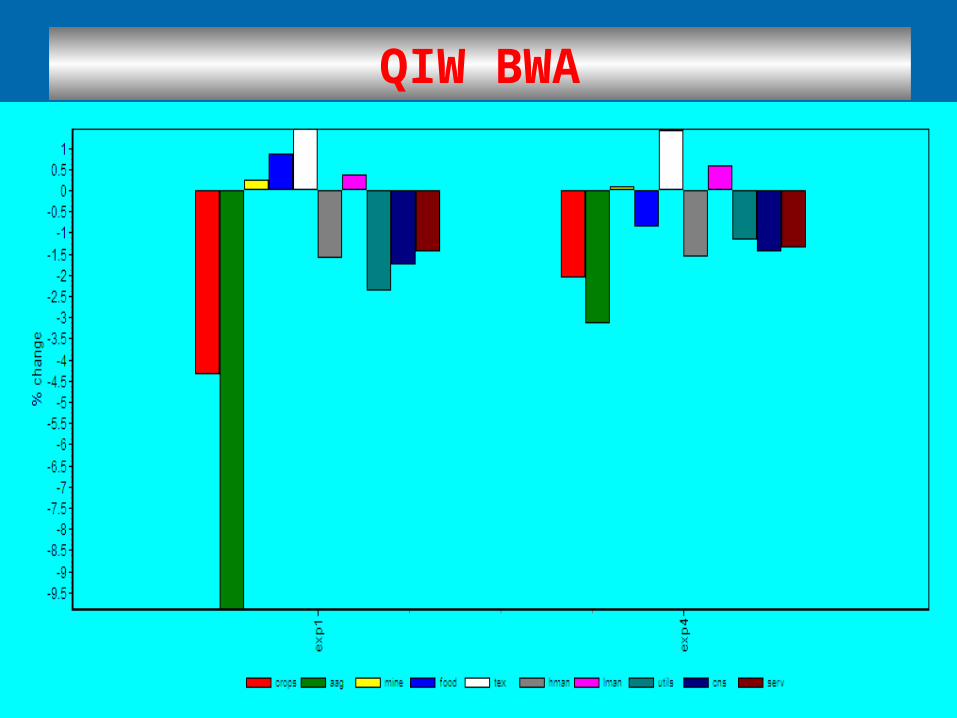
QIW BWA

QXW XSC

QIW XSC

QXW EUR
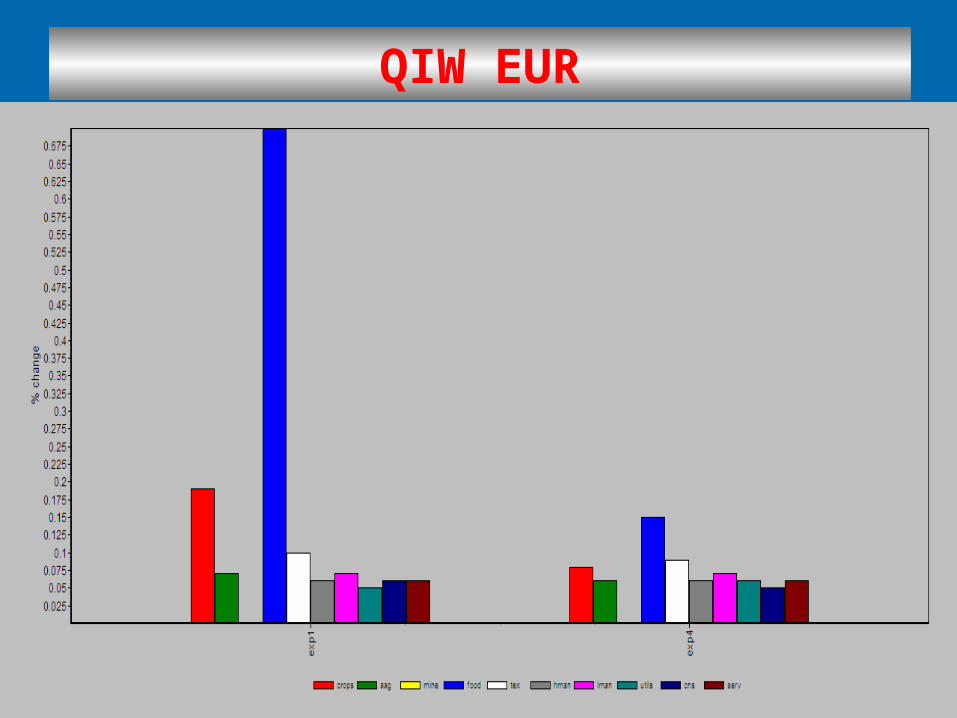
QIW EUR

QVA BWA

QVA XSC
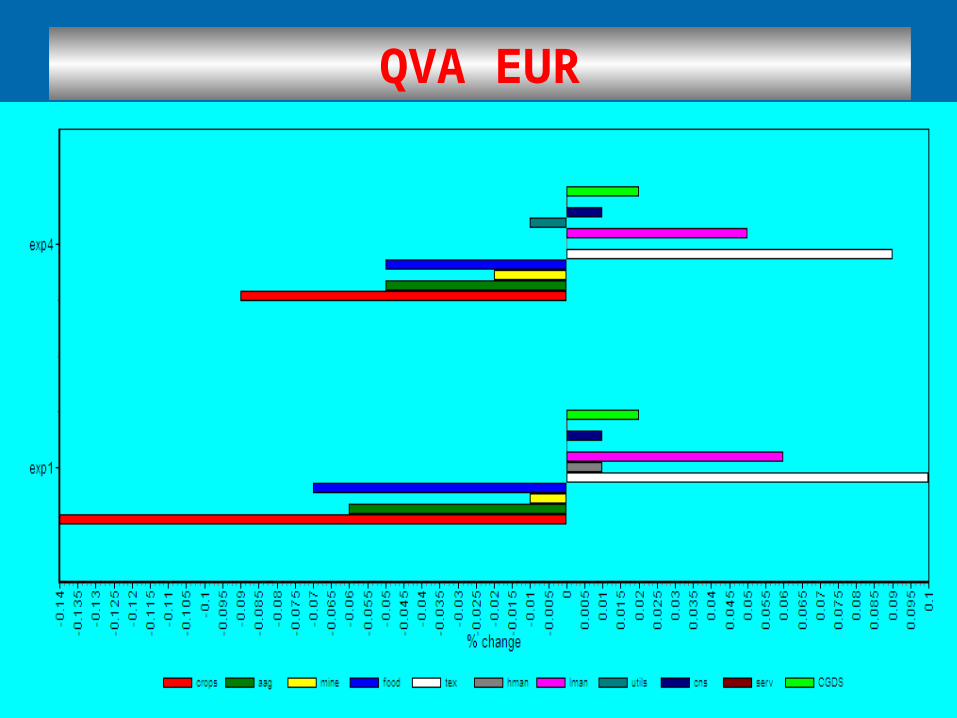
QVA EUR

MUCHAS MUCHAS GRACIASGRACIAS
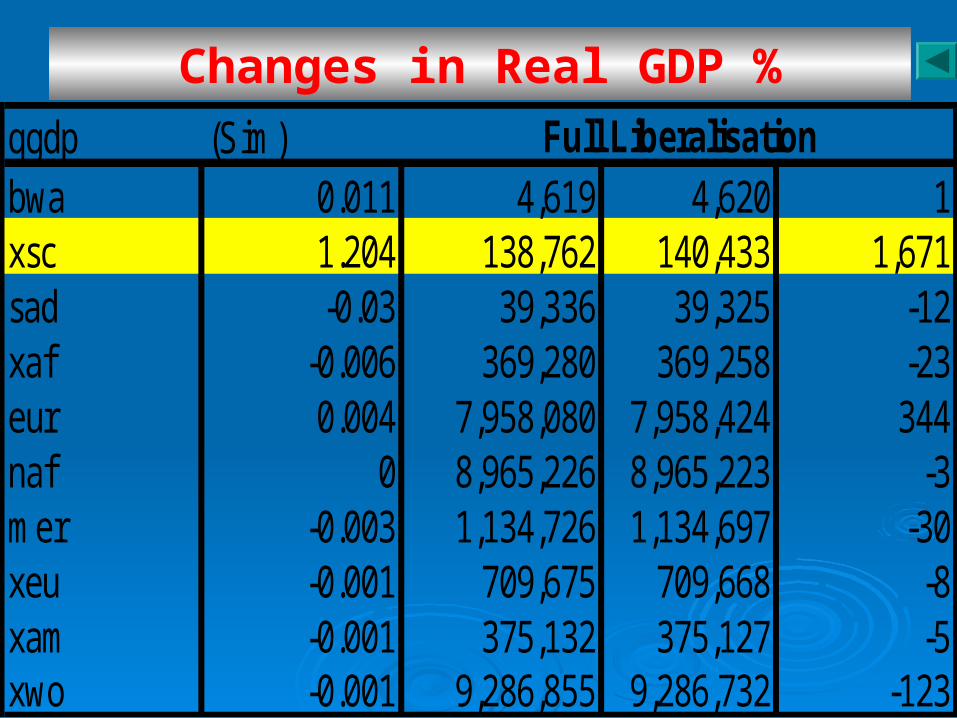
Changes in Real GDP %qgdp (Sim)bwa 0.011 4,619 4,620 1xsc 1.204 138,762 140,433 1,671sad -0.03 39,336 39,325 -12xaf -0.006 369,280 369,258 -23eur 0.004 7,958,080 7,958,424 344naf 0 8,965,226 8,965,223 -3mer -0.003 1,134,726 1,134,697 -30xeu -0.001 709,675 709,668 -8xam -0.001 375,132 375,127 -5xwo -0.001 9,286,855 9,286,732 -123
Full Liberalisation
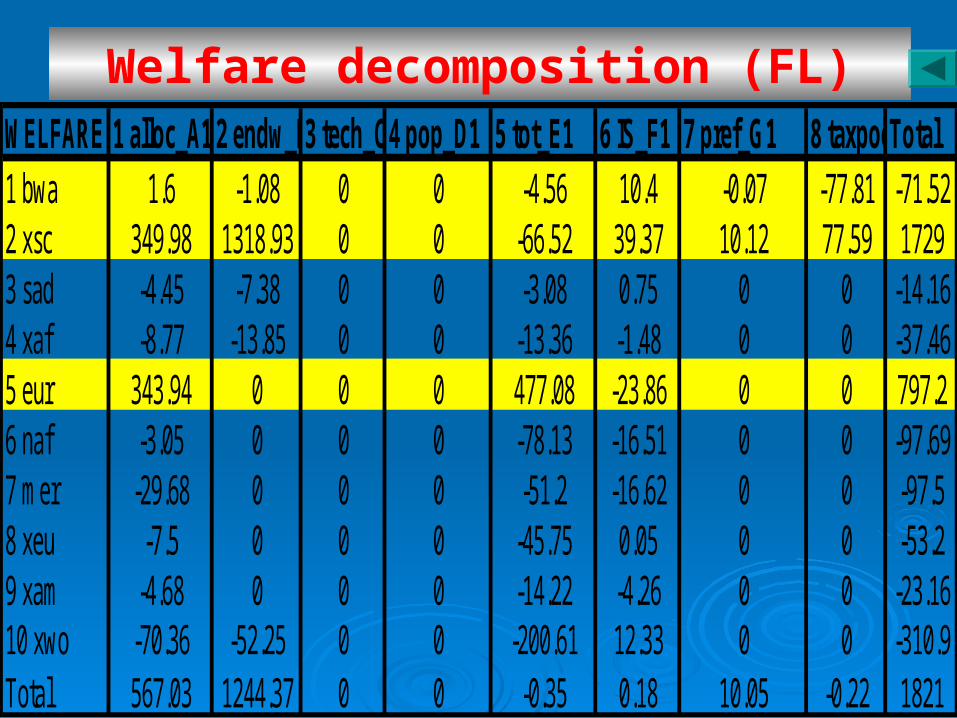
Welfare decomposition (FL)WELFARE 1 alloc_A1 2 endw_B13 tech_C14 pop_D1 5 tot_E1 6 IS_F1 7 pref_G1 8 taxpoolTotal1 bwa 1.6 -1.08 0 0 -4.56 10.4 -0.07 -77.81 -71.522 xsc 349.98 1318.93 0 0 -66.52 39.37 10.12 77.59 17293 sad -4.45 -7.38 0 0 -3.08 0.75 0 0 -14.164 xaf -8.77 -13.85 0 0 -13.36 -1.48 0 0 -37.465 eur 343.94 0 0 0 477.08 -23.86 0 0 797.26 naf -3.05 0 0 0 -78.13 -16.51 0 0 -97.697 mer -29.68 0 0 0 -51.2 -16.62 0 0 -97.58 xeu -7.5 0 0 0 -45.75 0.05 0 0 -53.29 xam -4.68 0 0 0 -14.22 -4.26 0 0 -23.1610 xwo -70.36 -52.25 0 0 -200.61 12.33 0 0 -310.9Total 567.03 1244.37 0 0 -0.35 0.18 10.05 -0.22 1821
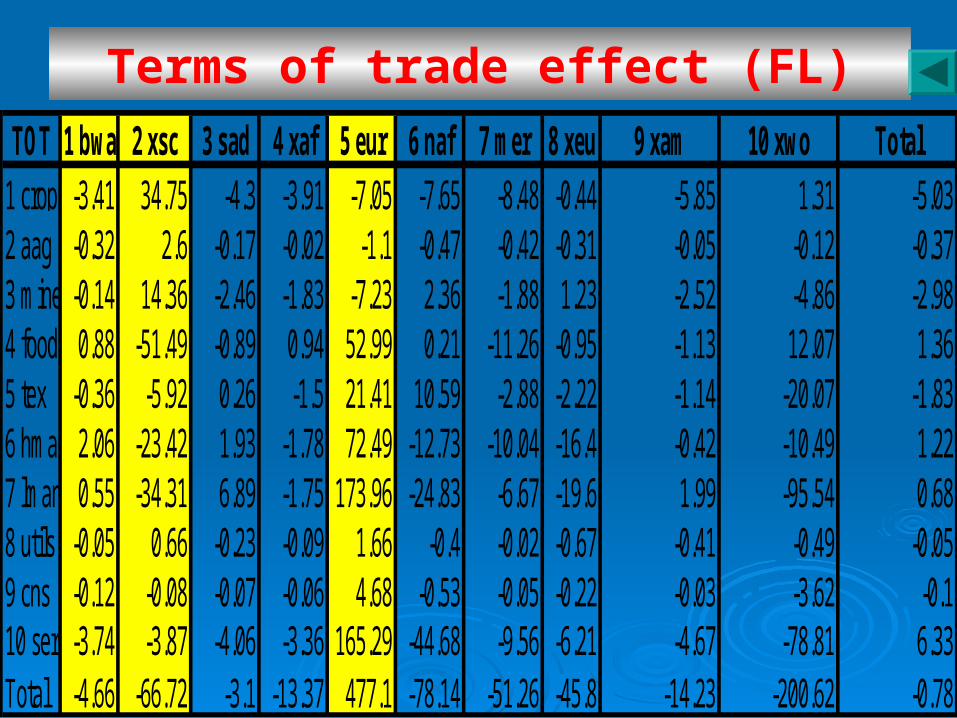
Terms of trade effect (FL)TOT 1 bwa 2 xsc 3 sad 4 xaf 5 eur 6 naf 7 mer 8 xeu 9 xam 10 xwo Total
1 crops -3.41 34.75 -4.3 -3.91 -7.05 -7.65 -8.48 -0.44 -5.85 1.31 -5.032 aag -0.32 2.6 -0.17 -0.02 -1.1 -0.47 -0.42 -0.31 -0.05 -0.12 -0.373 mine -0.14 14.36 -2.46 -1.83 -7.23 2.36 -1.88 1.23 -2.52 -4.86 -2.984 food 0.88 -51.49 -0.89 0.94 52.99 0.21 -11.26 -0.95 -1.13 12.07 1.365 tex -0.36 -5.92 0.26 -1.5 21.41 10.59 -2.88 -2.22 -1.14 -20.07 -1.836 hman 2.06 -23.42 1.93 -1.78 72.49 -12.73 -10.04 -16.4 -0.42 -10.49 1.227 lman 0.55 -34.31 6.89 -1.75 173.96 -24.83 -6.67 -19.6 1.99 -95.54 0.688 utils -0.05 0.66 -0.23 -0.09 1.66 -0.4 -0.02 -0.67 -0.41 -0.49 -0.059 cns -0.12 -0.08 -0.07 -0.06 4.68 -0.53 -0.05 -0.22 -0.03 -3.62 -0.110 serv -3.74 -3.87 -4.06 -3.36 165.29 -44.68 -9.56 -6.21 -4.67 -78.81 6.33Total -4.66 -66.72 -3.1 -13.37 477.1 -78.14 -51.26 -45.8 -14.23 -200.62 -0.78


