25
El Niño: Implications and Scenarios for 2015/16 December 2015

El Niño: Implications and Scenarios for 2015/16
December 2015
El Niño: Summary Highlights for 2015-2016
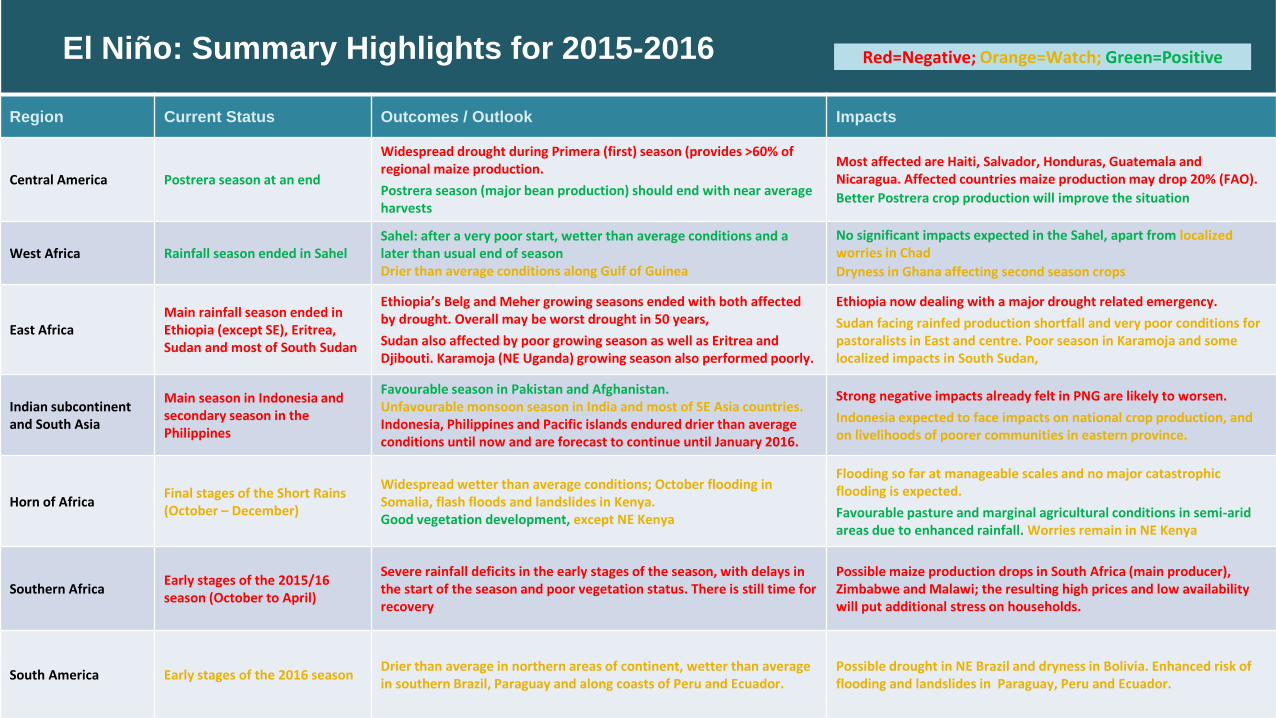
Region Current Status Outcomes / Outlook Impacts
Central America Postrera season at an end
Widespread drought during Primera (first) season (provides >60% of regional maize production.
Postrera season (major bean production) should end with near average harvests
Most affected are Haiti, Salvador, Honduras, Guatemala and Nicaragua. Affected countries maize production may drop 20% (FAO).
Better Postrera crop production will improve the situation
West Africa Rainfall season ended in SahelSahel: after a very poor start, wetter than average conditions and a later than usual end of seasonDrier than average conditions along Gulf of Guinea
No significant impacts expected in the Sahel, apart from localized worries in Chad
Dryness in Ghana affecting second season crops
East AfricaMain rainfall season ended in Ethiopia (except SE), Eritrea, Sudan and most of South Sudan
Ethiopia’s Belg and Meher growing seasons ended with both affected by drought. Overall may be worst drought in 50 years,
Sudan also affected by poor growing season as well as Eritrea and Djibouti. Karamoja (NE Uganda) growing season also performed poorly.
Ethiopia now dealing with a major drought related emergency.
Sudan facing rainfed production shortfall and very poor conditions for pastoralists in East and centre. Poor season in Karamoja and some localized impacts in South Sudan,
Indian subcontinent and South Asia
Main season in Indonesia and secondary season in the Philippines
Favourable season in Pakistan and Afghanistan. Unfavourable monsoon season in India and most of SE Asia countries.Indonesia, Philippines and Pacific islands endured drier than average conditions until now and are forecast to continue until January 2016.
Strong negative impacts already felt in PNG are likely to worsen.
Indonesia expected to face impacts on national crop production, and on livelihoods of poorer communities in eastern province.
Horn of AfricaFinal stages of the Short Rains (October – December)
Widespread wetter than average conditions; October flooding in Somalia, flash floods and landslides in Kenya. Good vegetation development, except NE Kenya
Flooding so far at manageable scales and no major catastrophic flooding is expected.
Favourable pasture and marginal agricultural conditions in semi-arid areas due to enhanced rainfall. Worries remain in NE Kenya
Southern AfricaEarly stages of the 2015/16 season (October to April)
Severe rainfall deficits in the early stages of the season, with delays in the start of the season and poor vegetation status. There is still time for recovery
Possible maize production drops in South Africa (main producer), Zimbabwe and Malawi; the resulting high prices and low availability will put additional stress on households.
South America Early stages of the 2016 seasonDrier than average in northern areas of continent, wetter than average in southern Brazil, Paraguay and along coasts of Peru and Ecuador.
Possible drought in NE Brazil and dryness in Bolivia. Enhanced risk of flooding and landslides in Paraguay, Peru and Ecuador.
Red=Negative; Orange=Watch; Green=Positive

The
20
15
-20
16
El N
iño
Eve
nt
The El Niño 2015-16 in the Historical Context
The 2015/16 El Niño Event
The current El Niño was officially declared in March 2015. It has just reached its peak intensity andwill now start unwinding back to neutral conditions, which will probably be reached in the secondquarter of 2016.
This El Niño event has some particular features with relevant implications for the food security ofmany populations around the globe:
• It had been in the making for a long while before its official declaration
• it is one of the strongest in the available record
• it is likely to be relatively longer lived
See next slide for a summary infographic.
El Niño Threshold
1997/981982/83 2015/16
Inter-tropical Pacific Sea Surface Temperature anomalies from 1982 to present. The current event and the two most intense events in record are highlighted. Red line is the El Niño threshold
Latest El Niño forecasts, showing the peak being reached now, followed by its steady decay.
End of the event

The
20
15
-20
16
El N
iño
Eve
nt
The El Niño 2015-16: A Long Build Up to Record Intensity
-3.0
-2.0
-1.0
0.0
1.0
2.0
3.0Jan
Fe
b
Ma
r
Ap
r
Ma
y
Jun
Jul
Au
g
Se
p
Oct
No
v
De
c
Jan
Fe
b
Ma
r
Ap
r
Ma
y
Jun
Jul
Au
g
Se
p
Oct
No
v
De
c
Jan
Fe
b
Ma
r
Ap
r
Ma
y
Jun
Jul
Au
g
Se
p
Oct
No
v
De
c
El Niño: 1997/1998 vs 2014/2015
1996/97/98
2014/15/16
Southern Africa: Drought and regional crop deficits
Nov 2014-Mar 2015
Central America: Severe drought March-July 2014
Central America: Severe drought March-July 2015
EthiopiaSevere drought March-May 2015 July-Sept 2015
Indonesia and PacificSevere drought July-Dec 2015
East AfricaFlood RiskOct-Dec 2015
Southern Africa: Likelihood of Drought Nov 2015-Mar 2016
SE AsiaDrynessJuly-Sept 2015
Senegal/Mauritania: Severe drought July-Sept 2014
El Niño Declared
A quasi El Niño before the real event
Although the current El Niño was officially declared inMarch 2015, the El Niño indicator(s) floated about thestandard El Niño declaration threshold from thesecond quarter of 2014.
In mid 2014 the probability of an El Niño event by late2014 was about 75%. The El Niño threshold wasactually exceeded in October 2014, but not all criteriawere fulfilled for a declaration.
Even if this didn’t reach the status of full blown ElNiño, many areas of the globe endured El Niño-likeimpacts, which usually hit the poorest, most foodinsecure populations:
• In Central America, during the Primera season of2014, many areas registered some of the lowestrainfall in 30 years.
• The Sahel had a very poor start to the 2014 seasonand Senegal and Mauritania were hit by the worstdrought in 20 years.
• Southern Africa endured drought conditions duringits October-April growing season of 2014-2015 thatled to staple maize crop production declines and adecrease in the regional stocks.
These climatic events weakened the coping ability ofpoor and food insecure households, heightening theirvulnerability before the proper El Niño event had evenbegun.
This was particularly the case for Southern Africa andalso for Central America.

The
20
15
-20
16
El N
iño
Eve
nt
Overview of El Niño Impacts
Sudan-SouthSudan-Ethiopia-UgandaDrought in both Ethiopian growing seasons, as well as in Sudan, Eritrea, parts of South Sudan and Uganda
Central America and CaribbeanDrought in first growing season and poor development of the second season hitting most or all of the region
Southern AfricaEl Niño expected to lead to drier than average conditions across the region. Impacts will add to a poor previous cropping season that resulted in regional cereal deficits and low stocks
Horn of AfricaEl Niño expected to lead to much wetter than average conditions. Significantly enhanced flood risk for Kenya and Somalia. On the other hand, favourable pasture likely to help recovery of marginal pastoral areas
South-east AsiaRainfall deficits throughout the main monsoon growing season. Indonesia facing particularly drier than average conditions, enhancing forest fires and damaging crops. Papua New Guinea facing one of the worst droughts in memory
An Event with a Global Reach
El Niño has a global reach, with a variety of impacts spread throughout the world and the year. The mapgraphic above blends both already observed impacts onrainfall (3rd quarter of 2015) with expected rainfall seasons outcomes for the last quarter of 2015.
The global impact of this El Niño event is clearly apparent – many of its manifestations are on the drought side, but quite a few areas (e.g. Horn of Africa) see asignificant enhancement in rainfall and hence on the likelihood of large scale floods.

East Africa:
A complex pattern of El Niño impacts

Timings of El Niño Impacts
Region B:
Seasonal rains fall within October to May,mostly in two separate rainfall seasons,October to November and March to May (e.g.Kenya’s Short Rains and Long Rains).
In this region, the first rainfall season iscurrently under way and El Niño impacts arenow developing; they are expected to resultmostly in wetter than average conditions thatmay cause significant flood events but mayalso enhance crop and pasture production.
In the absence of major flood events,consequences for households and livelihoodsshould be beneficial and result in shorterhunger gaps in early 2016.
ñ
Overview of El Niño impacts in East Africa
The current El Niño event has influenced East Africa since its official onset in March 2015. To better understand the geography and timing of El Niño impacts, East Africa’scomplex pattern of growing seasons is represented by two broad fairly simplified regions and a transition region shown on the map below:
A
B
Region A:
Most seasonal rains fall from March toOctober, mostly in a single continuous season,though some areas register two separaterainfall seasons (Ethiopia’s Belg and Meherseasons, March to May and July toSeptember).
In region A, rainfall is effectively over and ElNiño impacts are now resolved; they haveresulted primarily in drier than averageconditions ranging from transient rainfalldeficits to full blown droughts with crop andpasture shortfalls as an outcome.
The consequences for households andlivelihoods will be mostly felt during the typicalhunger period in the early stages of the nextgrowing season (March to July 2016).
Transition:
Areas with complex rainfall patterns,frequently with a long season withpronounced peaks in rainfall. Likely to suffer amix of two El Niño influences, drought in July-September and wetter than averageconditions from October onwards.
East
Afr
ica:
A c
om
ple
x p
atte
rn o
f im
pac
ts

East
Afr
ica:
A c
om
ple
x p
atte
rn o
f im
pac
tsEl Niño 2015 Outcomes: Region A and Transition Areas
NDVI in early May 2015 as a percentage of the average. This is a time of peak vegetation development for the Belg season. Blues and greens for above averge, oranges and browns for below average
NDVI in late August 2015 as a percentage of the average. This is a time of peak vegetation development for the main (Meher) season. Blues and greens for above averge, oranges and browns for below average
SummaryThe rainfall season over most of this region (Ethiopia,Sudan, South Sudan, Eritrea, Djibouti) is noweffectively over and El Niño impacts mostly resolved.
Ethiopia was the country most severely affected,having endured two severe drought events in thesame calendar year:
• The first occurred in March to May and affectedpastoral semi-arid regions (specially Afar) as well asareas where the first (Belg) of two growing seasonstakes place.
• The second developed during July-September andaffected most northern and central areas where asingle main season and the second (Meher) of twoseasons takes place.
The second event was part of a geographically widerdrought that also impacted Sudan, Eritrea, Djibouti,Somaliland as well as parts of eastern South Sudanand Karamoja-Turkana (borders between Uganda andKenya).
These latter regions are also influenced by the ShortRains season; as a result they have been enjoyingsignificantly enhanced rainfall in late 2015, early2016, as El Niño leads to a wider reach of the ShortRains and enhanced rainfall amounts.
Elsewhere, the rainfall season has also lasted forlonger than usual, but this came too late to be of anybenefit and significant crop production shortfalls areexpected across the region as well as impacts onpasture.
APRIL 2015 AUGUST 2015

El Niño 2015 Expectations: Region B and Transition Areas
The map compares October-December rainfall betweenpast El Niño seasons and Neutral seasons during the past34 years.
The purple shades clearly show that El Niño on averageleads to much wetter than average Short Rains seasons, inmany areas doubling the seasonal rainfall amount.
This effect is particularly pronounced in northern Kenyafrom Turkana to the Somalia borders, southeast Ethiopia,southern Somalia and the Djibouti-Somaliland region.
• Plot shows historical river basin cumulativerainfall (Shebelle, Somalia) color coded accordingto El Niño (blue), La Niña (orange), Neutral (grey).The three extreme seasons are all El Niño seasons.
• Increased flood risk along the river systems ofSomalia and Kenya, possibly leading to a repeat ofthe catastrophic flooding of 1997 and 2006.
• This possibility was based on the current El Niñoreaching (maybe exceeding) the intensity of the1997 event.
• Wetter than average conditions will lead to muchimproved production in marginal agricultural areasand in particular in semi-arid grasslands dominatedby pastoralist livelihoods.
• Historical data (map above) shows much higherlevels of vegetation cover in El Niño seasons, withsimilar patterns to that of El Niño rainfall
Historical data 1981-2014: El Niño leads to widespread above average rainfall
Implications: Enhanced Flood Risk Implications: Prime pasture conditions
East
Afr
ica:
A c
om
ple
x p
atte
rn o
f im
pac
ts

El Niño 2015 Current Status: Region B and Transition Areas
Wetter than average end of season:
For December-February (later stages ofthe season), areas of northern Tanzania,western Kenya and SW Ethiopia shouldexpect much wetter than averageconditions – in Kenya, this further raisesthe likelihood of continued flash floods,landslides and river floods.
Above average rainfall elsewhere, willenhance the favourable outlook for semi-arid pastoral and marginal agriculturalareas such as East Equatoria in SouthSudan, Turkana in Kenya and south westEthiopia regions.
ECMWF forecast for December 2015-February 2016 rainfall:Green shades = wetter than average conditions more likely. Brown shades drier than average conditions more likely.
Wetter than average conditions predominate across the region as is typical of an ElNiño season, but not as much as might be expected from the strength of the event.The situation so far is variable, and includes poor performance in northern andeastern Kenya and SE Somalia. Tanzania and the Great Lakes have been fairlywetter than average.
Large scale flood events (such as 1997 and 2006) are now extremely unlikely asriver basin rainfall amounts have tracked along the average for El Niño years. Thisstill led to flash-floods, landslides and displacement, particularly in Kenya. Somaliaregistered floods in mid October 2015
Vegetation cover is well above average, except for NE Kenya, due to patchy rainfallperformance. In general, good conditions for pastoralist livelihoods.
Wetter than average conditions across most of the region
Vegetation cover mostly above average
Large scale floods do not materialize
OutlookEa
st A
fric
a: A
co
mp
lex
pat
tern
of
imp
acts
Southern Africa:
As if facing a second El Niño

Expectations: Historical El Niño Rainfall Patterns
These early season rainfall deficits are expected to lead to delays in the arrival of the rains and to a late start of the growing season.
Midway through El Niño affected seasons, drier than average conditions arewidespread, extending from Namibia across Zambia, Zimbabwe and into Mozambiqueand NE South Africa and Swaziland. These patterns typically result from significant dryspells during this period, which can have severe impacts on maize crop production.
Average 3 month rainfall in El Niño
seasons compared to Neutral Seasons.
Left: Oct-Dec, Right: Jan-Mar.
Based on 34 years of data (1981 to 2013)
Long term data shows El Niño seasons typically drier than average
The maps compare rainfall between El Niño seasons and Neutral seasons over the past34 years. The comparison is made for two key periods of the season, October-December (planting and early crop development) and January-March (including thetime when maize is most sensitive to water deficits).
In El Niño seasons, during October-December, drier than average conditions affectmostly the border areas of NE South Africa, Mozambique and Zimbabwe as well assouthern Madagascar. Similar conditions affect SW South Africa though rainfallamounts are small and the main rains arrive towards late December.So
uth
ern
Afr
ica:
As
if f
acin
g a
seco
nd
El N
iño

Sou
the
rn A
fric
a: A
s if
fac
ing
a se
con
d E
l Niñ
oContext: Depressed stocks, heightened food insecurity
Country 2014/15 5yr Avg Ratio
Angola 1749 1110 58%
Botswana 15 62 -75%
Lesotho 81 92 -12%
Malawi 2945 3883 -24%
Mozambique 2255 2338 -4%
Namibia 51 126 -60%
RSA 13149 14420 -9%
Swaziland 82 78 5%
Tanzania 7382 6973 6%
Zambia 2846 2943 -3%
Zimbabwe 800 1373 -42%
2014-15 all cereal production vs 5 year average.Severe rainfall deficits during the season (left) ledto regional crop losses. The two countries of mostconcern are highlighted: sharp falls on importantproduction volumes (and requirements). SADCfigures.
Zimbabwe: ranked national maize yield variations from the 5 year average,coded according to ENSO phase. Note how largest drops are systematicallyassociated with El Niño. Data: FAOSTAT, CPC. Analysis: WFP-VAM
Previous poor season depresses regional stocks, raises food insecurity
The previous growing season of October 2014 to April 2015 was characterized by extensive rainfall deficits during key stages of the staple maize crop development(planting and flowering/grain filling). Significant, though localized, flooding in Malawi and northern Mozambique further compounded the problems.
This resulted in crop production deficits across the region which were particularly acute in South Africa, Zimbabwe and Malawi. The extensive stocks from the highproduction of the 2013-2014 bumper harvest alleviated much of the problems, but were depleted as a result (from 4400 to an estimated 1750 mi tons, SADC figures) andare now much decreased at the beginning of what may be another poor cropping season.
Historical data on national maize yields (FAOSTAT) and ENSO indicators reveal a strong linkage between drops in national maize yield and El Niño dominated growingseasons. The linkage is strongest for the largest producer (South Africa) and the most food insecure country (Zimbabwe).
Previous Season: Q1 2015Long Term Agricultural Statistics & El Niño

Current growing season status
Drier than average conditions expected:
The forecast for the next three months(Dec-Feb) indicate a continuation of drierthan average conditions across most ofthe region, except central and northernAngola, NE Zambia and Tanzania, whereabove average rainfall is expected.
The key maize growing areas of easternSouth Africa may see improvements inrainfall up to average levels. Butperspectives for the rest of the region arepessimistic, especially given the currentdelays in the start of suitable moistureconditions for planting and early cropdevelopment.
ECMWF forecast for December 2015-February 2016 rainfall :Green shades = wetter than average conditions more likely. Brown shades drier than average conditions more likely.
An ominous start, but still time to recoverThe early stages of the rainfall season have already been characterized bysevere rainfall deficits, with wide areas receiving less than 50% of the usualrainfall. Tanzania and northern Zambia are enjoying wetter than averageconditions as they are mostly influenced by the enhanced Short Rains of EastAfrica.
These early rainfall deficits result in delays to the start of the growing season.There is still plenty of time for a full recovery, but the later the start of theseason, the better conditions need to be at a later stage (above average rainfalland longer than usual season). Vegetation cover is already at much belowaverage levels.
Severe rainfall deficits in the very early stages of the season
Delays in the start of the season
Vegetation cover strongly affected
OutlookSo
uth
ern
Afr
ica:
As
if f
acin
g a
seco
nd
El N
iño
Central America:
Poor Primera, average Postrera
Ce
ntr
al A
me
rica
: Po
or
Pri
me
ra, a
vera
ge P
ost
rera
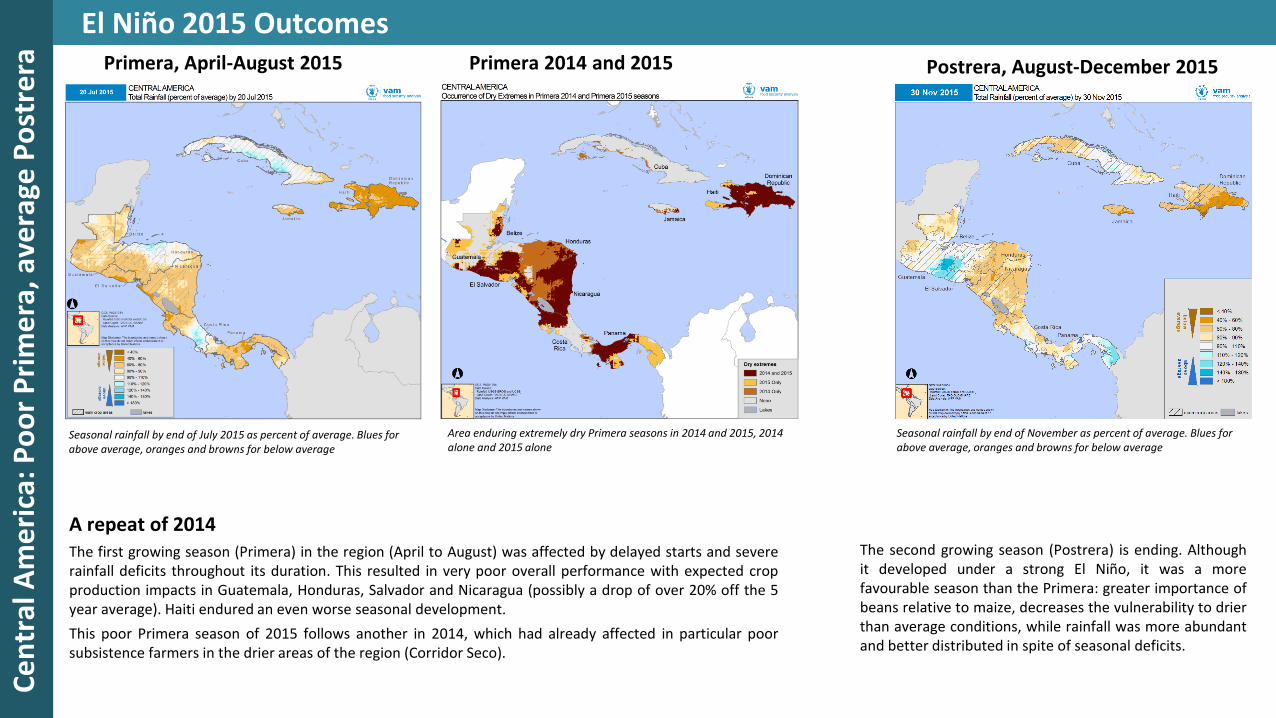
El Niño 2015 Outcomes
A repeat of 2014The first growing season (Primera) in the region (April to August) was affected by delayed starts and severerainfall deficits throughout its duration. This resulted in very poor overall performance with expected cropproduction impacts in Guatemala, Honduras, Salvador and Nicaragua (possibly a drop of over 20% off the 5year average). Haiti endured an even worse seasonal development.
This poor Primera season of 2015 follows another in 2014, which had already affected in particular poorsubsistence farmers in the drier areas of the region (Corridor Seco).
Seasonal rainfall by end of July 2015 as percent of average. Blues for above average, oranges and browns for below average
Seasonal rainfall by end of November as percent of average. Blues for above average, oranges and browns for below average
Primera, April-August 2015 Postrera, August-December 2015Primera 2014 and 2015
Area enduring extremely dry Primera seasons in 2014 and 2015, 2014 alone and 2015 alone
The second growing season (Postrera) is ending. Althoughit developed under a strong El Niño, it was a morefavourable season than the Primera: greater importance ofbeans relative to maize, decreases the vulnerability to drierthan average conditions, while rainfall was more abundantand better distributed in spite of seasonal deficits.

South America:
A typical El Niño season

Sou
th A
me
rica
: A t
ypic
al E
l Niñ
ose
aso
nExpectations: Historical El Niño Rainfall Patterns
Long term data shows varied El Niño impacts
The maps compare rainfall between El Niño seasons and Neutral seasons over the past34 years. The comparison is made for October-December, January-March and April-June, to cover different stages of the growing season across the continent.
El Niño influences during this period will become progressively weaker as its strengthdecreases towards Neutral levels; in fact this should take place sometime within April-June.
The overall pattern remains broadly similar throughout the season: Northern and NEBrazil usually endure pronounced drier than average conditions which extend toVenezuela and the Guyanas, in the first quarter of the year. Southern Peru and Boliviaalso display a tendency for drier than average conditions.
In contrast, Paraguay and southern Brazil which includes much of the country’s primeagricultural land, usually enjoy wetter than average conditions throughout. Aboveaverage and heavy intense rainfalls also affect coastal areas of Peru and Ecuador.
Sou
th A
me
rica
: Typ
ical
El N
iño
seas
on
Current growing season status
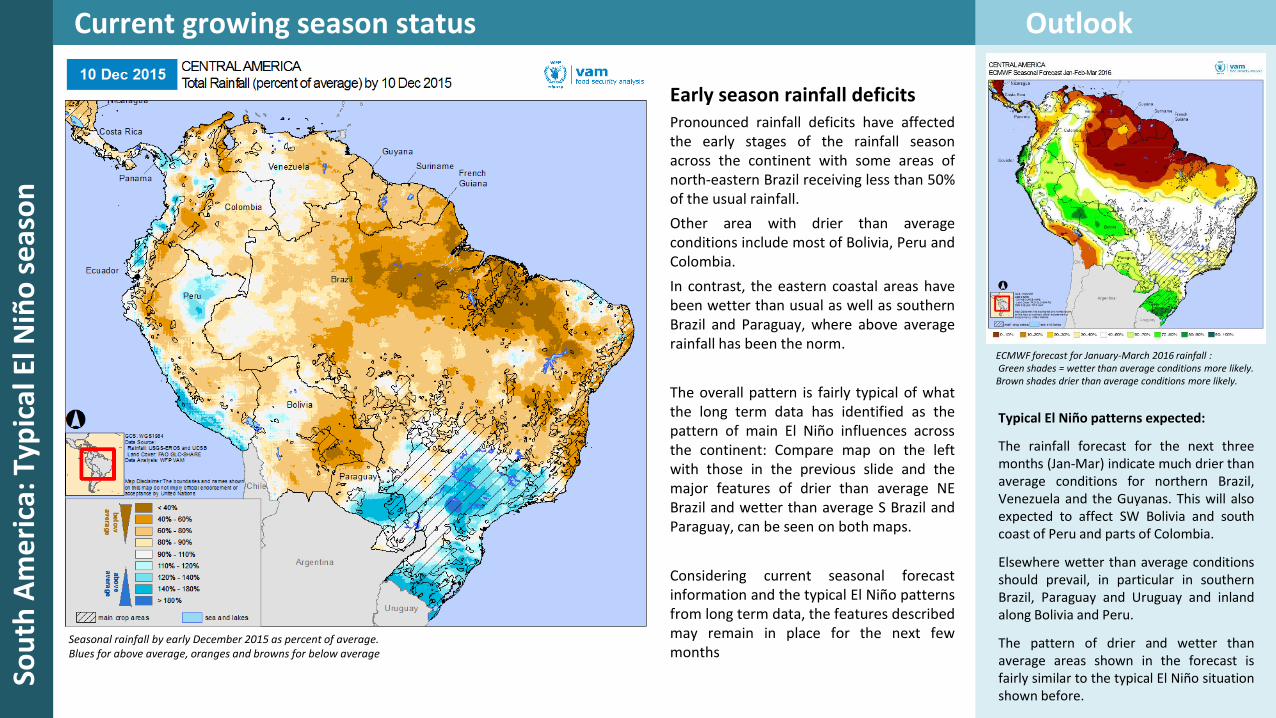
Typical El Niño patterns expected:
The rainfall forecast for the next threemonths (Jan-Mar) indicate much drier thanaverage conditions for northern Brazil,Venezuela and the Guyanas. This will alsoexpected to affect SW Bolivia and southcoast of Peru and parts of Colombia.
Elsewhere wetter than average conditionsshould prevail, in particular in southernBrazil, Paraguay and Uruguay and inlandalong Bolivia and Peru.
The pattern of drier and wetter thanaverage areas shown in the forecast isfairly similar to the typical El Niño situationshown before.
ECMWF forecast for January-March 2016 rainfall :Green shades = wetter than average conditions more likely. Brown shades drier than average conditions more likely.
Early season rainfall deficitsPronounced rainfall deficits have affectedthe early stages of the rainfall seasonacross the continent with some areas ofnorth-eastern Brazil receiving less than 50%of the usual rainfall.
Other area with drier than averageconditions include most of Bolivia, Peru andColombia.
In contrast, the eastern coastal areas havebeen wetter than usual as well as southernBrazil and Paraguay, where above averagerainfall has been the norm.
The overall pattern is fairly typical of whatthe long term data has identified as thepattern of main El Niño influences acrossthe continent: Compare map on the leftwith those in the previous slide and themajor features of drier than average NEBrazil and wetter than average S Brazil andParaguay, can be seen on both maps.
Considering current seasonal forecastinformation and the typical El Niño patternsfrom long term data, the features describedmay remain in place for the next fewmonths
Seasonal rainfall by early December 2015 as percent of average. Blues for above average, oranges and browns for below average
Outlook

Asia and the Pacific:
Dryness across the Pacific
Asi
a -
Pac
ific
: D
ryn
ess
acr
oss
th
e P
acif
icGrowing seasons 2015: current status
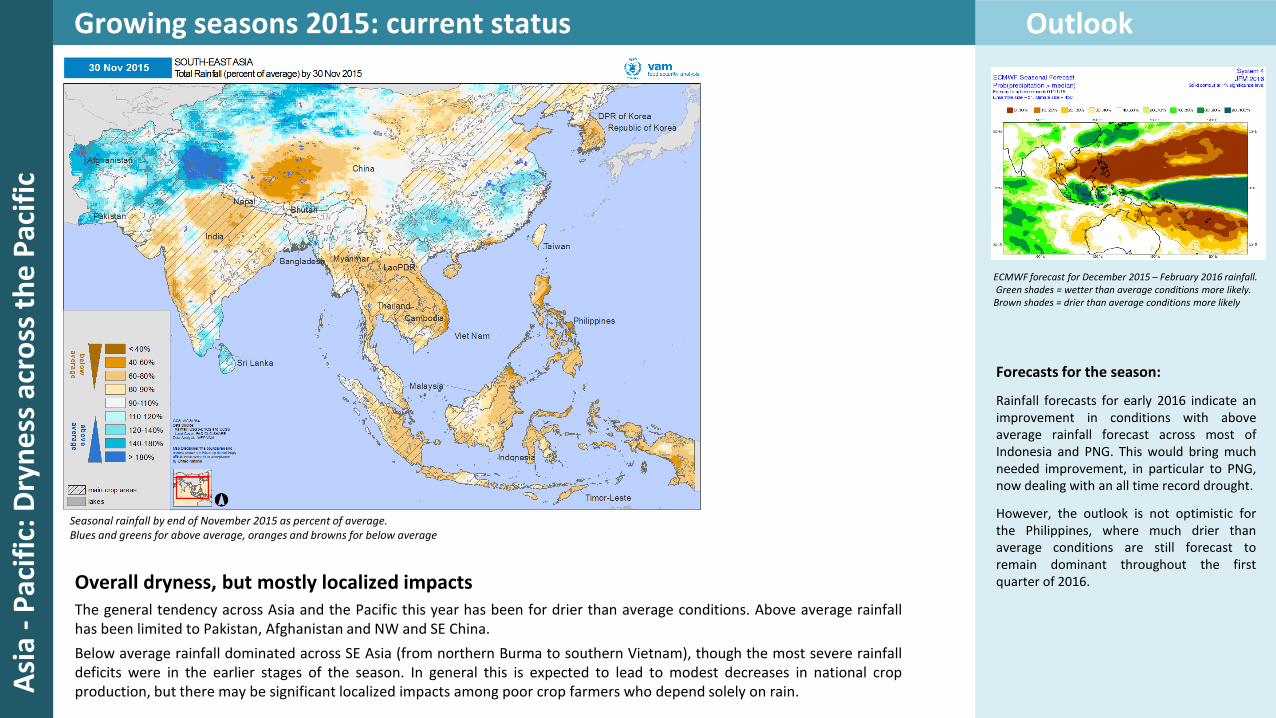
Overall dryness, but mostly localized impactsThe general tendency across Asia and the Pacific this year has been for drier than average conditions. Above average rainfallhas been limited to Pakistan, Afghanistan and NW and SE China.
Below average rainfall dominated across SE Asia (from northern Burma to southern Vietnam), though the most severe rainfalldeficits were in the earlier stages of the season. In general this is expected to lead to modest decreases in national cropproduction, but there may be significant localized impacts among poor crop farmers who depend solely on rain.
Forecasts for the season:
Rainfall forecasts for early 2016 indicate animprovement in conditions with aboveaverage rainfall forecast across most ofIndonesia and PNG. This would bring muchneeded improvement, in particular to PNG,now dealing with an all time record drought.
However, the outlook is not optimistic forthe Philippines, where much drier thanaverage conditions are still forecast toremain dominant throughout the firstquarter of 2016.
Seasonal rainfall by end of November 2015 as percent of average. Blues and greens for above average, oranges and browns for below average
ECMWF forecast for December 2015 – February 2016 rainfall.Green shades = wetter than average conditions more likely. Brown shades = drier than average conditions more likely
Outlook

Poor rainfall across the Philippines, Indonesia and the Pacific
Papua New Guinea is facing its worst everdrought, accompanied by widespread nightfrosts in the highlands due to the reducedrainfall and cloudiness typical of El Niñoconditions.
The record lack of rainfall has been lastingsince early 2015 and conditions were alreadyextremely poor even before the current El Niñostarted approaching its most intense stages.
This resulted in very severe impacts on cropsand other resources such as fishing, requiring amajor humanitarian intervention.
September-November 2015 rainfall as a percent of average for PNG. Blues and greens for above average, oranges and browns for below average
The Philippines have endureddrier than average conditionsthroughout most of 2015. So farthese have led to reductions inare planted for main season cropsof rice and maize, though impactson national production might bemodest (-3% according to FAO).The dryness has continued andintensified in late 2015, affectingthe secondary maize and riceproduction season.
November 2015 rainfall as a percent of average for Philippines. Blues and greens for above average, oranges and browns for below average
September-November 2015 rainfall as a percent of average for Philippines and Indonesia. Blues and greens for above average, oranges and browns for below average. Map: WFP-VAM Indonesia Country Office
Indonesia has been enduring much drier than average conditionsthroughout most of 2015. Impacts had been circumscribed to thesecondary crop cycles in mid 2015, but drier than average conditions arenow well established during the early stages of the season.
Though aggregate impacts maybe modest, concerns are rising regardingpoorer vulnerable communities from eastern Java to West Timor andSulawesi.
Asi
a -
Pac
ific
: D
ryn
ess
acr
oss
th
e P
acif
ic

West Africa:
Warm Atlantic prevents a major crisis

We
st A
fric
a: W
arm
Atl
anti
c av
ert
s a
maj
or
cris
is
ave
rEl Niño 2015 outcomes
A timely reversal of fortunesAs the first stage of the Sahelian season ended,the region seemed to be heading for a majorcrisis: by the end of June, extensive andpronounced rainfall deficits dominated acrossmost of the region.
This lasted until early July, after which regularand abundant rainfall that lasted longer thanusual, led to a noticeable recovery inconditions: cumulative rainfall and vegetationreached on or above average levels, except forareas of central-eastern Chad.
This reversal is due to a change in sea surfacetemperature patterns in the Atlantic; from Julythese became warmer on the west coast,colder in the Gulf of Guinea; this has the effectof balancing and overcoming earlier El Niñoinfluences.
However, the factors that saved the Sahel froma major crisis, also led to the spread ofmarkedly drier than average conditions fromthe southern half of Ghana to southern Nigeriaand SW Cameroon, which has continued untillate in the year.
April-June rainfall (above) and late June NDVI (below), as a percentage of average. Blues and greens for above average, oranges and browns for below average
July-September rainfall (above) and early September NDVI (below), as a percentage of average. Blues and greens for above average, oranges and browns for below average
April-June 2015 July-September 2015

Data Sources:Rainfall: CHIRPS, Climate Hazards Group, UCSB
Vegetation: MODIS NDVI, EOSDIS-NASA
Land Cover: FAO GLC-Share
Seasonal Forecasts: ECMWF, Regional COFs, CPC, UKMetOffice
Processing:
VAM software components, ArcGIS
For more information, please contact:
Rogerio Bonifacio
[email protected]+39 06 6513 3917


