50
OCC Portal… A Dashboards Story
| Date post: | 15-Feb-2017 |
| Category: |
Technology |
| Upload: | cp-union |
| View: | 71 times |
| Download: | 0 times |

OCC Portal…A Dashboards Story

10/8/2016 EL ABQUINA | [email protected] | +639088772988 2
Name
Current Work/Role
Why Drupal?
Hello Drupal!

10/8/2016 3
Technology Consultant @ HPEWeb Dev/Design @ Tech Ops PHOpen Source Advocate @ Drupal PilipinasFaculty @ UE Manila
EL Abquina | [email protected] | +639175579109
EL Abquina | [email protected] | [email protected]


OCC stands for Operations Control Center
Our team performs applications performance monitoring and support desk services.

Planning and Mapping
Collection Automation
Detection andCommunication
Availability and Visibility
Insights Building
100% Coverage 100% Automation 100% Detection 100% Availability 100% Understanding
Map what is working as designed so
knowing it will be real-time
Utilize monitoringtools have extensiveand automatic data
collection
Real-time alerts and reports for immediate
resolution or restoration
Alerts and reports are always available by all
means
Translate trends and reports to create
insights for decisions
12 pt. boldHP Simplified
12 pt. boldHP Simplified
12 pt. boldHP SimplifiedCollectIdentify AnalyzeVisualizeAlert
Service
Monitoring
Support Reporting Dashboard Services Service AnalysisConfiguration Planning

The OCC lacks the central platform
for all of our activities

Here comes OCC Portal…
Management of all OCC Activities:
Monitoring Requests
Configuration Planning
Monitoring Objects Inventory
Communications Platform (Alerts/Reports)
Dashboards
Analysis to Knowledge Management system (SKMS)

A new buzzword came….
Dashboards
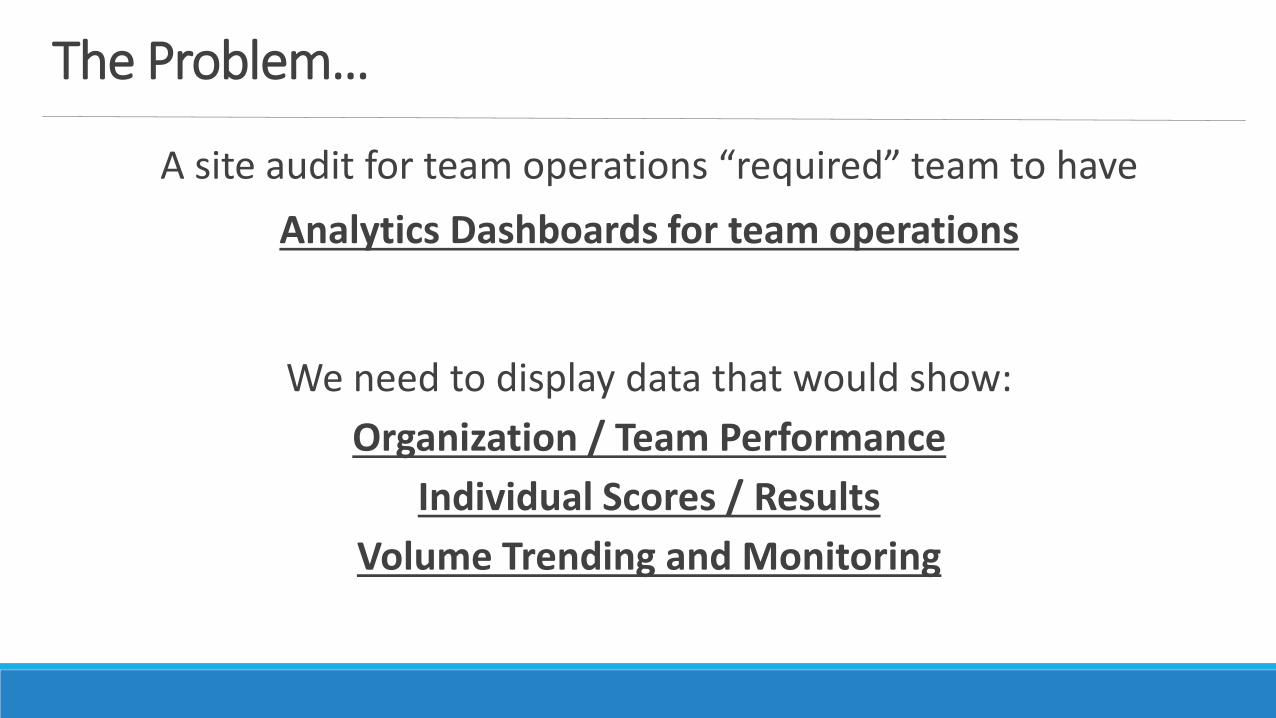
The Problem…
A site audit for team operations “required” team to have
Analytics Dashboards for team operations
We need to display data that would show:
Organization / Team Performance
Individual Scores / Results
Volume Trending and Monitoring

Tale of the Tape…GOALS
Deploy a tool across
12 global organizations Aggregate and Analyze individual scores for approx.
300-400 resourcesDaily real-time analysis of
1000 content“Please complete it by….
Monday
CONSTRAINTS
Engaged resources for the project
0 individualsIncomplete requirements and “budget”
0 dollarsLack of hardware / software resources for storing content
0 servers / hardware“It is already…
Thursday!!!!

SUBJECT: Help Needed – Action Request
POSSIBLE ACTIONS
There was a sudden alternative solution:
Too slow for usersThere is a promise of improvement:
3 months to completeNeed to decide for design requirements:
0 designers
And more…..
… we still went in for the Project!
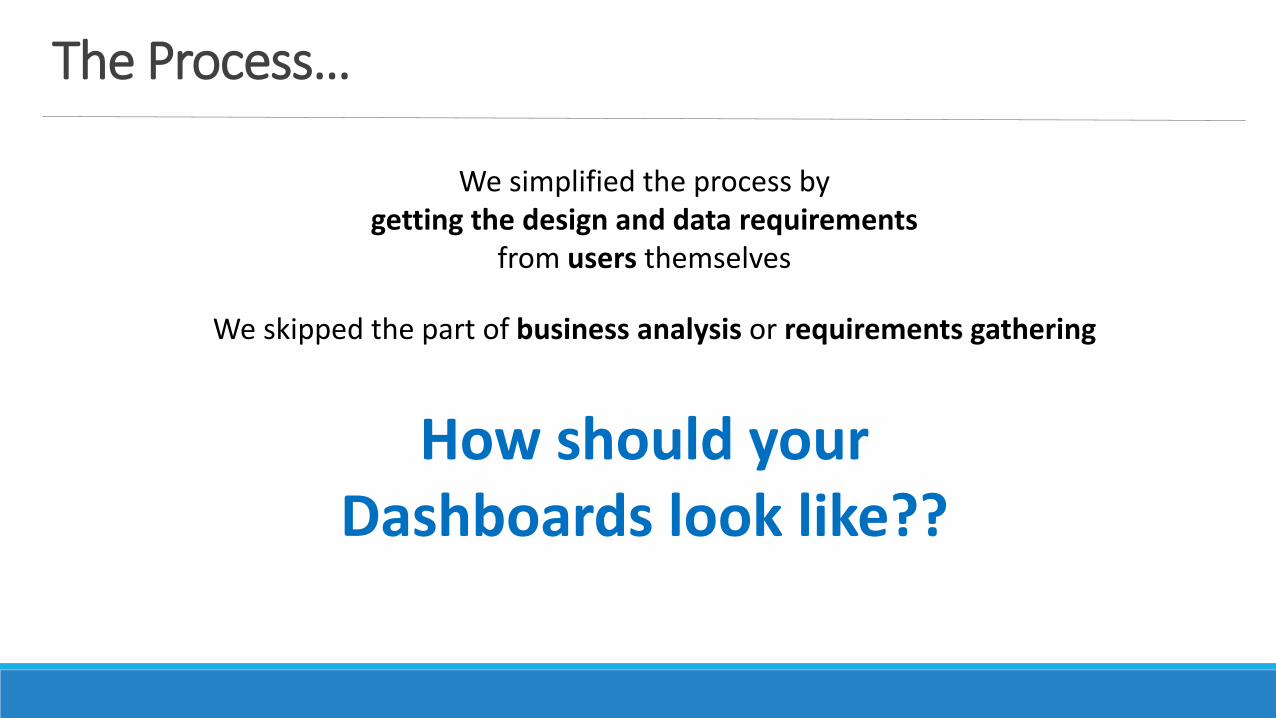
The Process…
We simplified the process by getting the design and data requirements
from users themselves
We skipped the part of business analysis or requirements gathering
How should your Dashboards look like??


The Process… use PowerPoint!
We asked the team to “build a slide” in SharePoint
It is quite easy to design something in a single slide by simply adding tables, charts or text boxes
“Please send me sample PPT slides…”

Slide Samples sent by our Users

Actual Dashboard Screenshots

Trending Dashboard

Combined Graphs and Tables
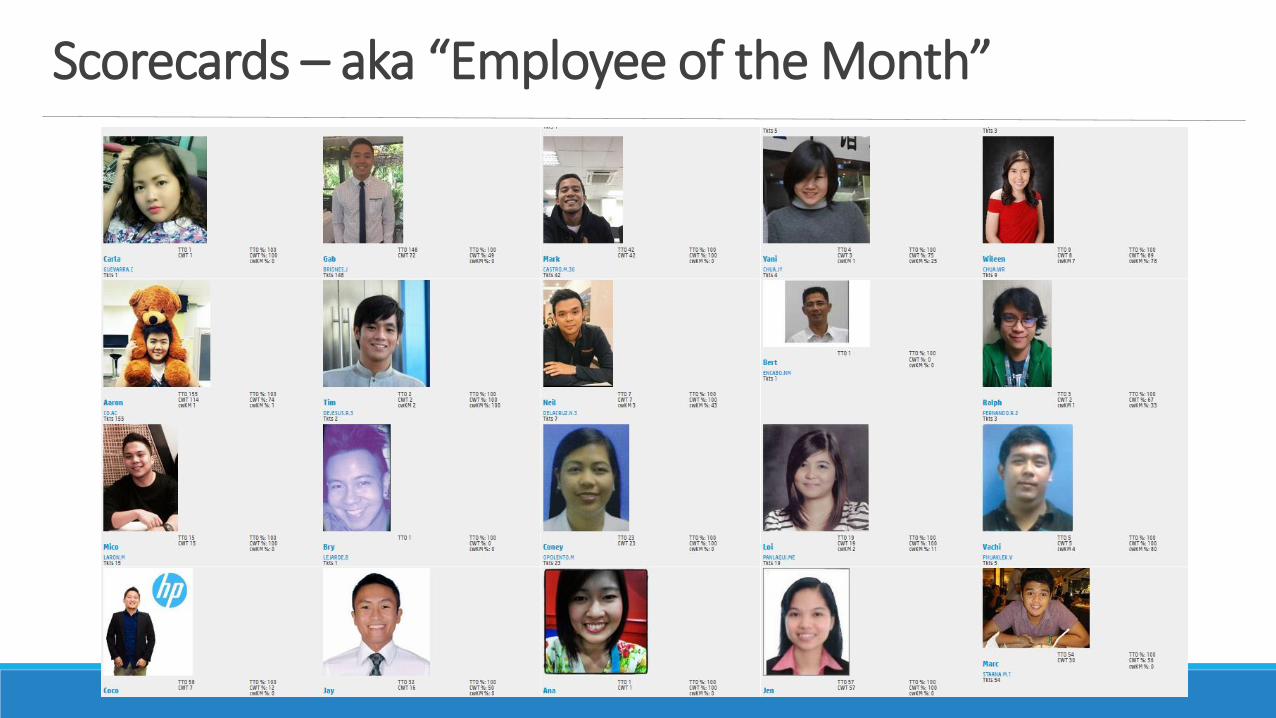
Scorecards – aka “Employee of the Month”

Scorecards – aka “Employee of the Month”


How did we use Drupal?

The Tools…
In our existing Drupal installation, we pieced contrib modules smartly to create our requirements:
• Layout Structure• Content Strategy
Is there a Dashboard Module?!

Dashboard Core Module – x_x
Relies on Custom or Views BlocksNo alternative lay-outs

Content Strategy – Views…
W enabled taxonomy to be configurable and extended with tax
Our Content:
Recipe:Taxonomy ManagerEntity APIHierarchical Select (+ more)
Views Aggregation PlusCharts HighchartsGoogle
Contenders:Field CollectionContent Taxonomy….
Tickets Nodes with a Taxonomy Term called Workgroup
Workgroup A Taxonomy Term with term fields Service Line and Support Level
Service Line The various organization entities to be deployed
Support Level Level of work the workgroup performs
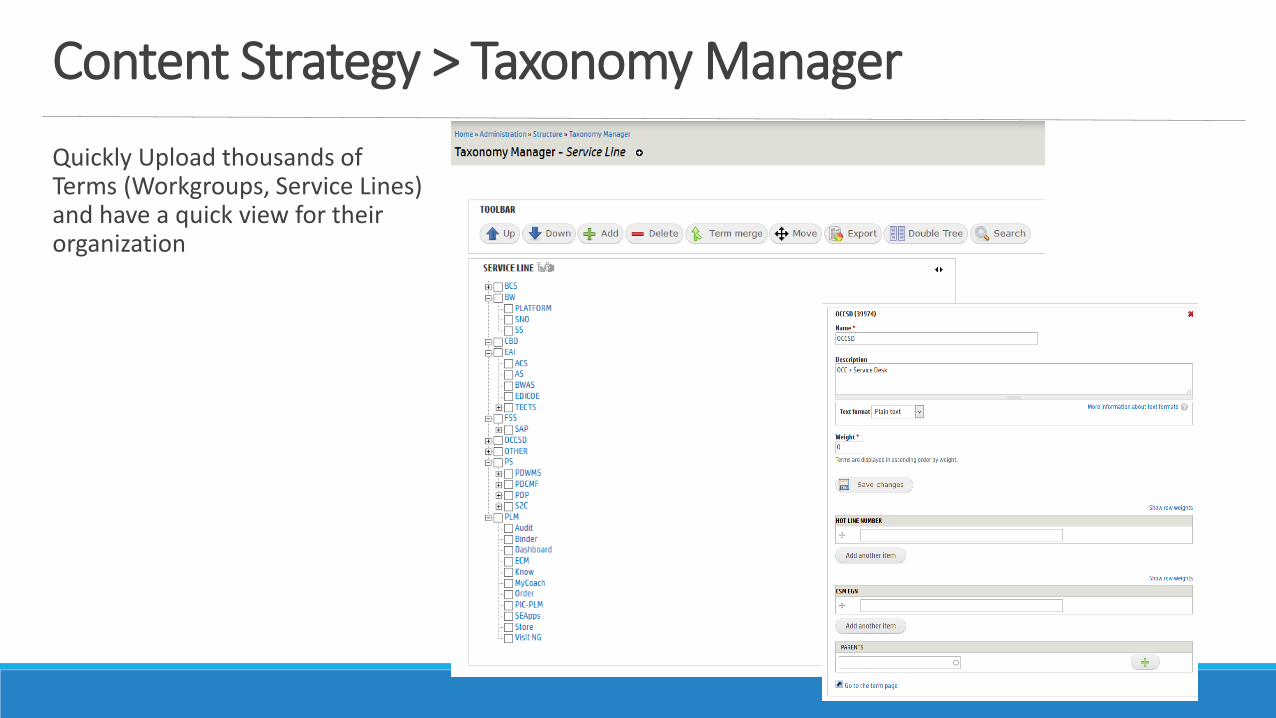
Content Strategy > Taxonomy Manager
Quickly Upload thousands of Terms (Workgroups, Service Lines) and have a quick view for their organization

Content Strategy > Hierarchical Select
A requirement is to have a dashboard view that can be filtered based on Service Line hierarchy
Hierarchical Select uses multiple taxonomies and record their parent – child relationships
Taxonomy Term: Service Line
Service Line A◦ Sub-Service Line A – 1
◦ Sub-Service Line A – 2
Service Line B◦ Sub-Service Line A – 1
◦ Sub-Service Line A - 2
Note: Checkout Simple Hierarchical Select or Client-Side Hierarchical Select

Content Strategy > Views > Contextual Filters
Formerly known as arguments
Found under Advanced > Contextual Filters
Works great with Relationships for either Entity Reference or Term References
Filter Statement:
All Tickets
Under Workgroups
Under Service Lines

Content Strategy > Views > Contextual Filters > Add
Contextual Filters use Relationships too
Can add multiple contextual filters based on Order
Can use a Fixed Value or
Raw Value from URL
Note: Our decision is just to provide Direct URL of the Dashboard pages for each of the sub-teams

Content Strategy > Views > Charts or D3
It just works!
http://drupal.org/project/chartshttp://drupal.org/project/d3
Use Views SQL Date Formatterhttps://www.drupal.org/project/views_date_format_sql

Filtered Content with Hierarchical Tree
Editableviews
Views Bulk Operations

Layout / Structure – Panels?
We used Panels suite of modules (http://drupal.org/project/panels)
a. Build Flexible Layouts that are Fixed or Fluid
b. Insert any type of content (Custom or Views Content Panes)
c. Can customize Panel for Node View/Layouts
d. Can insert Custom Styles
Note: Check out the Panopoly Distribution with built-in layouts!
Recipe:Views w/ Contextual FiltersContext (Context_Layouts)Page ManagerLayout
Contenders:Display Suite

Flexible Layouts
Enables Users with a WYSIWYG like capability for building layouts for a page, content or any entity (check-out Panelizer)
Note: Check out the Panopoly Distribution with built-in layouts!

Page Manager - Pages
We decided to use Pages with !input arguments in their paths and relate them as Contextual Filters for each Panel pane
This simplified the approach instead of retrieving user Context (that is not yet existing or default)

Page Manager – Pages > Content
Page Variants can also have different Layouts, and different set of Content.
Just place your views, blocks or custom content on the regions

Page Manager – Pages > Content > Panes
Add Content per Region of your Layout
Can add:
View Panes or Views
Custom Blocks
Custom Content Panes
Nodes and more
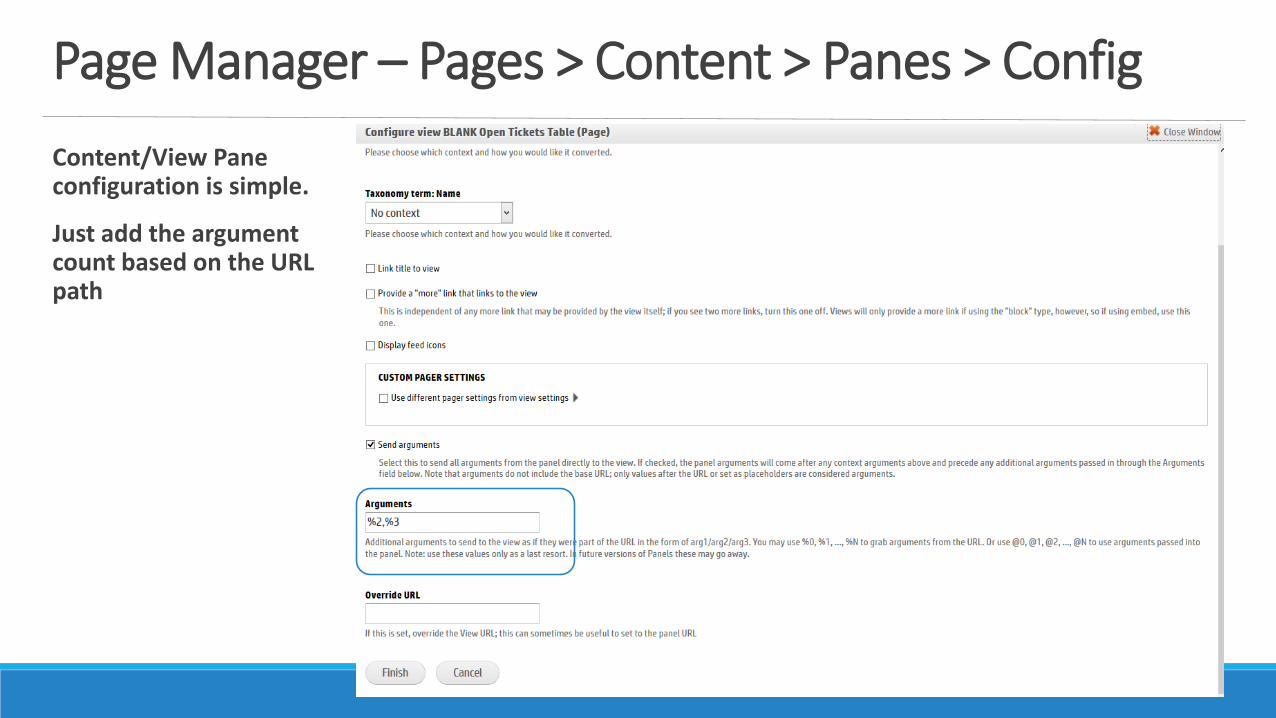
Page Manager – Pages > Content > Panes > Config
Content/View Pane configuration is simple.
Just add the argument count based on the URL path

Single Page Dashboards

Dashboards in Mission Control Center (OCC)
43

List of Existing Dashboards as of Nov. 27, 2015http://occportal.itcs.hp.com/dashboards/*
Dashboard URL
Overall Open Tickets http://occportal.itcs.hp.com/dashboard/open-tickets
OCC Auto-tickets http://occportal.itcs.hp.com/dashboard/occ-tickets
Incident Tickets http://occportal.itcs.hp.com/dashboard/open-ticket-trend/<SL>/<LVL>
http://occportal.itcs.hp.com/dashboard/open-ticket-metrics/<SL>/<LVL>
Fulfillment Requests http://occportal.itcs.hp.com/dashboard/fr-tickets
Problem Records http://occportal.itcs.hp.com/dashboard/problems
Performance Dashboards
http://occportal.itcs.hp.com/dashboard/performance/closed

A New Service…
Enabled users and teams to identify action item areas….
Insights and Decision MakingImprovement on team scores and performance
60-70% Backlog ReductionCoined a new term within the organization…
Dashboards as a Service -_-

Aftermath…
Successful implementation and deployment to the teams;
Very little or even up to no training involved for handover
Increase user base and usage of the OCC Portal
Currently fine-tuning and actively receiving suggestions
A long list of additional Dashboard Requests from other organizations
Happy Customers!

Future Plans… Ongoing Activities…
Additional content relationships and views with
Human Resources DataEnable users Through Panopoly / Panels In-Place Editor
BYOD (Build Your Own Dashboard)UX / UI Improvements and Define
Mobile First Dashboards
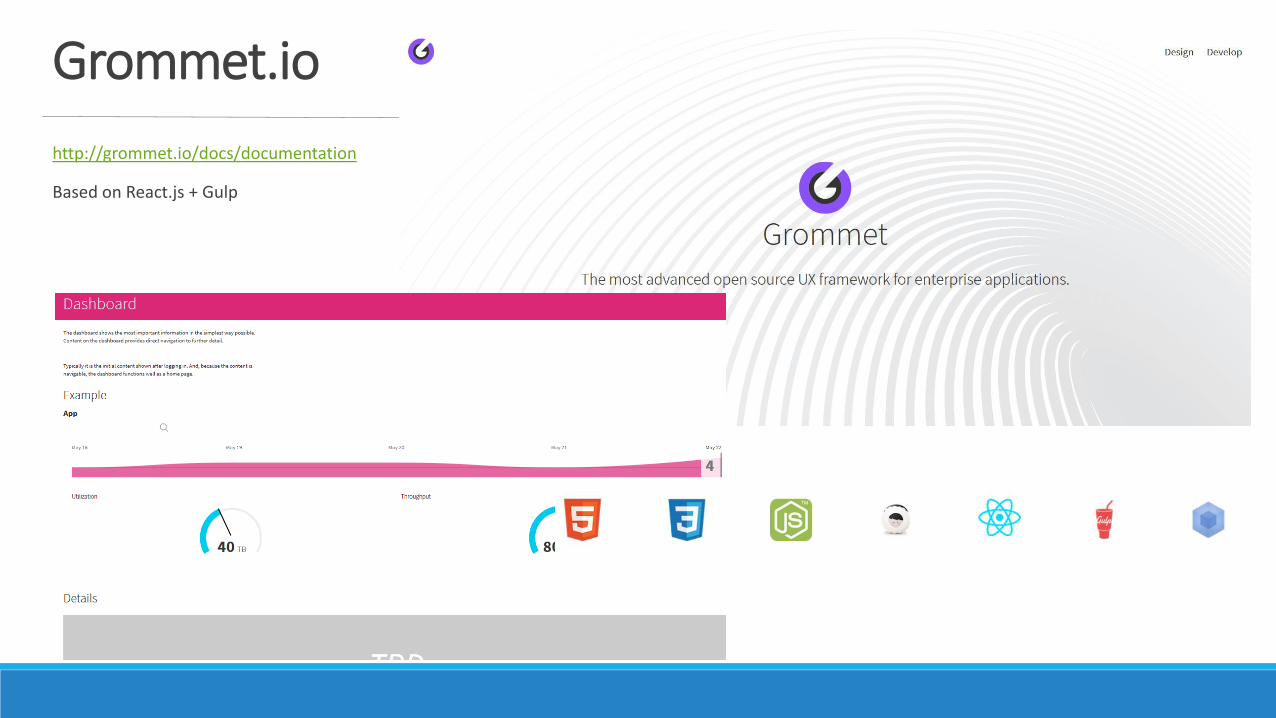
Grommet.io
http://grommet.io/docs/documentation
Based on React.js + Gulp
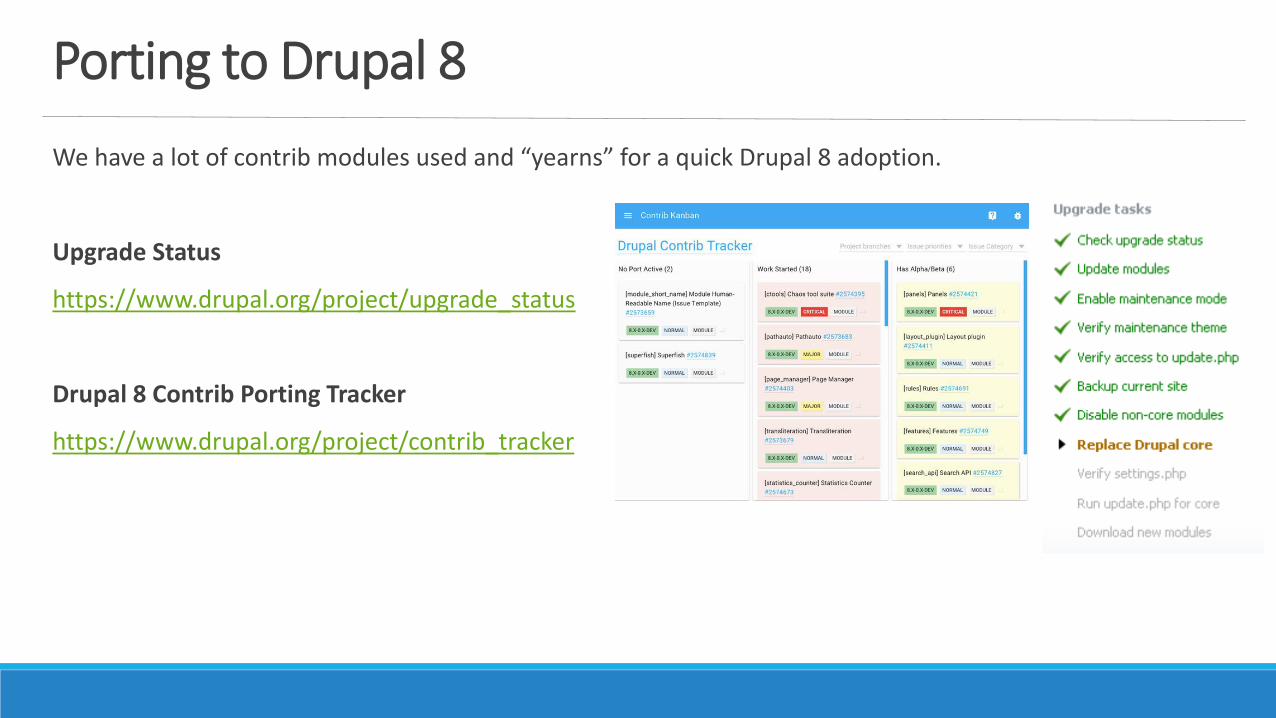
Porting to Drupal 8
We have a lot of contrib modules used and “yearns” for a quick Drupal 8 adoption.
Upgrade Status
https://www.drupal.org/project/upgrade_status
Drupal 8 Contrib Porting Tracker
https://www.drupal.org/project/contrib_tracker
Room…Hallway for Improvement
Open for suggestions…
Actively seek new ways to develop…
Ask for help.
Share!


