Page 1
1
Elastically Cooperative Activated Barrier Hopping Theory of Relaxation
in Viscous Fluids. II. Thermal Liquids
Stephen Mirigian and Kenneth S. Schweizer*
Departments of Material Science and Chemistry, and Frederick Seitz Materials Research
Laboratory, University of Illinois, 1304 W. Green Street, Urbana, IL 61801
*[email protected]
Abstract
Building on the elastically collective nonlinear Langevin equation theory developed for hard spheres in
the preceding paper I, we propose and implement a quasi-universal theory for the alpha relaxation of
thermal liquids based on mapping them to an effective hard sphere fluid via the dimensionless
compressibility. The result is a zero adjustable parameter theory that can quantitatively address in a
unified manner the alpha relaxation time over 14 or more decades. The theory has no singularities
above zero Kelvin, and relaxation in the equilibrium low temperature limit is predicted to be of a
roughly Arrhenius form. The two-barrier (local cage and long range collective elastic) description
results in a rich dynamic behavior including apparent Arrhenius, narrow crossover and deeply
supercooled regimes, and multiple characteristic or crossover times and temperatures of clear physical
meaning. Application of the theory to nonpolar molecules, alcohols, rare gases and liquids metals is
carried out. Overall, the agreement with experiment is quite good for the temperature dependence of
the alpha time, plateau shear modulus and Boson-like peak frequency for van der Waals liquids,
though less so for hydrogen-bonding molecules. The theory predicts multiple growing length scales
upon cooling, which reflect distinct aspects of the coupled local hopping and cooperative elastic
physics. Calculations of an activation volume that grows with cooling, which is correlated with a
measure of dynamic cooperativity, agree quantitatively with experiment. Comparisons with elastic,
entropy crisis, dynamic facilitation and other approaches are performed, and a fundamental basis for
empirically-extracted crossover temperatures is established. The present work sets the stage for
addressing distinctive glassy phenomena in polymer melts, and diverse liquids under strong
confinement.
I. INTRODUCTION
The problem of slow dynamics in supercooled liquids
remains a grand challenge of soft condensed matter science.
Inherent to this problem is multiple temperature “regimes”,
characteristic (crossover and extrapolated) temperatures, and
energy scales [1-5]. What aspects of this rich phenomenology are
“fundamental” versus “apparent” features associated with
empirical fitting remains vigorously debated. Creating a
microscopic physical basis for such complexity over 14 or more
orders of magnitude of relaxation time is challenging. We believe
definitive progress requires a unified quantitative description of
all dynamical regimes. In this article, we address this problem
based on the Elastically Cooperative Nonlinear Langevin
Equation (ECNLE) approach developed in the preceding paper I
[6] and propose a theory that can serve as a zeroth order quasi-
universal description of thermal liquids.
Our strategy is based on a “mapping” of real molecules
to an effective hard sphere fluid guided by requiring the latter
exactly reproduces the “long” (determined in practice on the ~nm
scale) wavelength equilibrium dimensionless density fluctuation
amplitude of a liquid, S0, a well-defined thermodynamic property
[7]. This mapping yields a system-specific and thermodynamic-
state-dependent effective hard sphere volume fraction, , which
encodes in an averaged sense the thermodynamic consequences
of repulsive and attractive forces and molecular shape. The
resultant theory connects thermodynamics, structure and
dynamics in the simplest manner we can envision for a force-
level approach. Although there are limitations, a large advantage
Page 2
2
is that a priori predictions can be made that are genuinely
falsifiable since no adjustable/fit parameters enter the theory. We
anticipate the mapping formulated here will be most useful for
van der Waals (vdW) liquids (“strongly correlating” liquids of
the Roskilde group [8-10]), and less accurate as
chemical/structural complexity is introduced, e.g., hydrogen-
bonding, ionic interactions, network formers.
Section II presents our mapping and develops several of
its general consequences. Limiting analytic results for key length
and energy scales and short and long time properties in the
deeply supercooled regime are discussed in section III; an
analysis of the equilibrium low temperature limit is also
presented. Section IV presents representative numerical
calculations and comparisons to experiments for the alpha
relaxation time, Tg, fragility, shear modulus, and characteristic
vibrational frequency for 12 glass forming liquids including
nonpolar molecules, alcohols, rare gases and liquid metals;
important crossover temperatures and time scales are also
discussed. The similarities and differences between our approach
and the phenomenological shoving model [11, 12] are
established in section V, including the relative role of the shear
modulus and a growing dynamical length scale in determining
the collective barrier in the deeply supercooled regime. Section
VI presents calculations for the effect of pressure on the alpha
relaxation, and also analyzes an “activation volume” that grows
with cooling and is strongly correlated with the number of
cooperatively moving molecules and other measures of dynamic
heterogeneity [13, 14]. Connections of our approach with diverse
alternative theories and models, including Arrhenius, mode
coupling theory (MCT) [15], entropy crisis [16, 17], dynamic
facilitation [18], and phenomenological two-barrier approaches
[19-22] is the subject of section VII. Our theoretical results are
treated as “data” and we explore how well these models can fit
our calculations. This exercise also allows the empirical
extraction of characteristic temperatures and time scales, and
their physical meaning to be deduced. The article concludes in
section VIII with a discussion. For economy of expression, we
assume the reader is familiar with the preceding paper I [6], and
equations from that article are cited as Eq(I.x).
II. MAPPING TO THERMAL LIQUIDS AND
QUASI-UNIVERSALITY
A. Density Fluctuations
The thermodynamic state and material-dependent
dimensionless amplitude of density fluctuations is determined by
the molecular number density, thermal energy and isothermal
compressibility, or alternatively as a specific derivative of
pressure, as [7]
expt
1
0 B T
PS k T
(1)
This quantifies the “flat” part of the structure factor, S(k), at low
wavevectors which emerges in practice on scales beyond the
local (typically nm) structural correlations in liquids. The
mapping then corresponds to enforcing the equality
S
0
expt S0
HS () (2)
which defines of the reference hard sphere fluid from the
liquid equation-of-state (EOS). Eq.(2) corresponds to a quasi-
universal picture where the dynamics of all liquids follow from a
hard sphere fluid to within the nonuniversal prefactor in Eq(I.35)
associated with binary collision physics [23, 24]. No separation
of into a number density and hard sphere diameter is required.
The mapping effectively replaces the volume fraction axis of the
alpha time plots in paper I by temperature in a system-specific
and thermodynamic state dependent manner.
We expect this mapping idea to work best for nearly
spherical vdW-like molecules, and for the longer range (more
coarse-grained) collective dynamics. Based on paper I, we do not
believe athermal (particle-shape-dependent) jamming is
important for equilibrated liquids. Given this, and the simplicity
of replacing real molecules with spheres, we employ the simplest
integral equation for all equilibrium quantities, the
compressibility route Percus-Yevick (PY) theory [7].
Figure 1: Experimental dimensionless compressibility data for
toluene(blue circles), biphenyl(red squares),OTP(yellow diamonds),
salol(green upward triangles – obscured by OTP), glycerol(gray
downward triangles), ethanol(open red circles), and sorbitol(open orange
squares). The dashed lines of corresponding color are fits to Eq. 8.
Inset: The resulting mapping, Eq. (11), between volume fraction and
temperature for toluene(blue circles), biphenyl(red squares),
OTP(yellow diamonds), salol(green upward triangles – obscured by
OTP), glycerol(gray downward triangles), ethanol(open red circles),
TNB(open yellow squares) and sorbitol(open diamonds). In the absence
of equation of state data, we have taken the A and B parameter values
for TNB to be the same as OTP.
Fig. 1 presents experimental dimensionless
compressibility data for diverse liquids. For some systems, the
full EOS data is not available at either very high and/or very low
temperatures, and thus Eq.(1) cannot be used directly and
extrapolation is required. Motivated by this practical point, and
also the desire for physical insight into the material-dependence
of the dimensionless compressibility, we perform an analytic
analysis of the classic vdW EOS.
Page 3
3
B. van der Waals Analysis of Dimensionless
Compressibility
The vdW model expresses the pressure as additive
contributions of repulsive and attractive (cohesive) interactions
[7]:
P Prep P
att
1 b a2
(3)
where a and b quantify the integrated strength of the
intermolecular attraction in units of the thermal energy (mean
field cohesive energy) and molecular volume, respectively. The
inverse dimensionless compressibility is
S0
1 1
1 b 2 2a
(4)
Atmospheric pressure conditions are well approximated by
taking P0, whence one obtains,
S
0
1 a a 2 (5)
1
2b1 1
4b
a
(6)
For b/a<<1, Eq.(4) then simplifies to:
S0
1 a2
b2 4
a
b 4 ...
a
b 2
2
(7)
suggesting the simple analytic form:
1
S0
exp t
a
b 2
B
T A
(8)
The defined parameters B’ and A’ are the molecular level liquid
cohesion and an entropic or packing contribution. Eq.(8) was the
motivation for the plot format in Fig. 1.
Though not necessary to implement our mapping, to
explicitly reveal the distinct dynamical consequences of
molecular size and “intrinsic” chemical effects we imagine the
molecule consists of Ns rigidity bonded “interaction sites” (e.g., a
site in benzene is a CH group). The dimensionless
compressibility can then be written at the site level as:
expt
0 0
site
s B T s B T sS k T N T Sk N (9)
Eqs.(8) and (9) imply the relation between the molecular and site
level dimensionless compressibility parameters is : A A'/ N
s
and B B '/ N
s .
Extracted values of A and B (and Ns values) are given in
Table 1 for four classes of substances: 2 rare gases, 2 metals, 5
non-polar vdW molecules, and 3 alcohols; EOS data for TNB
was not available and OTP parameters were used. Despite the
crude basis of Eq.(8), it does a surprisingly good job of
linearizing experimental data even for ethanol and glycerol.
However, the sorbitol data is not well linearized; while we report
the fit values of A and B for it, a more reliable approach is to
directly use Eq.(2) and results based on it are denoted with an
asterisk in the Tables. For all the other systems studied,
differences in our dynamical predictions based on using Eqs.(2)
and (8) are negligible.
Several interesting chemical trends are evident in Table
1. The rare gases and vdW molecules have similar B values,
while the alcohols (metals) have smaller (larger) values reflecting
their different intermolecular attractions. The “entropic packing”
factor is more variable, with positive values for rare gases
commensurate with the literal vdW model value of A=2. Smaller
positive values are found for the vdW molecules, and even
smaller and/or negative values for hydrogen-bonders and metals.
Physically, as A decreases, the rate at which the thermal density
fluctuation amplitude decreases with cooling is reduced,
suggestive of a structurally “stronger” liquid, an intuitive trend.
C. Analytic Implementation of Quasi-Universal
Description
Using the analytic compressibility route PY theory
expression for S0, one has[7]
4 2
1
0 2
1
1 2
HS
s
BS N A
T
(10)
Solving for the effective volume fraction and employing Eq. 2
yields
expt
0
expt expt
00
( ; , , ) 1 ( )
( ) 3 ( )
s S
S
T A B N T
S T T
(11)
By using Eqs. (8) and (9), an explicit dependence of on A , B
and sN can be written. The inset of Fig.1 shows calculations of
. The 1-to-1 mapping between temperature and or S0 of the
reference hard sphere fluid provided by Eq.(11) can be inverted
using Eqs. (8) and (9) to give
T () B
A1
NsS
0
HS ()
(12)
This relation in conjunction with ECNLE theory provides a no
adjustable parameter prescription for calculating the alpha time
of any material for which EOS data is available. All the
characteristic/crossover volume fractions of the hard sphere fluid
discussed in paper I translate to characteristic temperatures, and
any characteristic temperature ratio is:
T2
T1
A N
s S
0
1/ 2(1)
A Ns S
0
1/ 2(2)
(13)
The cohesive energy parameter, B, sets an energy scale for Tg,
but cancels out in ratios. This has many implications, e.g.,
characteristic temperature ratios become closer as molecular size
and/or packing parameter (A) increase, trends which will be
shown correlate with enhanced fragility.
Independent of the dynamic theory, the mapping
predicts a simple approximate relation for Tg of chemically
homologous molecules (same A and B). Since
Page 4
4
0( 0.615) 0.0044gS , and given the typical A and Ns
values in Table 1, to a good approximation A N
sS
0(
g) 1, and
hence from Eq.(12) one obtains T
g B N
s. Thus, Tg scales
essentially as the square root of the molecular mass, an intriguing
trend that has been experimentally established recently for
several homologous series [25]. For the homologous pair OTP
and TNB in Table 1, gT is 246K and 346K, which obeys
essentially exactly the square root law.
Implicit to our mapping is an assumed underlying
universality whereby all thermal liquid relaxation time data
would, to zeroth order, collapse when plotted against the
dimensionless compressibility. Such a plot is shown in Fig. 2. By
construction, theory curves (computed as described below)
collapse perfectly up to a material-specific short time scale
associated with the collision time prefactor in Eq(I.35). The
collapse of experimental data is of course imperfect, and not
unexpected given the modeling and statistical mechanical
approximations, but nonetheless we believe significant and
encouraging.
III. GENERAL ASPECTS AND LIMITING ANALYTIC
ANALYSES
From paper I, the mean alpha relaxation time is [26, 27]:
0
21 exp B elastic
s BB
F F
k TK K
(14)
where the “short time” is
2
2
0
( )
24
( ) 111
36 ( ) ( )
s
B
g d d M
k T
S QdQQ
S Q b Q
(15)
g(d) (1 / 2) / (1)2
and S(Q) is the structure factor with
Q=kd. The short time scale contains the only source of explicit
nonuniversality in the dynamical theory based on the present
minimalist mapping, and is proportional to the inverse Enskog
binary collision rate [7],
E
1 24gdd1 k
BT / M , which
depends on temperature and the molecular diameter and mass.
This nonuniversal variation is weak, typically increasing only by
~2.5 upon cooling over the wide temperature range studied here;
Ecan reasonably be taken to be a constant of ~0.1 psec.
All alpha times are numerically calculated as described
in paper I. However, limiting analytic results were also derived in
paper I, and it is of interest to first examine their mathematical
form based on the thermal mapping in the deeply supercooled
regime.
A. Energy and Length Scales
From section IIIC of paper I [6], the localization length
is proportional to the dimensionless compressibility in the deeply
supercooled regime, allowing us to write:
r
loc/ d
15
4S
0
HS Ns
1 A B / T 2
(16)
All other quantities in the theory, such as the barrier location, the
local barrier, and the collective elastic barrier can related to the
localization length. The barrier position is:
1l
33
6ln
n2
cage
l
B
s
oc
r
const N
r
r
BA
T
(17)
where the last proportionality assumes the location of the first
minimum of g(r), rcage , is independent of temperature. The local
cage NLE barrier is given by Eq(I.24) as:
2
2
1
0
3.450
2
3cage
loc
s
B
r
r
BS N A
T
F
(18)
In the ultra-local limit, the collective elastic barrier is given by
Eq. (I.25). Since in the deeply supercooled regime the
localization length is very small, the jump length is essentially
equal to rB, and thus one has to good approximation 4
2
2
( )
6ln
elastic s
s
BF T N A
T
conB
AT
st N
(19)
It was also shown in Paper I (see Eq(I.22)) that in the deeply
supercooled regime the local and collective barriers are related to
a very good approximation as F
elastic F
B
2; this relation also
follows from Eqs. (18) and (19) by neglecting the logarithmic
term and the weak temperature dependence of ( )T . The total
barrier is then:
2
2
1
(1 )total B B
s
s
F
c
F bF
BN A
T
BN A
T
(20)
where c is a constant. This temperature dependence does not
correspond to any model or theory we are aware.
The dynamic plateau shear modulus is
2 2 22
2 0
2
2 3
ln exp60 3
( )( )
/
locB
B B
loc
s
G dk rk T d
dk S kk k S k
N A B Tk T k T
d r d
(21)
where the final proportionality again neglects the weak
temperature dependence of ( )T. Knowledge of the cooperative
elastic barrier and shear modulus defines the “cooperative
Page 5
5
Figure 2: Alpha time as a function of dimensionless compressibility.
Solid curves are theory results for toluene(blue), OTP(red),
TNB(yellow), salol(green), glycerol(gray), and S0 is the hard sphere
compressibility. Experimental data is also shown for toluene(blue
circles), OTP(red squares), TNB(yellow diamonds), salol(green
triangles), glycerol(gray downward triangles), and sorbitol(open circles),
where S0 is the experimental molecular compressibility. Inset: Same plot
but the theory curves have been shifted along the S0 axis in order to
better overlay the experimental data.
volume” of paper I:
4 4( ) ( ) / ( ) / /c elastic B locV T F T G T r r d r d . This quantity
grows with cooling solely via the jump length, r(T) , which also
sets the amplitude of the long range elastic strain field. The full
temperature dependence of the cooperative volume is rather
complicated and can be obtained by substituting Eqs. (16) and
(17) into the above relation. A simpler expression in the spirit of
the present discussion is to use Eqs.(19) and (21), and ignore the
weak logarithmic term in Eq.(20), to obtain
2/ ( / )elasticc sV G N B T AF
(22)
Within NLE theory, the localized state is associated with
harmonic vibrations on the dynamic free energy. The
corresponding frequency, which is a toy model for the Boson
peak frequency, is [28]: 1/2
2
0
0
0
2
21
1
1
2
2
sB
B
loc
M
M
K M
K M
K k T d
Md r
(23)
where
s
1 Md 2s, and the approximate equality has been
established based on numerical calculations. This vibrational
energy scale increases more slowly with cooling than G, though
the localization length is the key quantity for both properties. The
absolute magnitude of both G and
Bdepend on nonuniversal
parameters. A caveat concerning Eq.(23) is the Einstein glass
picture underlying NLE theory does not include a spectrum of
phonon-like states, and one expects it over predicts (as we
confirm below) the magnitude of the Boson frequency. However,
interestingly, neutron experiments have found that the key
features of the Boson frequency as deduced from incoherent
(single particle) scattering and collective scattering are
surprisingly similar [29, 30].
B. Crossover Temperatures and Time Scales
Paper I discussed multiple theoretically well-defined
characteristic or crossover volume fractions and their
corresponding time scales. The initial crossover from the normal
liquid to one where barriers are nonzero occurs corresponds to
the (naïve) MCT transition at
A 0.43. From Eq.(12),
this defines a temperature, TA, where S
0
HS (A) 0.031; the
calculations in Table 1 show this temperature is far above Tg.
However, the barrier initially grows in very slowly below TA. A
practical onset for activated dynamics is when the hopping time
scale equals the renormalized binary collision time scale, thereby
defining the crossover temperature Tx:
s(T
x)
hop(T
x)
(24)
Upon further cooling, the relative importance of the collective
versus the local barrier grows. Two additional, theoretically well-
defined crossover temperatures which indicate the change from a
local hopping process to a collective hopping process are:
F
elastic(T *) F
BT * (25)
d
dTF
elastic( T )
d
dTF
B( T )
(26)
T’ indicates where the growth rate of the collective barrier first
exceeds that of the local barrier. As discussed below, it appears
to correlate with diverse empirical estimates of the key
dynamical crossover temperature. T* occurs at a lower
temperature and its practical observable dynamic consequences
will be shown to be much less pronounced.
C. Dynamic Fragility
To gain intuition concerning what controls the dynamic
fragility in our theory we perform an approximate analytic
analysis which will be shown to accurately reproduce the key
trends of our numerical calculations. The dynamic fragility is
defined as
0
0
log(
1
log(
)1
1 1
) 1/
/
1
g
g
H
g
g T
HS
T
S
dm
d T
d S
T
d S TT
(27)
where the second expression uses the chain rule. From Eq. (14),
one sees that log(
) F
total
to a reasonable approximation at Tg
where
s hop . From Paper I it
was shown that F
total F
B(1 bF
B)
,
prior NLE theory work numerically found
F
B 0.08 / S
0
HS 3.51 ,
and from Eq. (8) one has d(1 / T ) / d(1 / S
0
HS ) 2NsB B / T A .
Employing all these results, one can write the “parabolic”
relation:
log
/
s a1 a
2S
0
1 a3S
0
2
where a1, a2, and a3 are to
leading order constants. We note that
a
3 r
eff 2
r 4 quantifies
the sensitive dependence of the collective barrier on
the
Page 6
6
microscopic jump length that sets the amplitude of the strain
field. Using all of the
above results in Eq. (27) gives
3
2
2
0
3
212
22
g
s
g T
s
g g
S
H
g
H
S
a BN A
T S T
aB BN Aa
T
m B
T S
a
(28)
where S
0
HS |T
g
Sg
HS 0.0045. Evaluating Eqs. (8) and (9) at Tg gives
B / T
g 1/ N
sS
g
HS A , and substituting this in Eq. (28) yields
32
32
22
22
1
1
2
s
HSHS HSgs g g
s
HS HSHSg gg
s
m aN
a
Na
SS S
A N a
S SS
cA N
(29)
where c is a numerical factor. The attraction strength parameter,
B, sets the energy scale of Tg but does not enter the fragility
which is controlled to leading order by molecular size and
entropic packing parameter A. Eq.(29) implies fragility is
minimized when A<0 and the molecule is large (extended
alcohols per Table 1), and is largest for big vdW molecules
(A>0). However, it is the composite parameter,
A Ns
, that
controls the overall magnitude of the fragility within the present
quasi-universal picture.
D. Generic Low Temperature Limit and Strong
Glass Forming Liquids
One can ask what the present theory predicts in a
hypothetical T0 limit. There is no Kauzman transition, but
there is a jamming limit (random close packing at
J 0.644 ).
For hard spheres, this corresponds to condensation into a sub-
extensive number of inherent structures (“bottom” of the (free)
energy landscape), and a crossover of the EOS from fluid-like to
a free-volume-like form [31] where pressure diverges and
dimensionless compressibility vanishes as [32,
33]: P /
J
1
and S
0
J
2
. As T0, a harmonic
vibrational description should be generically
relevant, though
usually unattainable in equilibrium. However, some highly
structured “strong” network glass formers (e.g., silica) that
display Arrhenius relaxation [3] may effectively be in this low
temperature regime with regards to their thermal density
fluctuations even under equilibrated molten conditions.
Using the above scaling relations for P and S0 in
Eq.(10), the effective hard sphere volume fraction in the T0
limit is
J c T
(30)
where c is a constant. Since density and isothermal
compressibility approach limiting values as T0, the
dimensionless compressibility takes on a harmonic crystal form
S
0 k
BT
TT
J
2 (31)
We note that experiments [34] and simulations [35-37] on molten
silica obey the linear scaling of S0 with temperature in Eq.(31), a
laboratory realization of “solid-like” behavior in the liquid phase.
The form of Eq.(31) is not captured by typical fluid integral
equation theories, and thus Eq.(16) does not apply. Rather, in the
harmonic limit one must have
r
loc
2 T (32)
per neutron experiments at low temperatures [3, 30]. From
Eq.(17) in the T0 the jump length diverges as
r
eff r
B r
loc 2
| ln(T ) | (33)
Using these results in Eq.(I.25) one obtains
Felastic
r
eff 2
rloc
2
ln(T ) 2
T
(34)
Thus, a near Arrhenius behavior is generically predicted
with logarithmic deviations that weaken the growth of the
relaxation time relative to pure Arrhenius. This form seems to be
qualitatively consistent with recent measurements [38] on
equilibrated amber (a chemically complex but fragile liquid)
below Tg. As a speculative comment, these results may also be
relevant to the near Arrhenius behavior of very “strong” liquids
as a consequence of their solid-state-like thermal dependence of
the dimensionless compressibility in the liquid phase. We note
that a near Arrhenius behavior below Tg for fragile liquids is
typically a nonequilibrium kinetic effect [3].
IV. REPRESENTATIVE CALCULATIONS
We now numerically apply the theory to study the alpha
time, glass transition temperature, dynamic fragility, shear
modulus, “Boson-peak” frequency, and the characteristic
crossover temperatures and times that can be objectively defined.
By the latter we mean either they can be deduced unambiguously
from the alpha time or from the 2-barrier theoretical picture.
Comparisons with experiments are also presented.
A. Barriers, Alpha Time and Characteristic
Temperatures. General Aspects
Per section III, there are 4 theoretically well-defined crossover
temperatures which are, in decreasing magnitude, TA, Tx, T’ and
T*. Fig. 3 illustrates these characteristic temperatures in the
context of OTP. The main panel shows how the local barrier,
collective elastic barrier, and total barrier distinctively, but
smoothly, grow with cooling. The inset presents the ECNLE
theory, local NLE only, and short time process relaxation times.
The emergence of a barrier occurs at TA (literal NMCT
transition) and corresponds to the high temperature beginning of
the curve in the main figure. However, as shown in the inset, at
this high temperature the barrier is so low that the timescale for
activated hopping is faster than the renormalized binary collision
timescale,
s. Activated processes become important in a
practical sense at TX (marked in the inset) when
s
hop, which
Page 7
7
Figure 3: Schematic of theoretically important and well defined
temperatures within the two barrier ECNLE picture. Although the plot
is generic, the upper axis shows the absolute temperature scale for OTP
as an example. The solid blue curve is the total barrier, the dashed red
curve is the local barrier, and the lower dashed yellow curve is the
elastic barrier, all plotted against inverse temperature. Inset: Alpha time
as a function of inverse temperature with approximate timescales at
characteristic temperatures marked. The solid blue curve is the alpha
relaxation time of ECNLE theory, the dashed red curve is NLE theory
analog, and the yellow dash-dot line is the dressed binary collision
time..
we find typically occurs when
~10-10
s. Although the true
activated process present above TX is subdominant, our theory
nevertheless predicts an apparent Arrhenius behavior (barrier,
EA) due in part to the temperature dependence (e.g., thermal
expansion) of
s. This regime begins to break down at TA,eff
(called T* by Kivelson and Tarjus [19, 39]) which we find is very
close to TX where
~ 10-100 ps (see Table 3) consistent with
experimental data on many glass-formers [4, 5].
Cooling below TX, the next characteristic temperature is
T’ (see Eq.(26)) where the rate of thermal growth (temperature
derivative of barriers) of the collective elastic barrier equals its
local NLE analog. This temperature controls the practical
observation of a rapid bending up of the relaxation time as a
function of inverse temperature as the deeply supercooled regime
is entered. In this regime F
elastic F
B
2 , and T’ signals the
crossover to when this quadratic relation applies. We suggest T’
is the physical meaning of many empirically-extracted
“crossover” or “onset” temperatures [1, 3] (e.g., TB, T0, Tc)
identified in the literature which often occur when 1071s .
The final important fundamental temperature is T* where
F
elastic F
B. This temperature is quite low, and corresponds to
of order 10-2
s. As discussed further below, we believe this
temperature is related to a reference temperature extracted by
Rossler et al [22, 40], TR, where the uncooperative barrier equals
its collective analog. Finally, Tg is identified with 100s .
B. Experimental Comparisons
Quantitative application of our theory, using
experimental EOS data to construct the mapping, has been
performed for 5 nonpolar vdW molecules (toluene[41],
biphenyl[42], OTP[43], TNB(assumed same as OTP), salol[44]),
3 alcohols (ethanol[45], glycerol[46], sorbitol[47]), 2 atomic
metals (cesium[48], rubidium[48]) and two rare gases
(argon[49], xenon[50]). Although the deeply supercooled regime
and glass transition of the rare gases and liquid metals are not
experimentally accessible, we present results for them as
examples of different chemical classes, and also because there
have been many simulations of such atomic systems. Numerical
results for Tg, fragility and characteristic temperatures are shown
in Table 1, temperature ratios (relative to Tg) in Table 2, and
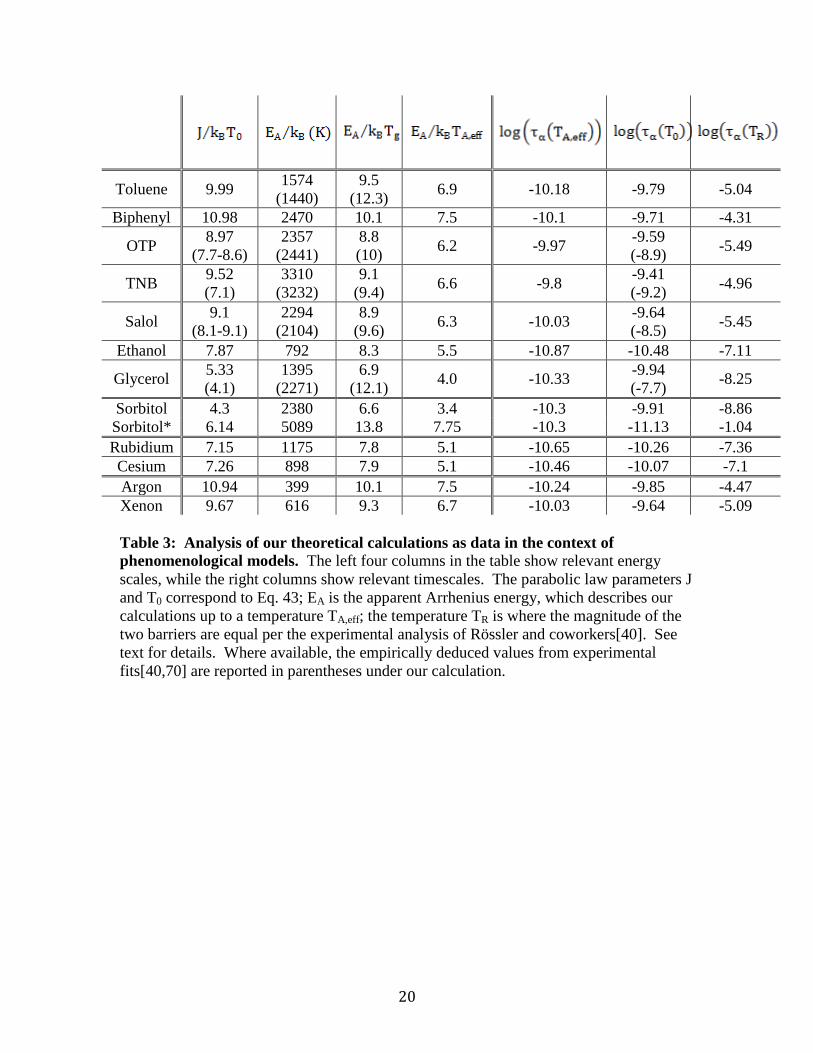
characteristic energy scales and time scales in Table 3. Where
available, the corresponding experimental estimates are listed.
A comparison between a representative subset of our
calculations of the alpha time as a function of temperature and Tg
values with experiments are shown in Fig. 4 (using experimental
data for OTP[51], TNB[52], glycerol[53], salol[44], and
toluene[54]) and Table 1, respectively. The computed Tg values
are generally within 20% of experiment [55-57], with toluene
and sorbitol the biggest outliers; predictions for temperature
ratios (Table 2) are more accurate than absolute values. In
general, the temperature dependence of the alpha time seems
remarkably accurate over 14 orders of magnitude in time from
~2Tg to Tg given the no adjustable parameter nature of the
calculations. The largest deviation is for the hydrogen-bonding
glycerol, as might be expected based on our use of a hard sphere
model of structure and the short time process.
Figure 4: Angell plot showing theoretical calculations of the alpha time
for OTP(blue), TNB(red), glycerol(green), salol(yellow), and
toluene(gray). The theoretical result using only the local barrier is also
shown for OTP(blue dashed line). Experimental data is shown for
OTP(blue circles)[51], TNB(red squares)[52], glycerol(green upward
triangles)[53], salol(yellow diamonds)[44], and toluene(gray downward
triangles)[54]. Inset: Comparison of theory and experiment values of
Tg. Points are from left to right: ethanol(down closed triangle),
toluene(closed circle), glycerol(open circle), salol(upward closed
triangle), OTP(closed square), sorbitol(open square), TNB(closed
diamond).
Page 8
8
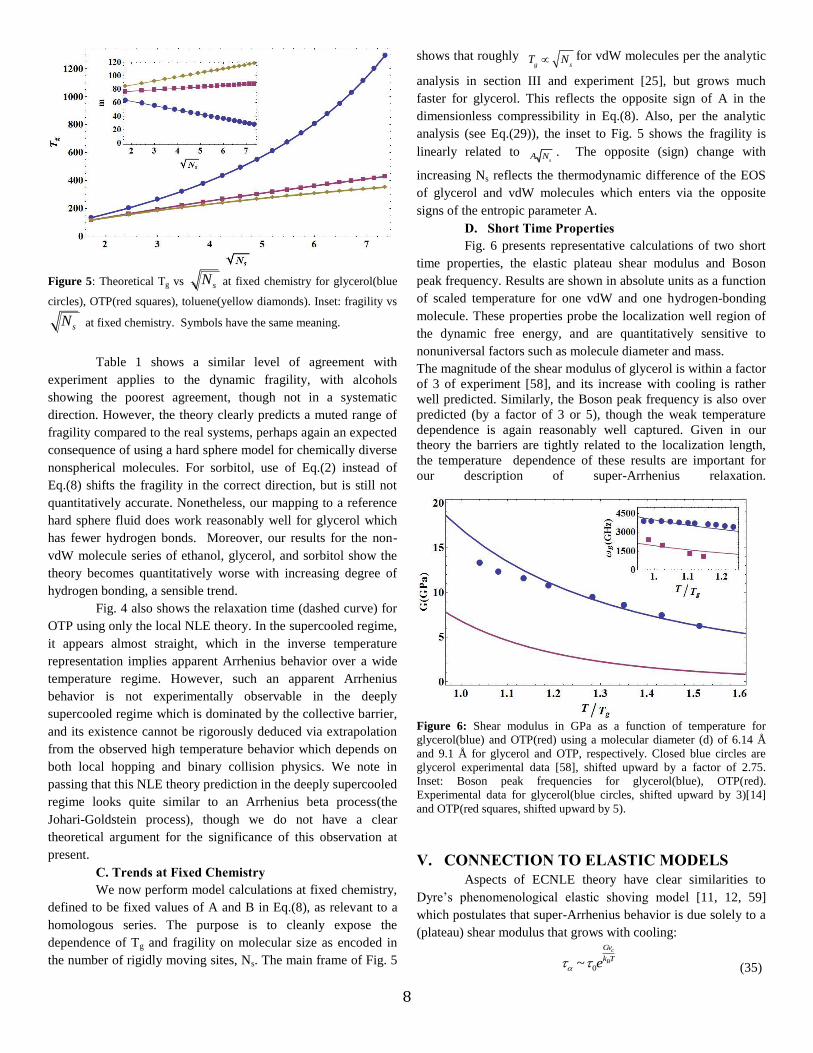
Figure 5: Theoretical Tg vs sN at fixed chemistry for glycerol(blue
circles), OTP(red squares), toluene(yellow diamonds). Inset: fragility vs
sN at fixed chemistry. Symbols have the same meaning.
Table 1 shows a similar level of agreement with
experiment applies to the dynamic fragility, with alcohols
showing the poorest agreement, though not in a systematic
direction. However, the theory clearly predicts a muted range of
fragility compared to the real systems, perhaps again an expected
consequence of using a hard sphere model for chemically diverse
nonspherical molecules. For sorbitol, use of Eq.(2) instead of
Eq.(8) shifts the fragility in the correct direction, but is still not
quantitatively accurate. Nonetheless, our mapping to a reference
hard sphere fluid does work reasonably well for glycerol which
has fewer hydrogen bonds. Moreover, our results for the non-
vdW molecule series of ethanol, glycerol, and sorbitol show the
theory becomes quantitatively worse with increasing degree of
hydrogen bonding, a sensible trend.
Fig. 4 also shows the relaxation time (dashed curve) for
OTP using only the local NLE theory. In the supercooled regime,
it appears almost straight, which in the inverse temperature
representation implies apparent Arrhenius behavior over a wide
temperature regime. However, such an apparent Arrhenius
behavior is not experimentally observable in the deeply
supercooled regime which is dominated by the collective barrier,
and its existence cannot be rigorously deduced via extrapolation
from the observed high temperature behavior which depends on
both local hopping and binary collision physics. We note in
passing that this NLE theory prediction in the deeply supercooled
regime looks quite similar to an Arrhenius beta process(the
Johari-Goldstein process), though we do not have a clear
theoretical argument for the significance of this observation at
present.
C. Trends at Fixed Chemistry
We now perform model calculations at fixed chemistry,
defined to be fixed values of A and B in Eq.(8), as relevant to a
homologous series. The purpose is to cleanly expose the
dependence of Tg and fragility on molecular size as encoded in
the number of rigidly moving sites, Ns. The main frame of Fig. 5
shows that roughly T
g N
sfor vdW molecules per the analytic
analysis in section III and experiment [25], but grows much
faster for glycerol. This reflects the opposite sign of A in the
dimensionless compressibility in Eq.(8). Also, per the analytic
analysis (see Eq.(29)), the inset to Fig. 5 shows the fragility is
linearly related to A N
s
. The opposite (sign) change with
increasing Ns reflects the thermodynamic difference of the EOS
of glycerol and vdW molecules which enters via the opposite
signs of the entropic parameter A.
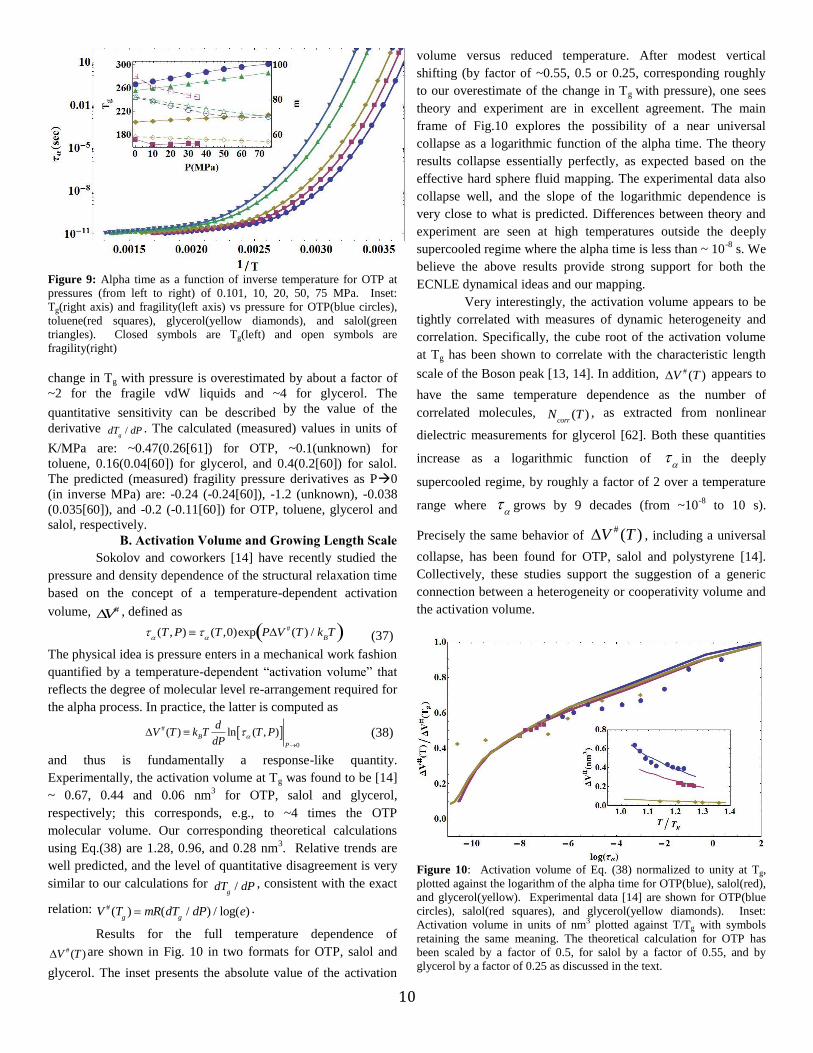
D. Short Time Properties
Fig. 6 presents representative calculations of two short
time properties, the elastic plateau shear modulus and Boson
peak frequency. Results are shown in absolute units as a function
of scaled temperature for one vdW and one hydrogen-bonding
molecule. These properties probe the localization well region of
the dynamic free energy, and are quantitatively sensitive to
nonuniversal factors such as molecule diameter and mass.
The magnitude of the shear modulus of glycerol is within a factor
of 3 of experiment [58], and its increase with cooling is rather
well predicted. Similarly, the Boson peak frequency is also over
predicted (by a factor of 3 or 5), though the weak temperature
dependence is again reasonably well captured. Given in our
theory the barriers are tightly related to the localization length,
the temperature dependence of these results are important for
our description of super-Arrhenius relaxation.
Figure 6: Shear modulus in GPa as a function of temperature for
glycerol(blue) and OTP(red) using a molecular diameter (d) of 6.14 Å
and 9.1 Å for glycerol and OTP, respectively. Closed blue circles are
glycerol experimental data [58], shifted upward by a factor of 2.75.
Inset: Boson peak frequencies for glycerol(blue), OTP(red).
Experimental data for glycerol(blue circles, shifted upward by 3)[14]
and OTP(red squares, shifted upward by 5).
V. CONNECTION TO ELASTIC MODELS
Aspects of ECNLE theory have clear similarities to
Dyre’s phenomenological elastic shoving model [11, 12, 59]
which postulates that super-Arrhenius behavior is due solely to a
(plateau) shear modulus that grows with cooling:
0~
c
B
Gv
k Te
(35)
Page 9
9
Figure 7: Alpha time calculations for OTP(blue circles), TNB(red
squares), toluene(yellow diamonds), glycerol(green triangles), and
salol(gray downward triangles). Closed symbols are plotted versus the
dimensionless variable X (lower axis) defined in the text and as
suggested by the shoving model [11,12], open symbols are the same
calculations plotted versus /g
T T (upper axis). Inset: Ratio of cooperative
volume to molecular volume plotted against Tg/T. Symbols have the
same meaning.
where the “cooperative volume”, cv
, is a material-specific,
temperature-independent fit parameter. If this formula is
consistent with our theory, then plotting our calculations against
the normalized quantity X T
gG(T ) / TG(T
g) should lead to a
universal collapse of different systems onto a single line. Fig. 7
shows typical results of such a comparison. Excellent agreement
is found over the slowest ~10 orders of magnitude of relaxation,
despite the fact ECNLE theory has a growing correlation volume
with cooling (see inset) and a local non-cooperative barrier. The
upward deviation at higher temperatures (corresponding to a
relaxation time ~10-8
sec) is consistent with experimental data
analysis [11,12,58], and finds a precise interpretation within
ECNLE theory as due to the dominance of the local barrier and
binary collisions at high temperatures. The inset to Fig. 7 shows,
Figure 8: Ratio of logarithmic derivatives of the two contributions to
collective elastic barrier versus Tg/T for OTP(blue circles), TNB(red
squares), toluene(yellow diamonds), glycerol(green triangles), and
salol(downward gray triangles).
consistent with phenomenological estimates [11,12,58], the
theoretically computed cooperative volume, Vc , is smaller than
molecular size, but grows by a factor of ~2-3 over the range of
temperatures studied for all materials. As discussed in paper I,
this growth with cooling addresses a key criticism [2] of the
elastic shoving model.
It is of interest to ask what is the dominant contribution
to the growth in the collective elastic barrier of ECNLE theory
over the regime in which it controls the alpha relaxation time?
This can be determined based on logarithmic derivatives
Felastic
T GV
c
lnG
T lnV
c
T
(36)
Representative results for glycerol and OTP are shown in Fig. 8,
where a prime indicates a temperature derivative; the temperature
at which the relaxation time reaches 10-8
s is marked by an arrow.
At higher temperatures, reference to Fig. 3 shows that the growth
of the elastic barrier is subdominant and (see Fig. 7) the
phenomenological shoving model breaks down. By comparing
the ratio of the two terms inside the parentheses of Eq. 36 one
sees that in the deeply supercooled regime the dominant
contribution to collective barrier growth comes from the change
in the shear modulus. This helps explains why the
phenomenological shoving model can work well in the
supercooled regime. At higher temperatures competing factors
become important and the shoving model breaks down.
VI. PRESSURE EFFECTS and GROWING
COOPERATIVE LENGTH SCALE
We now consider how pressure modifies the
temperature dependence of the alpha time, Tg, and fragility based
on using Eq. (2) directly as S
0
HS (eff
) S0
expt (T ;P) and EOS data.
Knowledge of the pressure dependence can be employed to also
compute an activation volume that appears to track dynamical
cooperativity.
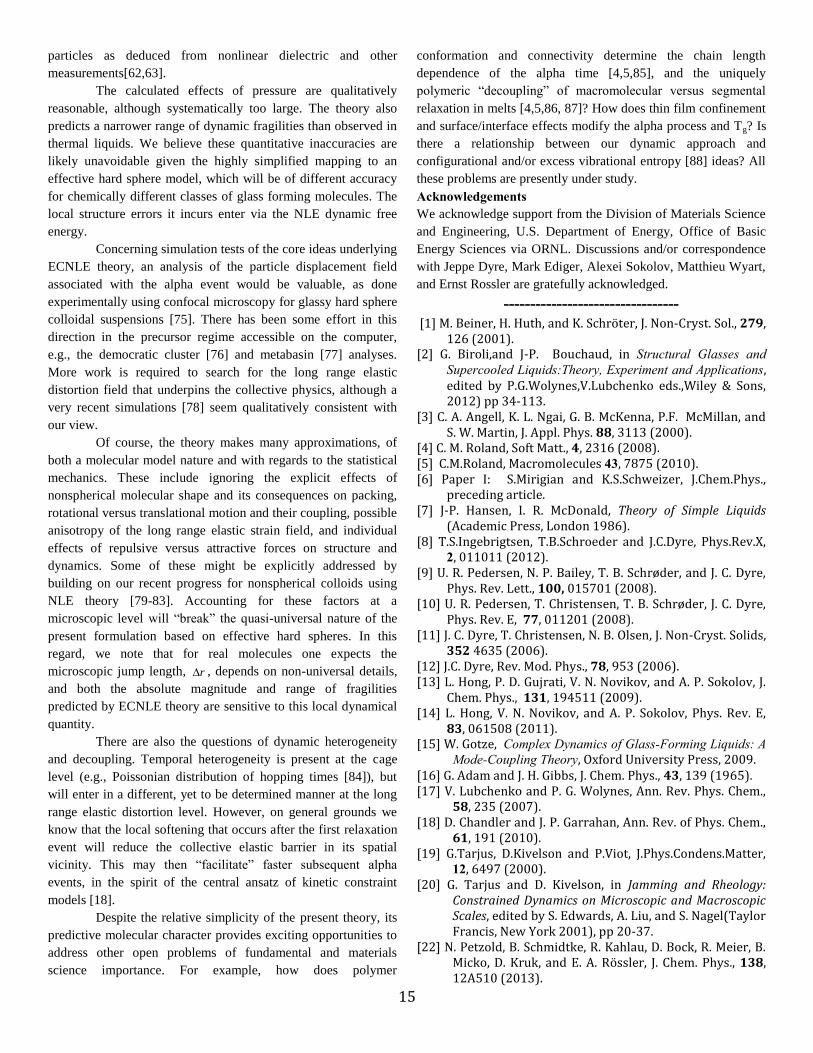
A. Pressure Dependence of the Alpha Process
Fig. 9 shows a representative result for the variation
with pressure of the alpha time of OTP. With increasing pressure,
relaxation in the supercooled regime is slowed far more than at
high temperatures. The inset shows fragility and Tg results for
three vdW liquids and glycerol. Except for toluene, all systems
exhibit a monotonic and slightly sub-linear growth Tg with
pressure. The unusual behavior of toluene occurs only at very
low pressures, and we are unsure whether the employed EOS
input is reliable. All systems show a decrease of fragility with
pressure, which agrees with experiment [60] except for glycerol
where fragility increases with pressure.
Quantitatively, the theory generally predicts a stronger
sensitivity to pressure than observed. This is perhaps
unsurprising given the “free-volume-like” nature of mapping
thermal liquids onto an effective hard sphere fluid. Moreover, the
incorrect sign of the fragility dependence for hydrogen-bonding
glycerol is again likely not unexpected. Quantitatively, the
Page 10
10
Figure 9: Alpha time as a function of inverse temperature for OTP at
pressures (from left to right) of 0.101, 10, 20, 50, 75 MPa. Inset:
Tg(right axis) and fragility(left axis) vs pressure for OTP(blue circles),
toluene(red squares), glycerol(yellow diamonds), and salol(green
triangles). Closed symbols are Tg(left) and open symbols are
fragility(right)
change in Tg with pressure is overestimated by about a factor of
~2 for the fragile vdW liquids and ~4 for glycerol. The
quantitative sensitivity can be described by the value of the
derivative dT
g/ dP . The calculated (measured) values in units of
K/MPa are: ~0.47(0.26[61]) for OTP, ~0.1(unknown) for
toluene, 0.16(0.04[60]) for glycerol, and 0.4(0.2[60]) for salol.
The predicted (measured) fragility pressure derivatives as P0
(in inverse MPa) are: -0.24 (-0.24[60]), -1.2 (unknown), -0.038
(0.035[60]), and -0.2 (-0.11[60]) for OTP, toluene, glycerol and
salol, respectively.
B. Activation Volume and Growing Length Scale
Sokolov and coworkers [14] have recently studied the
pressure and density dependence of the structural relaxation time
based on the concept of a temperature-dependent activation
volume, V# , defined as
(T , P)
(T ,0)exp PV # (T ) / k
BT (37)
The physical idea is pressure enters in a mechanical work fashion
quantified by a temperature-dependent “activation volume” that
reflects the degree of molecular level re-arrangement required for
the alpha process. In practice, the latter is computed as
#
0
( ) ln ( , )B
P
dV T k T T P
dP
(38)
and thus is fundamentally a response-like quantity.
Experimentally, the activation volume at Tg was found to be [14]
~ 0.67, 0.44 and 0.06 nm3 for OTP, salol and glycerol,
respectively; this corresponds, e.g., to ~4 times the OTP
molecular volume. Our corresponding theoretical calculations
using Eq.(38) are 1.28, 0.96, and 0.28 nm3. Relative trends are
well predicted, and the level of quantitative disagreement is very
similar to our calculations for dT
g/ dP , consistent with the exact
relation: V # (T
g) mR(dT
g/ dP) / log(e) .
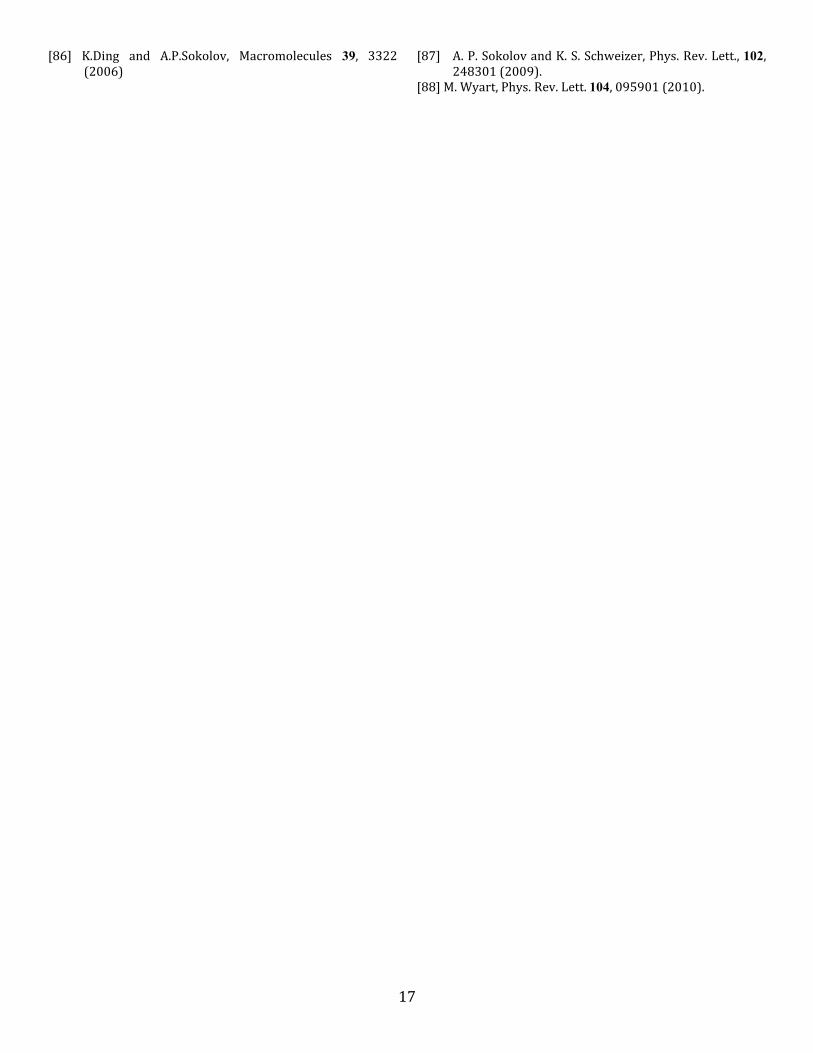
Results for the full temperature dependence of # ( )V T are shown in Fig. 10 in two formats for OTP, salol and
glycerol. The inset presents the absolute value of the activation
volume versus reduced temperature. After modest vertical
shifting (by factor of ~0.55, 0.5 or 0.25, corresponding roughly
to our overestimate of the change in Tg with pressure), one sees
theory and experiment are in excellent agreement. The main
frame of Fig.10 explores the possibility of a near universal
collapse as a logarithmic function of the alpha time. The theory
results collapse essentially perfectly, as expected based on the
effective hard sphere fluid mapping. The experimental data also
collapse well, and the slope of the logarithmic dependence is
very close to what is predicted. Differences between theory and
experiment are seen at high temperatures outside the deeply
supercooled regime where the alpha time is less than ~ 10-8
s. We
believe the above results provide strong support for both the
ECNLE dynamical ideas and our mapping.
Very interestingly, the activation volume appears to be
tightly correlated with measures of dynamic heterogeneity and
correlation. Specifically, the cube root of the activation volume
at Tg has been shown to correlate with the characteristic length
scale of the Boson peak [13, 14]. In addition, V # (T ) appears to
have the same temperature dependence as the number of
correlated molecules, N
corr(T ) , as extracted from nonlinear
dielectric measurements for glycerol [62]. Both these quantities
increase as a logarithmic function of
in the deeply
supercooled regime, by roughly a factor of 2 over a temperature
range where
grows by 9 decades (from ~10-8
to 10 s).
Precisely the same behavior of V # (T ) , including a universal
collapse, has been found for OTP, salol and polystyrene [14].
Collectively, these studies support the suggestion of a generic
connection between a heterogeneity or cooperativity volume and
the activation volume.
Figure 10: Activation volume of Eq. (38) normalized to unity at Tg,
plotted against the logarithm of the alpha time for OTP(blue), salol(red),
and glycerol(yellow). Experimental data [14] are shown for OTP(blue
circles), salol(red squares), and glycerol(yellow diamonds). Inset:
Activation volume in units of nm3 plotted against T/Tg with symbols
retaining the same meaning. The theoretical calculation for OTP has
been scaled by a factor of 0.5, for salol by a factor of 0.55, and by
glycerol by a factor of 0.25 as discussed in the text.
Page 11
11
Most recently, the nonlinear dielectric measurement of
N
corr(T )
for 4 liquids of
widely variable chemistry and fragility
have been reported [63]. In all cases it was found
(T ) exp bN
corr(T )
(39)
where b is a system-specific numerical factor. Given Eq.(39), and
that prior experiments [13] generically found V # (T ) ln
(T )
in the deeply supercooled regime consistent with our theory, an
effective barrier proportional the “number of correlated
molecules” can be viewed as a logical inference of the ECNLE
approach. However, the notion of a number of correlated
particles determining the barrier, a central concept of models
based on compact domains of re-arranging particles, does not
directly enter ECNLE theory.
As discussed in paper I, there are other growing length
scales in ECNLE theory, albeit not directly experimentally
measurable and/or model-dependent. For example, Vc(T) in the
inset of Fig.7, or the microscopic jump length which sets the
amplitude of the long range elastic strain field. All these
quantities grow slowly with cooling (more or less
logarithmically) by modest factors in the supercooled regime,
though they differ physically and with regards to the quantitative
temperature sensitivity.
VII. CONNECTIONS TO ARRHENIUS, MODE
COUPLING, ENTROPY CRISIS, DYNAMIC
FACILITATION AND OTHER MODELS
We now treat our theoretical calculations as “data” and
analyze them in the context of diverse models (as done by
experimentalists and simulators). Our goal is to see how our
predicted temperature dependence of the alpha time in various
“regimes” compares with different models, and extract empirical
characteristic temperatures.
A. Models
We consider four classes of models that aim to describe:
(1) a high temperature (apparent) Arrhenius regime, (2) a narrow
intermediate crossover regime, (3) the deeply supercooled
regime, and (4) all regimes. At high temperatures and fast
relaxation times, an apparent Arrhenius law is often found to fit
experiments [4,19, 22,39,40,64]:
exp E
A/ k
BT (40)
where AE is often many times (~ 5-6 for molecules) the thermal
energy, strongly suggesting it is not solely a thermal expansion
effect. Ideal MCT [15] has been proposed to describe a narrow
intermediate crossover window between the high temperature
and deeply supercooled regimes over 3 or so decades where
1010 107 s . The alpha time is a critical power law, with a
hypothetical (unphysical) divergence cT :
T T
c
(41)
Two distinct thermodynamic entropy crisis approaches
for the deeply supercooled regime are the Adams-Gibbs (AG)
model [16] and Random First Order Theory (RFOT) [17]. The
former builds on a high temperature local activated event as the
basic excitation, while the latter does not. In both cases,
configurational entropy controls the barrier in the deeply
supercooled regime leading to the classic VFT form (also
motivated from very different “free volume” arguments [65]):
0exp
D
T Tvft
(42)
where T
vft T
Kin the literal Kauzmann paradox (zero
configurational entropy) scenario. The VFT formula has three
adjustable parameters, and fails at high enough temperature.
Some have suggested [66-68] a two VFT ad hoc model
corresponding to different high and low temperature VFT fits
with a crossover at BT . “Regimes” are identified based on the
“Stickel analysis” [67] where 1/2
log / ( / )gd d T T
is plotted
against T1 . In this representation, a Arrhenius law is a horizontal
line and the VFT law is a straight line; the intersection of the
high and low temperature versions of the latter defines BT (often
close to [69] the empirically-extracted MCT Tc), while
extrapolation of the low temperature form to zero empirically
defines a hypothetical zero mobility state at T
vft.
Coarse-grained dynamic facilitation models based on
directional mobility field propagation predict a “parabolic law”
in the deeply supercooled regime [18, 70, 71]:
2
0log 1 ,oo
TJT T
kT T
(43)
where the mobile defect creation energy, J, and onset
temperature, 0T , are determined by data fitting [70]. There are
no divergences above T=0, and in the low temperature limit
Arrhenius behavior emerges as the defect concentration
approaches zero.
Tarjus and Kivelson [19, 20, 39], Rossler and
coworkers[22, 40] and others[72] have suggested
phenomenological 2-barrier models where the high temperature
process is Arrhenius. Rossler et.al. have convincingly shown this
picture can empirically fit relaxation data on many molecular
liquids over 14 orders of magnitude based on [22, 40]:
( 1)0.1
( )exp
exp 1B
A
A coop
B
k T
EA
B
E E T
k T
Ee
k T
(44)
where the is nonuniversal parameter that is weakly varying for
vdW liquids (e.g.,
7.8 0.7 for toluene, salol, OTP, TNB).
Detailed data analysis based on global
fits of 18 liquids over 14
Page 12
12
Figure 11: Analysis of the theoretical alpha time for salol(blue circles)
in different regions in terms of a high temperature Arrhenius law(blue),
a crossover MCT region(red dashed) and a low temperature parabolic
law(orange). Inset: Corresponding Stickel plot that shows a high
temperature Arrhenius regime and two VFT laws with intersection at TB
. The open circles represent the theoretical calculation below Tg,
showing that the extrapolation to TVFT is only an apparent feature of the
theory.
orders of magnitude in alpha time
suggests remarkable
connections between the Arrhenius and cooperative barriers.
These deductions are relevant to testing our theory, and the key
trends are as follows [22, 40]. (a) A crossover temperature, TR, is
defined as when the uncooperative local and cooperative barriers
are equal: E
coop(T T
R) E
A; a near universality is found for
15 vdW liquids, T
R/ T
g1.13 0.02 , with larger values found
for less fragile alcohols (e.g., T
R/ T
g1.26
for glycerol). (b) Near
universal values are found for the two barriers relative to the
glass transition temperature: E
A/ k
BT
g111 and
E
coop(T
g) / k
BT
g 24 1 , and thus at Tg:
Ecoop
/ EA 2.2 .
Interestingly, this implies the system needs to be quite close to
kinetic vitrification before the collective barrier exceeds its
apparent Arrhenius analog, and even at Tg the former is only
about twice as large as the high temperature barrier. (c) The
“prefactor” in Eq.(44) is physically sensible, ~ 10130.3s , of
order 0.1 ps. (d) Though not experimentally measurable, Eq.(44) predicts a finite low temperature cooperative barrier
corresponding to a return to Arrhenius behavior
E
coop(T 0) E
1 eb , where b 3 8 .
B. General Findings
We now treat our theoretical calculations as “data” and
fit them to above forms. A representative result is shown in Fig.
11 for salol. One can indeed interpret our calculations in the
commonly adopted “3 regime” scenario: a high temperature
Arrhenius regime, a narrow crossover regime described by a
critical power law, and a deeply supercooled regime where, e.g.,
the parabolic law fits our calculations very well. Of course, such
a three regime picture is not literally part of our approach where
the alpha time over 14 orders of magnitude comes from a single
physical theory.
Based on the Stickel analysis, the inset to Fig. 11 shows
that the theoretical data can also be well fit by a high temperature
Arrhenius law, and two VFT laws with a crossover at BT , per
experimental analyzes [67, 68]. By means of an ad hoc
extrapolation, an apparent divergence of
at T
VFT can be
extracted from the low temperature regime. In reality, there is no
finite temperature divergence in our theory, and our calculations
upwardly deviate from the VFT law just below Tg.
Characteristic temperatures, and their ratios compared
to Tg, associated with the various fits to our theoretical
calculations are listed in Tables 1 and 2; the numbers are
reasonable with regards to their experimentally-extracted
analogs. We caution that extracting characteristic times and
temperatures via fitting introduces an element of subjectivity as
to what constitutes a “good” fit. The Tables show that the
theoretically well-defined temperature TX is associated with the
empirically-deduced end of Arrhenius behavior at TA,eff. The
theoretical T’ defined in Eq. 26 is associated with the important
and physically meaningful crossover to cooperative dynamics,
here precisely defined as when the temperature growth of the net
barrier begins to be controlled by collective elasticity; we suggest
T’ is the physical meaning of the empirical TB. One can associate
the parabolic law T0 with either TX (since one can extend a
parabolic law fit down to TA,eff though some fit quality is
sacrificed) or T’. Conceptually, it seems best to associate it with
T’, but we find that the “best” empirical fit lies somewhere
between these temperatures.
Because of the underlying universality of our mapping
to a hard sphere fluid, the time scales associated with the
characteristic temperatures discussed above are only weakly
material dependent (variations of typically one order of
magnitude due to the system-specific short timescale); examples
are given in Table 3. The end of the apparent Arrhenius regime
is experimentally reported [4, 22, 40] to lie at 1010.80.5s ,
and typically describes only 1 decade or less of the alpha time
growth, features in good accord with our results. Upon further
cooling an important dynamical crossover occurs at TB, Tc, or T0
where
~ 10-8
-10-6
s.
In this section we have focused on the big picture and
summarized the highlights of our comparisons. We now consider
each of the regimes in more detail.
C. Apparent Arrhenius and Intermediate Regimes
Fig. 11 shows an apparent Arrhenius law is predicted
over a wide high temperature window, and begins to “fail” at
TA,eff~1.4 Tg where 1010 s . A narrow, roughly 3 decades
in intermediate time regime can then be fit using a MCT critical
power law. However, its physical significance is unconvincing
for at least two reasons. First, we know our “data” reflects
Page 13
13
Figure 12: Apparent Arrhenius barrier plotted versus fragility. Colored
points are the theoretical calculations for, from left to right: sorbitol,
glycerol, ethanol, OTP, salol, TNB, toluene, and biphenyl. Gray stars
are experimental data from left to right: glycerol[40, 56], propylene
glycol(PG)[40, 56], salol[40, 56], OTP[40, 56], TNB[40, 56], propylene
carbonate(PC)[40, 56], and toluene[40, 55]. The two outliers are
strongly hydrogen bonding. Inset: Fragility plotted against the
theoretical control variable. Colored symbols are the theoretical
calculation, gray stars are experimental data. Within each set, the points
are, from right to left, sorbitol, glycerol, ethanol, OTP, salol, TNB,
toluene, and biphenyl.
activated hopping! Second, the non-singular parabolic law fits
the slowest 12 orders of magnitude very well before failing at
109 108s .
Table 3 presents our extracted apparent Arrhenius
barriers, in absolute units and relative to the glass transition and
effective crossover temperatures. Recall the apparent Arrhenius
behavior does not correspond to a pure barrier hopping process,
but rather reflects the combined consequences of an effective
binary collision process and low true barriers. In the absence of
activated processes, we find the apparent barrier due to only
dressed binary collisions is ~5kBTg, while the full calculation
gives an apparent barrier of ~8-9 kBTg. The ratio of the apparent
barrier to the effective crossover temperature ranges from 4-7,
emphasizing that this apparent barrier energy scale is not small
compared to the temperature interval over which an apparent
Arrhenius behavior is extracted.
The main frame of Fig. 12 plots E
A/ k
BT
gversus
fragility and shows we predict m E
A/ k
BT
g. This is also found
for the shown experimental data [40, 55, 56] except for the two
strongly hydrogen bonding systems, for which our fragility
results are not accurate. The inset of Fig.12 plots fragility versus
the quantity our theory predicts controls it. The plot demonstrates
Eq.(29) describes the numerical ECNLE theory results very well,
although the ability of it to correlate the experimental data does
not appear as strong due to the muted range of fragilities we
predict based on our hard sphere mapping.
D. Entropy Crisis Perspective
Entropy crisis [16, 17] and free volume [65] theories
assert the alpha time diverges at a nonzero temperature. Based on
the Stickel analysis, our calculations of the dynamical divergence
temperature obtained by fitting and extrapolation are listed in
Tables 1 and 2. The predicted ratios of Tvft/Tg ~ 0.66-0.8 are in a
range consistent with the rough experimental estimates [71, 73,
74] for these materials.
Adams and Gibbs argued the alpha time is a magnified
version of an underlying Arrhenius (single particle or un-
cooperative local) barrier hopping process per Eq.(I.48). The
effective barrier E
eff z(T )E
A, where
z (T ) describes an
increasing number of particles that participate in the alpha event
upon cooling which, based on the presumed existence of a
thermodynamic Kauzmann transition, leads to z(T
K) .
However, experiments suggest only modest values of z ~ 3-5
even at Tg.
We analyze our theoretical data in the AG-like spirit in
two different ways. First, per Eq.(I.50), a well-defined theoretical
approach based on our two barrier picture is :
z(T ) 1F
elastic(T )
FB(T )
(45)
Alternatively, since barriers are not observable, a pragmatic
approach often employed in simulation and experimental studies
is to identify the degree of effective cooperativity as
z(T ) Wln(
/
s)
EA
(46)
where the numerical factor W is chosen such that z1 at high
temperature, consistent with the empirical extraction of an
apparent Arrhenius barrier.
The main frame of Fig. 13 shows ECNLE theory
calculations of z(T) based on Eqs.(45) and (46) for two
representative systems. With cooling, one sees a smooth growth
with z ~2.4 or ~3.5-5 at Tg depending on which metric is used.
The inset plots the inverse cooperativity parameter versus
temperature down to Tg. Although z(T) never diverges (one can
see the curvature below Tg in the plots), in the Adam-Gibbs
entropy crisis spirit we linearly extrapolate its inverse to zero to
estimate a dynamic analogue of TK. Results obtained from both
approaches are given in Table 1; the numbers are reasonable, and
bracket the VFT extrapolated dynamic divergence temperature.
Table 2 shows the ratio of the mean TK to Tg agrees quite well
with (often imprecise) experimental estimates. The deduced
ratios of TK/Tvft also seem reasonable; recall that in experiment
they are sometimes close to unity, but are known to show
significant deviations in both directions for diverse materials [71,
74]. We emphasize that in our approach there are no true
divergences, so we ascribe no physical significance to the
extrapolations. However, the sensibility of our extracted
divergence temperatures compared to experimental estimates is
meaningful.
Page 14
14
Figure 13: Theoretical cooperativity parameter, z, as a function of
/g
T T for glycerol(blue circles) and TNB(red squares); the TNB
results are representative of what we find for all vdW liquids studied.
The closed symbols are calculations based on Eq. (45) and the open
symbols employ Eq. (46). Inset: Inverse cooperativity parameter versus
temperature and its linear extrapolation to zero to extract an apparent
Kauzman temperature. The symbols retain the same meaning. The
extrapolation using Eq. (45) is labeled TK(alt), while Eq. (46) is
employed to extract TK. The “x” symbols are the cooperativity
parameter for TNB below Tg showing that the extrapolation of
z1 0 is not really justified.
E. Dynamic Facilitation
Values of the extracted defect energy (J) and onset
temperature (To) based on parabolic law fits are shown in Tables
1 and 2; Table 3 lists J in units of kBTo, and the alpha time at To
All the extracted numbers seem very reasonable compared to
prior fits of Eq.(43) to experimental data [70]. Overall, Eq.(43)
provides a remarkably good and consistent fit of our theoretical
calculations in the deeply supercooled regime. However, the
physics underlying ECNLE theory is not dynamic facilitation, at
least not in the sense of a literal conserved population of mobile
defects.
We emphasize that in the ECNLE framework the
“parabolic law” idea is not unique. Rather, there are multiple
versions in the sense that the total barrier can be expressed as a
quadratic function of diverse control variables (both dynamic and
static), which all accurately capture our numerical results in the
deeply supercooled regime. These control variables include: (i)
the compressibility factor Z P / (Eq(I.41)), (ii) the local
barrier F
B, (iii) the inverse dimensionless compressibility (or
bulk modulus) S
0
1 , (iv) the inverse temperature, and (v) the
inverse localization length r
loc
1. Within ECNLE, the fundamental
variable is the dynamic locr , and all other representations are
consequences of the degeneracy between these variables,
established theoretically via the ultra-local limit analysis
discussed in paper I. Because we take the hard sphere fluid to be
a quasi-universal model, these relations are carried over directly
to thermal liquids via our mapping.
F. Two-Barrier Phenomenological Models
Underlying Eq.(44) is a crossover temperature, TR,
where the apparent Arrhenius and cooperative barriers are equal.
In terms of ECNLE theory, this corresponds to:
E
A E
coop(T
R) F
B(T
R) F
elastic(T
R) E
A. Tables 1 and 2 show
our calculations of TR. The values agree well with experimental
results for 15 vdW molecules that found [22, 40] the nearly
universal result T
R/ T
g1.13 0.02 ; significantly larger values
are observed (and predicted) for alcohols. Table 3 shows the
alpha time at TR can vary by roughly 4 orders of magnitude. One
also sees from Table 3 the predicted apparent high temperature
Arrhenius barriers agree quite well with those extracted
experimentally, including the nearly universal value of
EA/kBTg~11 for vdW molecules [22, 39, 40]. The experimental
estimate of E
coop/ E
A 2.2 at Tg suggests an AG parameter of z ~
3.2, consistent with our calculations.
Overall, we conclude that the ECNLE theory form of
(T ) , and the characteristic temperatures, energy scales and
time scales extracted from it, are consistent with diverse glassy
dynamics models. Given these diverse models generally claim
good agreement with experiment based on multi-parameter fits,
we feel this provides support for the accuracy of our approach.
However, we emphasize that our physical picture is
fundamentally different than the models discussed in this section,
involves no fitting parameters, and is applicable in all “regimes”.
VIII. SUMMARY AND DISCUSSION
We have proposed a mapping from thermal liquids to an
effective hard sphere fluid based on matching the
thermodynamic-state-dependent dimensionless “long”
wavelength amplitude of density fluctuations, or compressibility.
Coupled with the ECNLE theory of the alpha relaxation in hard
sphere fluids, this mapping results in a zero adjustable parameter
theory that can be applied to quantitatively treat alpha relaxation
over 14 or more decades in time in a unified manner. The theory
has no singularities above zero Kelvin, and relaxation in the
equilibrium low temperature limit is predicted to be of a roughly
Arrhenius form due to condensation of the liquid into the bottom
of the potential energy landscape.
The basic excitation in the theory is of mixed local-
nonlocal spatial form reflecting a cage scale activated process
which requires a long range collective elastic fluctuation in order
to occur. This leads to a two-barrier description that is the key to
the rich dynamic behavior predicted, encompassing apparent
Arrhenius, crossover, and deeply supercooled “regimes”, and
multiple time and temperature characteristic crossovers. The
theory also has multiple growing length scales upon cooling
which reflect distinct aspects of the activation event. Of special
interest is the experimentally measurable activation volume [13,
60], which is accurately predicted and correlates with a dynamic
heterogeneity length scale and also the number of correlated
Page 15
15
particles as deduced from nonlinear dielectric and other
measurements[62,63].
The calculated effects of pressure are qualitatively
reasonable, although systematically too large. The theory also
predicts a narrower range of dynamic fragilities than observed in
thermal liquids. We believe these quantitative inaccuracies are
likely unavoidable given the highly simplified mapping to an
effective hard sphere model, which will be of different accuracy
for chemically different classes of glass forming molecules. The
local structure errors it incurs enter via the NLE dynamic free
energy.
Concerning simulation tests of the core ideas underlying
ECNLE theory, an analysis of the particle displacement field
associated with the alpha event would be valuable, as done
experimentally using confocal microscopy for glassy hard sphere
colloidal suspensions [75]. There has been some effort in this
direction in the precursor regime accessible on the computer,
e.g., the democratic cluster [76] and metabasin [77] analyses.
More work is required to search for the long range elastic
distortion field that underpins the collective physics, although a
very recent simulations [78] seem qualitatively consistent with
our view.
Of course, the theory makes many approximations, of
both a molecular model nature and with regards to the statistical
mechanics. These include ignoring the explicit effects of
nonspherical molecular shape and its consequences on packing,
rotational versus translational motion and their coupling, possible
anisotropy of the long range elastic strain field, and individual
effects of repulsive versus attractive forces on structure and
dynamics. Some of these might be explicitly addressed by
building on our recent progress for nonspherical colloids using
NLE theory [79-83]. Accounting for these factors at a
microscopic level will “break” the quasi-universal nature of the
present formulation based on effective hard spheres. In this
regard, we note that for real molecules one expects the
microscopic jump length, r , depends on non-universal details,
and both the absolute magnitude and range of fragilities
predicted by ECNLE theory are sensitive to this local dynamical
quantity.
There are also the questions of dynamic heterogeneity
and decoupling. Temporal heterogeneity is present at the cage
level (e.g., Poissonian distribution of hopping times [84]), but
will enter in a different, yet to be determined manner at the long
range elastic distortion level. However, on general grounds we
know that the local softening that occurs after the first relaxation
event will reduce the collective elastic barrier in its spatial
vicinity. This may then “facilitate” faster subsequent alpha
events, in the spirit of the central ansatz of kinetic constraint
models [18].
Despite the relative simplicity of the present theory, its
predictive molecular character provides exciting opportunities to
address other open problems of fundamental and materials
science importance. For example, how does polymer
conformation and connectivity determine the chain length
dependence of the alpha time [4,5,85], and the uniquely
polymeric “decoupling” of macromolecular versus segmental
relaxation in melts [4,5,86, 87]? How does thin film confinement
and surface/interface effects modify the alpha process and Tg? Is
there a relationship between our dynamic approach and
configurational and/or excess vibrational entropy [88] ideas? All
these problems are presently under study.
Acknowledgements
We acknowledge support from the Division of Materials Science
and Engineering, U.S. Department of Energy, Office of Basic
Energy Sciences via ORNL. Discussions and/or correspondence
with Jeppe Dyre, Mark Ediger, Alexei Sokolov, Matthieu Wyart,
and Ernst Rossler are gratefully acknowledged.
---------------------------------
[1] M. Beiner, H. Huth, and K. Schröter, J. Non-Cryst. Sol., 279, 126 (2001).
[2] G. Biroli,and J-P. Bouchaud, in Structural Glasses and
Supercooled Liquids:Theory, Experiment and Applications, edited by P.G.Wolynes,V.Lubchenko eds.,Wiley & Sons, 2012) pp 34-113.
[3] C. A. Angell, K. L. Ngai, G. B. McKenna, P.F. McMillan, and S. W. Martin, J. Appl. Phys. 88, 3113 (2000).
[4] C. M. Roland, Soft Matt., 4, 2316 (2008). [5] C.M.Roland, Macromolecules 43, 7875 (2010). [6] Paper I: S.Mirigian and K.S.Schweizer, J.Chem.Phys.,
preceding article. [7] J-P. Hansen, I. R. McDonald, Theory of Simple Liquids
(Academic Press, London 1986). [8] T.S.Ingebrigtsen, T.B.Schroeder and J.C.Dyre, Phys.Rev.X,
2, 011011 (2012). [9] U. R. Pedersen, N. P. Bailey, T. B. Schrøder, and J. C. Dyre,
Phys. Rev. Lett., 100, 015701 (2008). [10] U. R. Pedersen, T. Christensen, T. B. Schrøder, J. C. Dyre,
Phys. Rev. E, 77, 011201 (2008). [11] J. C. Dyre, T. Christensen, N. B. Olsen, J. Non-Cryst. Solids,
352 4635 (2006). [12] J.C. Dyre, Rev. Mod. Phys., 78, 953 (2006). [13] L. Hong, P. D. Gujrati, V. N. Novikov, and A. P. Sokolov, J.
Chem. Phys., 131, 194511 (2009). [14] L. Hong, V. N. Novikov, and A. P. Sokolov, Phys. Rev. E,
83, 061508 (2011). [15] W. Gotze, Complex Dynamics of Glass-Forming Liquids: A
Mode-Coupling Theory, Oxford University Press, 2009. [16] G. Adam and J. H. Gibbs, J. Chem. Phys., 43, 139 (1965). [17] V. Lubchenko and P. G. Wolynes, Ann. Rev. Phys. Chem.,
58, 235 (2007). [18] D. Chandler and J. P. Garrahan, Ann. Rev. of Phys. Chem.,
61, 191 (2010). [19] G.Tarjus, D.Kivelson and P.Viot, J.Phys.Condens.Matter,
12, 6497 (2000). [20] G. Tarjus and D. Kivelson, in Jamming and Rheology:
Constrained Dynamics on Microscopic and Macroscopic Scales, edited by S. Edwards, A. Liu, and S. Nagel(Taylor Francis, New York 2001), pp 20-37.
[22] N. Petzold, B. Schmidtke, R. Kahlau, D. Bock, R. Meier, B. Micko, D. Kruk, and E. A. Rössler, J. Chem. Phys., 138, 12A510 (2013).
Page 16
16
[23] E. G. D. Cohen, R. Verberg, and I. M. de Schepper, Physica A, 251, 251 (1998).
[24] R. Verberg, I. M. de Schepper, and E. G. D. Cohen, Phys. Rev. E, 55, 3143 (1997).
[25] V. N. Novikov and E. A. Rössler, Polymer, 54, 6987 (2013).
[26] H. A. Kramers, Physica, 7(4), 284 (1940). [27] P. Hänggi, P. Talkner, M. Borkovec, Rev. Mod. Phys.,
62(2), 251 (1990). [28] E. J. Saltzman and K. S. Schweizer, J. Phys.: Condens.
Matt., 19, 205123 (2007). [29] T. Kanaya, I. Tsukushi, K. Kaji, B. J. Gabrys, S. M.
Bennington, and H. Furuya, Phys. Rev. B, 64, 144202 (2001).
[30] T.Kanaya and K.Kaji, Adv.Polym.Sci., 154, 87 (2001). [31] G. Parisi and F. Zamponi, Rev. Mod. Phys, 82, 789 (2010). [32] S.Torquato and F.H.Stillinger, Rev.Mod.Phys. 82, 2633
(2010). [33] K. S. Schweizer, J. Chem. Phys., 127, 164506 (2007). [34] C.Levelut, A.Faivre, R.LeParc, B.Champagnon,
J.L.Hazemann and J.P.Simon, Phys.Rev.B, 72, 224201 (2005).
[35] I. Saika-Voivod, F. Sciortino, and P. H. Poole, Phys. Rev. E, 63, 011202(2000).
[36] J.Horbach and W.Kob, Phys.Rev.B, 60, 3169 (1999). [37] N.Kuzuu, K.Nagai, M.Tanaka, and Y.Tamai, Jap. J.
App.Phys. 44, 8086 (2005). [38] J. Zhao, S. L. Simon, and G. B. McKenna, Nat. Comm., 4,
1783 (2009). [39] D. Kivelson, G. Tarjus, X. Zhao, and S. A. Kivelson, Phys.
Rev. E, 53(1), 751 (1996). [40] B. Schmidtke, N. Petzold, R. Kahlau, M. Hofmann, and E.
A. Rössler, Phys. Rev. E, 86, 041507 (2012). [41] M. O. McLinden and J. D. Splett, J. Res. Natl. Inst. Stand.
Technol., 113, 29 (2008). [42] J. Opdycke, J. P. Dawson, R. K. Clark, M. Dutton, J. J.
Ewing, and H. H. Schmidt, J. Phys. Chem., 68(9), 2385 (1964).
[43] M. Naoki and S. Koeda, J. Phys. Chem., 93, 948 (1989). [44] L. Comez, S. Corezzi, D. Fioretto, H. Kriegs, A. Best, and
W. Steffen, Phys. Rev. E, 70, 011504 (2004). [45] T. F. Sun, J. A. Schouten, and S. N. Biswas, Int. J.
Thermophys., 12(2), 381 (1991). [46]Handbook of Chemistry and Physics, 94th Ed., (46 Press,
Boca Raton 2013), p. 6-160. [47] M. Naoki, K. Ujita, and S. Kashima, J. Phys. Chem. 97,
12356 (1993). [48] N. B. Vargaftik, V. P. Kozhevnikov, and V. A. Alekseev, J.
Eng. Phys., 35(6), 1415 (1978). [49] S. C. Jain and V. S. Nanda, J. Phys. C: Sol. State Phys., 4,
3045 (1971). [50] W. B. Streett, L. S. Sagan, and L. A. K. Stavely, J. Chem.
Thermo., 5(5), 633 (1973). [51] E. Rössler, U. Warschewske, P. Eiermann, A. P. Sokolov,
and D. Quitmann, J. of Non-Cryst. Sol., 172-174, 113 (1994).
[52] R. Richert, K. Duwuri, and L-T. Duong, J. Chem. Phys., 118, 1828 (2003).
[53] N. Menon, K. P. O’Brien, P. K. Dixon, L. Wu, S. R. Nagel, B. D. Williams, and J. P. Carini, J. of Non-Crystalline Solids,
141, p61-65(1992). [54] A. DöB, G. Hinze, B. Schiener, J. Hemberger, and R.
Böhmer, J. Chem. Phys., 107, 1740(1997) [55] C. Alba, L. E. Busse, D. J. List, and C. A. Angell, J. Chem.
Phys., 92, 617 (1990). [56] Q. Qin, G. B. McKenna, J. Non-Cryst. Sol. 352, 2977
(2006). [57] R. Böhmer, K. L. Ngai, C. A. Angell, and D. J. Plazek, J.
Chem. Phys., 99(5), 4201 (1993). [58] C. Kliber, T. Hecksher, T. Pezeril, D. H. Torchinsky, J. C.
Dyre, and K. A. Nelson, J. Chem. Phys., 138, 12A544 (2013).
[59] J. C. Dyre, J. Non-Cryst. Solids, 235-237, 142 (1998). [60] C. M. Roland, S. Hensel-Bielowka, M. Paluch, and R.
Casalini, Rep. Prog. Phys., 68, 1405 (2005). [61] A. Patkowski, M. Matos Lopes, and E. W. Fischer, J. Chem.
Phys., 119(3), 1579 (2003) [62]C.Crauste-Thibierge, C.Brun, F.Ladieu, D.L’Hote, G.Biroli
and J.P.Bouchaud, Phys.Rev.Lett. 104, 165703 (2010). [63] Th. Bauer, P. Lunkenheimer, and A. Loidl, Phys. Rev.
Lett., 111 [64] E.W.Fischer, PhysicaA, 210, 183 (1993). [65] D. Turnbull and M. H. Cohen, J. Chem. Phys., 52(6),
3038 (1970). [67] F. Stickel, E. W. Fischer, and R. Richert, J. Chem. Phys.,
102(15), 6251 (1995). [68] K. L. Ngai, J. Non-Cryst. Sol., 275, 7 (2000). [70] Y. S. Elmatad, D. Chandler, and J. P. Garrahan, J. Phys.
Chem. B, 113, 5563 (2009). [71] Y. S. Elmatad, D. Chandler, and J. P. Garrahan, J. Phys.
Chem. B, 114, 17113 (2010). [72] S.L.Chan and S.R.Elliott, J.Phys.Condensed Matter 3,
1269 (1991). [73]C.A.Angell,J. Res. Natl. Inst. Stand. Technol., 102, 171
(1997). [74] H.Tanaka, Phys. Rev. Lett. 90, 055701 (2003) [75] P. Schall, D. A. Weitz, and F. Spaepen, Science, 318, 1895
(2007). [76] G.A.Appignanesi, J.A.Rodriguez-Fris, R.A.Montani and
W.Kob, Phys.Rev.Lett. 96, 057801 (2006). [77] B.Doliwa and A.Heuer, Phys.Rev.E 67, 031506 (2003). [78] J. Chattoraj and A. Lemaître, Phys. Rev. Lett., 111,
066001 (2013). [79] G. Yatsenko and K. S. Schweizer, J. Chem. Phys., 126,
014505 (2007). [80] D. C. Viehman and K. S. Schweizer, Phys. Rev. E, 78,
051404 (2008). [81] M.Tripathy and K.S.Schweizer, J.Chem. Phys., 130,
244906 (2009). [82] J.Yang and K.S.Schweizer, J. Chem. Phys., 134,
204908(2011). [83] R. Zhang and K. S. Schweizer, Phys. Rev. E, 80, 011502
(2009). [84] E. J. Saltzman and K. S. Schweizer, J. Chem. Phys., 125,
044509 (2006). [85] J. Hintermeyer, A. Hermann, R. Kahlau, C. Goiceannu
and E.A.Rossler, Macromolecules 41, 9335 (2008).
Page 17
17
[86] K.Ding and A.P.Sokolov, Macromolecules 39, 3322 (2006)
[87] A. P. Sokolov and K. S. Schweizer, Phys. Rev. Lett., 102, 248301 (2009).
[88] M. Wyart, Phys. Rev. Lett. 104, 095901 (2010).
Page 18
18
Table 1: Key parameters of the mapping, theoretical characteristic temperatures
(Kelvin), and fragilities. The mapping parameters are dimensionless except for B,
which is in units of K. See the text for definitions of the various temperature scales.
Experimental numbers are reported where available for the glass transition temperature
and fragility. Results based on two definitions of a Kauzman-like temperature are
reported; TK corresponds to Eq. 46 and TK(alt) corresponds to Eq. 45. References given
next to the molecule names refer to sources for the equation of state data used to
determine the parameters A and B. Two sets of results are shown for sorbitol based on
Eq. 8 and Eq. 2 (indicated by *) #A wide range of fragilities are reported for toluene in the literature, ranging from 59[56]
to 115[55].
Ns A B Tg
(th,expt)
m
(th,expt) TA TA,eff, TX T0 TB, T’ TR, T* TVFT
TK,
TK(alt)
Toluene[41] 7 1.23 1158 166,
126[55]
90,
115#[55]
321 230, 238 221 211,
204 185, 175 128 139, 116
Biphenyl[42] 12 1.34 1400 245, -- 96, -- 445 330, 340 319 306,
296 268, 257 192 207, 176
OTP[43] 18 0.43 1068 267,
246[56]
82,
81[56] 558 379, 394 365
346,
333 305, 281 201 220, 177
TNB 36 0.43 1068 362,
344[56]
84,
86[56] 721 504, 523 486
462,
446 406, 379 276 300, 246
Salol[44] 16 0.51 1104 257,
218[57]
83,
73[57] 532 364, 379 350
333,
320 293, 271 195 212, 172
Ethanol[45] 3 0.18 863 96,
92.5[56]
79,
55[56] 226 144, 150 137
129,
124 115, 102 71 78, 60
Glycerol[46] 6 -1.3 992 203,
190[56]
59,
53[56] 785 352, 376 329
299,
283 280, 219 139 150, 99
Sorbitol[47] 12 -1.33 1104 362,
266[56]
53,
93[56] 2288 697, 760 642
568,
535 560, 396 238 250, 145
Sorbitol*[47] 12 -- -- 368,
266[56]
62,
93[56] 656 502, 516 589
465,
456 387, 393 274 286, 242
Cesium[48] 1 -0.52 1675 114, -- 73, -- 291 175, 184 167 156,
149 139, 122 83 91, 69
Rubidium[48] 1 -0.67 2185 150, -- 73, -- 389 232, 244 221 206,
197 185, 161 109 120, 90
Argon[49] 1 4.57 783 40, -- 97, -- 72 53, 55 52 49, 48 43, 42 31 34, 28
Xenon[50] 1 2.81 1194 67, -- 87, -- 131 93, 96 89 85, 82 75, 70 51 55, 46
Page 19
19
TA TA,eff, TX T0 TB, T’ TR, T* TVFT,
Toluene 1.93 1.38, 1.43 1.33 1.27, 1.23 1.11, 1.05 0.77, 0.77
Biphenyl 1.81 1.34, 1.39 1.3 1.25, 1.21 1.09, 1.05 0.78, 0.78
OTP 2.09 1.42, 1.48
(1.43)
1.37
(1.39)
1.3, 1.25 1.14, 1.05 0.75, 0.74
TNB 1.99 1.39, 1.44 1.34
(1.47)
1.28, 1.23 1.12, 1.05 0.76, 0.75
Salol 2.06 1.42, 1.47
(1.35)
1.36
(1.4)
1.29, 1.24 1.14, 1.05 0.76, 0.75
Ethanol 2.37 1.5, 1.57 1.43 1.35, 1.29 1.2, 1.07 0.74, 0.72
Glycerol 3.88 1.74, 1.86
(1.68)
1.62 1.48, 1.4 1.38, 1.08 0.69, 0.62
Sorbitol 6.32 1.93, 2.1 1.77 1.57, 1.48 1.55, 1.09 0.66, 0.55
Sorbitol* 1.78 1.36, 1.4 1.6 1.26, 1.24 1.05, 1.07 0.74, 0.72
Rubidium 2.6 1.55, 1.63 1.47 1.38, 1.31 1.23, 1.07 0.73, 0.7
Cesium 2.55 1.53, 1.61 1.46 1.37, 1.31 1.22, 1.07 0.73, 0.7
Argon 1.82 1.35, 1.39 1.3 1.25, 1.21 1.09, 1.05 0.78, 0.78
Xenon 1.97 1.39, 1.44 1.34 1.28, 1.23 1.12, 1.05 0.77, 0.76
Table 2: Characteristic temperatures normalized by the theoretical Tg. represents
the average of TK and TK(alt), normalized by Tg. Where available, comparable numbers
for TA,eff[39] and for T0[70] are reported in parentheses underneath our calculated
numbers.
Page 20
20
Toluene 9.99 1574
(1440)
9.5
(12.3)
6.9 -10.18 -9.79 -5.04
Biphenyl 10.98 2470 10.1 7.5 -10.1 -9.71 -4.31
OTP 8.97
(7.7-8.6)
2357
(2441)
8.8
(10)
6.2 -9.97 -9.59
(-8.9)
-5.49
TNB 9.52
(7.1)
3310
(3232)
9.1
(9.4)
6.6 -9.8 -9.41
(-9.2)
-4.96
Salol 9.1
(8.1-9.1)
2294
(2104)
8.9
(9.6)
6.3 -10.03 -9.64
(-8.5)
-5.45
Ethanol 7.87 792 8.3 5.5 -10.87 -10.48 -7.11
Glycerol 5.33
(4.1)
1395
(2271)
6.9
(12.1)
4.0 -10.33 -9.94
(-7.7)
-8.25
Sorbitol 4.3 2380 6.6 3.4 -10.3 -9.91 -8.86
Sorbitol* 6.14 5089 13.8 7.75 -10.3 -11.13 -1.04
Rubidium 7.15 1175 7.8 5.1 -10.65 -10.26 -7.36
Cesium 7.26 898 7.9 5.1 -10.46 -10.07 -7.1
Argon 10.94 399 10.1 7.5 -10.24 -9.85 -4.47
Xenon 9.67 616 9.3 6.7 -10.03 -9.64 -5.09
Table 3: Analysis of our theoretical calculations as data in the context of
phenomenological models. The left four columns in the table show relevant energy
scales, while the right columns show relevant timescales. The parabolic law parameters J
and T0 correspond to Eq. 43; EA is the apparent Arrhenius energy, which describes our
calculations up to a temperature TA,eff; the temperature TR is where the magnitude of the
two barriers are equal per the experimental analysis of Rössler and coworkers[40]. See
text for details. Where available, the empirically deduced values from experimental
fits[40,70] are reported in parentheses under our calculation.