Elasticity of ferropericlase and seismic heterogeneityin the Earth’s lower mantleJing Yang1 , Jung-Fu Lin1,2 , Steven D. Jacobsen3 , Nikki M. Seymour1 ,Sergey N. Tkachev4 , and Vitali B. Prakapenka4
1Department of Geological Sciences, Jackson School of Geosciences, University of Texas at Austin, Austin, Texas, USA,2Center for High Pressure Science and Technology Advanced Research (HPSTAR), Shanghai, China, 3Department of Earthand Planetary Sciences, Northwestern University, Evanston, Illinois, USA, 4Center for Advanced Radiation Sources,University of Chicago, Chicago, Illinois, USA
Abstract Deciphering the origin of seismic heterogeneity has been one of the major challenges inunderstanding the geochemistry and geodynamics of the deep mantle. Fully anisotropic elastic propertiesof constituent minerals at relevant pressure-temperature conditions of the lower mantle can be used tocalculate seismic heterogeneity parameters in order to better understand chemically and thermally inducedseismic heterogeneities. In this study, the single-crystal elastic properties of ferropericlase (Mg0.94Fe0.06)Owere measured using Brillouin spectroscopy and X-ray diffraction at conditions up to 50GPa and 900 K. Thevelocity-density results were modeled using third-order finite-strain theory and thermoelastic equationsalong a representative geotherm to investigate high pressure-temperature and compositional effects on theseismic heterogeneity parameters. Our results demonstrate that from 660 to 2000 km, compressional waveanisotropy of ferropericlase increased from 4% to 9.7%, while shear wave anisotropy increased from 9% to ashigh as 22.5%. The thermally induced lateral heterogeneity ratio (RS/P= ∂lnVS/∂lnVP) of ferropericlasewas calculated to be 1.48 at ambient pressure but decreased to 1.43 at 40GPa along a representativegeotherm. The RS/P of a simplified pyrolite model consisting of 80% bridgmanite and 20% ferropericlasewas approximately 1.5, consistent with seismic models at depths from 670 to 1500 km, but showed anincreased mismatch at lower mantle depths below ~1500 km. This discrepancy below mid-lower mantlecould be due to either a contribution from chemically induced heterogeneity or the effects of the Fe spintransition in the deeper parts of the Earth’s lower mantle.
1. Introduction
Seismic heterogeneities within the Earth’s lower mantle are typically attributed to thermal and/or chemicalvariations of the constituent materials [Karato and Karki, 2001]. Some authors have suggested that hetero-geneity of the lower mantle is dominantly due to thermal effects [Forte, 2000; Forte et al., 1994; Hager et al.,1984], while chemical heterogeneity has been invoked by other studies to explain large low-shear-velocityprovinces (LLSVPs) in the lowermost mantle beneath the Pacific and African plates [Garnero and McNamara,2008; van der Hilst and Kárason, 1999]. A more recent study has proposed a combined thermochemicalmechanism for the development of the seismic structure of LLSVPs based on their long-wavelength struc-ture, lateral shear-velocity anisotropy, sharp velocity gradients along their margins, and anticorrelated bulkand shear velocities [Davies et al., 2015]. Distinguishing between the thermal and chemical contributions toseismic heterogeneities of the lower mantle from a material properties perspective is critical as eachmechanism has drastically different implications for our understanding of the geodynamics, geochemistry,and thermal evolution of the planet’s interior. Our present understanding of the origin of the lateral hetero-geneity in the lower mantle minerals remains mostly theoretical [Tsuchiya, 2011; Wu and Wentzcovitch,2014]. However, comparisons of lateral variations in seismic shear wave (VS) and compressional wave (VP)velocities, given as RS/P= ∂lnVS/∂lnVP, in conjunction with mineral physics elasticity experiments on lowermantle minerals at relevant pressure-temperature (P-T) conditions, can provide new constraints on thelower mantle seismic structures and dynamics.
Based on the pyrolite model, Earth’s lower mantle, the most voluminous layer of the planet, consists ofapproximately 75% bridgmanite (Mg,Fe)SiO3, 20% ferropericlase (Mg,Fe)O, and 5% Ca-silicate perovskite(CaSiO3) [Ringwood, 1975]. Accurate determinations of the elastic properties of deep Earth materials underthe relevant P-T conditions are essential for understanding seismic models of the deep mantle. It has been
YANG ET AL. FERROPERICLASE HIGH PRESSURE-TEMPERATURE ELASTICITY 8488
PUBLICATIONSJournal of Geophysical Research: Solid Earth
RESEARCH ARTICLE10.1002/2016JB013352
Key Points:• Single-crystal elastic constants offerropericlase were measured athigh P-T
• Lateral heterogeneity in a pyroliteaggregate has been determinedalong geotherm
Citation:Yang, J., J.-F. Lin, S. D. Jacobsen,N. M. Seymour, S. N. Tkachev, andV. B. Prakapenka (2016), Elasticityof ferropericlase and seismicheterogeneity in the Earth’s lowermantle, J. Geophys. Res. Solid Earth, 121,8488–8500, doi:10.1002/2016JB013352.
Received 11 JUL 2016Accepted 20 NOV 2016Accepted article online 22 NOV 2016Published online 16 DEC 2016
suggested that variations in mineralogy, Fe or Al content of bridgmanite, and Fe spin states are plausiblecandidates for lateral heterogeneity in Earth’s lower mantle [Jackson et al., 2005; McCammon et al., 2008].Changes in the elasticity and texture of ferropericlase, including the effects of the spin transition, have alsobeen proposed as potential sources of mid-lower mantle seismic heterogeneities [Karato and Karki, 2001;Wu and Wentzcovitch, 2014]. The elasticity of ferropericlase with varying Fe content has been experimen-tally and theoretically studied at lower mantle pressures across the spin transition, showing that VP is sig-nificantly reduced while Vs remains unaffected over the transition [Marquardt et al., 2009; Wu et al., 2013;Wu and Wentzcovitch, 2014; Yang et al., 2015]. Ferropericlase is a rheologically weaker phase compared tobridgmanite and can develop a strong lattice preferred orientation, producing shear wave anisotropyVSH> VSV (where VSH and VSV are the velocities of the horizontally and vertically polarized seismic shearwaves, respectively) in the lower mantle [Yamazaki and Karato, 2002]. However, the contribution of ferro-periclase to the thermal and chemical heterogeneities has remained theoretical. Fully resolving its density,elastic constants, and bulk and shear moduli under high P-T conditions is critical to rigorously test theo-retical calculations against experimental data and explicitly elucidate the thermal and chemical variationsin the lower mantle.
Here we have measured the acoustic wave velocities and density of synthetic single-crystal ferropericlase[(Mg0.96F0.06)O] at high P-T conditions up to 50GPa and 900 K using Brillouin light scattering (BLS) combinedwith X-ray diffraction (XRD) in an externally heated diamond anvil cell (EHDAC). Using these data, we havecalculated elastic and seismic properties of ferropericlase along a representative lower mantle geothermand discuss the potential contribution of ferropericlase on seismic heterogeneities of the lower mantle.
2. Experimental Methods
Single-crystal ferropericlase with XFe = Fe/(Mg+ Fe) = 0.06 ((Mg0.94Fe0.06)O, hereafter denoted as fp6) wassynthesized through the interdiffusion of Fe and Mg between single-crystal periclase (MgO) and prereacted(Mg,Fe)O powders [Jacobsen et al., 2002]. The ferric-iron content Fe3+/SFe = 0.02(1); density ρ0 = 3723 kg/m3;and other details of synthesis, structure, and elastic properties of the sample at ambient conditions werereported by Jacobsen et al. [2002]. For high P-T Brillouin and XRD measurements, thin plates of the single-crystal ferropericlase were polished on both sides perpendicular to [100] to ~12μm in thickness and thencleaved into several ~70 × 70μm square pieces. Single-crystal XRD patterns with an incident X-ray wave-length of 0.3344 Å were used to determine sample orientation and density at beamline 13-BMD inGeoSoilEnviroConsortium for Advanced Radiation Sources (GSECARS) of the Advanced Photon Source,Argonne National Laboratory (APS, ANL). Re-W alloy, which is more stable at high temperatures than a typicalRe gasket, was used as the gasket material for high P-T experiments. A 250μm thick gasket was preindentedto ~30–40μm by a pair of diamonds with a 300μm culet size in an EHDAC [Kantor et al., 2012]. A hole of170μm was subsequently drilled and used as sample chamber. The ferropericlase crystal was loaded intothe EHDAC sample chamber together with Au powder, which served as the pressure calibrant at high P-T[Fei et al., 2007], and an ~5μm ruby sphere, used as the pressure indicator for loading Ne gas pressure med-ium. The temperature of the sample in the EHDAC was measured using an R-type thermocouple attached toone of the diamond anvils approximately 500μm away from the diamond culet. The EHDAC was equippedwith an alumina ceramic heater coiled with two pieces of Pt wire of 200μm diameter and 48 cm in length[Kantor et al., 2012]. Four experimental runs at GSECARS were conducted over a 2 year period totaling ~608 h shifts to collect the data presented here.
High P-T Brillouin measurements were conducted at stepwise pressures up to 50GPa at 4 constanttemperatures of 300 K, 550 K, 750 K, and 900 K at 13 BMD in GSECARS of the APS, ANL. To avoid potentialoxidation of the diamond anvils and Pt wires at high temperature, Ar gas with 2% H2 gas continuouslyflowed into the EHDAC during heating. A solid state Verdi V2 laser with a wavelength of 532 nm and apower of 0.4W was used for Brillouin measurements. Brillouin spectra were collected in asymmetric forwardscattering geometry with an external scattering angle of 50° using a six-pass tandem Fabry-Perot interfe-rometer. The acoustic velocities of the Brillouin spectra were derived from the measured Brillouin frequencyshift as follows:
VP;S ¼ λ0ΔvB2sin θ=2ð Þ ; (1)
Journal of Geophysical Research: Solid Earth 10.1002/2016JB013352
YANG ET AL. FERROPERICLASE HIGH PRESSURE-TEMPERATURE ELASTICITY 8489
where VP,S is the measured acousticvelocity, λ0 is the laser wavelengthof 532 nm, ΔvB is the Brillouin fre-quency shift, and θ is the externalscattering angle of 50°. The Brillouinspectra were collected along princi-ple axes [100] and [110] of single-crystal ferropericlase platelet, whichwere confirmed by in situ XRD pat-terns of the crystal before the mea-surements. XRD patterns of theferropericlase at each given P-Twere also used to determine thedensity (ρ) of the sample. The elasticconstants (C11, C12, and C44) of ferro-periclase were determined using thefollowing equations via least squaresregression:
VP 100½ � ¼ C11=ρð Þ1=2; (2)
VS 100½ � < 110 >¼ C44=ρð Þ1=2; (3)
VP 110½ � ¼ C11 þ C12 þ 2C44ð Þ=2ρ½ �1=2; (4)
VS 110½ � < 110 >¼ C11 � C12ð Þ=2ρ½ �1=2; (5)
where [uvw] represents the crystallographic direction of acoustic wave propagation, and <uvw> indicatesthe polarization direction. Pressure was determined from the measured lattice parameter of Au and cali-brated using the thermal equation of state [Fei et al., 2007]. Pressure was measured before and after eachBrillouin measurement, and the average pressure was used in the equation of state fitting. Errors are givenby their standard deviation (1σ).
3. Results and Thermoelastic Modeling
High P-T XRD patterns of the single-crystal ferropericlase (Mg0.94Fe0.06)O were collected up to 50GPa at tem-peratures of 300 K, 550 K, 750 K, and 900 K (Figure 1). The lattice parameters of ferropericlase were calculatedbased on four sets of diffraction peaks corresponding to {200}, {220}, {400}, and {420} equivalent reflections.Analysis of the XRD patterns of the sample also confirmed that the crystal was oriented in the (100) crystal-lographic plane within approximately �1° angular uncertainty at high P-T. The P-V curves at each tempera-ture were fitted using the third-order Birch-Murnaghan equation of state [Birch, 1947]. The calculateddensity as a function of pressure at 300 K was consistent with values reported by Jackson et al. [2006](Figure 1 inset). The thermal expansion coefficient α was calculated using
V Tð Þ ¼ V0exp ∫T
T0α Tð ÞdT
� �; (6)
where V0 is the volume at 300 K and α(T) is a constant at ambient pressure, with a value of 3.0 (1) × 10�5 K�1,determined by fitting the experimental data at ambient pressure. The pressure derivative of the thermalexpansion coefficient ∂α Tð Þ
∂P
� �is approximately � 1.0 × 10� 7 K� 1 GPa� 1.
High P-T Brillouin spectra of ferropericlase along the [100] and [110] crystallographic directions are shown inFigure 2. Most of the Brillouin spectra showed strong VP and VS peaks with high signal-to-noise ratios at high
Figure 1. Pressure-volume-temperature relations of single-crystal ferroperi-clase (Mg0.94Fe0.06)O from X-ray diffraction. The solid symbols are theexperimental measurements at 300 K (black), 550 K (blue), 750 K (green),and 900 K (red). The lines are the fits to experimental data using the third-order Birch-Murnaghan equation of state. The inset shows the density of theferropericlase as a function of pressure. The open circles are from Jacksonet al. [2006].
Journal of Geophysical Research: Solid Earth 10.1002/2016JB013352
YANG ET AL. FERROPERICLASE HIGH PRESSURE-TEMPERATURE ELASTICITY 8490
Figure 2. Representative Brillouin spectra of single-crystal ferropericlase (Mg0.94Fe0.06)O at high pressure and tempera-ture. Black line: collected raw data; red line: Lorentz peak fit. (top) Velocity measured along [100] crystallographicdirection and (bottom) velocity measured along [110] crystallographic direction.
Figure 3. Acoustic velocities of the single-crystal ferropericlase (Mg0.94Fe0.06)O along (left) [100] and (right) [110] crystal-lographic directions as a function of pressure and temperature. The lines are calculated from modeled results of theelastic constants using finite-strain theory (see Figure 3 for further details). Solid circles: this study; open circles:(Mg0.94Fe0.06)O crystal along same crystallographic directions reported by Jackson et al. [2006].
Journal of Geophysical Research: Solid Earth 10.1002/2016JB013352
YANG ET AL. FERROPERICLASE HIGH PRESSURE-TEMPERATURE ELASTICITY 8491
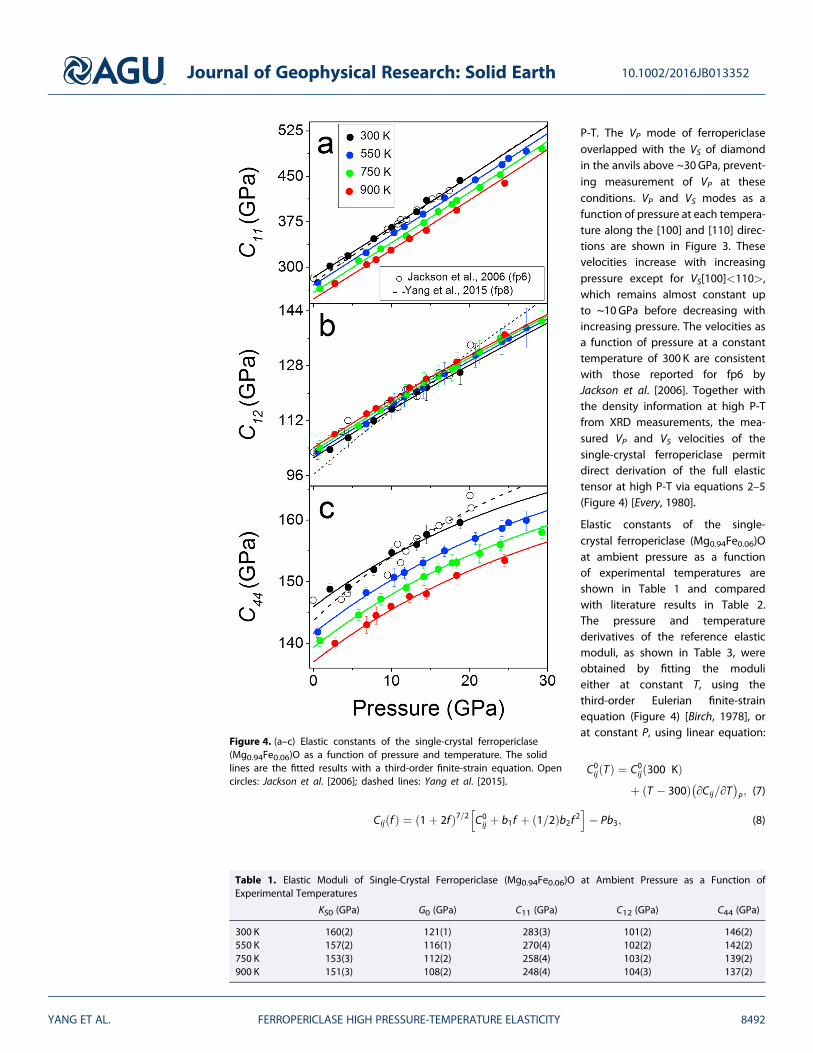
P-T. The VP mode of ferropericlaseoverlapped with the VS of diamondin the anvils above ~30GPa, prevent-ing measurement of VP at theseconditions. VP and VS modes as afunction of pressure at each tempera-ture along the [100] and [110] direc-tions are shown in Figure 3. Thesevelocities increase with increasingpressure except for VS[100]<110>,which remains almost constant upto ~10GPa before decreasing withincreasing pressure. The velocities asa function of pressure at a constanttemperature of 300 K are consistentwith those reported for fp6 byJackson et al. [2006]. Together withthe density information at high P-Tfrom XRD measurements, the mea-sured VP and VS velocities of thesingle-crystal ferropericlase permitdirect derivation of the full elastictensor at high P-T via equations 2–5(Figure 4) [Every, 1980].
Elastic constants of the single-crystal ferropericlase (Mg0.94Fe0.06)Oat ambient pressure as a functionof experimental temperatures areshown in Table 1 and comparedwith literature results in Table 2.The pressure and temperaturederivatives of the reference elasticmoduli, as shown in Table 3, wereobtained by fitting the modulieither at constant T, using thethird-order Eulerian finite-strainequation (Figure 4) [Birch, 1978], orat constant P, using linear equation:
C0ij Tð Þ ¼ C0
ij 300 Kð Þþ T � 300ð Þ ∂Cij=∂T
� �P; (7)
Cij fð Þ ¼ 1þ 2fð Þ7=2 C0ij þ b1f þ 1=2ð Þb2f 2
h i� Pb3; (8)
Figure 4. (a–c) Elastic constants of the single-crystal ferropericlase(Mg0.94Fe0.06)O as a function of pressure and temperature. The solidlines are the fitted results with a third-order finite-strain equation. Opencircles: Jackson et al. [2006]; dashed lines: Yang et al. [2015].
Table 1. Elastic Moduli of Single-Crystal Ferropericlase (Mg0.94Fe0.06)O at Ambient Pressure as a Function ofExperimental Temperatures
KS0 (GPa) G0 (GPa) C11 (GPa) C12 (GPa) C44 (GPa)
300 K 160(2) 121(1) 283(3) 101(2) 146(2)550 K 157(2) 116(1) 270(4) 102(2) 142(2)750 K 153(3) 112(2) 258(4) 103(2) 139(2)900 K 151(3) 108(2) 248(4) 104(3) 137(2)
Journal of Geophysical Research: Solid Earth 10.1002/2016JB013352
YANG ET AL. FERROPERICLASE HIGH PRESSURE-TEMPERATURE ELASTICITY 8492
b1 ¼ 3KS0 C0 0ij � b3
� �� 7C0
ij ; (9)
b2 ¼ 3K0S0 b1 þ 7C0
ij
� �� 16b1 � 49C0
ij ; (10)
f ¼ 1=2ð Þ V0=Vð Þ23 � 1h i
: (11)
where C0ij 300 Kð Þ is the derived elastic constant from measurements at ambient pressure and temperature
(300 K) and is thus fixed for the further modeling; C0ij Tð Þ is the elastic constant at high temperature and ambi-
ent pressure; C0ij and C
0 0ij is the elastic constant at ambient conditions and its first pressure derivative, respec-
tively; and V0 and V are the unit-cell volumes at ambient conditions and at high pressures, respectively.
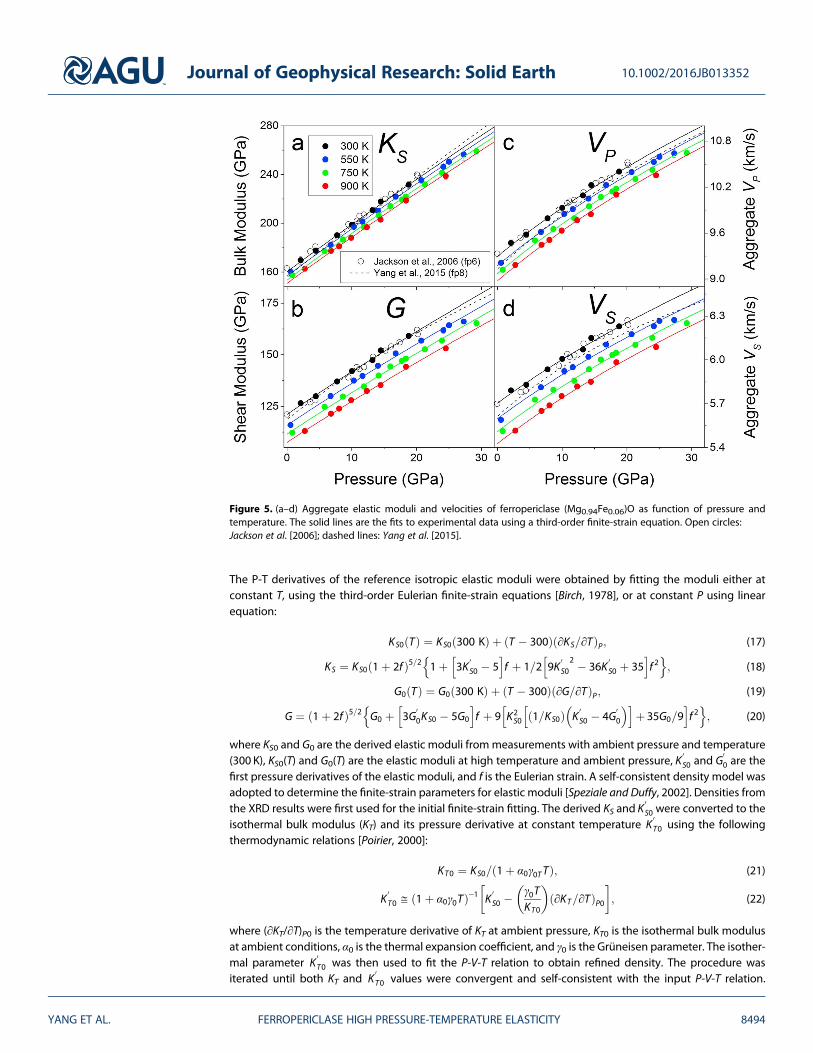
Using the derived elastic constants of the sample, the aggregate adiabatic bulk (KS) and shear moduli (G)were calculated using the Voigt-Ruess-Hill averages [Hill, 1952] (Figures 5a and 5b):
KS ¼ C11 � 2C=3; (12)
G ¼ C=5þ 3C44�5
� �þ 5C44C= 4C44 þ 3Cð Þ
h i=2; (13)
C ¼ C11 � C12: (14)
The derived KS0 and G0 at ambient conditions are 160(2) GPa and 121(1) GPa, respectively, which are fixed forfurther thermoelastic modeling. The aggregate velocities of the sample (Figures 5c and 5d) are calculatedusing the equations
This study (Mg0.94Fe0.06)O 4.0(2) 2.1(1) 8.3(2) 1.5(1) 1.0(1)Jackson et al. [2006] (Mg0.94Fe0.06)O 3.9(2) 2.1(1) 8.35 1.42 0.89Yang et al. [2015] (Mg0.92Fe0.08)O 8.99(0.1) 1.95(0.12) 1.22(0.1)Marquardt et al. [2009] (Mg0.9Fe0.1)O 3.98(14) 8.71(15) 1.74(14) 0.84(18)Jacobsen et al. [2005] (Mg0.76Fe0.24)O 4.17 2.7(1) 9.3(2) 1.3(6) 1.2(1)Jacobsen et al. [2005] (Mg0.44Fe0.56)O 4.17 1.5(1) 9.6(4) 1.5(4) �0.16(9)Sinogeikin and Bass [2000] MgO 4.0(1) 2.4(1) 9.05(20) 1.34(15) 0.84(20)Karki et al. [1999]a MgO 4.15 2.44 9.56 1.45 1.03
aTheoretical calculations.
Journal of Geophysical Research: Solid Earth 10.1002/2016JB013352
YANG ET AL. FERROPERICLASE HIGH PRESSURE-TEMPERATURE ELASTICITY 8493
The P-T derivatives of the reference isotropic elastic moduli were obtained by fitting the moduli either atconstant T, using the third-order Eulerian finite-strain equations [Birch, 1978], or at constant P using linearequation:
where KS0 and G0 are the derived elastic moduli frommeasurements with ambient pressure and temperature(300 K), KS0(T) and G0(T) are the elastic moduli at high temperature and ambient pressure, K
0S0 and G
00 are the
first pressure derivatives of the elastic moduli, and f is the Eulerian strain. A self-consistent density model wasadopted to determine the finite-strain parameters for elastic moduli [Speziale and Duffy, 2002]. Densities fromthe XRD results were first used for the initial finite-strain fitting. The derived KS and K
0S0 were converted to the
isothermal bulk modulus (KT) and its pressure derivative at constant temperature K0T0 using the following
thermodynamic relations [Poirier, 2000]:
KT0 ¼ KS0= 1þ α0γ0T Tð Þ; (21)
K0T0 ≅ 1þ α0γ0Tð Þ�1 K
0S0 �
γ0TKT0
�∂KT=∂Tð ÞP0
� �; (22)
where (∂KT/∂T)P0 is the temperature derivative of KT at ambient pressure, KT0 is the isothermal bulk modulusat ambient conditions, α0 is the thermal expansion coefficient, and γ0 is the Grüneisen parameter. The isother-mal parameter K
0T0 was then used to fit the P-V-T relation to obtain refined density. The procedure was
iterated until both KT and K0T0 values were convergent and self-consistent with the input P-V-T relation.
Figure 5. (a–d) Aggregate elastic moduli and velocities of ferropericlase (Mg0.94Fe0.06)O as function of pressure andtemperature. The solid lines are the fits to experimental data using a third-order finite-strain equation. Open circles:Jackson et al. [2006]; dashed lines: Yang et al. [2015].
Journal of Geophysical Research: Solid Earth 10.1002/2016JB013352
YANG ET AL. FERROPERICLASE HIGH PRESSURE-TEMPERATURE ELASTICITY 8494
Thermoelastic results from XRD are used to derive for these parameters: (∂KT/∂T)P0 =�0.01 GPa K�1 andα0 = 3.0 × 10�5 K�1 at 300 to 900 K temperature conditions. The literature value γ0T= 1.443 is used for theconversion [Tange et al., 2009].
4. Discussion and Implications4.1. High-Temperature Effects on the Seismic Parameters of Ferropericlase
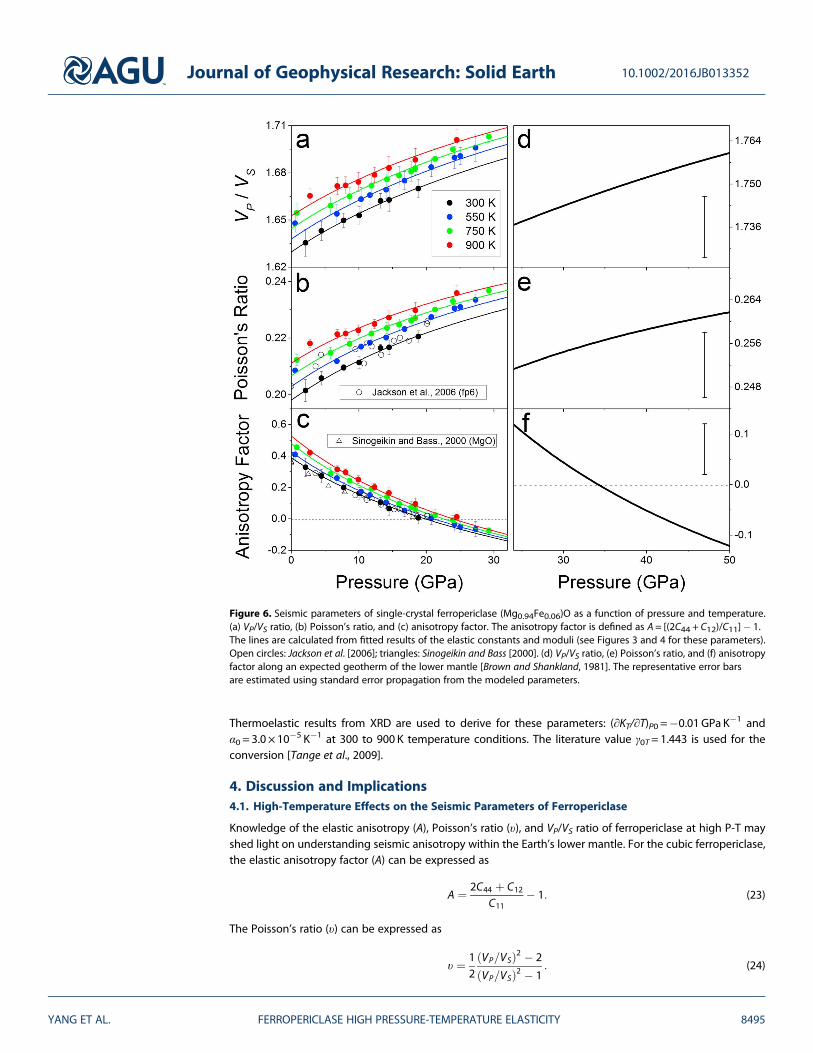
Knowledge of the elastic anisotropy (A), Poisson’s ratio (υ), and VP/VS ratio of ferropericlase at high P-T mayshed light on understanding seismic anisotropy within the Earth’s lower mantle. For the cubic ferropericlase,the elastic anisotropy factor (A) can be expressed as
A ¼ 2C44 þ C12
C11� 1: (23)
The Poisson’s ratio (υ) can be expressed as
υ ¼ 12
VP=VSð Þ2 � 2
VP=VSð Þ2 � 1: (24)
Figure 6. Seismic parameters of single-crystal ferropericlase (Mg0.94Fe0.06)O as a function of pressure and temperature.(a) VP/VS ratio, (b) Poisson’s ratio, and (c) anisotropy factor. The anisotropy factor is defined as A = [(2C44 + C12)/C11]� 1.The lines are calculated from fitted results of the elastic constants and moduli (see Figures 3 and 4 for these parameters).Open circles: Jackson et al. [2006]; triangles: Sinogeikin and Bass [2000]. (d) VP/VS ratio, (e) Poisson’s ratio, and (f) anisotropyfactor along an expected geotherm of the lower mantle [Brown and Shankland, 1981]. The representative error barsare estimated using standard error propagation from the modeled parameters.
Journal of Geophysical Research: Solid Earth 10.1002/2016JB013352
YANG ET AL. FERROPERICLASE HIGH PRESSURE-TEMPERATURE ELASTICITY 8495
Analysis of these parameters using our data shows that A decreases with increasing pressure but increaseswith increasing temperature (Figure 6). At ambient pressure, A is 0.39 at 300 K and 0.53 at 900 K, respec-tively. The anisotropy decreases to zero at both ~20GPa, 300 K and at ~24GPa, 900 K. As temperature wasincreased from 300 K to 900 K, VP/VS and v increased by ~2% and ~6%, respectively. Compared to MgO[Sinogeikin and Bass, 2000], A for fp6 is 8% higher at ambient conditions, whereas VP/VS and v are, respec-tively, increased by ~1.4% and ~7%. These results show that both addition of Fe and elevated temperaturecan increase elastic wave anisotropy, whereas pressure suppresses the anisotropy but increases VP/VS andυ at high P-T.
To apply these seismic parameters to relevant lower mantle conditions, we have also used thermoelasticmodeling to calculate the VP/VS ratio, Poisson’s ratio, and anisotropy factor to extrapolate the P-T deriva-tives of elastic constants along a representative lower mantle geotherm, which represents a layered man-tle convection model with a reference temperature of 1873 K at 670 km depth [Brown and Shankland,1981] up to 50GPa, equivalent to a depth of 1250 km (Figures 6d–6f). The pressure range was limitedto mid-lower mantle values in order to remove the effects of the Fe spin transition, which can significantlyaffect modeling outcomes [Yang et al., 2015]. From 660 km to 1250 km, VP/VS varies from 1.736 to 1.760while Poisson’s ratio ranges from 0.25 to 0.26, which are generally consistent with seismic models[Saltzer et al., 2004]. The anisotropy factor of ferropericlase is 0.13 at 660 km, decreases to 0 at 900 km,and then its absolute value increases monotonically with increasing pressure to 0.12 at 1250 km, suggest-ing that ferropericlase is highly anisotropic at depths below the mid-lower mantle.
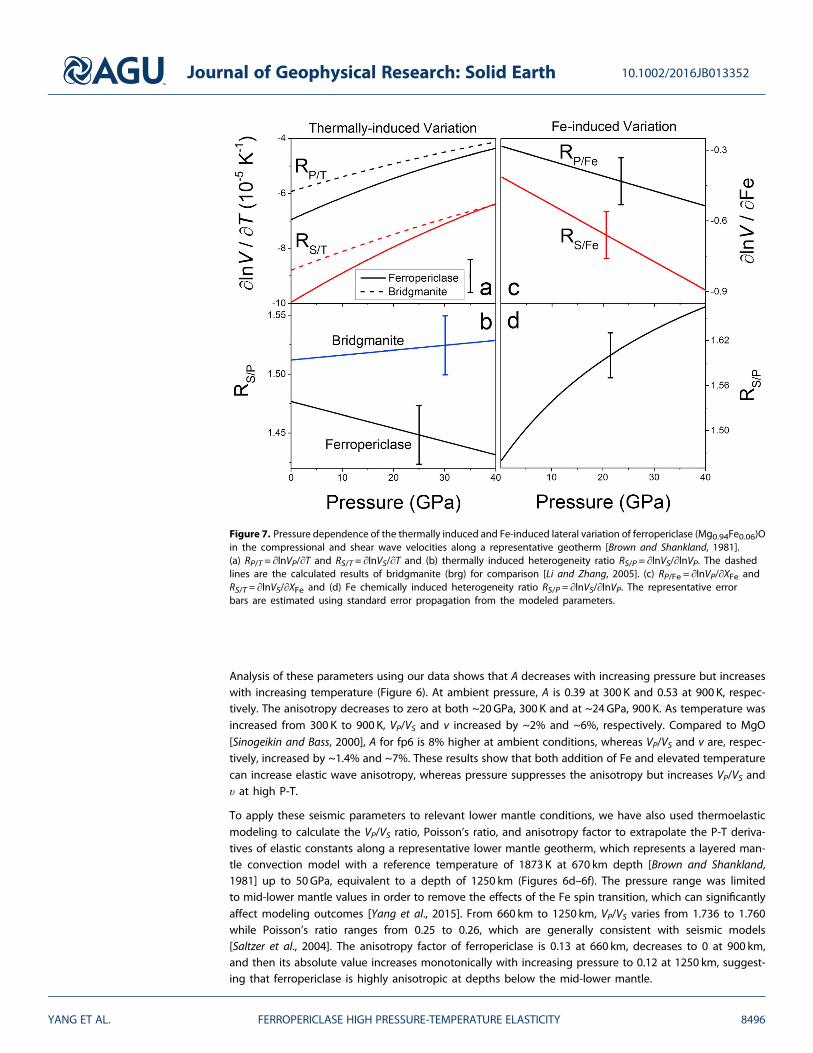
Figure 7. Pressure dependence of the thermally induced and Fe-induced lateral variation of ferropericlase (Mg0.94Fe0.06)Oin the compressional and shear wave velocities along a representative geotherm [Brown and Shankland, 1981].(a) RP/T = ∂lnVP/∂T and RS/T = ∂lnVS/∂T and (b) thermally induced heterogeneity ratio RS/P = ∂lnVS/∂lnVP. The dashedlines are the calculated results of bridgmanite (brg) for comparison [Li and Zhang, 2005]. (c) RP/Fe = ∂lnVP/∂XFe andRS/T = ∂lnVS/∂XFe and (d) Fe chemically induced heterogeneity ratio RS/P = ∂lnVS/∂lnVP. The representative errorbars are estimated using standard error propagation from the modeled parameters.
Journal of Geophysical Research: Solid Earth 10.1002/2016JB013352
YANG ET AL. FERROPERICLASE HIGH PRESSURE-TEMPERATURE ELASTICITY 8496
4.2. Seismic Anisotropy in theLower Mantle
To quantify seismic anisotropy offerropericlase under lower mantleconditions, we have calculated theVP anisotropy (AVP) and shear wavesplitting factor (AVS) along a repre-sentative geotherm using the follow-ing equation [Mainprice et al., 2000]:
AVi ¼ 100� Vi;max � Vi;min
Vi;aggre; (25)
where Vi,max, Vi,min, and Vi,aggre arethe maximum, minimum, and aggre-gate VP or VS velocities. At 660 kmand 1866 K, the AVP is 4% and AVs is9%, and the difference between theorthogonally polarized VSV and VSH is0.51 km/s. At 2000 km and 2250 K,the AVP is 9.7% and AVS is as highas 22.5%, whereas the differencebetween VSH and VSV is 1.6 km/s.These results show that both VP andVS anisotropies increase with depthand that the anisotropy of ferroperi-clase increases with increasing tem-perature at lower mantle conditions.Close to the core-mantle boundary,the splitting is expected to be evenhigher due to the steep thermal
gradient within the D″ layer. The enhanced AVP and AVS observed here, together with the tendency of ferro-periclase to develop stronger fabrics [Yamazaki and Karato, 2001], support the notion that ferropericlase cansignificantly contribute to seismic anisotropy in lowermost lower mantle.
4.3. Thermally Induced Heterogeneity Ratios Along a Lower Mantle Geotherm
The thermal or chemical origins of seismic heterogeneity can be constrained by comparing the observedratios of various seismic parameters with mineral physics results. The ratios of first-order interest includethe shear wave to compressional wave ratio (RS/P= ∂lnVS/∂lnVP), bulk sound to shear wave velocity ratio(Rφ/S= ∂lnVφ/∂lnVS), and density to velocity ratio (Rρ/S,P= ∂lnρ/∂lnVS,P). The contributions of these ratios tolateral heterogeneity can have thermal and/or chemical origins. Mineral physics studies have indicated thatRS/P= ∂lnVS/∂lnVP is less than 2–2.5 in an isochemical lower mantle, which also implies that variations in shearwave and bulk wave velocities are positively correlated [Karato and Karki, 2001]. Other studies have found anegative correlation between shear wave and bulk wave velocities, either throughout the entire lower mantle[Su and Dziewonski, 1997] or limited to the mid-lower mantle [Masters et al., 2000]. Most studies show that RS/Pis ~1.5 at the top of the lower mantle and as high as 3.5 at the core-mantle boundary [Koelemeijer et al., 2016;Masters et al., 2000; Robertson and Woodhouse, 1996].
Here we have calculated thermally induced lateral variations in shear wave and compressional wave∂lnVP,S/∂T for ferropericlase with 6% Fe (this study) and bridgmanite from a high P-T ultrasonic study [Liand Zhang, 2005] to investigate the thermal variation of these two major lower mantle minerals (Figure 7).The velocities of ferropericlase and bridgmanite were first extrapolated along the geotherm based onthe derived thermoelastic parameters and finite-strain theory. The 200 K positive and negative tempera-ture perturbations were applied to the velocities to determine the ∂lnVS/∂T and ∂lnVP/∂T for ferropericlaseand bridgmanite. The pressure dependencies of RS/P= ∂lnVS/∂lnVP of ferropericlase and bridgmanite are
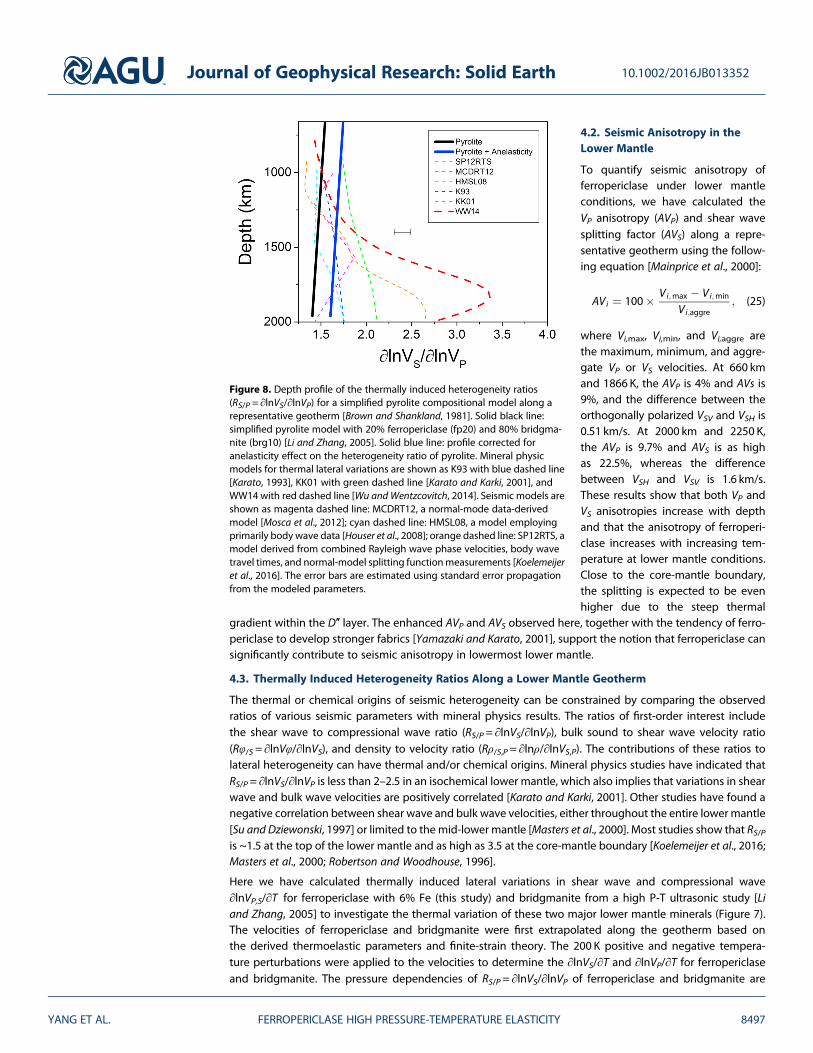
Figure 8. Depth profile of the thermally induced heterogeneity ratios(RS/P = ∂lnVS/∂lnVP) for a simplified pyrolite compositional model along arepresentative geotherm [Brown and Shankland, 1981]. Solid black line:simplified pyrolite model with 20% ferropericlase (fp20) and 80% bridgma-nite (brg10) [Li and Zhang, 2005]. Solid blue line: profile corrected foranelasticity effect on the heterogeneity ratio of pyrolite. Mineral physicmodels for thermal lateral variations are shown as K93 with blue dashed line[Karato, 1993], KK01 with green dashed line [Karato and Karki, 2001], andWW14 with red dashed line [Wu and Wentzcovitch, 2014]. Seismic models areshown as magenta dashed line: MCDRT12, a normal-mode data-derivedmodel [Mosca et al., 2012]; cyan dashed line: HMSL08, a model employingprimarily body wave data [Houser et al., 2008]; orange dashed line: SP12RTS, amodel derived from combined Rayleigh wave phase velocities, body wavetravel times, and normal-model splitting functionmeasurements [Koelemeijeret al., 2016]. The error bars are estimated using standard error propagationfrom the modeled parameters.
Journal of Geophysical Research: Solid Earth 10.1002/2016JB013352
YANG ET AL. FERROPERICLASE HIGH PRESSURE-TEMPERATURE ELASTICITY 8497
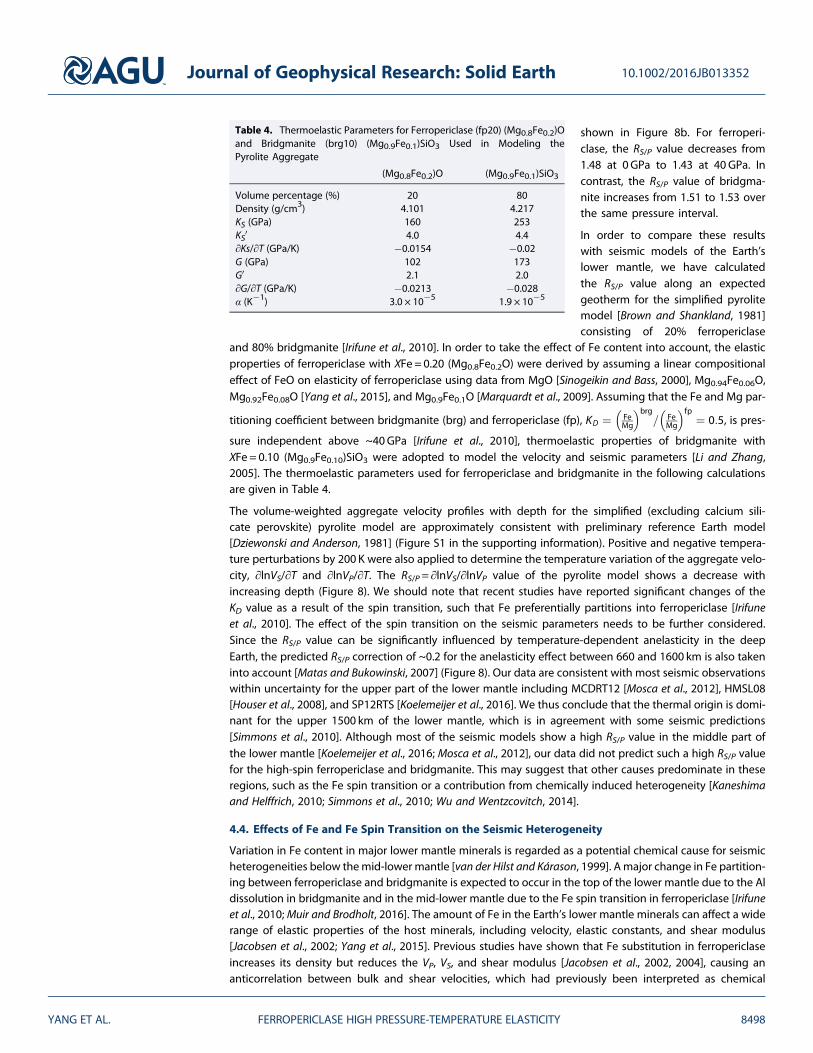
shown in Figure 8b. For ferroperi-clase, the RS/P value decreases from1.48 at 0GPa to 1.43 at 40 GPa. Incontrast, the RS/P value of bridgma-nite increases from 1.51 to 1.53 overthe same pressure interval.
In order to compare these resultswith seismic models of the Earth’slower mantle, we have calculatedthe RS/P value along an expectedgeotherm for the simplified pyrolitemodel [Brown and Shankland, 1981]consisting of 20% ferropericlase
and 80% bridgmanite [Irifune et al., 2010]. In order to take the effect of Fe content into account, the elasticproperties of ferropericlase with XFe = 0.20 (Mg0.8Fe0.2O) were derived by assuming a linear compositionaleffect of FeO on elasticity of ferropericlase using data from MgO [Sinogeikin and Bass, 2000], Mg0.94Fe0.06O,Mg0.92Fe0.08O [Yang et al., 2015], and Mg0.9Fe0.1O [Marquardt et al., 2009]. Assuming that the Fe and Mg par-
titioning coefficient between bridgmanite (brg) and ferropericlase (fp), KD ¼ FeMg
� �brg= Fe
Mg
� �fp¼ 0:5, is pres-
sure independent above ~40GPa [Irifune et al., 2010], thermoelastic properties of bridgmanite withXFe = 0.10 (Mg0.9Fe0.10)SiO3 were adopted to model the velocity and seismic parameters [Li and Zhang,2005]. The thermoelastic parameters used for ferropericlase and bridgmanite in the following calculationsare given in Table 4.
The volume-weighted aggregate velocity profiles with depth for the simplified (excluding calcium sili-cate perovskite) pyrolite model are approximately consistent with preliminary reference Earth model[Dziewonski and Anderson, 1981] (Figure S1 in the supporting information). Positive and negative tempera-ture perturbations by 200 K were also applied to determine the temperature variation of the aggregate velo-city, ∂lnVS/∂T and ∂lnVP/∂T. The RS/P= ∂lnVS/∂lnVP value of the pyrolite model shows a decrease withincreasing depth (Figure 8). We should note that recent studies have reported significant changes of theKD value as a result of the spin transition, such that Fe preferentially partitions into ferropericlase [Irifuneet al., 2010]. The effect of the spin transition on the seismic parameters needs to be further considered.Since the RS/P value can be significantly influenced by temperature-dependent anelasticity in the deepEarth, the predicted RS/P correction of ~0.2 for the anelasticity effect between 660 and 1600 km is also takeninto account [Matas and Bukowinski, 2007] (Figure 8). Our data are consistent with most seismic observationswithin uncertainty for the upper part of the lower mantle including MCDRT12 [Mosca et al., 2012], HMSL08[Houser et al., 2008], and SP12RTS [Koelemeijer et al., 2016]. We thus conclude that the thermal origin is domi-nant for the upper 1500 km of the lower mantle, which is in agreement with some seismic predictions[Simmons et al., 2010]. Although most of the seismic models show a high RS/P value in the middle part ofthe lower mantle [Koelemeijer et al., 2016; Mosca et al., 2012], our data did not predict such a high RS/P valuefor the high-spin ferropericlase and bridgmanite. This may suggest that other causes predominate in theseregions, such as the Fe spin transition or a contribution from chemically induced heterogeneity [Kaneshimaand Helffrich, 2010; Simmons et al., 2010; Wu and Wentzcovitch, 2014].
4.4. Effects of Fe and Fe Spin Transition on the Seismic Heterogeneity
Variation in Fe content in major lower mantle minerals is regarded as a potential chemical cause for seismicheterogeneities below themid-lower mantle [van der Hilst and Kárason, 1999]. Amajor change in Fe partition-ing between ferropericlase and bridgmanite is expected to occur in the top of the lower mantle due to the Aldissolution in bridgmanite and in the mid-lower mantle due to the Fe spin transition in ferropericlase [Irifuneet al., 2010;Muir and Brodholt, 2016]. The amount of Fe in the Earth’s lower mantle minerals can affect a widerange of elastic properties of the host minerals, including velocity, elastic constants, and shear modulus[Jacobsen et al., 2002; Yang et al., 2015]. Previous studies have shown that Fe substitution in ferropericlaseincreases its density but reduces the VP, VS, and shear modulus [Jacobsen et al., 2002, 2004], causing ananticorrelation between bulk and shear velocities, which had previously been interpreted as chemical
Table 4. Thermoelastic Parameters for Ferropericlase (fp20) (Mg0.8Fe0.2)Oand Bridgmanite (brg10) (Mg0.9Fe0.1)SiO3 Used in Modeling thePyrolite Aggregate
Journal of Geophysical Research: Solid Earth 10.1002/2016JB013352
YANG ET AL. FERROPERICLASE HIGH PRESSURE-TEMPERATURE ELASTICITY 8498
heterogeneity in the deep Earth [Kellogg et al., 1999; Tackley, 2000]. For example, the effect of Fe content onseismic heterogeneity can be evaluated with ∂lnVS/∂XFe =�0.5� 0.1 and ∂lnVP/∂XFe =�0.4� 0.1, based onthe experimental results at ambient pressure [Karato and Karki, 2001]. Here we have calculated the velocityvariations with Fe content in ferropericlase (∂lnVS/∂XFe and ∂lnVP/∂XFe) to understand the potential influenceof Fe variability on lateral velocity anomalies in the lower mantle. We have calculated relative variations of VSand VPwith Fe content by considering previous elasticity data fromMgO [Sinogeikin and Bass, 2000], ferroper-iclase with XFe = 0.06 (this study), ferropericlase with XFe = 0.08 [Yang et al., 2015], and ferropericlase withXFe = 0.10 [Marquardt et al., 2009]. At constant temperature, the calculated ∂lnVS/∂XFe decreases from�0.41 at 0 GPa to �0.89 at 40GPa, while ∂lnVP/∂XFe decreases from �0.28 at 0 GPa to �0.54 at 40GPa(Figures 7c and 7d). Meanwhile, RS/P shows an increasing trend from 1.46 at 0 GPa to 1.67 at 40GPa, whichis in contrast to the downward trending thermal variation for the lower part of lower mantle. These resultsindicate that chemically induced seismic heterogeneity may become dominant in the lower parts of thelower mantle. The predominance of chemically influenced heterogeneity is consistent with some seismic stu-dies [van der Hilst and Kárason, 1999], especially when Fe is preferentially partitioned into ferropericlase athigh pressure [Irifune et al., 2010].
An alternative source of seismic heterogeneity may be the spin transition of Fe in ferropericlase in themid-part of the lower mantle [Wu and Wentzcovitch, 2014]. The RS/P heterogeneity ratio of a homogenouspyrolite aggregate is as high as ~3.5 over the ~1500 to 2000 km depth (Figure 8), where spin crossoveroccurs in ferropericlase. The spin transition in ferropericlase can also produce an anticorrelation betweenshear wave velocity and bulk sound velocity in chemically homogeneous pyrolite aggregates, which isobserved in tomography models at certain depths [Wu and Wentzcovitch, 2014]. Our results with high-spinferropericlase show clear discrepancy on the RS/P heterogeneity ratio at depth below ~1500 km. Thus,high-spin ferropericlase alone cannot produce such a robust increase of RS/P value in the mid-part ofthe lower mantle, which implies that spin crossover of ferropericlase is a likely cause of observed lateralseismic heterogeneity in the mid-lower mantle.
ReferencesBirch, F. (1947), Finite elastic strain of cubic crystals, Phys. Rev., 71(11), 809.Birch, F. (1978), Finite strain isotherm and velocities for single-crystal and polycrystalline NaCl at high pressures and 300 K, J. Geophys. Res., 83,
1257–1268, doi:10.1029/JB083iB03p01257.Brown, J., and T. Shankland (1981), Thermodynamic parameters in the Earth as determined from seismic profiles, Geophys. J. R. Astron. Soc.,
66(3), 579–596.Davies, D., S. Goes, and H. Lau (2015), Thermally dominated deep mantle LLSVPs: A review, in The Earth’s Heterogeneous Mantle, pp. 441–477,
Springer.Dziewonski, A. M., and D. L. Anderson (1981), Preliminary reference Earth model, Phys. Earth Planet. Inter., 25(4), 297–356.Every, A. (1980), General closed-form expressions for acoustic waves in elastically anisotropic solids, Phys. Rev. B, 22(4), 1746.Fei, Y., A. Ricolleau, M. Frank, K. Mibe, G. Shen, and V. Prakapenka (2007), Toward an internally consistent pressure scale, Proc. Natl. Acad. Sci.
U.S.A., 104(22), 9182–9186.Forte, A. M. (2000), Seismic-geodynamic constraints on mantle flow: Implications for layered convection, mantle viscosity, and seismic
anisotropy in the deep mantle, in Earth’s Deep Interior: Mineral Physics and Tomography from the Atomic to the Global Scale, edited byF. D. Amir Khan, pp. 441–477, Springer, New York.
Forte, A. M., R. L. Woodward, and A. M. Dziewonski (1994), Joint inversions of seismic and geodynamic data for models of three-dimensionalmantle heterogeneity, J. Geophys. Res., 99, 21,857–21,877, doi:10.1029/94JB01467.
Garnero, E. J., and A. K. McNamara (2008), Structure and dynamics of Earth’s lower mantle, Science, 320(5876), 626–628.Hager, B. H., R. W. Clayton, M. A. Richards, R. P. Comer, and A. M. Dziewonski (1984), Lower mantle heterogeneity, dynamic topography and
the geoid, Nature, 313(14), 541–545.Hill, R. (1952), The elastic behaviour of a crystalline aggregate, Proc. Phys. Soc. A, 65, 349.Houser, C., G. Masters, P. Shearer, and G. Laske (2008), Shear and compressional velocity models of the mantle from cluster analysis of
long-period waveforms, Geophys. J. Int., 174(1), 195–212.Irifune, T., T. Shinmei, C. A. McCammon, N. Miyajima, D. C. Rubie, and D. J. Frost (2010), Iron partitioning and density changes of pyrolite in
Earth’s lower mantle, Science, 327(5962), 193–195.Jackson, J. M., J. Zhang, J. Shu, S. V. Sinogeikin, and J. D. Bass (2005), High-pressure sound velocities and elasticity of aluminous MgSiO3
perovskite to 45 GPa: Implications for lateral heterogeneity in Earth’s lower mantle, Geophys. Res. Lett., 32, L21305, doi:10.1029/2005GL023522.
Jackson, J. M., S. V. Sinogeikin, S. D. Jacobsen, H. J. Reichmann, S. J. Mackwell, and J. D. Bass (2006), Single-crystal elasticity and soundvelocities of (Mg0.94Fe0.06)O ferropericlase to 20 GPa, J. Geophys. Res., 111, B09203, doi:10.1029/2005JB004052.
Jacobsen, S. D., H.-J. Reichmann, H. A. Spetzler, S. J. Mackwell, J. R. Smyth, R. J. Angel, and C. A. McCammon (2002), Structure and elasticity ofsingle-crystal (Mg,Fe)O and a new method of generating shear waves for gigahertz ultrasonic interferometry, J. Geophys. Res., 107(B2),2037, doi:10.1029/2001JB000490.
Jacobsen, S. D., H. Spetzler, H. J. Reichmann, and J. R. Smyth (2004), Shear waves in the diamond-anvil cell reveal pressure-induced instabilityin (Mg, Fe)O, Proc. Natl. Acad. Sci. U.S.A., 101(16), 5867–5871.
Journal of Geophysical Research: Solid Earth 10.1002/2016JB013352
YANG ET AL. FERROPERICLASE HIGH PRESSURE-TEMPERATURE ELASTICITY 8499
AcknowledgmentsWe acknowledge S. Grand, C. Lu, S. Fu,and I. Yen for their constructive sugges-tions and discussions. We also thankZ. Mao, Y. Wu, and D. Fan for theirassistance in the BLS spectra collectionat 13 BMD, GSECARS. We thankGSECARS and Advanced Photon Sourcefor providing X-ray diffraction facilitiesfor the study. J.F.L. acknowledges sup-port from the Geophysics and CSEDIPrograms of the National ScienceFoundation (NSF), Carnegie-DOEAlliance Center (CDAC), and HPSTAR. S.D.J. acknowledges support from NSFEAR-0748707, the David and LucilePackard Foundation, and theAlexander von Humboldt Foundation.GeoSoilEnviroCARS is supported bythe National Science Foundation–Earth Sciences (EAR-1128799) andDepartment of Energy Geosciences(DE-FG02-94ER14466). The data forthis paper are available by contactingthe corresponding author at [email protected].
Jacobsen, S. D., H. J. Reichmann, A. Kantor, and H. A. Spetzler (2005), A gigahertz ultrasonic interferometer for the diamond anvil cell andhigh-pressure elasticity of some iron-oxide minerals, in Advances in High-Pressure Technology for Geophysical Applications, edited byJ. Chen et al., pp. 25–48, Elsevier, Amsterdam.
Kaneshima, S., and G. Helffrich (2010), Small scale heterogeneity in the mid-lower mantle beneath the circum-Pacific area, Phys. Earth Planet.Inter., 183(1), 91–103.
Kantor, I., V. Prakapenka, A. Kantor, P. Dera, A. Kurnosov, S. Sinogeikin, N. Dubrovinskaia, and L. Dubrovinsky (2012), BX90: A new diamondanvil cell design for X-ray diffraction and optical measurements, Rev. Sci. Instrum., 83(12), 125102.
Karato, S. (1993), Importance of anelasticity in the interpretation of seismic tomography, Geophys. Res. Lett., 20, 1623–1626, doi:10.1029/93GL01767.
Karato, S., and B. B. Karki (2001), Origin of lateral variation of seismic wave velocities and density in the deep mantle, J. Geophys. Res., 106,21,771–21,783, doi:10.1029/2001JB000214.
Karki, B. B., L. Stixrude, S. J. Clark, M. C. Warren, G. J. Ackland, and J. Crain (1997), Structure and elasticity of MgO at high pressure, Am. Mineral.,82(1), 51–60.
Karki, B., R. Wentzcovitch, S. De Gironcoli, and S. Baroni (1999), First-principles determination of elastic anisotropy and wave velocities ofMgO at lower mantle conditions, Science, 286(5445), 1705–1707.
Kellogg, L. H., B. H. Hager, and R. D. van der Hilst (1999), Compositional stratification in the deep mantle, Science, 283(5409), 1881–1884.Koelemeijer, P., J. Ritsema, A. Deuss, and H.-J. van Heijst (2016), SP12RTS: A degree-12 model of shear-and compressional-wave velocity for
Earth’s mantle, Geophys. J. Int., 204(2), 1024–1039.Li, B., and J. Zhang (2005), Pressure and temperature dependence of elastic wave velocity of MgSiO3 perovskite and the composition of the
lower mantle, Phys. Earth Planet. Inter., 151(1–2), 143–154, doi:10.1016/j.pepi.2005.02.004.Mainprice, D., G. Barruol, and W. B. Ismail (2000), The seismic anisotropy of the Earth’s mantle: From single crystal to polycrystal, in Earth’s
Deep Interior: Mineral Physics and Tomography from the Atomic to the Global Scale, Geophys. Monogr., vol. 117, pp. 237–264, AGU,Washington, D. C.
Marquardt, H., S. Speziale, H. J. Reichmann, D. J. Frost, and F. R. Schilling (2009), Single-crystal elasticity of (Mg0.9Fe0.1)O to 81 GPa,Earth Planet. Sci. Lett., 287(3–4), 345–352.
Masters, G., G. Laske, H. Bolton, and A. Dziewonski (2000), The relative behavior of shear velocity, bulk sound speed, and compressionalvelocity in the mantle: Implications for chemical and thermal structure, in Earth’s Deep Interior: Mineral Physics and Tomography from theAtomic to the Global Scale, pp. 63–87.
Matas, J., and M. S. Bukowinski (2007), On the anelastic contribution to the temperature dependence of lower mantle seismic velocities,Earth Planet. Sci. Lett., 259(1), 51–65.
McCammon, C., I. Kantor, O. Narygina, J. Rouquette, U. Ponkratz, I. Sergueev, M. Mezouar, V. Prakapenka, and L. Dubrovinsky (2008), Stableintermediate-spin ferrous iron in lower-mantle perovskite, Nat. Geosci., 1(10), 684–687, doi:10.1038/ngeo309.
Mosca, I., L. Cobden, A. Deuss, J. Ritsema, and J. Trampert (2012), Seismic and mineralogical structures of the lower mantle from probabilistictomography, J. Geophys. Res., 117, B06304, doi:10.1029/2011JB008851.
Muir, J. M. R., and J. P. Brodholt (2016), Ferrous iron partitioning in the lower mantle, Phys. Earth Planet. Inter., 257, 12–17, doi:10.1016/j.pepi.2016.05.008.
Poirier, J.-P. (2000), Introduction to the Physics of the Earth’s Interior, Cambridge Univ. Press, Cambridge, U. K.Ringwood, A. E. (1975), Composition and Petrology of the Earth’s Mantle, McGraw-Hill, New York.Robertson, G., and J. Woodhouse (1996), Ratio of relative S to P velocity heterogeneity in the lower mantle, J. Geophys. Res., 101,
20,041–20,052, doi:10.1029/96JB01905.Saltzer, R. L., E. Stutzmann, and R. D. van der Hilst (2004), Poisson’s ratio in the lower mantle beneath Alaska: Evidence for compositional
heterogeneity, J. Geophys. Res., 109, B06301, doi:10.1029/2003JB002712.Simmons, N. A., A. M. Forte, L. Boschi, and S. P. Grand (2010), GyPSuM: A joint tomographic model of mantle density and seismic wave
speeds, J. Geophys. Res., 115, B12310, doi:10.1029/2010JB007631.Sinogeikin, S. V., and J. D. Bass (2000), Single-crystal elasticity of pyrope and MgO to 20 GPa by Brillouin scattering in the diamond cell,
Phys. Earth Planet. Inter., 120(1–2), 43–62.Speziale, S., and T. Duffy (2002), Single-crystal elastic constants of fluorite (CaF 2) to 9.3 GPa, Phys. Chem. Miner., 29(7), 465–472.Su, W.-j., and A. M. Dziewonski (1997), Simultaneous inversion for 3-D variations in shear and bulk velocity in the mantle, Phys. Earth Planet.
Inter., 100(1), 135–156.Tackley, P. J. (2000), Mantle convection and plate tectonics: Toward an integrated physical and chemical theory, Science, 288(5473),
2002–2007.Tange, Y., Y. Nishihara, and T. Tsuchiya (2009), Unified analyses for P-V-T equation of state of MgO: A solution for pressure-scale problems in
high P-T experiments, J. Geophys. Res., 114, B03208, doi:10.1029/2008JB005813.Tsuchiya, T. (2011), Elasticity of subducted basaltic crust at the lower mantle pressures: Insights on the nature of deep mantle heterogeneity,
Phys. Earth Planet. Inter., 188(3), 142–149.van der Hilst, R. D., and H. Kárason (1999), Compositional heterogeneity in the bottom 1000 kilometers of Earth’s mantle: Toward a hybrid
convection model, Science, 283(5409), 1885–1888.Wu, Z., and R. M. Wentzcovitch (2014), Spin crossover in ferropericlase and velocity heterogeneities in the lower mantle, Proc. Natl. Acad. Sci.
U.S.A., 111(29), 10,468–10,472.Wu, Z., J. F. Justo, and R. M. Wentzcovitch (2013), Elastic anomalies in a spin-crossover system: Ferropericlase at lower mantle conditions,
Phys. Rev. Lett., 110, 228,501.Yamazaki, D., and S.-i. Karato (2001), Some mineral physics constraints on the rheology and geothermal structure of Earth’s lower mantle,
Am. Mineral., 86(4), 385–391.Yamazaki, D., and S.-i. Karato (2002), Fabric development in (Mg,Fe)O during large strain, shear deformation: Implications for seismic
anisotropy in Earth’s lower mantle, Phys. Earth Planet. Inter., 131(3–4), 251–267, doi:10.1016/S0031-9201(02)00037-7.Yang, J., X. Tong, J.-F. Lin, T. Okuchi, and N. Tomioka (2015), Elasticity of ferropericlase across the spin crossover in the Earth’s lower mantle,
Sci. Rep., 5, 17,188.
Journal of Geophysical Research: Solid Earth 10.1002/2016JB013352
YANG ET AL. FERROPERICLASE HIGH PRESSURE-TEMPERATURE ELASTICITY 8500