PROSIDING PERKEM V, JILID 2 (2010) 392 – 420 ISSN: 2231-962X Persidangan Kebangsaan Ekonomi Malaysia ke V (PERKEM V), Inovasi dan Pertumbuhan Ekonomi, Port Dickson, Negeri Sembilan, 15 – 17 Oktober 2010 ELASTICITY OF SUBSTITUTION AND ECONOMIC GROWTH PUI KIEW LING ABSTRACT Purpose - This paper proposes that the relationship between factor substitution and rate of economy growth depends on the degree of substitutability and complementary between inputs in producing goods. Theory - Elasticity of substitution is an important factor and positively in influencing economy growth in manufacturing sector in Malaysia. Design/Methodology/Approach – Transcendental logarithm production function is recognized based on its variable elasticity of substitution. The elasticity of substitution of that production function is to be regressed with the rate of economy growth to examine the relationship between elasticity of substitution and economy growth. Then, the source of economy growth will be accounted to investigate how the economy growth could be increased by elasticity of substitution and factor endowment. Findings –Supporting the de la Grandville Hypothesis, variable elasticity of substitution of manufacturing sector positively influences economy growth in Malaysia. Capital has been recognized to be the most important factor in influencing economy growth. So, capital accumulation for future investment needs to be encouraged for high factor substitution in the manufacturing sector. The high factor substitution in the manufacturing sector then could improve economy growth and reduce unemployment. Orignality/Value – The economy growth is related with microeconomics perspective. Particularly, the rapid economy growth rate in Malaysia could be contributed significantly by manufacturing firm applying Transcendental Logarithm technology that posses high and variable elasticity of substitution. Keywords: Elasticity of Substitution, Transcendental Logarithm production function, Economy Growth INTRODUCTION This paper intends to investigate how the elasticity of substitution of inputs in manufacturing industry could affect economy growth in Malaysia. Specifically, this paper examines how the inputs substitutability between capital and labour in the particular sector could affect production, unemployment, balanced growth path, steady state and economy growth. Background of Study In theory, elasticity of substitution plays an important role enhancing productivity and quality of input toward higher national economic growth. The productivity growth of Malaysia has been compared with other countries in below table. This table shows that productivity growth in Malaysia is much lower than China by almost 5%. The productivity growth of Korea, Indonesia India and also Philippines is also higher than Malaysia. Thus, the productivity of inputs such as labour and capital needs to be improved through efficient factor substitution. For this purpose, Malaysia need to optimize the use of factor endowment in profitable industry based on the elasticity of substitution of that particular industry. The productive input combination will produce output efficiently. The relationship between input and output could be illustrated in below figure. Manufacturing sector has been recognized as the profitable industry based on its contribution towards economy growth. The significance of contribution of manufacturing sector for Malaysia can be recognized by comparing the contribution of this industry with other industries in gross domestic product. Since manufacturing sector contributes significantly to gross domestic product in Malaysia, this industry is chosen to analyze how the steady state economy growth could be achieved. The importance of manufacturing sector also could be traced from the main export of Malaysia over time as shown in below table.
Transcript
PROSIDING PERKEM V, JILID 2 (2010) 392 – 420
ISSN: 2231-962X
Persidangan Kebangsaan Ekonomi Malaysia ke V (PERKEM V),
Inovasi dan Pertumbuhan Ekonomi,
Port Dickson, Negeri Sembilan, 15 – 17 Oktober 2010
ELASTICITY OF SUBSTITUTION AND ECONOMIC GROWTH
PUI KIEW LING
ABSTRACT
Purpose - This paper proposes that the relationship between factor substitution and rate of economy growth
depends on the degree of substitutability and complementary between inputs in producing goods.
Theory - Elasticity of substitution is an important factor and positively in influencing economy growth in
manufacturing sector in Malaysia.
Design/Methodology/Approach – Transcendental logarithm production function is recognized based on
its variable elasticity of substitution. The elasticity of substitution of that production function is to be
regressed with the rate of economy growth to examine the relationship between elasticity of substitution
and economy growth. Then, the source of economy growth will be accounted to investigate how the
economy growth could be increased by elasticity of substitution and factor endowment.
Findings –Supporting the de la Grandville Hypothesis, variable elasticity of substitution of manufacturing
sector positively influences economy growth in Malaysia. Capital has been recognized to be the most
important factor in influencing economy growth. So, capital accumulation for future investment needs to be
encouraged for high factor substitution in the manufacturing sector. The high factor substitution in the
manufacturing sector then could improve economy growth and reduce unemployment.
Orignality/Value – The economy growth is related with microeconomics perspective. Particularly, the
rapid economy growth rate in Malaysia could be contributed significantly by manufacturing firm applying
Transcendental Logarithm technology that posses high and variable elasticity of substitution.
Keywords: Elasticity of Substitution, Transcendental Logarithm production function, Economy Growth
INTRODUCTION
This paper intends to investigate how the elasticity of substitution of inputs in manufacturing industry could
affect economy growth in Malaysia. Specifically, this paper examines how the inputs substitutability
between capital and labour in the particular sector could affect production, unemployment, balanced growth
path, steady state and economy growth.
Background of Study
In theory, elasticity of substitution plays an important role enhancing productivity and quality of input
toward higher national economic growth. The productivity growth of Malaysia has been compared with
other countries in below table.
This table shows that productivity growth in Malaysia is much lower than China by almost 5%.
The productivity growth of Korea, Indonesia India and also Philippines is also higher than Malaysia. Thus,
the productivity of inputs such as labour and capital needs to be improved through efficient factor
substitution. For this purpose, Malaysia need to optimize the use of factor endowment in profitable industry
based on the elasticity of substitution of that particular industry.
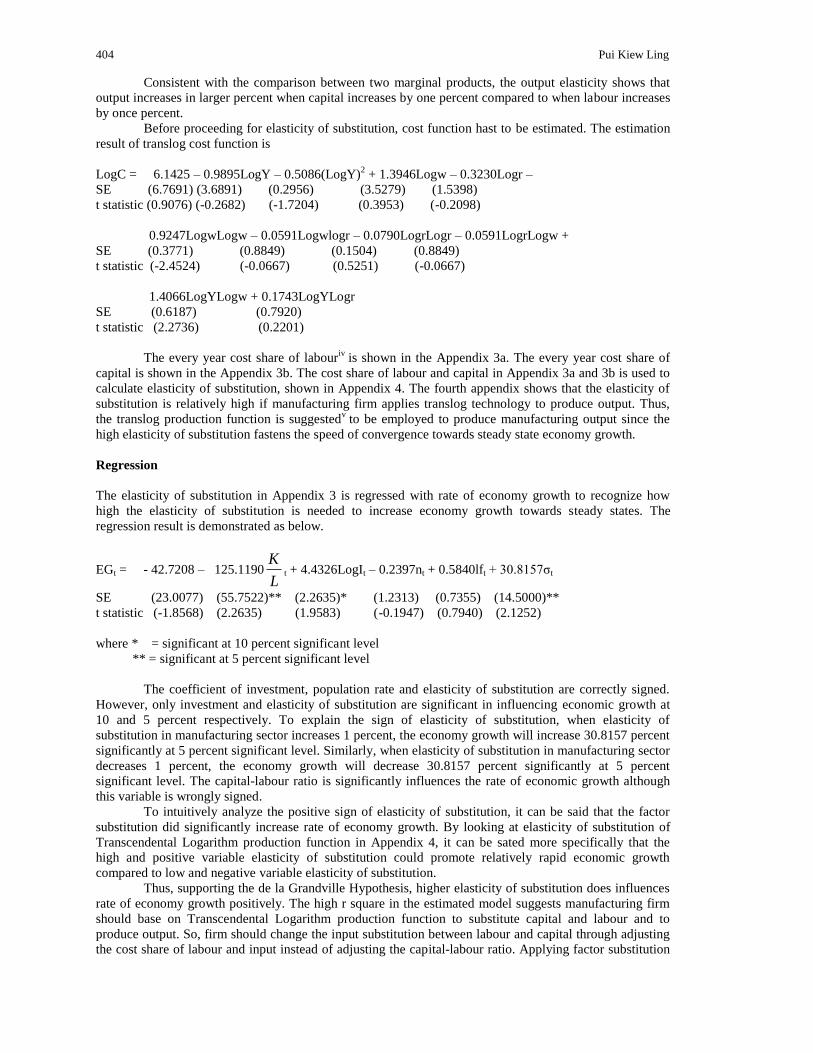
The productive input combination will produce output efficiently. The relationship between input
and output could be illustrated in below figure.
Manufacturing sector has been recognized as the profitable industry based on its contribution
towards economy growth. The significance of contribution of manufacturing sector for Malaysia can be
recognized by comparing the contribution of this industry with other industries in gross domestic product.
Since manufacturing sector contributes significantly to gross domestic product in Malaysia, this
industry is chosen to analyze how the steady state economy growth could be achieved. The importance of
manufacturing sector also could be traced from the main export of Malaysia over time as shown in below
table.
Prosiding Persidangan Kebangsaan Ekonomi Malaysia Ke V 2010 393
Since manufacturing sector significantly influences the gross domestic product in Malaysia, the
manufacturing firms need to apply production function that has high and variable elasticity of factor
substitution to produce output efficiently. High elasticity of substitution could help firm to produce output
with efficient input combination. Thus, this study intends to look for an appropriate production function
with high elasticity of substitution for the objective of sustainable economy growth.
Problem Statement
From Tables 2 and 3, the manufacturing sector clearly contributes significantly to gross domestic product
in Malaysia. However, the annual change of gross domestic product at purchaser‟s value in Malaysia has
fall to negative in year 2009. Below table shows the annual change of gross domestic product at
purchaser‟s value from 2005 to 2009.
Since gross domestic product in Malaysia is contributed mainly by manufacturing industry, the
low and negative annual change of gross domestic product need to be improved by changing the elasticity
of substitution in that industry. To suggest, the manufacturing sector needs to apply production function
with high elasticity of substitution to produce output efficiently.
In addition, many developing countries including Malaysia cause the “employment problem” by
introducing policy that encourages capital-intensive techniques in production.
Analyzing Table 5, the unemployment in Malaysia keeps on increases over time. In year 2000,
there is around 286,900 people unemployed in Malaysia. Then, the total amount of people unemployed
increases by almost 50 percent in year 2009. Since increases in unemployment could slow down economy
growth, the employment needs to be increased. Since Malaysia depends significantly on manufacturing
sector, government could increase job in that industry in order to reduce unemployment.
To increase economy growth and unemployment, elasticity of substitution plays an important role.
The extent of how economy growth could be increased and unemployment could be reduced depends on
degree of factor substitution.
Objective
The overall objective of this paper is to investigate how the elasticity of factor substitution in
manufacturing sector could affect economy of Malaysia. In order to reduce increasing unemployment and
slow rate of economy growth, the specific objectives will be investigated include:
i. To recognize the suitable production function with high factor substitution.
ii. To examine the relationship between elasticity of substitution and economy growth.
iii. To recognize the important source of economy growth.
Based on the influence of elasticity of substitution in manufacturing sector on speed of
convergence in achieving steady-state in Malaysia, the suitable policy will be designed. The proposed
policy is suited with endowment and source of economy growth of that sector.
Hypothesis
Elasticity of substitution is an important factor and positively in influencing economy growth in
manufacturing sector in Malaysia.
Significance of Study
This paper intends to investigate how the changes in factor price could affect production, balanced growth
path, steady state and economy growth. The output will be produced efficiently with high and variable
elasticity of substitution. Changes in factor prices of labor and capital, particularly nominal wage and rental
rate will influence degree of factor substitutability. It will then change production of firm in order to
produce profit-maximizing output that minimizing cost. If profit is maximized or cost is minimized, the
output is said efficient. Since output is produced with investment in labor and capital; and investment of
capital is a function of saving rate, the saving rate will influence the output level through the choice of
capital per worker. The output will then influence the balanced growth path and economy growth. Thus,
high elasticity of substitution is needed for rapid speed of convergence to achieve steady state in balanced
growth path.
394 Pui Kiew Ling
From microeconomics perspective, the changes in input price ratio will affect marginal rate of
substitution between factors keeping output constant and then affecting slope of isoquant. It will also
change elasticity of substitution, thus affecting curvature of isoquant. In formula, the effect of changes in
input price ratio on degree of factor substitution can be traced through own price elasticity, cross price
elasticity and Hicks Allen substitution particularly. The factor substitutability will then affect return to scale
and cost share in production. Thus, an appropriate form of production functions with high elasticity of
substitution for Malaysian manufacturing sector need to be recognized for growing economy.
Meanwhile, in the macroeconomics perspective, since production is a function of investment, the
elasticity of substitution is related with changes in saving ratio. The optimal saving rate to produce steady
state output capital accumulation can be obtained when consumption per worker is maximized. Output
produced at this golden rule is the most efficient and maximized. So, changes in elasticity of substitution
will directly contribute to changes in gross domestic product. Relate with Solow model, the elasticity of
substitution that changes the steady state output per worker will then affect balanced growth path and
economy growth. With the findings of this paper on possibility of capital-labor substitution, consistent
production technology with its factor endowments is to be introduced to reduce unemployment in Malaysia.
Realizing the importance of high elasticity of substitution on economy growth, this study intends
to study the appropriate technology for manufacturing firm in Malaysia to produce output. In most of the
previous study including literature in Malaysia, elasticity of substitution is assumed to be constant by
employing the data of labour and capital in Cobb Douglas and constant elasticity of substitution production
function. Thus, to expand the past studies, the production function with flexible elasticity of substitution is
to be investigated in this paper. The production function with the variable and high elasticity of substitution
in manufacturing firm is proposed could fasten the speed of convergence to achieve steady state economy
growth in Malaysia.
Organization of Study
The paper will be divided into five sections. The next section explains the theoretical background of
production function, the model of economy growth and empirical studies to clarity the flow of thought of
this paper. In third section, variable definition, data source and methodology to test the objective and
hypothesis are explained. The result of empirically testing the methodology and the finding of the
relationship between elasticity of substitution and economy growth is presented in the following section. In
this section, the source of economy growth is also being recognized to examine how the elasticity of
substitution in manufacturing sector could increase economy growth rate and reduce unemployment. Based
on objectives and empirical results, several policy implication and suggestion are listed in last section.
LITERATURE REVIEW
Since production is a function of various combinations of inputs, the production of output will be
influenced by capital accumulation through the choice of capital per worker. More output could be
produced by incorporating knowledge in production to improve quality of labor and capital. So, output is
contributed by both capital accumulation and technical change. The production of output will then
influence the balanced growth path and economy growth.
Analytical Framework on Production Function
The objective to reduce unemployment can be begun with the study of the possibilities of substitution
between factor inputs. Firm will choose combination of inputs that can achieve profit maximization and
cost minimization. The choice of optimum input combination could be obtained when isoquant tangent
with isocost line. From the profit maximizing process, profit maximizing competitive firm will pay their
input based on their marginal product. It means labour is employed until marginal product of labour equals
to real wage while capital is used until marginal product of capital equals to rental rate given a cost level.
As input price changes, firm will substitute cheaper factor for relative expansive factor. Firm will
then change the combination of inputs in order to produce output that maximize profit or minimize cost.
The change in input price will influence factor substitutability and input combination. The degree of factor
substitution thereby will influence marginal product of input, marginal rate of technical substitution and
elasticity of substitution. The increase of scale of inputs is said produce output efficiently if same output
Prosiding Persidangan Kebangsaan Ekonomi Malaysia Ke V 2010 395
could be produced at the rate where marginal rate of technical substitution (MRTS) equals new ratio of
input prices (w/v).
The influence of input price changes on factor substitution depends on form of production
function since the degree of factor substitutability is different in each production function. It is because the
substitution possibilities available to the industry are dependent on type of production technology. The
possibility of substitution between inputs is described by elasticity of substitution. The possible form of
high and variable production functions to be adopted by manufacturing industry include Variable Elasticity
of Substitution (VES) production function and transcendental logarithm (translog) production function.
If changes in input price causes firm to substitute cheaper input for more expansive input
significantly, the large factor substitution indicates large elasticity of substitution. It implies one input is
relatively elastic to be substituted with another input when input price changes. If the elasticity of
substitution is large, one input is easy to be substituted with another input. For example, even minor
changes in price of labor will lead to substantial change in employment of labor. The elastic factor
substitution fastens the effect of capital accumulation in achieving steady state in economy. It then
strengthens the sustainability of economy growth in long run. Thus, elasticity of substitution is pivotal in
economic growth and distribution of income.
However, if firm is less wiling to substitute cheaper input for more expansive input when input
price changes, the small factor substitution indicates small elasticity of substitution. It implies that one
input is difficult to be substituted for another input when input price changes.
On the other hand, if the marginal rate of technical substitution only causes little change in the
input ratio, the small factor substitution will produce small elasticity of substitution. It implies the
substitution between capital and labor is inelastic when input price changes. In small elasticity of
substitution, one input is difficult to be substituted with another input. So, even substantial changes in price
of labor will only lead to minor change in employment of labor. To restate, elasticity of substitution is large
if one input is highly substituble for another input. Meanwhile elasticity of substitution is small if one input
is difficult to substitute another input when input price changes. Elasticity of factor substitution plays a
crucial rule in economic growth. Since it is one of the determinants of the level of economic growth, it
affects the speed of convergence towards the balanced growth path.
To stress, the different degree of factor substitutability will affect input combination, thus
marginal product, output elasticity, return to scale, marginal rate of technical substitution, elasticity of
substitution differently in each production function. It is due to the different availability of factor
substitutability in different form of production function.
The possibility of changing elasticity of substitution along isoquant is due to changing price of
input due to forces of demand and supply of inputs, which vary with economic development. The rapid
growth of economy will change the demand and supply of labor and capital. Wage and rental rate will then
differs than before economy develops. Thus, the degree of labour-capital substitution is varied along
isoquant. The elasticity of substitution will change depends on factor such as the additions to the stock of
capital, mobility of labour among sectors and substitutability and complementarily between labor and
capital, thereby growth of economy.
Model/Theory
de la Grandville Hypothesis
de la Grandville Hypothesis proposes that elasticity of substitution is an potent explanatory variable for
economic growth. Specifically, high elasticity of substitution between factors leads to rapid growing
economy. Intuitively, the higher the elasticity of substitution, the more an economy would benefit in term
of additional output from a change in input price. For example, decrease in price of capital will redistribute
income in factor of capital and thus causes much substitution of capital for labor. Since cost share of labor
is reduced now, the economies of scale will encourage firm to produce more. Higher production due to high
elasticity of substitution leads to higher economy growth. Similarly, an increase in price of capital tends to
lead to substitution of labor for capital. If elasticity of substitution is low, firm is inelastic to reduce factor
cost of capital. The increased cost share of capital will cause diseconomies of scale and discourages
production. Lower production due to low elasticity of substitution leads to lower economy growth.
It indicates that higher elasticity of substitution tends to associate with higher economic growth. It
is because, with increased possibility to produce with greater factor combinations, firm will choose the
396 Pui Kiew Ling
most efficient factor combination to produce output. The cost minimizing and profit maximizing from the
efficient factor combination is hypothesized to lead to high economic growth.
Conversely, lower elasticity of substitution tends to lower down economic growth. It is because,
with fewer possibilities to produce output with greater efficient factor combinations, firm tends to produce
output inefficiently with higher cost of production. Because the inefficient factor combination breaks down
the cost-minimizing and profit-maximizing process of firm, low elasticity of substitution leads to slow
economic growth.
Solow Model
Solow model basically is consistent with de la Grandville Hypothesis. The model proposes that elasticity of
substitution positively affects economic growth. So, the significance of economic growth depends on
elasticity of substitution. In fact, Solow (1956) is one of pioneer economists to relate elasticity of
substitution with economic growth. The difference between this hypothesis and Solow model is that Solow
relates elasticity of substitution and economy growth with the idea of capital accumulation.
In overall, Solow model studied how elasticity of substitution achieves steady state in economy.
Increase in possibility of factor substitution is an important source of economic growth. Elasticity of
substitution can alter the behavior of saving rate during the transition in the balanced growth path. It could
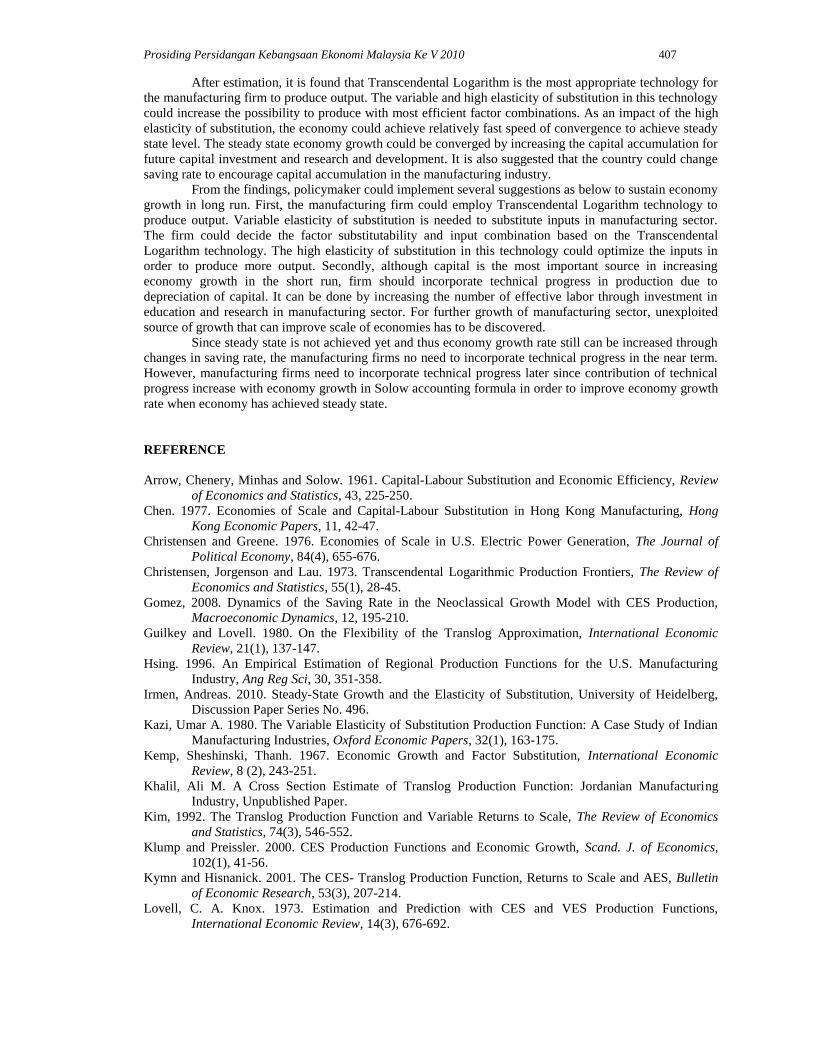
be traced through changes in capital per worker in balanced growth path below.
The difference of production function and break-even investment or actual investment is
consumption. Consumption is maximized when break-even investment intercepts with actual investment. In
balanced growth path, steady state is achieved at capital per worker k0 when break-even investment (n+d)k
equals to actual investment sy. If k is initially less than k0, for example, k1, firm will increase capital per
worker since actual investment exceeds break-even investment. How much capital per worker can increase
depends on factor substitution between capital and labor. If elasticity of substitution is high, firm tends to
substitute capital for labor in large proportion. It is because marginal productivity of capital tends to
increase in increasing rate at a given labor before steady state of capital stock is achieved. Increase in
marginal product due to increase in capital stock will lead to increase in level of output and thus economic
growth.
However, if elasticity of substitution is low, firm only can substitute capital for labor in small
proportion. It is because capital is inelastic to be substituted for capital. Decrease in marginal product of
labor due to large factor share of labor will lead to decline in output and thus economic growth.
The factor substitution will stop when the steady state capital per worker is achieved at point k0.
At this level of consumption, the capital used in the production is called golden rule of capital accumulation
and the capital per worker is known as golden-rule level of capital stock. With the highest consumption is
maximized at this point, golden rule of capital accumulation is achieved since marginal product of capital
equals to sum of depreciation and population rate. At this point, the capital accumulation in production has
achieved steady state in the economy through the substitution between capital and labor. Consistent with
production theory, the degree of factor substitution in capital per worker depends on elasticity of
substitution between factors. High elasticity of substitution would converge the economy to steady state
faster compared to low elasticity of substitution.
When labor, capital and output grows at the steady state rate, the economy is said achieve
balanced growth. In the steady state, capital accumulation to increase actual investment will increase output
per worker and economy in level, but not in growth rate in the balanced growth path. It is because increase
in the growth rate initially boosted by capital accumulation due to increased saving rate will decrease
eventually by diminishing marginal returns of capital. Since capital growth depends negatively on the
capital-output ratio, capital accumulation only can produce temporary increases the growth rate of output,
but cannot achieve faster steady-state growth rate in economy. To increase level and growth rate in output
per worker and economy, Solow model proposes to incorporate technical progress to improve quality of
labor. Along that, more output can be produced with positive marginal productivity at a given amount of
labor. So, only changes in the rate of technological progress can leave both level and growth effect in
output per worker in manufacturing sector and economy growth in the long run.
Thus, the economy growth is caused by two forces: capital accumulation and technical progress.
First, increases in capital move the economy along the production function. Greater capital will increase
output. Secondly, technical progress shifts the production function upward. Even if capital did not increase,
output will increase because the technological progress improves the quality of capital. Thus, elasticity of
substitution is not only influenced by capital accumulation, but also technical change. Technical change
Prosiding Persidangan Kebangsaan Ekonomi Malaysia Ke V 2010 397
improves the productivity of capital that is not captured by reported capital stock data. More output can be
produced at the same level of labor and capital because both marginal productivity of labor and capital
increase with quality of labor.
Mathematically, the source of economic growth can be quantified by Solow growth accounting.
Particularly, the contribution of capital and labor in Solow model could be recognized from Solow
accounting model. Solow accounting formula also can recognize the effect of total factor productivity on
economy growth. It is captured by the portions of output growth that not explained by capital and labor.
The unexplained change in output is defined as the technological change. The portion of output that
explained by technical progress is called Solow residual. The Solow residual measures effect of technology
change/shock on output.
Endogenous Growth Model
Changes in capital per worker can only affect level of output and consumption, not the growth rate due to
depreciation rate and growing capital at existing level of worker. Here, the increase in capital per worker
due to higher wage and substitution from expansive labor to relative cheaper capital will only cause zero
growth rate in output and capital. It implies that economy growth is constant in long run, as shown in
balanced growth path.
To explain sustainable long run economy growth, growth of output and consumption need to be
changed. Since capital accumulation cannot induce economy growth although it increases level of output,
employment and consumption, economy need to achieve higher "steady state" level of capital per worker
and output per worker by incorporating technical progress in production. Economy grows by the rate of
technical change over time.
In this model, technical change is the factor that causes output growth rate to increase. Without
technical change, capital will only grow at population rate. After technical progress is incorporated, capital
grows at the sum of population rate and technology growth. It implies that only the growth rate of
technology can induce long run economy growth. So, country needs to improve education, knowledge,
innovation, research and learning by doing to improve technical progress in production. With better
research and development, more output could be produced even with the same amount of labor and capital.
Through human capital investment, more advanced technology could be invented and innovated to increase
economy growth with existing factor endowment of the particular country.
Overlapping Generation Model (Diamond Model)
Solow model has been improved by overlapping generation model. This model attempts to explain how
capital accumulation could affect economy growth through elasticity of substitution by incorporating two
periods of life in production. This model assumes firms are owned by households. So, household will
decide how much labor and capital to be hired in order to achieve steady state in the economy. In the first
period of life, individuals need to work and divide income between consumption and saving. When they get
old in the second period of life, they will carry saving in the first period to become capital stock in the
second period. In short, capital in second period is substituted with labor in first period. The decision of
current consumption and future consumption depends on elasticity of substitution between capital and
labor.
Before steady state of economy is achieved, household will increase saving in order to increase
capital per worker in the future. For this purpose to be achieved, household will increase labor supply in
this period and be substituted with higher capital per worker in the future. How much household increases
labor supply and saving depends on elasticity of substation. If elasticity of substitution is high, more current
consumption will be reduced in order to substitute for more future consumption. Increase in capital per
worker in second period will cause economy to grow faster compared to high elasticity of substitution. So,
the substitution between capital and labor this period and next period depends on elasticity of substitution
this period.
Empirical Studies
To explain how the factor substitution could affect production function and thereby economy growth,
previous literature has been reviewed and analyzed. There are many articles to extend Solow (1956) for
empirical practice. One of them, Klump and Preissler (2000) has analyzed the relationship between
398 Pui Kiew Ling
elasticity of substitution and economic growth. Theoretically, the paper expanded the effect of elasticity of
substitution on growth through three effects: threshold effect, effect on the level of steady state and effect
on level of convergence. Applying the assumption of Solow neoclassical economy growth where
investment to be equal to saving, constant rate of capital depreciation and rate of population growth in these
three cases, it can be concluded that elasticity of substitution could affect long term economy growth rate
positively. In first two cases, increase in elasticity of substitution will increase long-term rate of sustained
growth and steady-state of capital per worker. Meanwhile in third case, change in elasticity of substitution
changes speed of convergence depends on the relative scarcity of the factors of substitution. In the three
cases, level of steady state is positively related with elasticity of substitution.
Arrow, Chenery, Minhas and Solow (1961) also extends Solow (1956) by proposing to linearize
the Constant Elasticity of Substitution using logarithm form. Claiming the original Constant Elasticity of
Substitution production function only emphasis the quantity of labor and capital accumulation in
production, David and van de Klundert (1965) has proposed to incorporate the effect of technical progress
in production. This effect will increase quality of labor and capital, thereby increasing more output without
increase quantity of capital and labor.
There are several literatures to estimate factor substitution in production function. One of
production function research is Zahid, Akbar and Jaffry (1992) with reference to manufacturing sector in
Pakistan. The findings of inelastic capital-labour substitution, high capital intensity and slow technical
change have reduced the possibility of changing capital intensity to more labour redundant in
manufacturing sector in Pakistan. If government wants to reduce unemployment, technical change to
increase the effectiveness of labour need to be incorporated in production. The increased quality of labour
will then raise the possibility for capital to be substituted with labours.
The similar study has been adopted by Downes (1987) in manufacturing production in Bardados.
Particularly, the labor demand function has been derived from cost minimizing Constant Elasticity of
Substitution production function subject to a given targeted output. Although production function
experienced return to scale, employment expansion in manufacturing sector was limited due to labour-
saving technical change and low level of substitution parameter.
The possibility of factor substitution can influence return to scale in industries and economy
growth. As studied by Chen (1977) with reference to Hong Kong manufacturing sector, manufacturing
sector is recognized to suffer from decreasing return to scale in the estimated Cobb Douglas production.
The lack of scale of economies in manufacturing sector, however, is not consistent with high elasticity of
substitution between capital and labor estimated using linear Constant Elasticity of Substitution production
function suggested by Arrow, Chenery, Minhas and Solow (1961). It can be interpreted that changes in
factor price in Hong Kong manufacturing sector tends to lead to high factor substitution between capital
and labor although inputs are less productive. The inefficiency in resource allocation in firm indicates that
the major source of growth in manufacturing sector is technical progress, not economies of scale.
A study on time variation in the elasticities of factor substitution applying Variable Elasticity of
Substitution production function has been examined by Wang (1995). Meanwhile, labour, capital and
material inputs translog cost function had been applied to estimate the elasticities of substitution in
Taiwan‟s manufacturing sector. Translog cost function was also applied by Truett and Truett (1995) to
investigate the existence of economies of scale and direct and cross price elasticities of demand for inputs
in the Mexican petroleum industry.
Based on the theory that the elasticity of substitution and return to scale will influence economic
growth of a country, several empirical comparison of elasticity of substitution in developed and developing
countries have been done using both the time series and cross section data. The findings of the comparison
are being cautious about technology importing since it can increase cost of production in developing
countries. Instead of relying on technological progress from developed countries, developing countries
should develop their own technologies, guided by their factor endowments. For this purpose, developing
countries including Malaysia may encourage research and development, investment in human capital,
learning by doing, education and knowledge spillover. This knowledge accumulation could increase
effectiveness of labor and capital in promoting economy growth.
Specifically, Yuhn (1991) studied the relevance of size of elasticity of substitution between factors
on economics factor comparing developed countries, United States and developing countries referred
specifically to South Korea using Solow model. Supporting De La Grandville Hypothesis, elasticity of
substitution is a significant factor of economic growth in South Korea, but not in United States. The growth
rate of Korea real output tends to follow high elasticity of substitution between capital and labor. Fall in
labor share due to technical change outpaces the rise in labor share due to high elasticity of substitution.
Prosiding Persidangan Kebangsaan Ekonomi Malaysia Ke V 2010 399
Meanwhile, the low factor substitutability of labor for capital in United States suggests the economy
growth rate in United States depends on technological progress. It suggests that elasticity of substitution
after change in input price in higher in Korea compared to United States. The factor substitution is inelastic
in United States because government always distort wage to protect worker from unemployment. Worker is
increasingly demanding larger factor share in production proportional to economic growth in United States.
The subsequent conclusion is that both high growth and balanced growth is difficult to be achieved at the
same time. Korean economy only achieves high economy growth while United States only in balanced
growth with the backdrop of lackluster growth.
However, Miyagiwa and Papageorgiou (2003) has opposed the monotonic relationship between
elasticity of substitution and factor substitutability with economy growth suggested by De La Grandville
Hypothesis. Applying Diamond overlapping-generation model, high elasticity of substitution will decrease
income per worker and economy growth in transit and in steady state. It is because an increase in wage
income will raise substitutability of capital for labor and clearly decrease labor share. Decrease in income
of labor will eventually decrease economy growth.
METHODOLOGY
The incorporation of production function in explaining economic growth motivates to study how exactly
the elasticity of substitution influence economy growth does. For this purpose, elasticity of substitution in
manufacturing sector in Malaysia will be recognized from Transcendental Logarithm production function
to study the effect of relatively elastic factor substitution on economy growth. This production function is
the most appropriate technology for flexible and high factor substitution and also efficient input
combination. Secondly, the elasticity of substitution of the production function will be regressed with rate
of economy growth to trace out how high and variable elasticity of substitution in manufacturing sector can
affect economy growth. Intuitively, the regression analyzes the possibility of factor substitution in
influencing the speed of convergence for promoting rapid economy growth and achieving steady-state in
economy. Thirdly, the effect on labor, capital and technical change on economy growth will be examined
through Solow Growth Accounting to recognize the source of economy growth. Based on the source, an
appropriate price distortion policy will be recommended to improve the manufacturing sector. The
contribution of this sector needs to be emphasized to promote rapid economy growth since manufacturing
sector accounts for large percentage in Gross Domestic Product in Malaysia.
Variable Definition
Variables used in this paper include labour proxied by number of persons engaged as at 31st December or
the last pay period, capital proxied value of assets owned as at 31st December (RM million), population,
labour force, investment proxied by approved capital investment in the manufacturing sector (RM million)
and output (Y) proxied by Gross Domestic Product in Current Price (RM Million)
Source of Data
The time series data of output, labor, capital and wage from 1970 to 2005 and data population and labour
force from 1983 to 2005 are obtained from Department of Statistics, Malaysia. Meanwhile, the data of
consumer price index and deposit rate from 1970 to 2005 are obtained from datastream. The data on
approved capital investment in the manufacturing sector from 1983 to 2005 and Gross Domestic Product in
Current Price are obtained from Central bank of Malaysia.
Transcendental Logarithm Production Function Estimation
Basically, the elasticity of substitution keeps on changing along isoquant in Transcendental Logarithm
(translog) production function. It is because translog production functions exhibit more flexibility and
variability in profit maximizing and cost minimizing subject to output compared to firm applying Cobb
Douglas or Constant Elasticity of Substitution production function. From this production function,
marginal product, marginal rate of technical substitution and elasticity of substitution will be obtained. If
translog production functions yields high elasticity of substitution, this production function is suggested for
manufacturing firm in Malaysia to produce output.
400 Pui Kiew Ling
Assumes manufacturing industry only employs two inputs, labour (L) and capital (K) to produce
output (Q). The estimated translog production function is as below.
Qt = KβK
LβL
(K)2βKK
(L)2βLL
(KL)βKL
(1)
After the production function is transformed into logarithm form,
LogQ = βKLogK + βLLogL + βKK(LogK)2 + βLL(LogL)
2 + βKL(LogK)(LogL) (2)
The data on inputs and output were transferred to logarithm. Equation (2) could be estimated using
Ordinary Least Square. Marginal product, output elasticity, return to scale, marginal rate of technical
substitution and elasticity of substitution in translog production function will be calculated from estimation
of equation (2). Marginal product of labor and capital in translog production function can be calculated
using below formula:
fL = L
Q
= βL(
L
Q) fK =
K
Q
= βK(
K
Q)
The output elasticity for labour and capital in translog production function could be obtained by
differentiating the translog production function with respect to each input.
εL = L
Q
ln
ln
= βL+ 2βLLLogL+ βKLLogK (3)
εK = K
Q
ln
ln
= βK + 2βKK LogK+ βKLLogL (4)
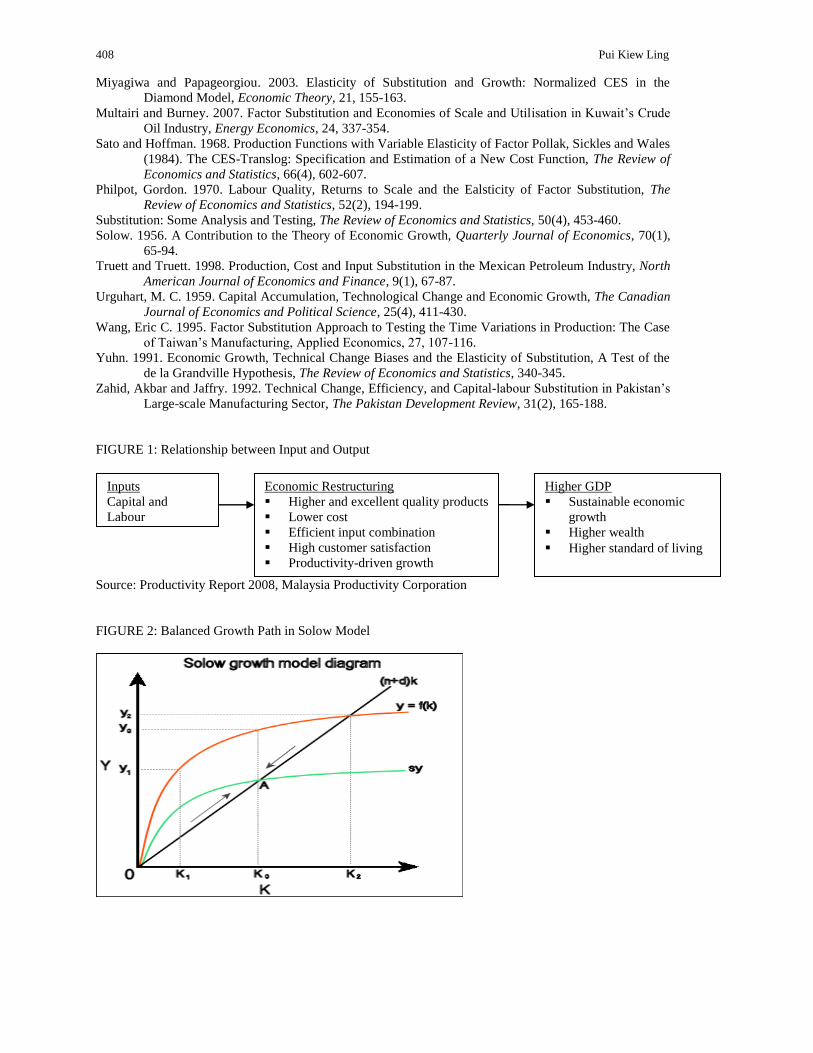
In the equation (3) and (4), βL represents the average cost share of labor while βK represents the
average cost share of capital. Meanwhile, βLL and βKK measure the own price elasticities. Particularly βLL
measures the labour share elasticity with respect to labour and βKK measures the capital share elasticity with
respect to capital respectively. More intuitively, βLL measures the percentage change in quantity of labour
caused by a percentage change in the price of labour (wage) and βKK measures the percentage change in
quantity of the capital caused by a percentage change in the price of capital (rental rate). βKL measure the
cross price elasticity. Particularly, βKL measures the one input share elasticity with respect to another input.
More intuitively, βKL measures the percentage change in quantity of one input caused by a percentage
change in price of another inputi.
Marginal rate of technical substitution between labor and capital could be obtained through the
ratio of marginal product of labor and capital as shown in below formula.
MRTS (K for L) = - dL
dK |dq=0 =
K
L
MP
MP=
K
L
f
f=
K
QK
L
QL
In translog case, the ratio of marginal products is
MRTS = K
L
f
f=
K
L
L
K
From the estimation of βKK, βLL and βKL, Allen partial elasticities of substitution (AES) could be
obtained to measure the degree of substitutability or complementarily among factors of production.
ζLK = KL
KLLK
SS
SS
Prosiding Persidangan Kebangsaan Ekonomi Malaysia Ke V 2010 401
where SL = cost share of input L
SK = cost share of input K
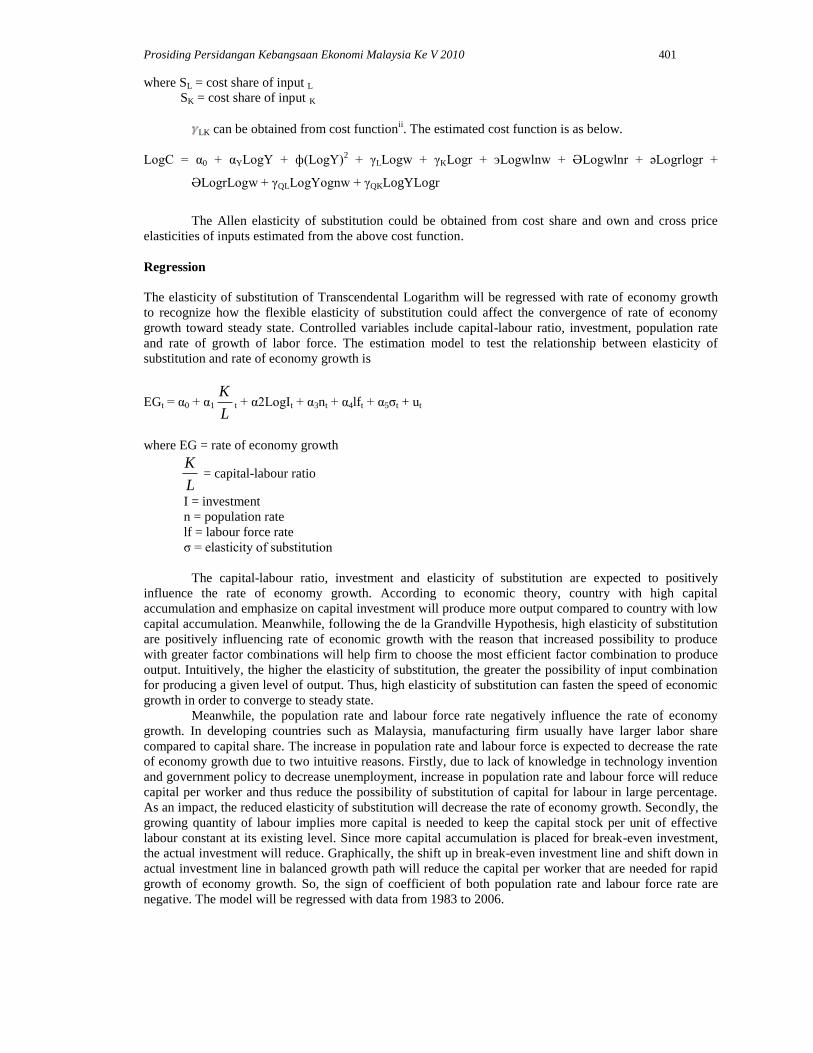
LK can be obtained from cost functionii. The estimated cost function is as below.
iii To recognize growth of manufacturing sector is contributed by which factor, the contribution of each
factor will be compared. Particularly, if A
Ais smaller than α
K
K, economy growth is contributed more
significantly by capital accumulation rather than technical progress. Consistent with this finding, price
distortion policy with the objective to reduce unemployment will be designed.
However, if A
Ais larger than α
K
K, economy growth is said contributed more significantly
more by technical progress compared to capital accumulation. Consistent with this finding, price distortion
policy to increase output per worker in both level and growth rate in long run and also to reduce
unemployment through increased quality and effectiveness of labor will be designed. For example, the
country could invest more in education, knowledge, innovation, research and learning by doing to improve
technical progress in production. The less significance of capital accumulation in contributing to economy
growth might due to constant growth rate of output per worker. So, technical progress needs to be
incorporated into production in order to increase economy growth.
Finally, the existence of steady state of output, consumption and capital per worker will be
recognized by plotting production function, break-even investment and actual investment. From the
balanced growth path, government needs to increase job vacancy and economy growth based on its
endowment recognized from Solow Accounting Formula. If steady-state output per worker is less than the
point where break-even investment intercepts with actual investment in growth path, investment and
employment should be increased by either increasing capital or technology invention. However, if the
plotted intercepts is on the right of point where break-even investment intercepts with actual investment,
government needs to decrease inflation and economy bubble by either increasing interest rate or encourage
export. iv
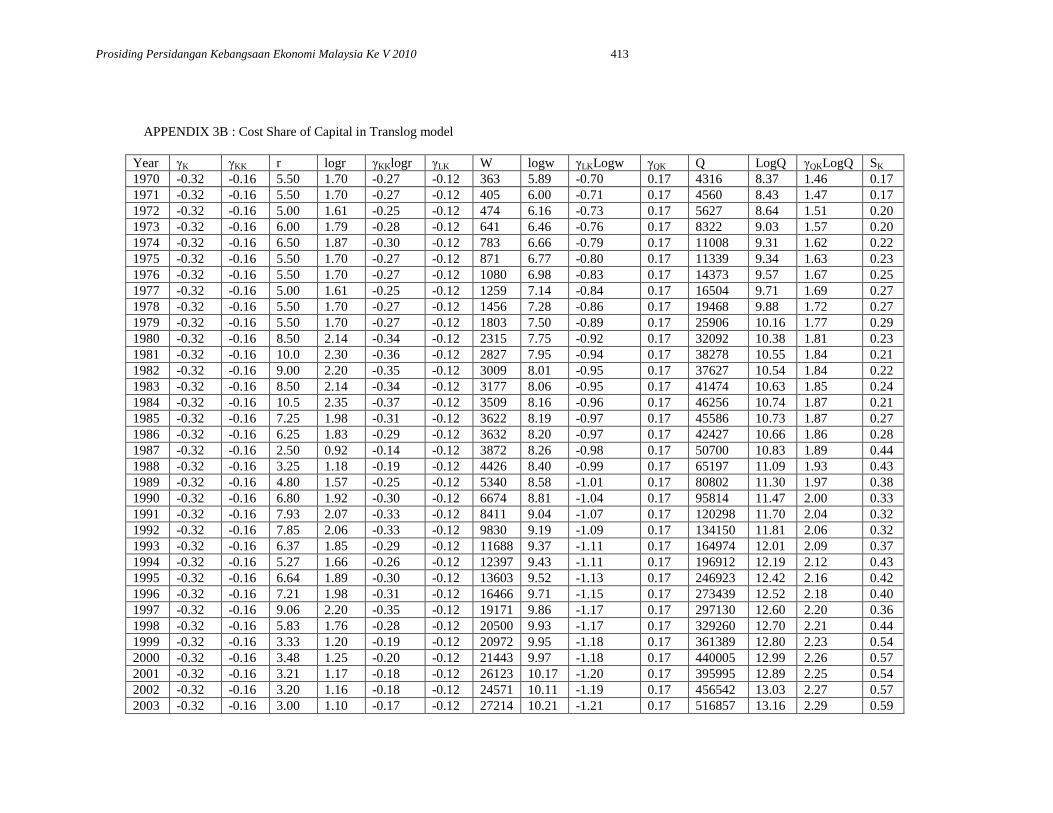
To obtain cost share of labour and capital, own and cross price elasticity for labour and capital is
obtained respectively. Since ф = 2
1γYY, э =
2
1γLL, Ә =
2
1γLK, ә =
2
1γKK, the value of γYY, γLL, γLK, γKK
and γKL could be calculated as below.
ф = 2
1γYY
– 0.5086 = 2
1γYY
γYY = -1.0172
The own price elasticity for labour is as follows.
э = 2
1γLL
0.9247 = 2
1γLL
Prosiding Persidangan Kebangsaan Ekonomi Malaysia Ke V 2010 419
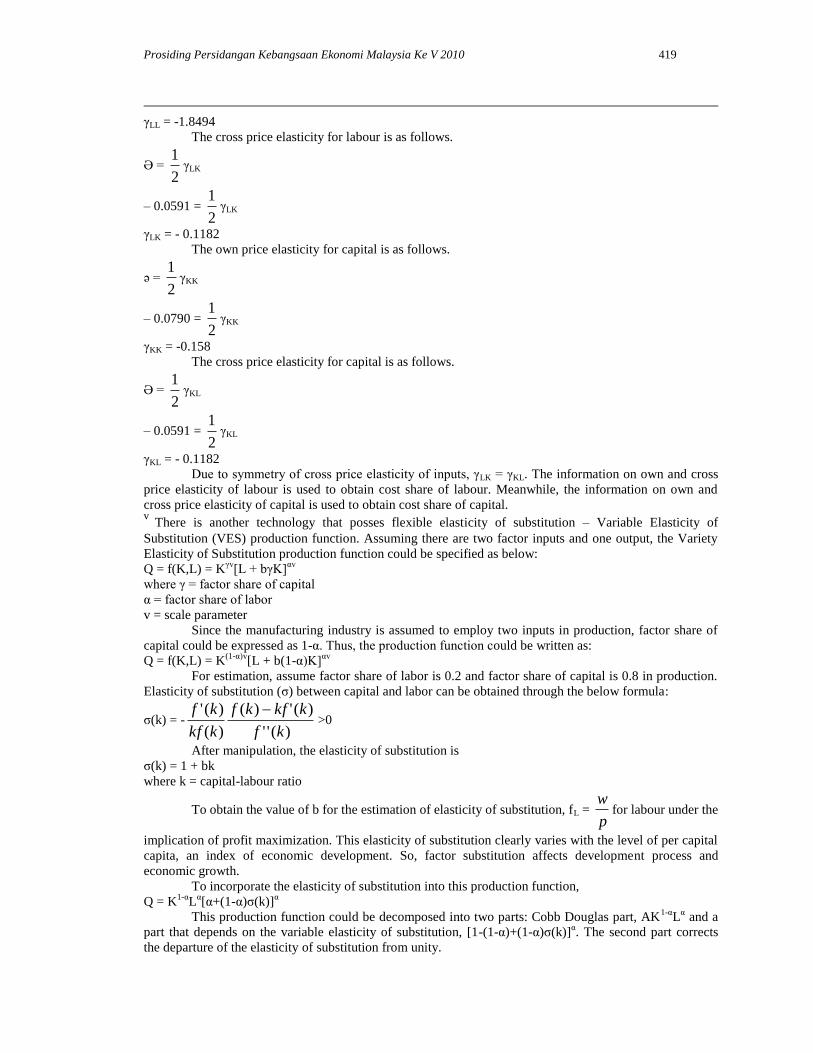
γLL = -1.8494
The cross price elasticity for labour is as follows.
Ә = 2
1γLK
– 0.0591 = 2
1γLK
γLK = - 0.1182
The own price elasticity for capital is as follows.
ә = 2
1γKK
– 0.0790 = 2
1γKK
γKK = -0.158
The cross price elasticity for capital is as follows.
Ә = 2
1γKL
– 0.0591 = 2
1γKL
γKL = - 0.1182
Due to symmetry of cross price elasticity of inputs, γLK = γKL. The information on own and cross
price elasticity of labour is used to obtain cost share of labour. Meanwhile, the information on own and
cross price elasticity of capital is used to obtain cost share of capital. v There is another technology that posses flexible elasticity of substitution – Variable Elasticity of
Substitution (VES) production function. Assuming there are two factor inputs and one output, the Variety
Elasticity of Substitution production function could be specified as below:
Q = f(K,L) = Kγv
[L + bγK]αv
where γ = factor share of capital
α = factor share of labor
v = scale parameter
Since the manufacturing industry is assumed to employ two inputs in production, factor share of
capital could be expressed as 1-α. Thus, the production function could be written as:
Q = f(K,L) = K(1-α)v
[L + b(1-α)K]αv
For estimation, assume factor share of labor is 0.2 and factor share of capital is 0.8 in production.
Elasticity of substitution (ζ) between capital and labor can be obtained through the below formula:
ζ(k) = -)(''
)(')(
)(
)('
kf
kkfkf
kkf
kf >0
After manipulation, the elasticity of substitution is
ζ(k) = 1 + bk
where k = capital-labour ratio
To obtain the value of b for the estimation of elasticity of substitution, fL = p
wfor labour under the
implication of profit maximization. This elasticity of substitution clearly varies with the level of per capital
capita, an index of economic development. So, factor substitution affects development process and
economic growth.
To incorporate the elasticity of substitution into this production function,
Q = K1-α
Lα[α+(1-α)ζ(k)]
α
This production function could be decomposed into two parts: Cobb Douglas part, AK1-α
Lα and a
part that depends on the variable elasticity of substitution, [1-(1-α)+(1-α)ζ(k)]α. The second part corrects
the departure of the elasticity of substitution from unity.
420 Pui Kiew Ling
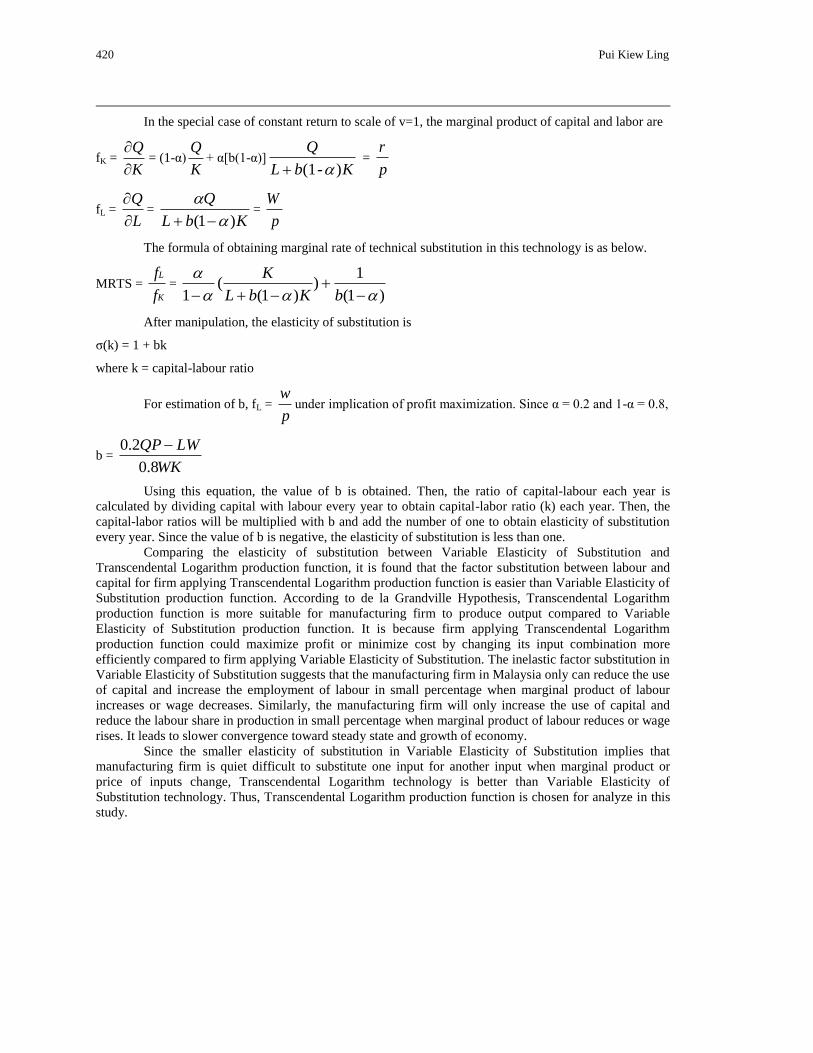
In the special case of constant return to scale of v=1, the marginal product of capital and labor are
fK = K
Q
= (1-α)
K
Q+ α[b(1-α)]
KbL
Q
)-(1 =
p
r
fL = L
Q
=
KbL
Q
)1(
=
p
W
The formula of obtaining marginal rate of technical substitution in this technology is as below.
MRTS = K
L
f
f=
)1(
1)
)1((
1
bKbL
K
After manipulation, the elasticity of substitution is
ζ(k) = 1 + bk
where k = capital-labour ratio
For estimation of b, fL = p
wunder implication of profit maximization. Since α = 0.2 and 1-α = 0.8,
b = WK
LWQP
8.0
2.0
Using this equation, the value of b is obtained. Then, the ratio of capital-labour each year is
calculated by dividing capital with labour every year to obtain capital-labor ratio (k) each year. Then, the
capital-labor ratios will be multiplied with b and add the number of one to obtain elasticity of substitution
every year. Since the value of b is negative, the elasticity of substitution is less than one.
Comparing the elasticity of substitution between Variable Elasticity of Substitution and
Transcendental Logarithm production function, it is found that the factor substitution between labour and
capital for firm applying Transcendental Logarithm production function is easier than Variable Elasticity of
Substitution production function. According to de la Grandville Hypothesis, Transcendental Logarithm
production function is more suitable for manufacturing firm to produce output compared to Variable
Elasticity of Substitution production function. It is because firm applying Transcendental Logarithm
production function could maximize profit or minimize cost by changing its input combination more
efficiently compared to firm applying Variable Elasticity of Substitution. The inelastic factor substitution in
Variable Elasticity of Substitution suggests that the manufacturing firm in Malaysia only can reduce the use
of capital and increase the employment of labour in small percentage when marginal product of labour
increases or wage decreases. Similarly, the manufacturing firm will only increase the use of capital and
reduce the labour share in production in small percentage when marginal product of labour reduces or wage
rises. It leads to slower convergence toward steady state and growth of economy.
Since the smaller elasticity of substitution in Variable Elasticity of Substitution implies that
manufacturing firm is quiet difficult to substitute one input for another input when marginal product or
price of inputs change, Transcendental Logarithm technology is better than Variable Elasticity of
Substitution technology. Thus, Transcendental Logarithm production function is chosen for analyze in this