Pedro Casero, R&D DepartmentELCOGAS S.A (www.elcogas.es)
2
SCOPE
CO2 Capture Pilot Plant & H2 production project. Overview
Characterization tests: results
Costs estimation
Conclusions
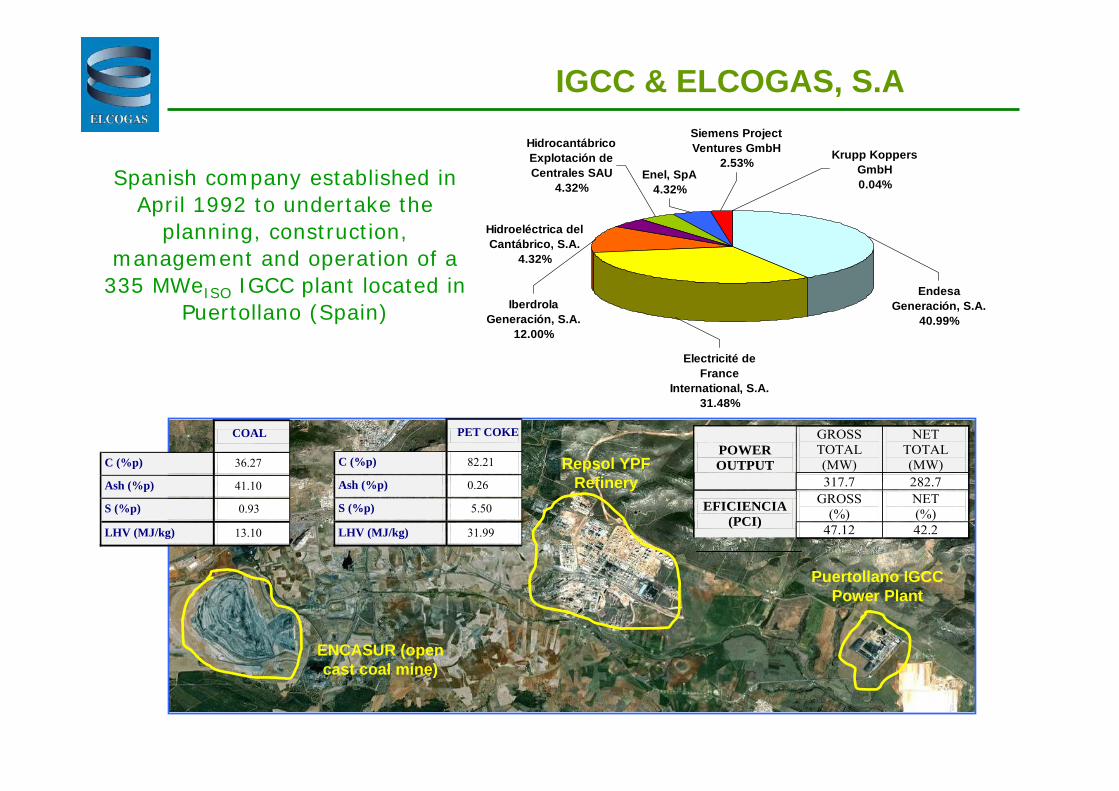
Spanish company established in April 1992 to undertake the
planning, construction, management and operation of a
335 MWeISO IGCC plant located in Puertollano (Spain)
Puertollano IGCC Power Plant
Repsol YPF Refinery
ENCASUR (open cast coal mine)
Enel, SpA4.32%
Siemens Project Ventures GmbH
2.53%Hidrocantábrico Explotación de Centrales SAU
4.32%
Electricité de France
International, S.A.31.48%
Endesa Generación, S.A.
40.99%
Krupp Koppers GmbH0.04%
Iberdrola Generación, S.A.
12.00%
Hidroeléctrica del Cantábrico, S.A.
4.32%
COAL
C (%p) 36.27
Ash (%p) 41.10
S (%p) 0.93
LHV (MJ/kg) 13.10
PET COKE
C (%p) 82.21
Ash (%p) 0.26
S (%p) 5.50
LHV (MJ/kg) 31.99
GROSS TOTAL (MW)
NET TOTAL (MW)
POWER OUTPUT
317.7 282.7 GROSS
(%) NET (%) EFICIENCIA
(PCI) 47.12 42.2
IGCC & ELCOGAS, S.A
Consejería de Educación, Ciencia y Cultura
To demonstrate the feasibility of capture of CO2 and production of H2 in an IGCC.
To obtain economic data enough to scale it to the full Puertollano IGCC capacity in synthetic gas production.
Targets
Location Full integrated in IGCC Puertollano Power Plant
Size 14 MWt (2% slip-stream of the IGCC plant)
Capture Technology Precombustion. Capture > 90%Products are recycled back (not included CO2 storage).
Budget Construction & commissioning: 13,5 M€
Funding programme National programme cofinanced by MICINN and JCCM with 7,1 M€.
Status End commissioning in October 2010
Official characterisation tests from October 2010 to June 2011
Now involved in FECUNDUS (VI FP) and in internal research
Since starting commissioning: 770 operating hours.
CO2 Capture Pilot Plant. ProjectPSE-120000-2005-2/PSS-120000-2005-10
PSE-120000-2006-39/PSS-120000-2006-8
PSE-120000-2007-6/PSS-120000-2007-25
PSE-120000-2008-6/PSS-120000-2008-29
PSE-120000-2009-14/PSS-120000-2009-57
5
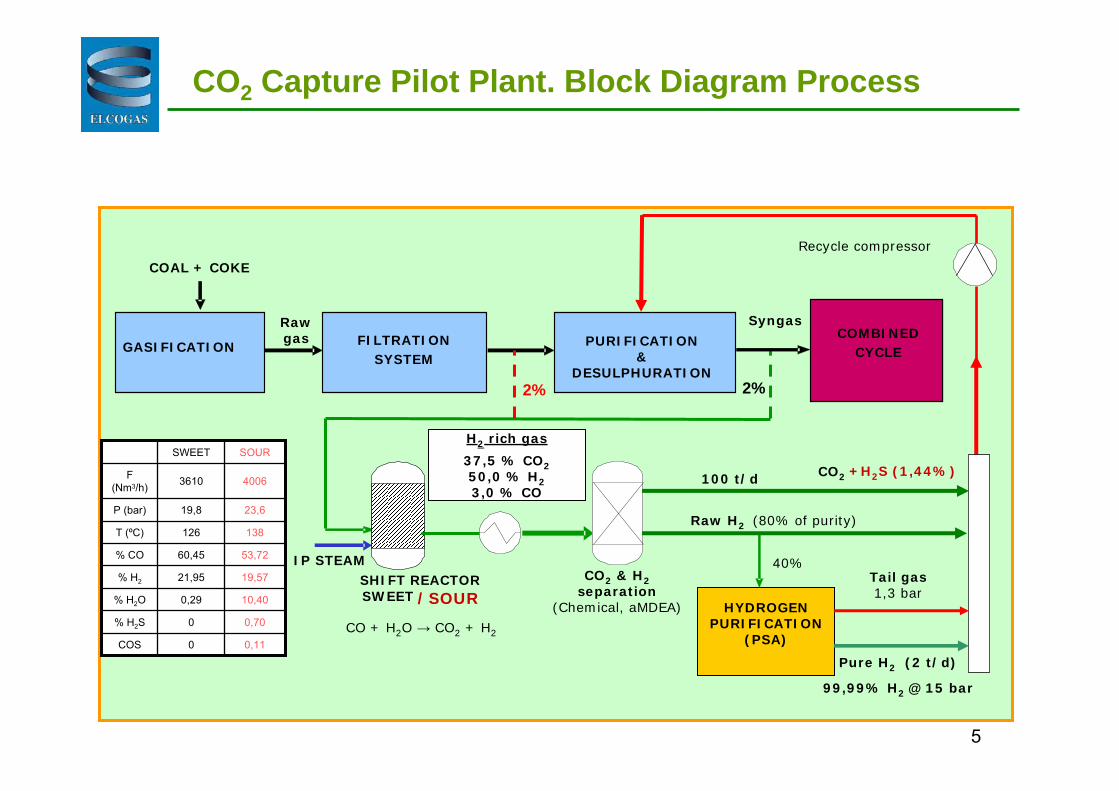
CO2 Capture Pilot Plant. Block Diagram Process
COMBINEDCYCLE
COAL + COKE
GASIFICATION
Raw gas FILTRATION
SYSTEM
Syngas
PURIFICATION &
DESULPHURATION
Tail gas1,3 bar
IP STEAMSHIFT REACTOR
CO2
CO2 & H2separation
(Chemical, aMDEA)
100 t/d
CO + H2O → CO2 + H2
Raw H2 (80% of purity)
40%
H2 rich gas
37,5 % CO250,0 % H23,0 % CO
HYDROGENPURIFICATION
(PSA)
Recycle compressor
Pure H2 (2 t/d)
99,99% H2 @ 15 bar
SWEET /SOUR
+H2S (1,44%)
2% 2%
0,110COS
0,700% H2S
10,400,29% H2O
19,5721,95% H2
53,7260,45% CO
138126T (ºC)
23,619,8P (bar)
40063610F (Nm3/h)
SOURSWEET
r
Shiftedgas
Cond.gas
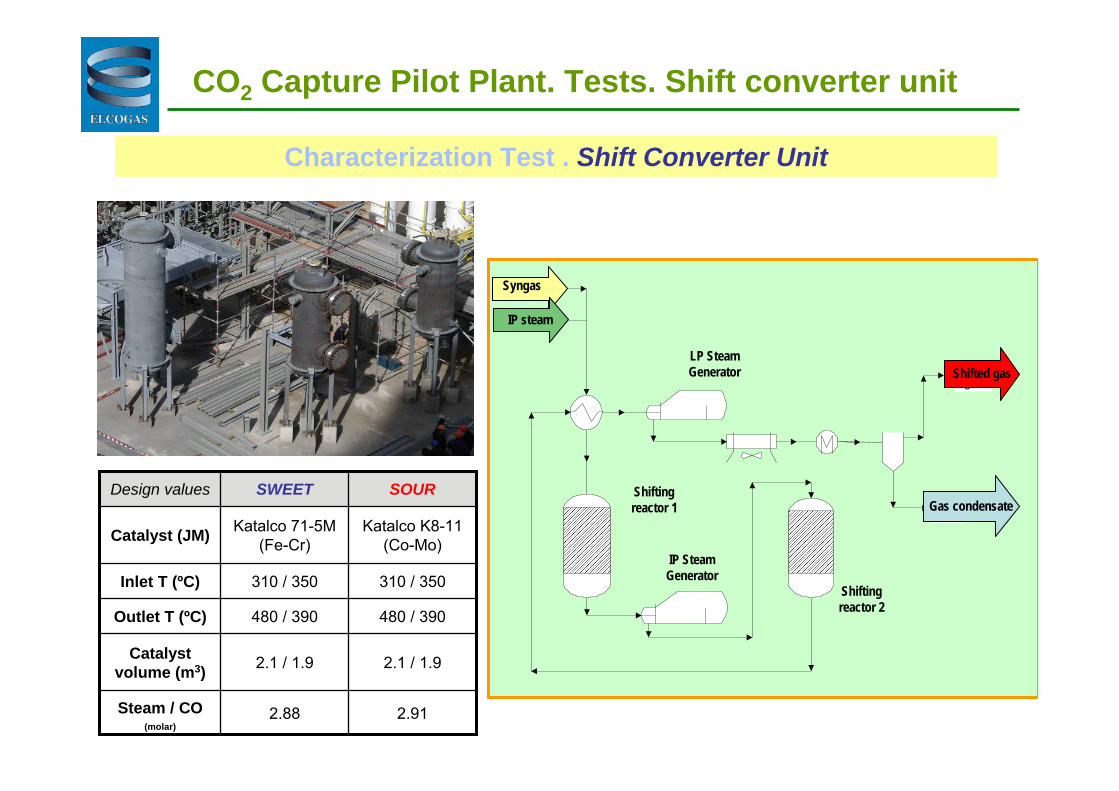
CO2 Capture Pilot Plant. Tests. Shift converter unit
Characterization Test . Shift Converter Unit
Syngas
IP steam
Shifted gas
Gas condensate
LP Steam Generator
IP Steam Generator
Shifting reactor 2
Shifting reactor 1
2.1 / 1.92.1 / 1.9Catalystvolume (m3)
2.912.88Steam / CO (molar)
480 / 390480 / 390Outlet T (ºC)
310 / 350310 / 350Inlet T (ºC)
Katalco K8-11 (Co-Mo)
Katalco 71-5M (Fe-Cr)Catalyst (JM)
SOURSWEETDesign values
SHIFTING UNIT STEAM/GAS RATIO (kg/kg)SOUR
Mín. ratio = 1,04
Ref.(Ratio = 1,18)
Máx ratio. = 1,33
CO2 Capture Pilot Plant. Tests. Shift converter unit
0
1
2
3
4
5
6
7
8
9
10
340 360 380 400 420 440 460 480 500 520 540
Temperature (ºC)
CO
(%)
XCO(%) = 95,70
XCO(%) = 96,47XCO(%) = 96,78
XCO(%) : CO total conversion in WGS
8
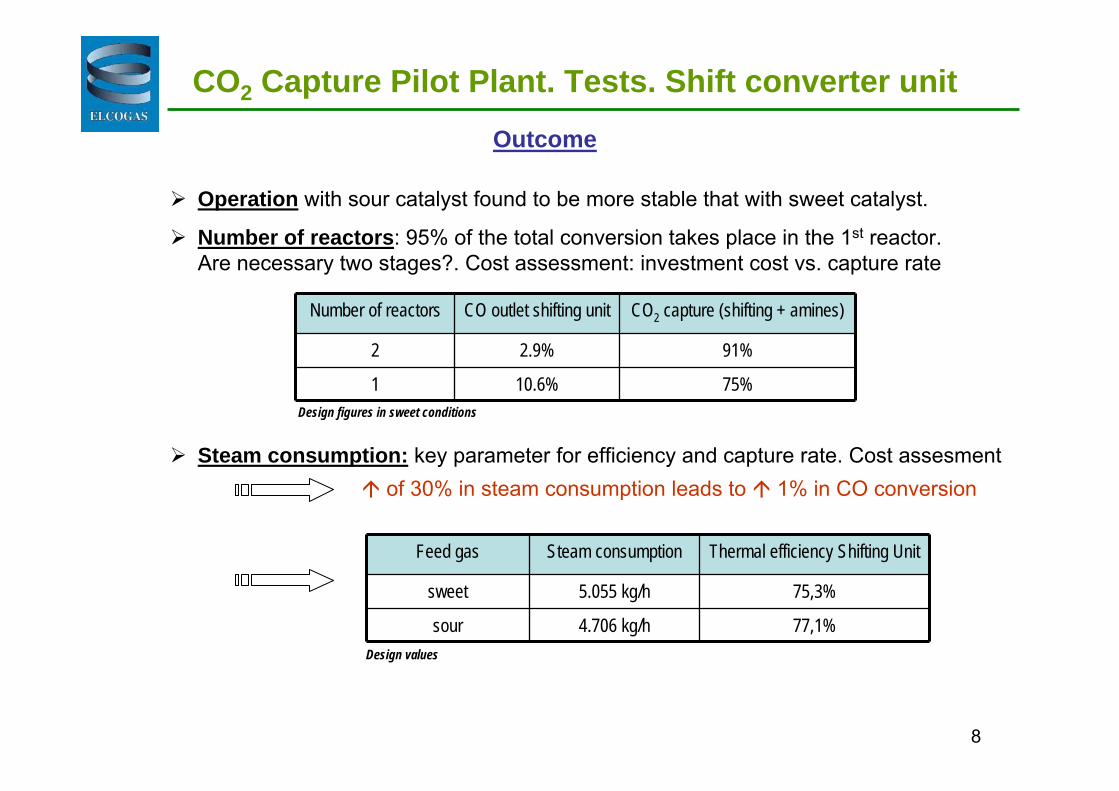
CO2 Capture Pilot Plant. Tests. Shift converter unitOutcome
Number of reactors CO outlet shifting unit CO2 capture (shifting + amines)
2 2.9% 91%
1 10.6% 75%
Operation with sour catalyst found to be more stable that with sweet catalyst.
Number of reactors: 95% of the total conversion takes place in the 1st reactor. Are necessary two stages?. Cost assessment: investment cost vs. capture rate
Design figures in sweet conditions
Steam consumption: key parameter for efficiency and capture rate. Cost assesmentof 30% in steam consumption leads to 1% in CO conversion
Feed gas Steam consumption Thermal efficiency Shifting Unit
sweet 5.055 kg/h 75,3%
sour 4.706 kg/h 77,1%Design values
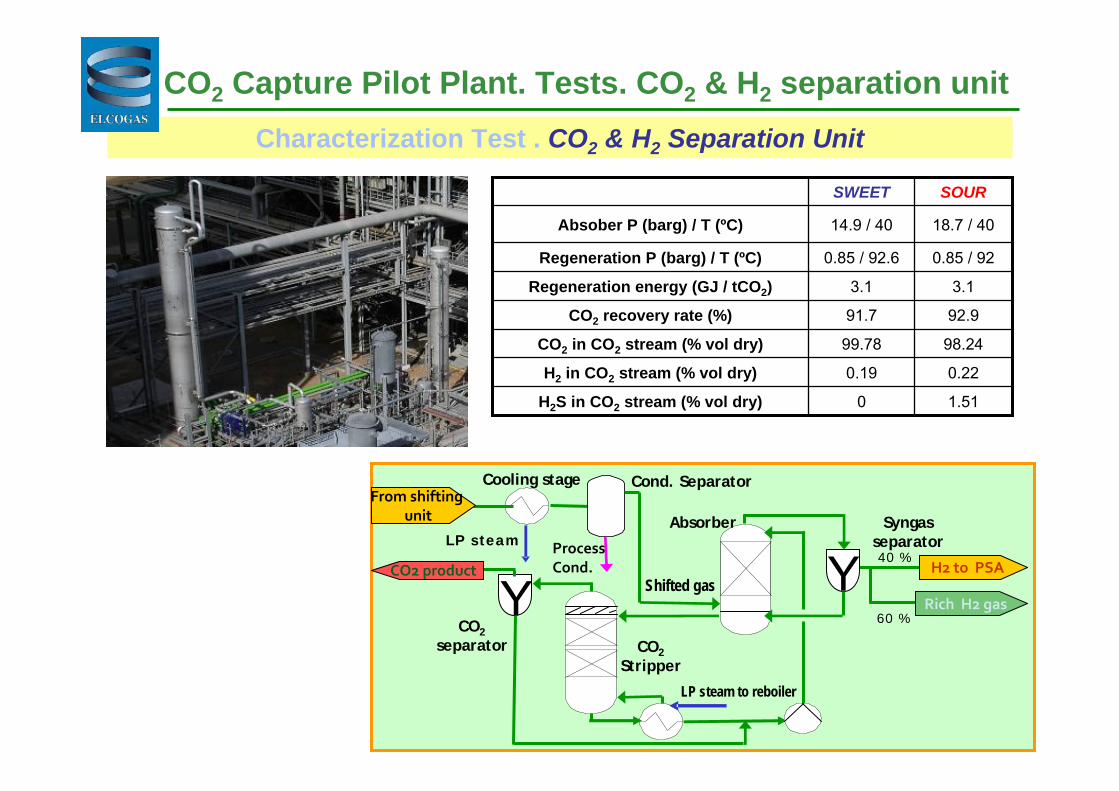
CO2 Capture Pilot Plant. Tests. CO2 & H2 separation unitCharacterization Test . CO2 & H2 Separation Unit
YCO2 product
Rich H2 gas
LP steam
Y 40 %
60 %
LP steam to reboiler
H2 to PSA
From shiftingunit
Cooling stage
Absorber
CO2Stripper
CO2 separator
Syngasseparator
Cond. Separator
ProcessCond.
Shifted gas
98.2499.78CO2 in CO2 stream (% vol dry)
0.220.19H2 in CO2 stream (% vol dry)
1.510H2S in CO2 stream (% vol dry)
92.991.7CO2 recovery rate (%)
3.13.1Regeneration energy (GJ / tCO2)
0.85 / 920.85 / 92.6Regeneration P (barg) / T (ºC)
18.7 / 4014.9 / 40Absober P (barg) / T (ºC)
SOURSWEET
10
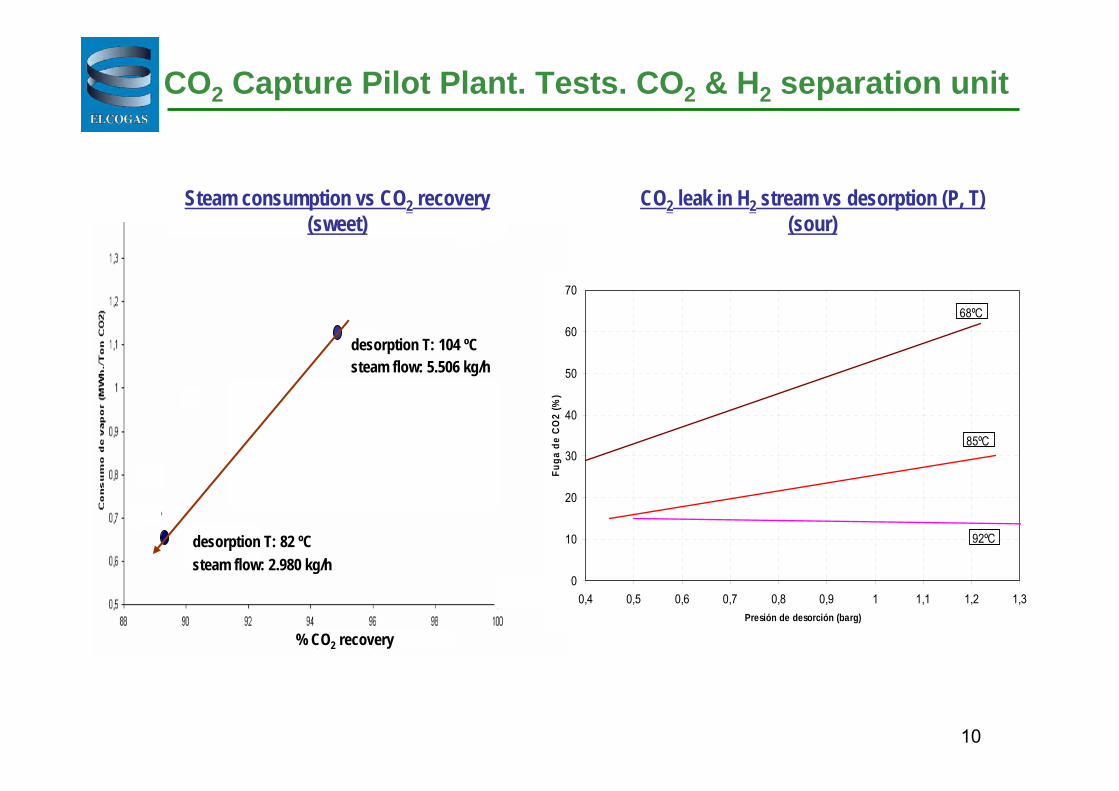
CO2 Capture Pilot Plant. Tests. CO2 & H2 separation unit
CO2 Capture Pilot Plant. CO2 capture cost estimation
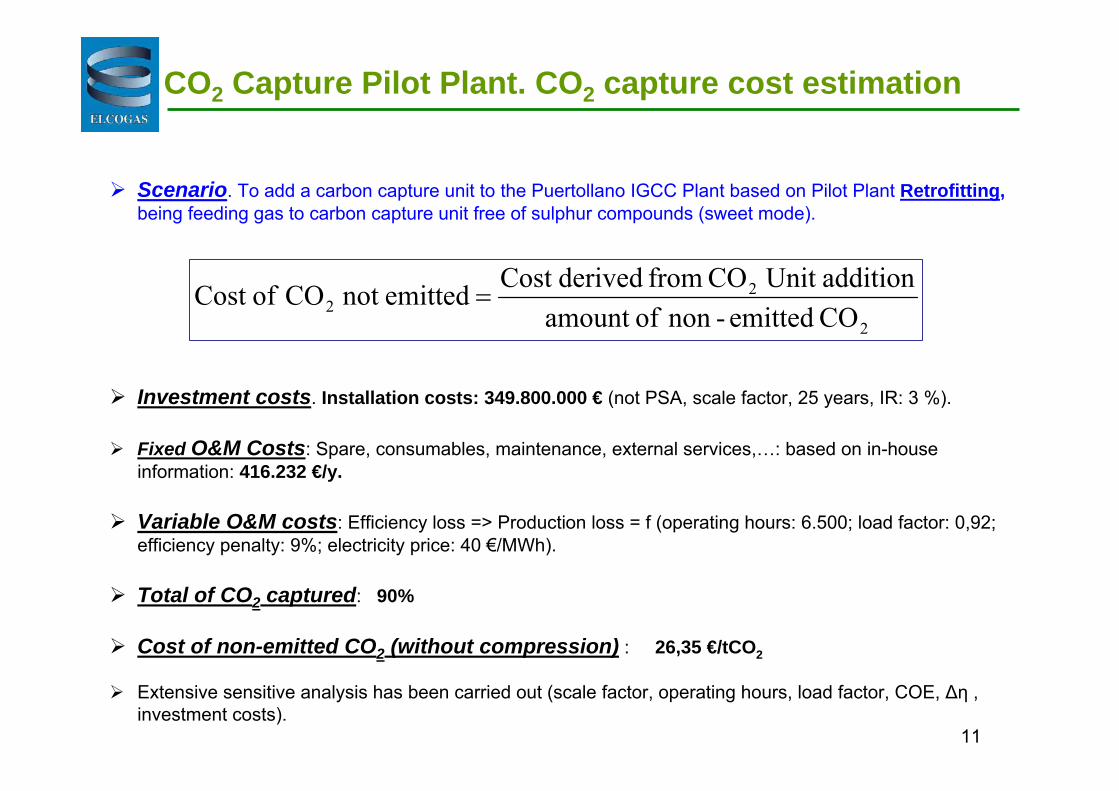
Scenario. To add a carbon capture unit to the Puertollano IGCC Plant based on Pilot Plant Retrofitting, being feeding gas to carbon capture unit free of sulphur compounds (sweet mode).
Fixed O&M Costs: Spare, consumables, maintenance, external services,…: based on in-houseinformation: 416.232 €/y.
Variable O&M costs: Efficiency loss => Production loss = f (operating hours: 6.500; load factor: 0,92; efficiency penalty: 9%; electricity price: 40 €/MWh).
Total of CO2 captured: 90%
Cost of non-emitted CO2 (without compression) : 26,35 €/tCO2
Extensive sensitive analysis has been carried out (scale factor, operating hours, load factor, COE, ∆η , investment costs).
2
22 CO emitted-non ofamount
addition Unit CO from derivedCost emittednot CO ofCost =
12
CO2 Capture Pilot Plant. CO2 capture cost estimation
10
2030
40
50
6070
80
90
27 28 29 30 31 32 33 34 35 36 37
IGCC plant efficiency with CO2 capture, %
CO
2 co
st, €
/t C
O2
3.000 h
3.500 h
4.000 h
4.500 h
5.000 h
5.500 h
6.000 h
6.500 h
7.000 h
7.500 h
6,500 hOperating hours (IGCC mode)
0.75Scale factor
0.5 %Bank fee
3.0 %Bank interest
25 Expected life
Data Variables
6,500 hOperating hours (IGCC mode)
0.75Scale factor
0.5 %Bank fee
3.0 %Bank interest
25 Expected life
Data Variables Data Variables Data Variables
100 %Treated gas
33 %Net efficiency of power plant with CO2 capture
40 €/MWhElectricity price
0.92 Average load factor
100 %Treated gas
33 %Net efficiency of power plant with CO2 capture
40 €/MWhElectricity price
0.92 Average load factor
Effect of plant efficiency in CO2 capture as retrofitting
13
CO2 Capture Pilot Plant. CO2 capture cost estimation
102030405060708090
20 40 60 80 100 120
Electricity price, €/MWh
CO
2 cos
t, €/
t CO
23.000 h
3.500 h
4.000 h
4.500 h
5.000 h
5.500 h
6.000 h
6.500 h
7.000 h
7.500 h
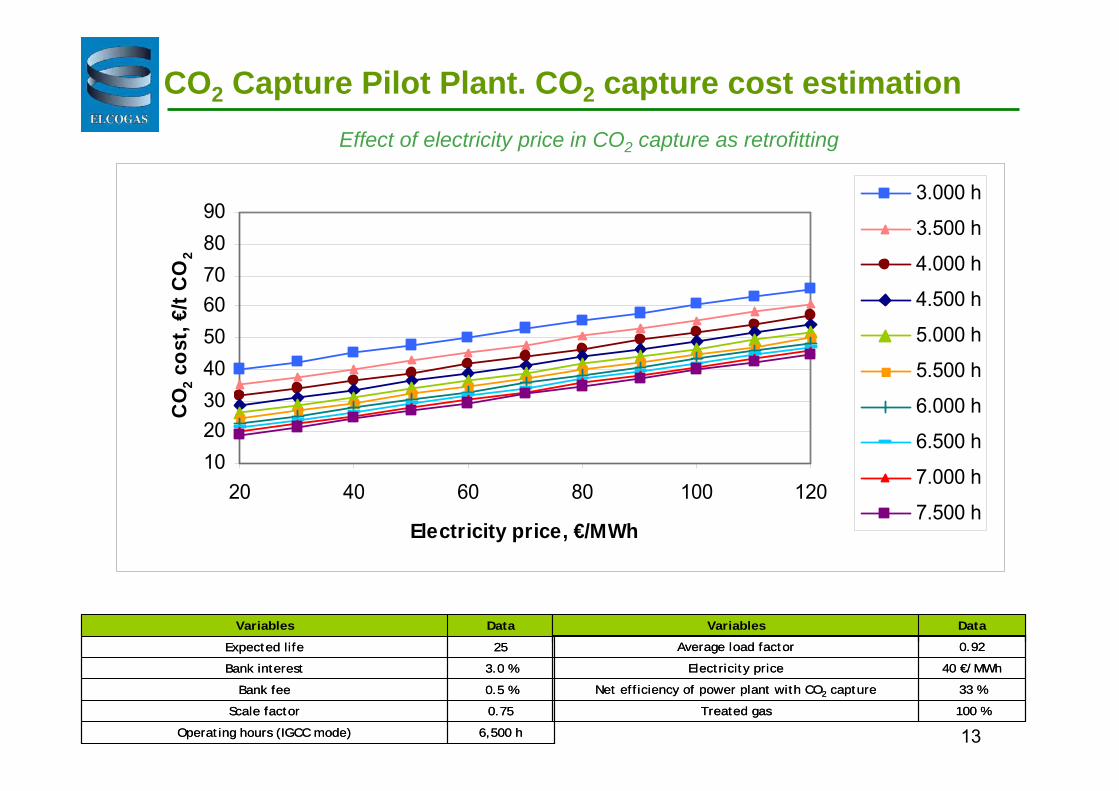
6,500 hOperating hours (IGCC mode)
0.75Scale factor
0.5 %Bank fee
3.0 %Bank interest
25 Expected life
Data Variables
6,500 hOperating hours (IGCC mode)
0.75Scale factor
0.5 %Bank fee
3.0 %Bank interest
25 Expected life
Data Variables Data Variables Data Variables
100 %Treated gas
33 %Net efficiency of power plant with CO2 capture
40 €/MWhElectricity price
0.92 Average load factor
100 %Treated gas
33 %Net efficiency of power plant with CO2 capture
40 €/MWhElectricity price
0.92 Average load factor
Effect of electricity price in CO2 capture as retrofitting
14
CO2 Capture Pilot Plant. CO2 capture cost estimation
GASIFICATIONFILTRATION
SYSTEMDESULFURATION
CO2 CAPTURE
GICCCOAL+COKE
Raw gas
Syngas
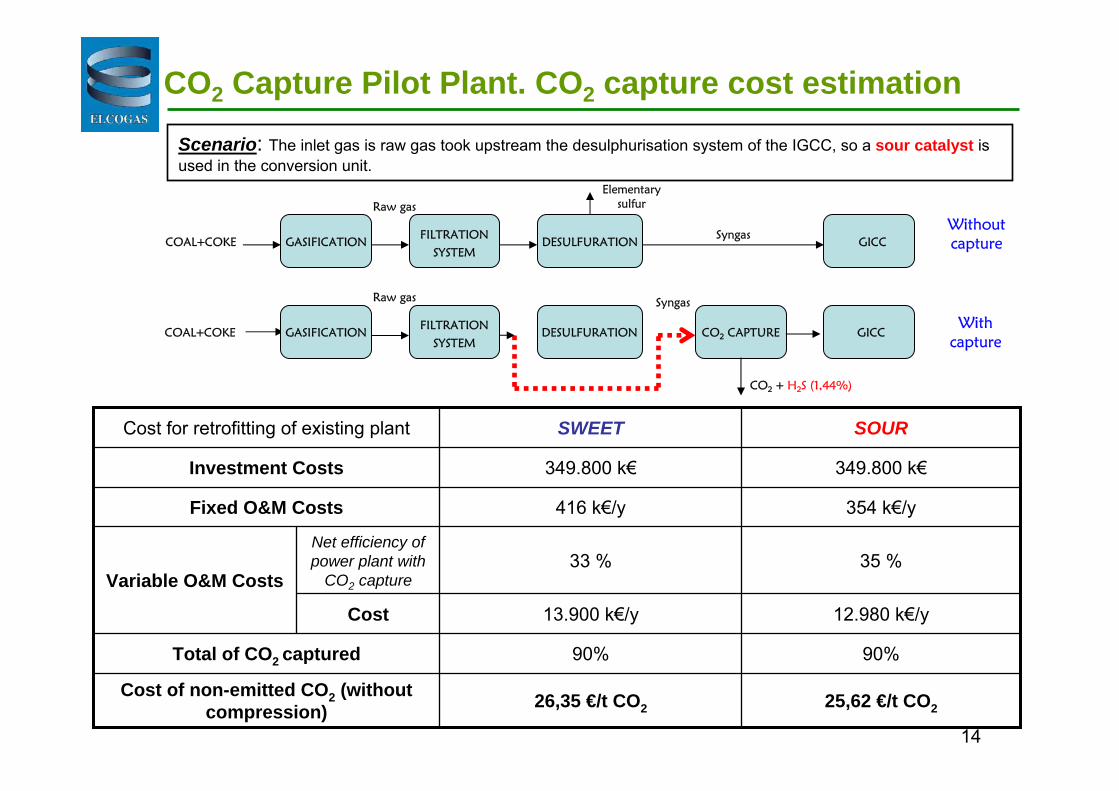
Scenario: The inlet gas is raw gas took upstream the desulphurisation system of the IGCC, so a sour catalyst isused in the conversion unit.
Cost
Net efficiency ofpower plant with
CO2 capture
12.980 k€/y13.900 k€/y
25,62 €/t CO226,35 €/t CO2Cost of non-emitted CO2 (without
compression)
90%90%Total of CO2 captured
35 %33 %Variable O&M Costs
354 k€/y416 k€/yFixed O&M Costs
349.800 k€349.800 k€Investment Costs
SOURSWEETCost for retrofitting of existing plant
Without capture
DESULFURATION GICCCOAL+COKE
Syngas
With capture
Elementary sulfur
CO2 + H2S (1,44%)
FILTRATION
SYSTEM
Raw gas
GASIFICATION
15
0
0,5
1
1,5
2
2,5
0 20 40 60 80
Electricity market price (€/MWh)
H2
mar
ket p
rice
unc
ompr
esse
d(€
/kg)
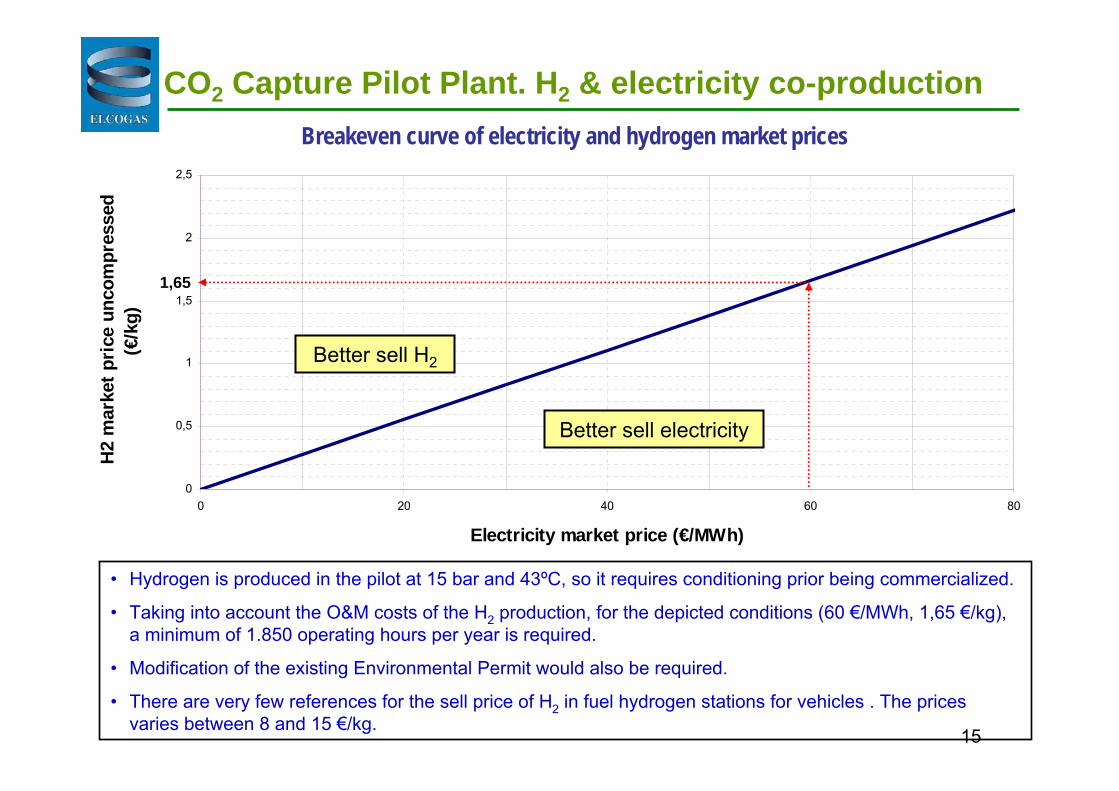
Breakeven curve of electricity and hydrogen market prices
1,65
CO2 Capture Pilot Plant. H2 & electricity co-production
• Hydrogen is produced in the pilot at 15 bar and 43ºC, so it requires conditioning prior being commercialized.
• Taking into account the O&M costs of the H2 production, for the depicted conditions (60 €/MWh, 1,65 €/kg), a minimum of 1.850 operating hours per year is required.
• Modification of the existing Environmental Permit would also be required.
• There are very few references for the sell price of H2 in fuel hydrogen stations for vehicles . The prices varies between 8 and 15 €/kg.
Better sell electricity
Better sell H2
16
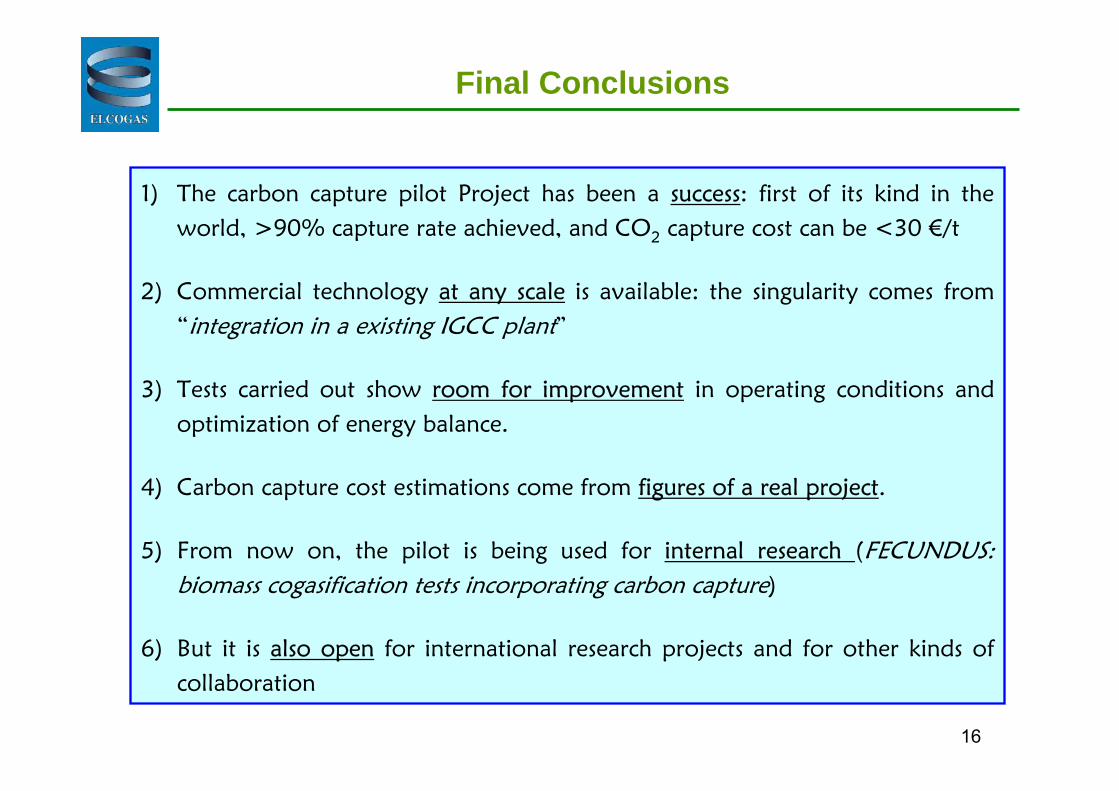
Final Conclusions
1) The carbon capture pilot Project has been a success: first of its kind in theworld, >90% capture rate achieved, and CO2 capture cost can be <30 €/t
2) Commercial technology at any scale is available: the singularity comes from“integration in a existing IGCC plant”
3) Tests carried out show room for improvement in operating conditions andoptimization of energy balance.
4) Carbon capture cost estimations come from figures of a real project.
5) From now on, the pilot is being used for internal research (FECUNDUS: biomass cogasification tests incorporating carbon capture)
6) But it is also open for international research projects and for other kinds ofcollaboration