18
Elderly Livings and Elderly Welfare Policy in Korea Chan Woo Kim, Ph.D. Catholic University of Korea 2015. 11. 6. The1st “North-East Asian Forum on Population Aging” in Tokyo

Elderly Livings and Elderly Welfare Policy in Korea
Chan Woo Kim, Ph.D.
Catholic University of Korea
2015. 11. 6.
The1st “North-East Asian Forum on Population Aging” in Tokyo

Contents
1. Current Demographic, Living and Socio-
Economic Status of Elders
2. Overview of Elderly Welfare Services
3. Expectations and Future Directions
I. Current Demographic, Living
and Economic Status of Elders
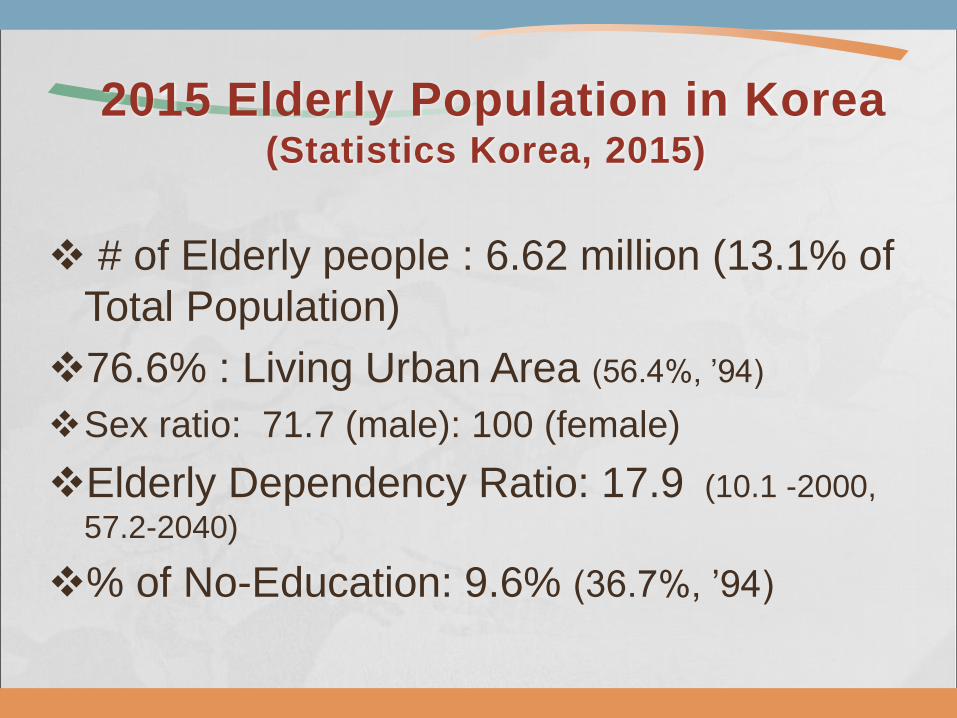
2015 Elderly Population in Korea (Statistics Korea, 2015)
# of Elderly people : 6.62 million (13.1% of
Total Population)
76.6% : Living Urban Area (56.4%, ’94)
Sex ratio: 71.7 (male): 100 (female)
Elderly Dependency Ratio: 17.9 (10.1 -2000,
57.2-2040)
% of No-Education: 9.6% (36.7%, ’94)

Rapid Aging Trends
Year to reach % of the proportion Years to change
7% 14% 20% 7→14% 14→20%
Japan 1970 1994 2006 24 12
France 1864 1979 2020 115 41
Germany 1932 1972 2012 40 40
UK 1929 1976 2021 47 45
Korea 2000 2018 2026 18 8

International Comparisons for 50 years (1960- 2009)

Demographic Structure(2011)
0
100,000
200,000
300,000
400,000
500,000
600,000
700,000
800,000
900,000
1,000,000
• Total pop. 48 million • Aging Pop. 11.3%
(Source Statistics Korea. 2011.5.30)
1955-1963 (1st baby boomer)
1968-1974 (2nd baby boomer)
1980-1984 (birth) (3rd baby boomer)

Living & Economic status (2014 National Elderly Survey: KIHASA)
% of Living Alone + Couple only Elders/ Total
Elders
25.2% (1994) → 44.9% (1998)→67.5% (2014)
Ave. Yearly Income : 23.5 million Won (20,000 $)
% of Public Pension : 39.6% (16.1%, ’05)
Very Low actual amount ( ’08 : 20yr –contribution)
Elderly Suicide (1st of OECD) 55.5 /100, 000
Male : 2.7 times higher than female

Increasing Medical Care Cost
(Source: Statistics Korea. 2011)
<% of Reimbursed pay for elderly care from NHI and Monthly Medical care cost per one elder >
Ⅱ. Overview of Welfare
Elderly Services
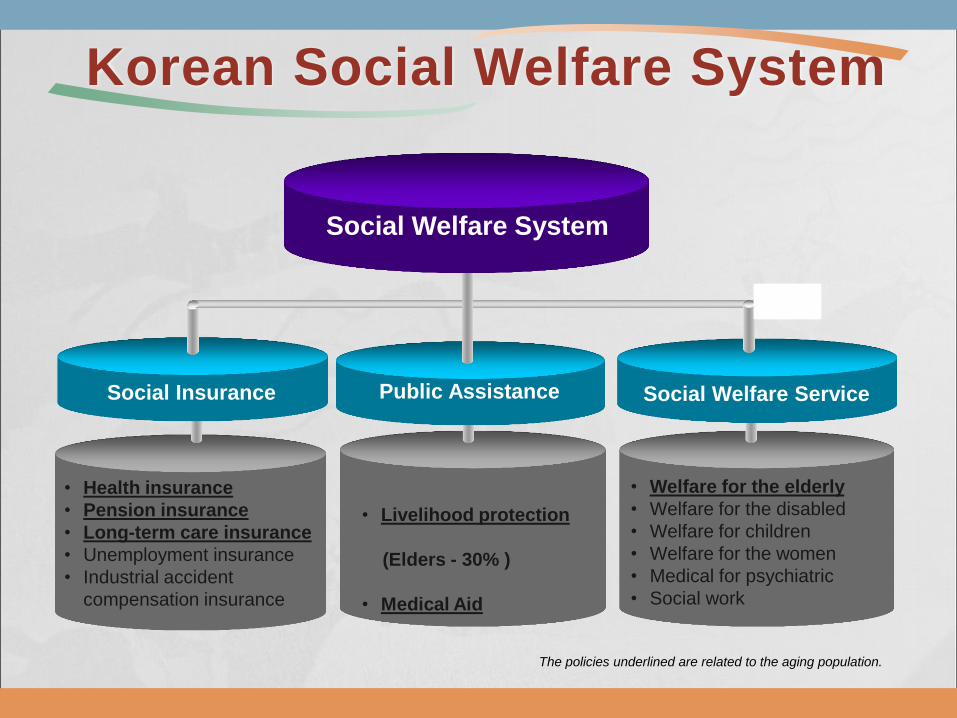
Korean Social Welfare System
• Health insurance
• Pension insurance
• Long-term care insurance
• Unemployment insurance
• Industrial accident
compensation insurance
• Livelihood protection
(Elders - 30% )
• Medical Aid
• Welfare for the elderly
• Welfare for the disabled
• Welfare for children
• Welfare for the women
• Medical for psychiatric
• Social work
Social Welfare Service Social Insurance Public Assistance
Social Welfare System
The policies underlined are related to the aging population.

Elderly Welfare Policies in Korea
Funding Resource Governing
Organizations Social Insurance (for all)
Tax-based Services (Mostly for mid- or low-
income)
Health & Long-
term Care
•National Health Insurance
•National Long-term Care
Insurance for elders
•Center for the dementia
•Service for early detection of
dementia
•Support for treatment for the
dementia
•Support for the old-age-
related optical surgery
•MHW (Ministry of
Health and Welfare)
•National Health
Insurance
Corporation (NHIC)
•Local government
Income
Maintenance
•National Pension service •Service for Job-seeking
elders
•MHW
•National Pension
Corporation
•Local government
Housing •Living facility •Local government
Social Services •Care services for elders
•Elderly Welfare center
•Meal service
•Senior discounts etc.
•MHW
•Local government
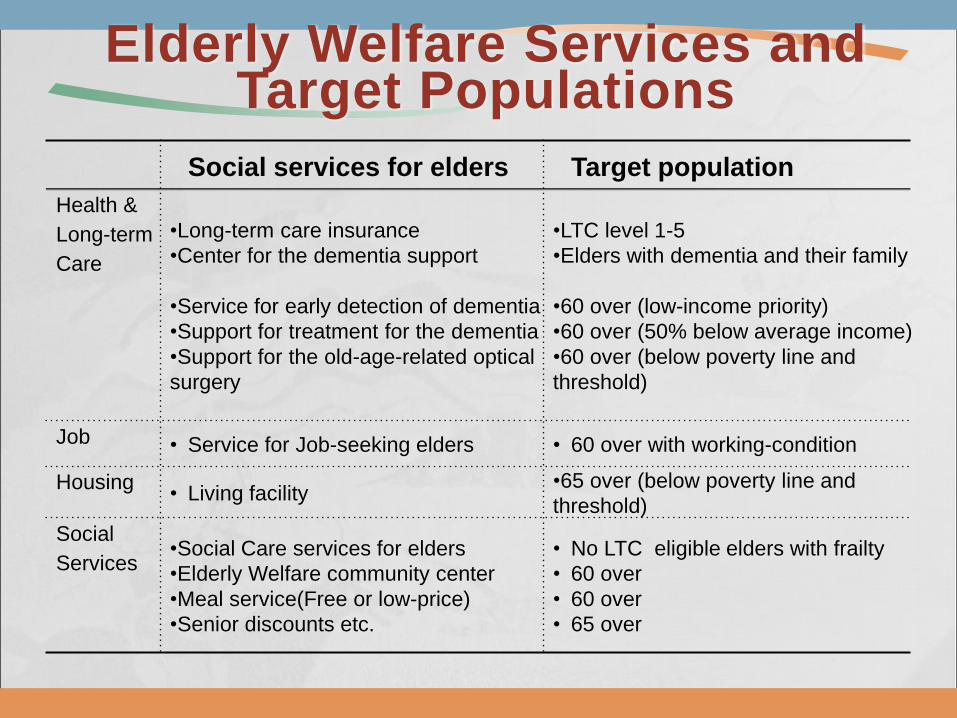
Elderly Welfare Services and Target Populations
Social services for elders Target population
Health &
Long-term
Care
•Long-term care insurance
•Center for the dementia support
•Service for early detection of dementia
•Support for treatment for the dementia
•Support for the old-age-related optical
surgery
•LTC level 1-5
•Elders with dementia and their family
•60 over (low-income priority)
•60 over (50% below average income)
•60 over (below poverty line and
threshold)
Job • Service for Job-seeking elders • 60 over with working-condition
Housing • Living facility
•65 over (below poverty line and
threshold)
Social
Services •Social Care services for elders
•Elderly Welfare community center
•Meal service(Free or low-price)
•Senior discounts etc.
• No LTC eligible elders with frailty
• 60 over
• 60 over
• 65 over
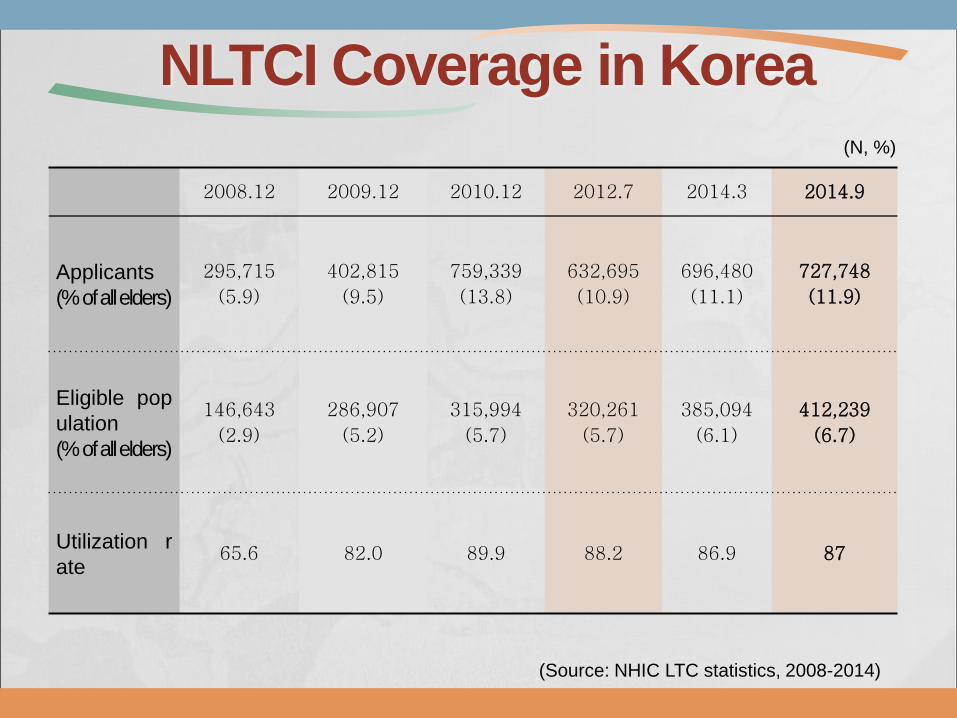
NLTCI Coverage in Korea
2008.12 2009.12 2010.12 2012.7 2014.3 2014.9
Applicants
(% of all elders)
295,715
(5.9)
402,815
(9.5)
759,339
(13.8)
632,695
(10.9)
696,480
(11.1)
727,748
(11.9)
Eligible pop
ulation
(% of all elders)
146,643
(2.9)
286,907
(5.2)
315,994
(5.7)
320,261
(5.7)
385,094
(6.1)
412,239
(6.7)
Utilization r
ate 65.6 82.0 89.9 88.2 86.9 87
(N, %)
(Source: NHIC LTC statistics, 2008-2014)
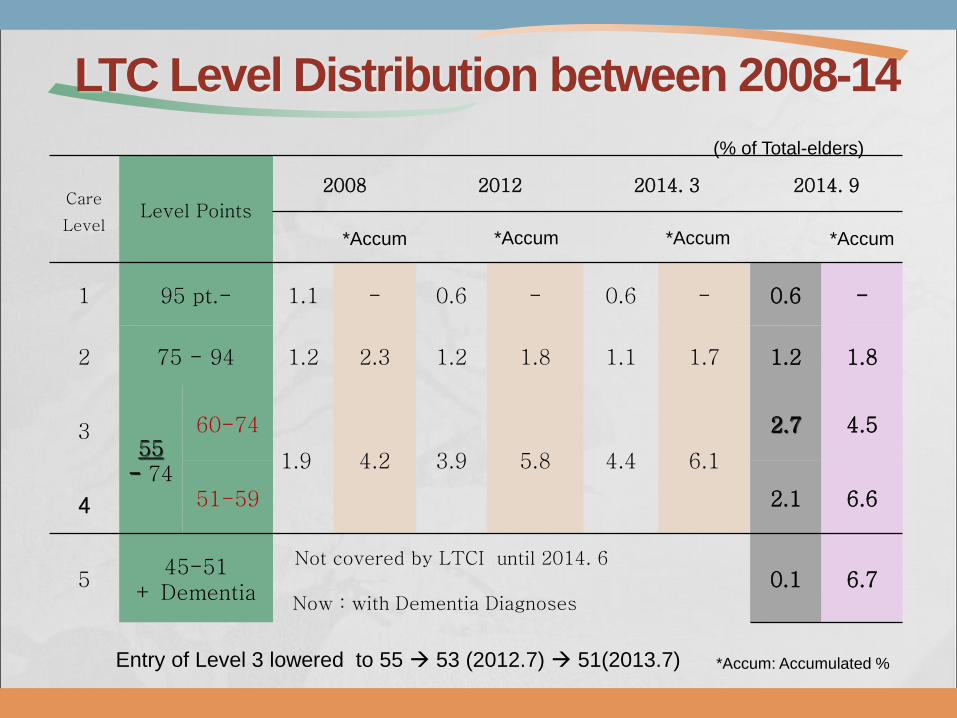
LTC Level Distribution between 2008-14
Care
Level Level Points
2008 2012 2014. 3 2014. 9
*Accum *Accum *Accum *Accum
1 95 pt.- 1.1 - 0.6 - 0.6 - 0.6 -
2 75 - 94 1.2 2.3 1.2 1.8 1.1 1.7 1.2 1.8
3 55
- 74
60-74 1.9
4.2 3.9 5.8 4.4 6.1
2.7 4.5
51-59 2.1 6.6 4
5 45-51
+ Dementia
Not covered by LTCI until 2014. 6 Now : with Dementia Diagnoses
0.1 6.7
*Accum: Accumulated %
(% of Total-elders)
Entry of Level 3 lowered to 55 53 (2012.7) 51(2013.7)

III-1. Social and Economic Expectations
• Enhancing QOL in elders’ later life
• Reducing caregiving burden: Economic and psychological burden
• Support for Women Workforce Attendance
• Social Service Job Opportunity: 2012 – 4,400 LTC nursing homes, 11,000 community care center & 200,000 nursing aides working
• Elderly care industry: Care devices, interior, architecture etc.
• Efficiency of Health care cost: Acute care beds → Convalescent(preparing) → Nursing home

III-2. Future Direction of Elderly Welfare
Coordination between medical field and social care field
Housing issues for elders
Increase of in-home care services instead of institutionalized care: Variation of Community care service
Encouraging Social Involvement and Maintaining social links
Coordination btw Central and Local Gov.
Financial sustainability and Political Power

Thank You.


