+ All Categories
Home > Documents > Election Laws, Mobilization, and Turnoutfaculty.wcas.northwestern.edu/~jnd260/cab/CAB2010 -...

Election Laws, Mobilization, and Turnoutfaculty.wcas.northwestern.edu/~jnd260/cab/CAB2010 -...

Date post: 19-May-2018
Category:
Upload: hanhu
View: 214 times
Download: 0 times
Share this document with a friend
43
Election Laws, Mobilization, and Turnout Barry C. Burden David T. Canon Kenneth R. Mayer Donald P. Moynihan University of Wisconsin-Madison May 5, 2010 This paper was prepared for presentation at the 2010 Chicago Area Behavior Workshop. Previous versions were presented the 2008 U.S. presidential election conference at Ohio State University and the 2009 meeting of the American Political Science Association. The larger project to which this paper is connected is supported with funding from the Wisconsin Government Accountability Board and the Pew Charitable Trusts. These organizations bear no responsibility for the findings or interpretations reported in this paper. We thank Leticia Bode, Hannah Goble, Matt Holleque, Jacob Neiheisel, David Nelson, Sarah Niebler and especially Stéphane Lavertu for research assistance. John Aldrich, Gary King, Michael Hanmer, Benjamin Highton, and Michael McDonald provided helpful comments, as did participants in the American Politics Workshop and La Follette School of Public Affairs seminar series at the University of Wisconsin.
Transcript

Election Laws, Mobilization, and Turnout

Barry C. Burden

David T. Canon

Kenneth R. Mayer

Donald P. Moynihan

University of Wisconsin-Madison

May 5, 2010

This paper was prepared for presentation at the 2010 Chicago Area Behavior Workshop.

Previous versions were presented the 2008 U.S. presidential election conference at Ohio State

University and the 2009 meeting of the American Political Science Association. The larger

project to which this paper is connected is supported with funding from the Wisconsin

Government Accountability Board and the Pew Charitable Trusts. These organizations bear no

responsibility for the findings or interpretations reported in this paper. We thank Leticia Bode,

Hannah Goble, Matt Holleque, Jacob Neiheisel, David Nelson, Sarah Niebler and especially

Stéphane Lavertu for research assistance. John Aldrich, Gary King, Michael Hanmer, Benjamin

Highton, and Michael McDonald provided helpful comments, as did participants in the American

Politics Workshop and La Follette School of Public Affairs seminar series at the University of

Wisconsin.

1

Advocates, journalists, and politicians frequently advocate changes to election laws out

of the belief that making voting easier will increase turnout. Deductively, it stands to reason that

making voting more convenient – through relaxed registration rules, registration on election day

itself, voting prior to election day, or expanded absentee voting – will encourage more voters to

cast ballots. We challenge this conventional wisdom, and show that the most popular reform –

early voting – actually decreases turnout, a conclusion that has significant consequences for

policy. Early voting depresses turnout by diffusing attention to the election and reducing the

importance of election-day mobilization.

We argue that voting rules affect not only individual voters, but also change the nature of

mobilization in those voters’ electoral environments. It may seem obvious that campaigns adapt

to different voting rules by altering their strategies and mobilization tactics, but much of the

existing voting literature fails to account for such interactions. Moreover, early voting also

changes nonstrategic mobilization by family, friends, and the media in important ways.

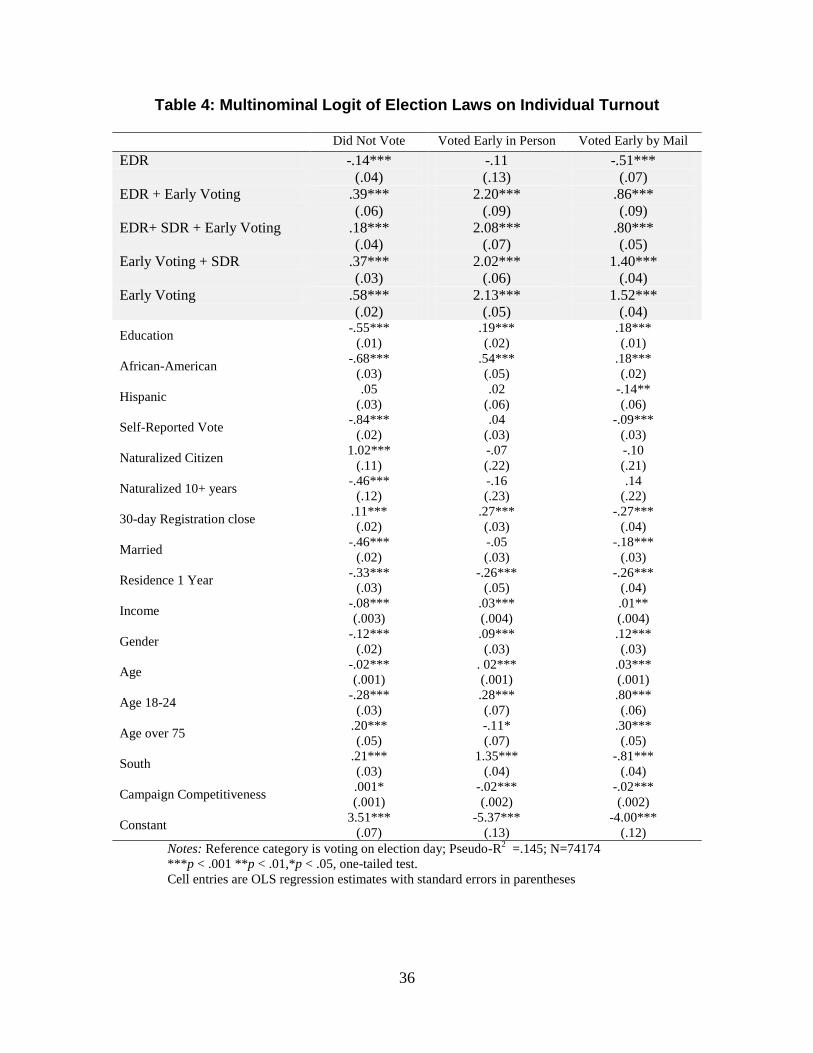
We conclude that early voting appeals most to those who are already most likely to vote.

Our empirical results show that early voters are more highly educated and wealthier than those

who cast their ballot on election day (though in 2008, African Americans were significantly

more likely to vote early). This conclusion is based on both aggregate data, using county level

election returns from the 2008 presidential election, and individual-level analysis of the

November 2008 Current Population Survey. Several methodological checks verify that these

results are robust.

A key methodological innovation is that we estimate the effects of different voting rules,

both in isolation from, and in interaction with, each other. The reforms we analyze – election

day registration (EDR), early voting, and same day registration (SDR) – appear by themselves

2

and in different combinations, each of which may have a different effect on turnout. The

existing literature on early voting draws careful distinctions between the different types of early

voting systems, such as mail-in absentee or in-person absentee. These differences matter. But at

the same time, scholars have paid less attention to whether early voting systems also include

SDR or EDR, differences which also matter. Early voting has far less effect if voters still have to

register 30 days before election day; the convenience of additional voting opportunities is

irrelevant to someone ineligible to vote because of a missed deadline.

We are particularly interested in the synergistic effects of early voting EDR. The 2008

election marked the first time that this combination was available in enough states to permit an

accurate estimation of its effect on turnout. We find that the turnout-increasing effect of election

day registration offsets the depressive effects of early voting.

The remainder of the paper unfolds as follows. We begin by providing a picture of prior

research on state election laws and turnout. We argue that, much like interactions among drugs

given to a patient, that distinct combinations of EDR, SDR, and early voting need to be

considered, as otherwise we risk conflating the effects of the different practices. We address this

problem by classifying all of the potential permutations, and estimating separate effects for each.

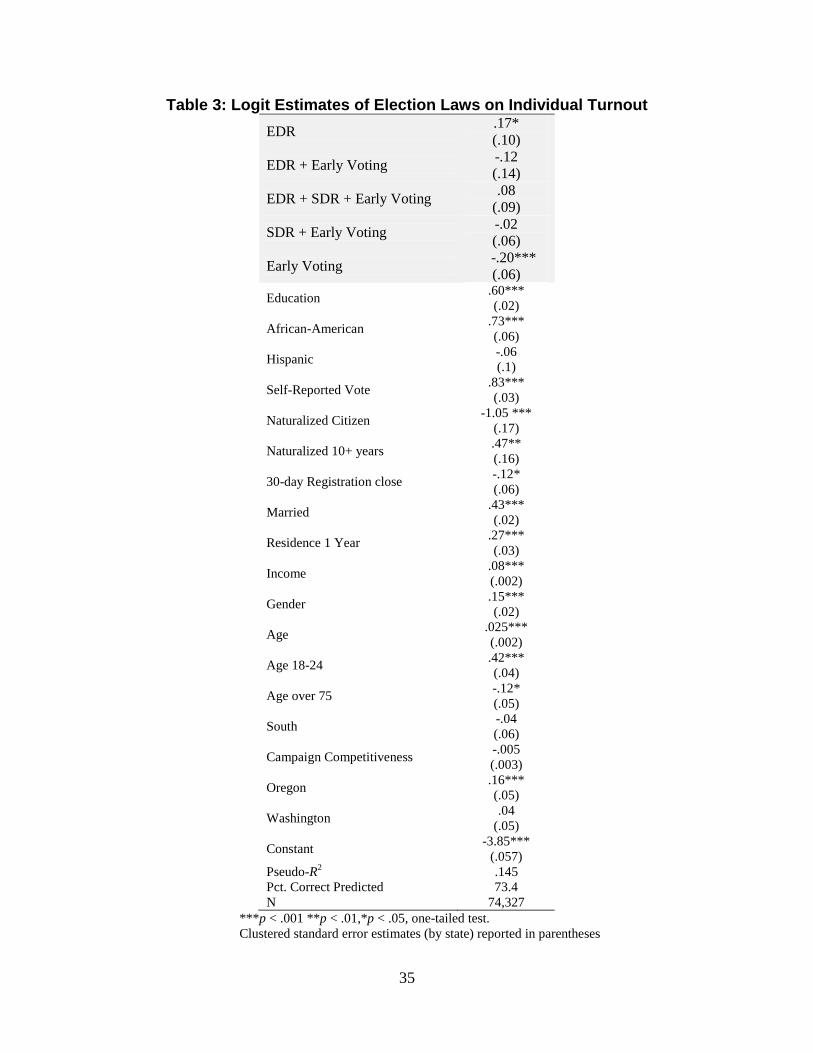
We contend that while EDR should increase turnout, early voting by itself should not. We test

this hypotheses by examining the impact of different voting rules on aggregate turnout levels and

the individual probability of voting.

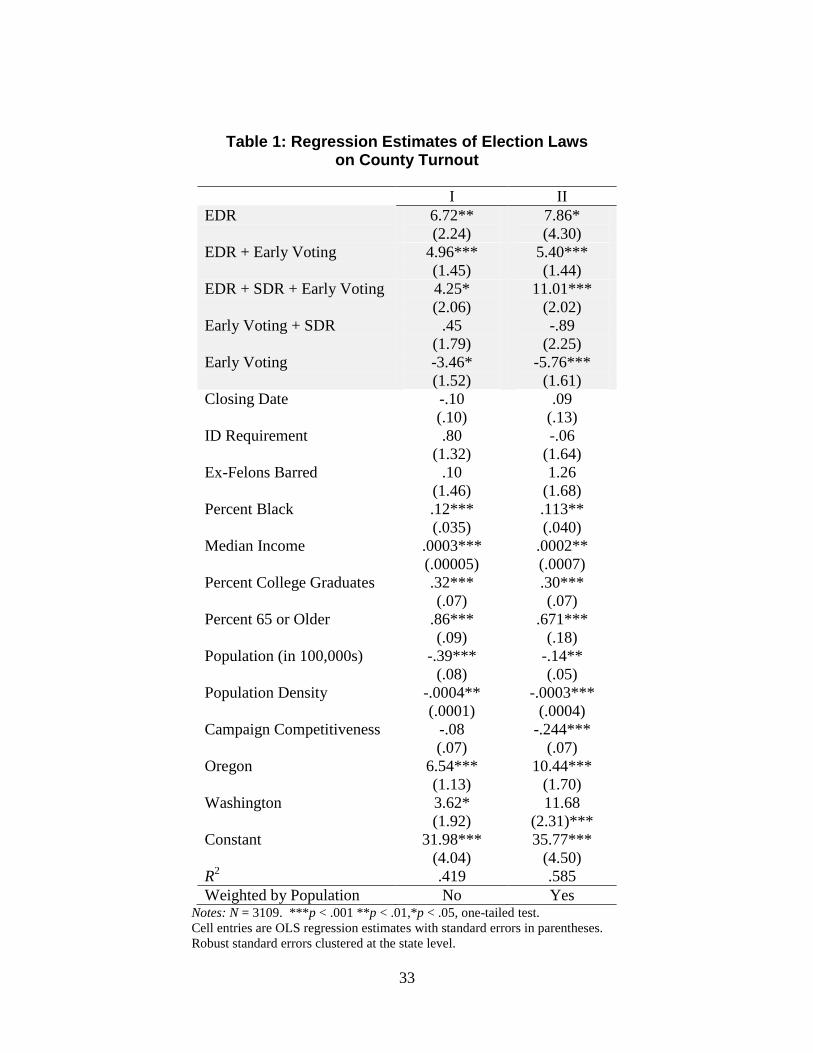
We demonstrate that packages of laws that include EDR generally increase turnout, but

that early voting options by themselves decrease turnout. We conclude by discussing the broader

implications of this research for future innovations and reforms in election administration.

3

Previous Research

Reorganizing the voting process to foster turnout has long been an interest in both the

academic and policymaking communities.1 Until recently, these efforts were focused almost

exclusively on reducing the legal costs of voting, by making registration easier and voting more

convenient. The most common reforms are election day registration, same day registration, and

especially early voting. Here we set out the state of research on these practices, and note some

problems in the literature.

Election day registration (EDR) permits eligible voters both to register and to vote on

election day. In theory, this increases turnout by eliminating the need for individuals to take two

separate actions – registering days or weeks prior to voting, and then casting the ballot at a later

date – to exercise their franchise. It also creates opportunities for voters who become interested

late in the election cycle, eliminating the problems posed by early registration closing dates.

The effects have long been recognized. Thirty years ago, Wolfinger and Rosenstone (1980, 61)

summarized the effects: “[r]egistration is usually more difficult than voting, often involving

more obscure information and a longer journey at a less convenient time, to complete a more

complicated procedure. Moreover, it must usually be done before interest in the campaign has

reached its peak.” EDR lowers the cost of voting by combining the separate steps of registering

and voting into “one essentially continuous act” (Wolfinger, Highton, and Mullin 2005, 3), and

permits voters to register at the last moment when interest is highest.2

A long stream of research has confirmed the effects of EDR. The registration closing

date is the most consequential aspect of registration, in part because it disenfranchises recent

1 Lipjhart (1997) also suggested proportional representation, and even compulsory voting, as

mechanisms for raising turnout. 2 The EDR reform spread in several waves. See Hanmer’s (2009) comprehensive analysis of

EDR for a review of the history and reasons for adoption.

4

movers and requires voters to take initial action as much as a month before election day (Squire,

Wolfinger, and Glass 1987; Timpone 1998; Highton 2004; Hershey 2009). Minnesota,

Wisconsin, and Maine, the first states to implement election day registration, consistently lead

the nation in voter participation. A sizeable number of voters take advantage of EDR when it is

available: in 2008, 15.6% of voters in Minnesota, 16.5% in Wyoming, 13.5 % in Idaho, and

11.4% in Wisconsin registered to vote on election day (EAC 2009, Table 5). Estimates of the

overall turnout effects of EDR range from three to seven percentage points (Brians and Grofman

2001; Fenster 1994; Hanmer 2009; Knack 2001). Highton (2009, 509) summarizes the impact

of EDR on voter turnout as “about five percentage points.”3

A second innovation is permitting voting outside of the normal election day process.

Although the policies take different forms, they all share the defining feature of eliminating the

need to appear at the local polling place on election day to cast a ballot. These practices include

absentee voting in its various guises, voting-by-mail, and in-person early voting (Fortier 2006;

Gronke et al. 2008).4 There is additional variation in where people vote: in-person early voting

may take place either at central election offices or at dispersed voting centers in locations such as

shopping malls or libraries.

Of these practices, early voting was the most touted reform in recent elections. Voting

scholar John Fortier pointed to the practice as evidence that “United States is in the midst of a

3 Throughout, we express turnout as a percentage of the voting age population.

4 Absentee voting can impose different requirements. In some states, voters must provide a

justification before receiving absentee ballots, with wide variation in the stringency of the

justifications. Minnesota, for example, issues an absentee ballot only when a voter is ill, away

from home on election day, or serving as an election official; when voting is impossible for

religious reasons; or because of a declared emergency. “No excuse” absentee frees voters from

the need to provide a reason for voting absentee. Permanent absentee voting allows voters to

request absentee ballots for all elections; the ballot is automatically sent. For a review of these

practices see Gronke et al. (2008).

5

revolution in voting” (2006, 1). We consider early voting to exist in states in which registrants

can cast ballots without excuse before election day. Early voting has more than quadrupled since

the early 1990s, increasing from 7% of all votes in 1992, to 20% in 2004, and 30% in 2008. In

2008, 21 states allowed early voting, either by mail or in person.5

In contrast to the positive findings about EDR, emerging studies of early voting have

found that it has little impact on voter turnout. Gronke et al. (2007), for example, concluded that

early voting had no effect on turnout in national elections between 1980 and 2004; aside from the

special case of voting by mail in presidential elections, none of the early or absentee voting laws

they study affected turnout in either presidential or midterm elections.6 Other studies have

shown that none of the forms of early voting, other than Oregon’s unique vote-by-mail system,

improves turnout (Fitzgerald 2005; Giammo and Brox Forthcoming; Gronke et al. 2008; Oliver

1996; Primo, Jacobsmeier, and Milyo 2007; Scheele et al. 2008; cf. Wolfinger, Highton, and

Mullin 2005).7

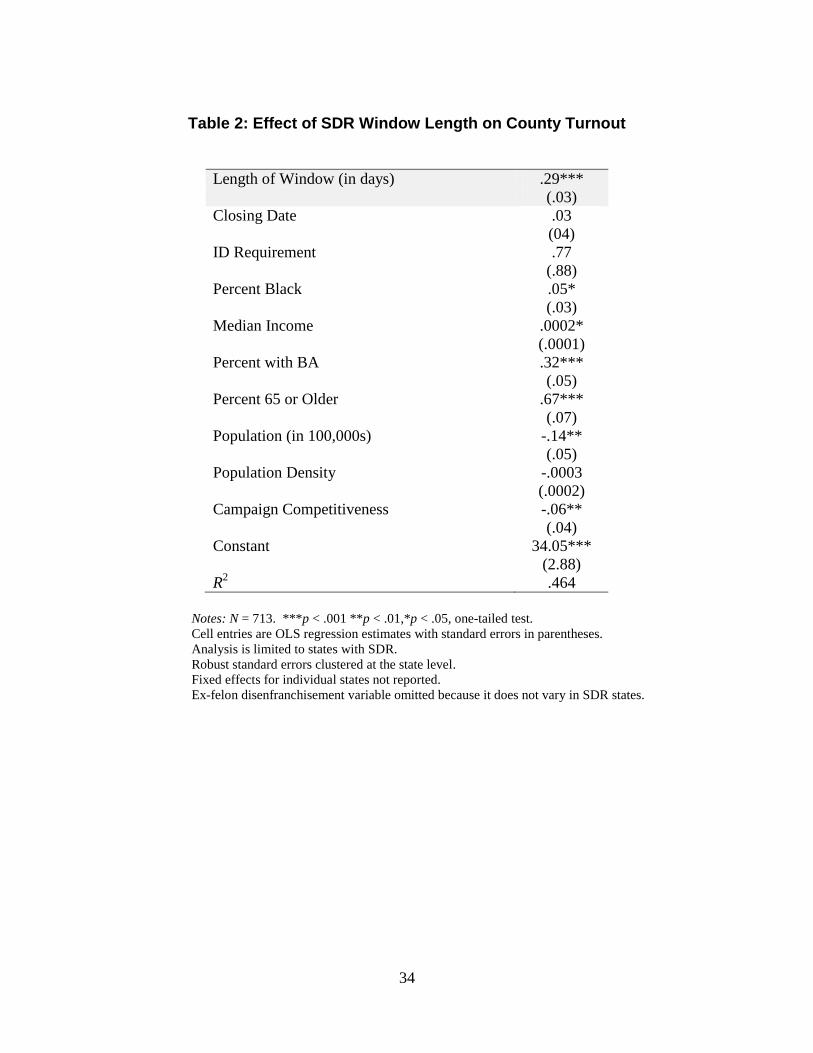
We argue that the existing literature on early voting has missed a crucial aspect of the

process, which is whether early voting is combined with same day registration (SDR) or election

day registration. SDR permits people to both register and vote in a single act prior to election

day. It reduces the potential inconvenience of having to vote on a specific election day,

eliminates the registration closing date, and permits “one-stop shopping.” Seventeen states had

5 Michael MacDonald, “(Nearly) Final 2008 Early Voting Statistics,” updated January 11, 2009,

<http://elections.gmu.edu/Early_Voting_2008_Final.html>. Also see Paul Gronke’s Early

Voting Information Center at <http://www.earlyvoting.net/blog/>. 6 Previous research also shows a positive effect of vote-by-mail (Magleby, 1987; Southwell and

Burchett, 2000; Karp and Banducci, 2000), but these studies have largely been confined to

Oregon and Washington. Kousser and Mullin (2007) estimate that a shift to vote-by-mail in

California would result in a three-point drop in turnout. We do not study vote-by-mail directly

but effectively account for it with state fixed effects. 7 Stein and Vonnahme (2008) find a small positive effect of non-precinct voting centers on

turnout among younger, infrequent voters and those who have not yet developed the voting habit.

6

early voting and SDR in 2008. And yet, despite its widespread use, we know of no studies that

have analyzed SDR’s direct effects on turnout.

Election Laws as Turnout Mechanisms

All three of the reforms we consider here – early voting, same day registration, and

election day registration – are designed to increase turnout by lowering the direct legal costs of

voting. But this simple logic belies the fact that the mechanisms connecting each reform to

turnout are quite different. EDR lowers costs by providing one-stop shopping on election day,

eliminating a bureaucratic step in the voting process and providing voting opportunities to

individuals who become interested late in the campaign. Early voting, in contrast, lowers costs

by offering convenience, allowing voting over an extended period rather than making the

election a one-day event. SDR essentially combines these two effects by permitting one-stop

shopping to occur before election day.

Any discussion of turnout must focus on the direct legal costs of voting, even though an

overemphasis on these costs may miss the importance of indirect extralegal costs that are

reduced by mobilization efforts that encourage potential voters to become actual voters. It is

easiest for policymakers to see how an election law shapes direct legal costs. But social

scientists also understand that election laws may indirectly affect the degree of mobilization, and

thus the overall costs of voting. The net costs and not simply the legal barriers should be our

focus.

We expect EDR to be a particularly effective mechanism for raising turnout, because it

permits those who come late to the campaign to still become participants. Just as important, it

does so without robbing election day of its stimulating effects. Early voting also lowers direct

costs, but by focusing interest on the opening of the early voting period and spreading out

7

electoral activities over an extended time period, it simultaneously saps the mobilizing energy of

election day. The effects of SDR and “one-stop shopping” will depend on the length and timing

of the early voting window, and should be most apparent for voters who are on the turnout

bubble, neither highly likely to vote or sit out (Highton 2004). Citizens who are almost certain to

cast a ballot will not be affected by marginal changes in the rules; they will vote no matter what.

The same can apply to those who are extremely low likelihood voters; these citizens may simply

be beyond the reach of any voting reforms. For voters close to the 50-50 threshold, it is

axiomatic that small changes have the highest likelihood of turning nonvoters into voters, or vice

versa (Hanmer 2009). Although this point may be obvious, the implications are less so.

Through this lens, we can distinguish between voting reforms that actually bring in new voters,

and which therefore can increase turnout, and those reforms that simply provide new

opportunities for voters who would cast a ballot under any set of rules.

To use Berinsky’s (2005) classification, reforms can either stimulate new voters, or retain

existing voters. Most reforms, in his view, are better at the latter. Our explanation for the

expected depressive effect of early voting is that it robs election day of the stimulating effect it

would otherwise have on nonvoters. Early voting siphons away and thus dilutes the concentrated

activities of election day itself that would likely stimulate turnout. This stimulation is provided

strategically by campaigns that engage in a media blitz as election day approaches. But

stimulation also arrives nonstrategically from the local media who cover election day, from

family and acquaintances who are discussing the election, and the visibility of polling places and

other election day activities. Our theoretical view thus conceives of mobilization more broadly

than simple contacting by campaign elites (Rosenstone and Hansen 1993). Several scholars have

suggested as much when he speculates that a loss of the “civic day of election” could lower

8

turnout by lowering social capital (Fourtier 2006; Kropf, Swindell, and Wemlinger 2009;

Thompson 2004). At least one empirical study shows that election day social activities increase

turnout (Addonizio, Green, and Glaser 2007). Traditional election day is as much a social event

as a political one. For at least some voters, it is the stimulation of the day’s news, observation of

activities as polling places, and conversations with friends and neighbors that gets them to the

polls. When these activities are suppressed or diluted, so is the stimulating effect.

We refine this argument by identifying the key differences between EDR and early

voting. In particular, we expect early voting to enhance retention, and EDR to enhance

stimulation. Early voting should have a minimal effect on turnout, because it is mostly a

convenience for those who were already planning to vote, not a method of bringing nonvoters

into the booth. The registration statistics bear this out: in the states that had early voting and

SDR in 2008, 3.6 million same day registration applications were filed; of those, only 963,144

(or about 27%) were new voters added to the registration rolls for the first time.8

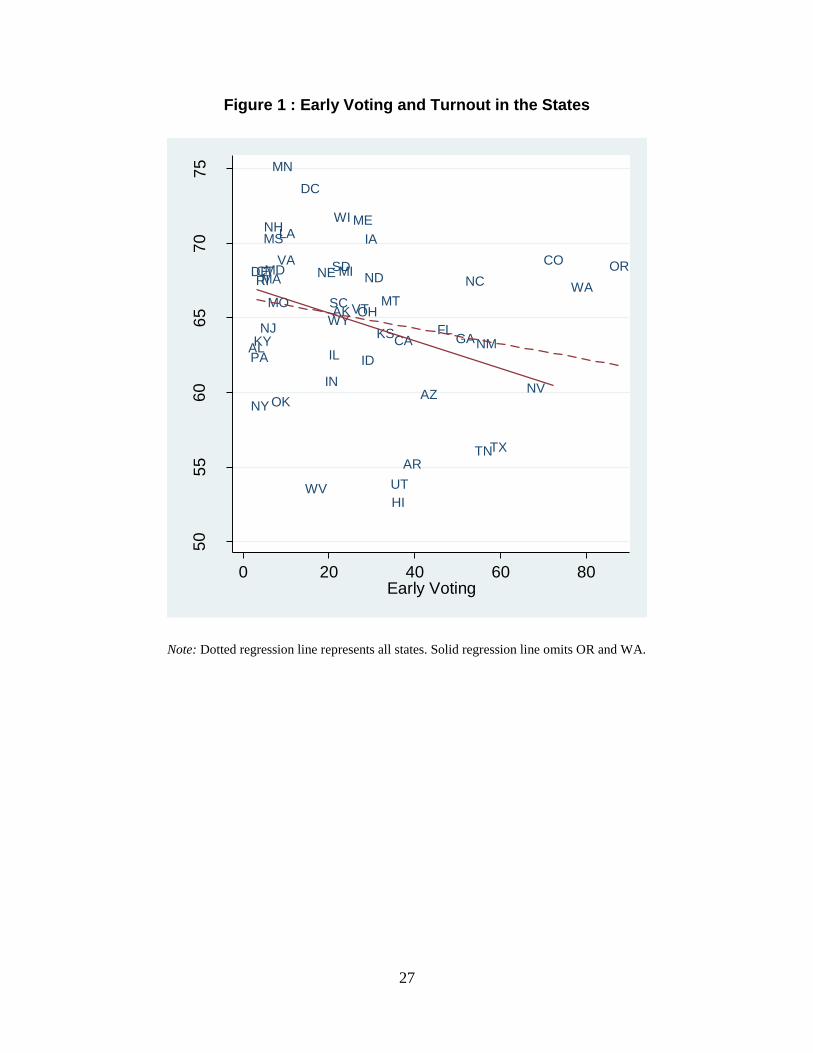
In fact, a few studies have found tentative and conflicting evidence that early voting may

actually lower turnout.9 This certainly runs counter to the conventional wisdom, as it is hard to

see how making voting more convenient will result in fewer voters, although we conclude that

this is precisely what happens. As initial evidence we present Figure 1, which plots overall voter

turnout by the percentage of votes cast through early voting, using data from the Current

Population Survey. The relationship is clear: higher early voting rates are clearly associated with

lower overall turnout. The solid line is the bivariate regression line; the dotted line is the

8 The EAC collected data on SDRs for the first time in 2008; the EAC defines SDR as

“registering to vote on the same day in which a vote may be cast” (EAC 2009). 9 Smith and Comer (2005) find negative effects, but others (Gronke et al. 2008; Leighley and

Nagler 2009; Tolbert et al. 2008) find negative effects only in particular specifications.

9

regression line after omitting Washington and Oregon from the data (these states have unusual

mail-in-balloting rules not analogous to those in any other states).

Insert Figure 1 here

A bivariate analysis, of course, does not capture the complexity of the overall

relationship, and there are obviously intervening control variables that have to be taken into

account. The clarity of the relationship, though, is certainly a hint of a counterintuitive

underlying process. Before turning to multivariate analysis, we must first address concerns

about the endogeneity of election laws.

Exogeneity of Voting Systems in Observational Research

We wish to estimate the effects of various election laws on voter turnout. A cross-

sectional analysis assumes that laws are exogenous. Focusing on EDR, Hanmer (2009) has

challenged the foundations of observational research into turnout effects, arguing that the most

commonly used research methods are inappropriate and yield biased results. The problem, as he

describes it, is that we cannot directly observe the quantity we are most interested in. In voting

studies, we can observe the probability of a specific individual voting under one set of

registration rules, such as early voting (as might exist in a particular state). We can observe the

probability of another specific individual voting under a different set of rules (no early voting).

What we cannot observe is how an individual’s behavior changes if the voting rules that she

faces changed from no early voting to early voting (or vice versa). Instead, we draw an inference

about the impact that early voting has on an individual’s likelihood of voting, based on the

behavior in early voting and non-early voting states. Conceptually, early voting is a “treatment”

that is applied to some voters and not to others.

10

But since we cannot observe the treatment effect directly, we must make assumptions

about the underlying data. Most importantly, we assume that the treatment – the particular

package of voting rules in effect in a state – is exogenous in our models of voting. We assume

that EDR, or the lack of it, is the cause of higher turnout levels, not the other way around.

It is possible, though, that the relationship runs in the other direction, and that the reason

a state has EDR is because it has high turnout. Legislators might want to make sure that turnout

stayed high, and enacted EDR out of a desire to make voting even more convenient. In this

case, we could say that it was high turnout that caused the enactment of EDR. More commonly,

there might be some unobserved variables that are related to both turnout and the choice of

voting rules. Perhaps a state has a culture of broad participation and civic engagement, along

with high levels of social capital, that produces high turnout and creates support for relaxed

voting rules that place a premium on convenience and involvement. In this state, the

implementation of EDR is itself a dependent variable, caused by the same variables that produce

high turnout. Erikson and Minnite make this argument about voter identification laws (2009,

87). If voting rules are not exogenous, then our estimates of the effects of the voting rules on

turnout will be biased and inconsistent (see King, Keohane and Verba 1994, 185-196).

Hanmer and others are surely right to urge scholars to pay close attention to the

assumptions that we are making when choosing methods and estimators. But we think he

overstates the problem, for several reasons. First, the universe of states that have adopted

different systems is now large and diverse, making it more difficult to make sweeping statements

about why states adopted reform. Hanmer cites the example of a high-turnout state being likely

to enact reforms that stimulate high turnout, and states with a history of discouraging

participation as less likely to adopt reforms that encourage high turnout.

11

But in the case of early voting, the states that have it are so diverse that it is unlikely that

we think it reasonable to assume that the practice is exogenous, or at least not due to some

unobserved variables that correlate with turnout. We find early voting in the South (Georgia,

Louisiana, Tennessee, Texas, Florida, North Carolina), the Northeast (Maine, Vermont, New

Jersey), the Midwest (Iowa, Wisconsin, Illinois, Indiana, Ohio,) the Southwest (Arizona, New

Mexico, Colorado, Nevada), and the Far West (California, Hawaii). Early voting exists in states

that have traditionally high turnout (Wisconsin, Alaska, Maine) and in states with traditionally

low turnout (Nevada, Arizona, Georgia). Some states with traditionally high turnout levels do

not have early voting (Minnesota, Connecticut, New Hampshire).

To see if there might be some underlying or unobserved variables that might be driving a

state’s selection of voting rules, we used an index of policy liberalism developed by Erikson,

Wright, and McIver (1993, 77) as a proxy measure of state political culture. This index, which is

based on a range of state policies, from tax structure to ratification of the Equal Rights

Amendment, is highly correlated with turnout (r = 0.59 for the 2000 election, r = 0.29 for the

1996 election). Since the index is based on state policies in the 1980s, it predates many states’

move to early voting. If the index were related to early voting, it would be strong evidence of

the endogeneity of voting systems. But there is no relationship at all between political culture

and early voting. Among states with early voting, the mean composite policy liberalism index is

-0.05, (s.d.= 0.85). Among states with no early voting in 2008, the index is 0.07 (s.d.=1.20).

So we can reject – decisively – the notion that a state’s decision to enact early voting is related to

some underlying political disposition.

Second, in the instances where scholars have analyzed the effect of voting rules with

methods that make weaker assumptions about exogeneity, the results are close to what is found

12

with more traditional methods. Studies using panels, time series, difference-in-difference, and

even experimental methods produce results similar to more traditional cross-sectional or

individual techniques (Brox and Giammo forthcoming; Bowler et al. 2001; c.f. Erikson and

Minnite 2009). Indeed, we estimate a differences-in-differences and matching models as

robustness checks and find similar results to our cross section studies. Hanmer’s comparison of

standard probit and the method of bounds concluded that the difference in the results “is not

sufficiently strong to allow one to reject the probit models” in his analysis (2007, 20).

Empirical Results

Data and Methods

The first step is to categorize states according to their voting laws. As noted early, we

view these policies the way a physician views prescription drugs. Each can have an effect in

isolation but we must also consider how they interact. Many states in fact adopt multiple

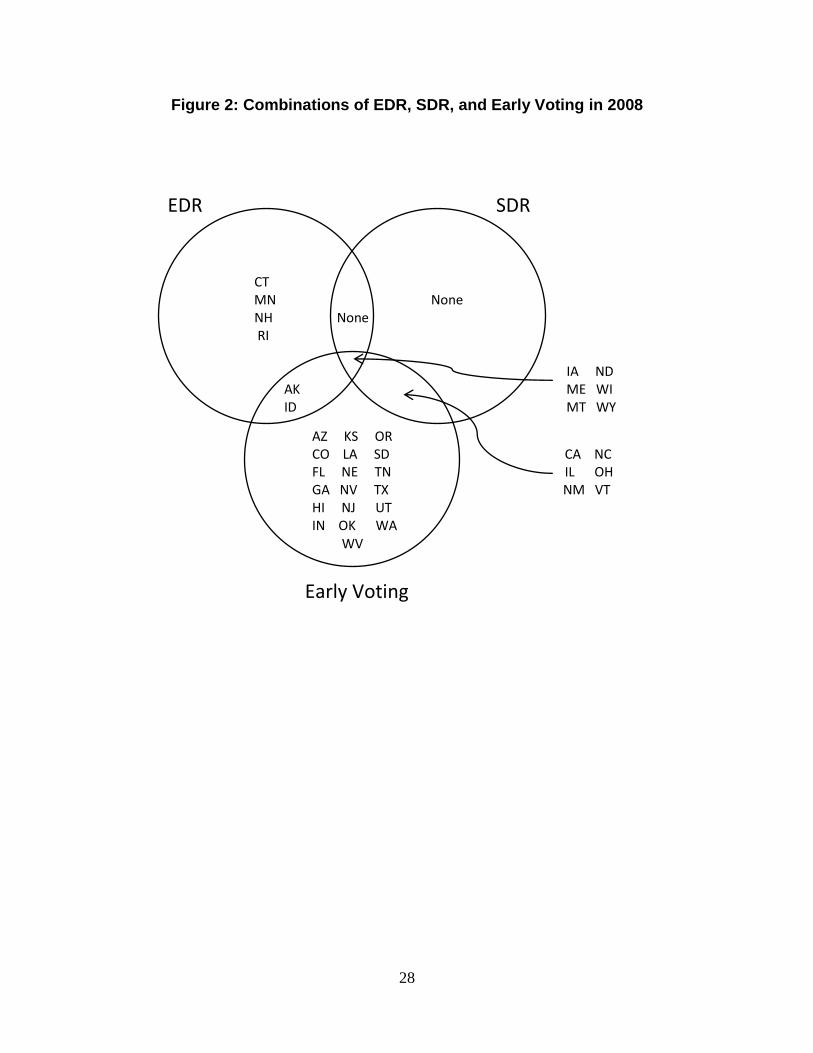
reforms, so each distinction combination should be evaluable. Figure 2 is a Venn diagram that

displays the different combinations of voting rules in place for the 2008 presidential election and

how they can combine. In practice, there are thirty-eight states employing one of the five

possible combinations of the rules. (The twelve states that have none of the three practices are

not listed.) The most common approach, used by 19 states, is simply to allow early voting for

voters who are already registered. We count as early voting states that permit no-excuse

absentee ballots (such as Wisconsin), but exclude states that require voters to give a reason in

order to receive an absentee ballot (as in Minnesota).10

We classify twelve states as having EDR

in 2008.11

10

We do not distinguish between states that actually count the ballots ahead of the election, and

states that merely accept the ballot for election-day tallying. Codings are drawn from the

National Conference of State Legislature’s listing at

13

Figure 2 about here

Our criterion for defining SDR is that the practice must be widely available to eligible

voters without significant administrative barriers. We thus excluded states that allowed some

form of “one-stop shopping” only to limited portions of the population. For example, Colorado

permits SDR only for a small set of “emergency” registrants who moved across county lines

after the closing date. As we define it, a dozen states permitted some form of SDR in 2008,

permitting voters to register and vote anywhere from one month prior to the election, up to the

day before. And, as we noted earlier, we define early voting as the opportunity to cast a ballot

prior to election day, either in person or by mail, without excuse.

Compared to states with none of these reforms, there are seven possible configurations of

EDR, SDR, and early voting: (1) EDR alone, (2) SDR alone, (3) early voting alone, (4) EDR and

SDR, (5) EDR and early voting, (6) SDR and early voting, (7) or all three. Because SDR

requires early voting, there are no states with just SDR, and none with the two-way combination

of SDR and EDR. As a result, there are effectively five combinations relative to the baseline

states that have none. So when previous work has estimated the effects of SDR, it has

unwittingly estimated the joint of effects of SDR and early voting. We separate these laws for

the first time.

<http://www.ncsl.org/LegislaturesElections/ElectionsCampaigns/AbsenteeandEarlyVoting/tabid/

16604/Default.aspx> accessed in July 2009. 11

The states commonly considered as having EDR are Idaho, Iowa, Maine, Minnesota,

Montana, New Hampshire, North Carolina, Wisconsin, and Wyoming. After carefully reading

state statutes and consulting with state election officials, we modified this list for our analysis. In

2008 we include the usual suspects along with North Dakota (although it technically has no

registration). We exclude North Carolina, because while it has same-day registration and early

voting, there is no registration permitted on election day itself. But we also include Alaska,

Connecticut, and Rhode Island, both of which permitted election day registrants to vote for

President. Breaking with the common practice, we suggest that these states should be treated as

EDR states in a presidential election year. EDR states may still have closing dates for traditional

registration, but nonetheless permit last-minute registrations on election day itself.

14

County Level Regression Analysis

To determine the effects of EDR, SDR, and early voting on turnout, we analyze data from

the 2008 presidential election at two levels: a county-level dataset individual data from the

Current Population Survey (CPS) November 2008 Voting and Registration Supplement. All of

our data sets have large sample sizes, an advantage that allows us to make careful comparisons

among the states in each section of Figure 2, and to include a wide range of control variables.

We begin with aggregate analysis of turnout at the county level. The dependent variable

is turnout in the November 2008 presidential elections as a percentage of the voting age

population. The key explanatory variables are dichotomous indicators for each of the five

possible realizations in Figure 2. The signs and significance levels of these coefficients will

suggest the contribution that each distinct combination makes to voter turnout. To avoid

spurious findings, we include an array of control variables generally known to affect turnout, and

estimate multiple specifications to increase confidence in the robustness of the findings. We also

adjust the standard errors to account for clustering of counties by state (Erikson and Minnite

2009; Primo, Jacobsmeier, and Milyo 2007).

The control variables include state other election laws, an array of demographics, and an

indicator of the competitiveness of the presidential campaign. State election law variables

include the number of days before the election that registration closes, a dummy indicating

whether votes are required to show identification at the polls, and a dummy indicating whether

ex-felons are barred from voting. To the degree that these laws matter once our new variables

are included, we expect all three to have negative effects. Demographic controls for each county

include the percent black, median income, percentage of adults with bachelor degrees,

percentage 65 or older, total population, and population density. Our measure of campaign

15

competitiveness is the difference between the final Pollster.com survey estimates for McCain

and Obama. The effect should be negative because a larger gap between the candidates ought to

be reflected in lower turnout. We also include dummy variables for Oregon and Washington,

whose reliance on mail-in balloting falls outside the three primary types of election laws we

examine here.

We show two specifications of the model in Table 1. The first is based on the raw data

while the second is weighted by county population to account for the wide variance in county

populations that may contribute to heteroskedasticity.

The findings from Table 1 indicates that EDR alone or in combination with other laws

has positive effects on turnout. EDR by itself has an effect that ranges between 6.7 and 7.8

points for the two models. In both alternative models any combination including EDR increases

turnout by 4.2 to 11 percentage points. In contrast, early voting on its own has a negative effect

that ranges between 3.5 points to 5.8 points, and the combination of SDR and early voting has no

effect. Control variables mostly perform as expected. Turnout is higher in county with more

African-Americans, higher incomes, more college graduates, smaller and less dense populations,

and where the McCain-Obama campaign was close.

Table 1 about here

The results of these county regression models suggest that voter turnout is indeed sharply

influenced by state laws concerning registration and early voting. The two key results are that

(1) early voting by itself has a negative effect and (2) EDR by itself has a positive effect.

Combining early voting with SDR appears to have little effect while combining EDR with early

results in a significant and positive outcome. States that have all three approaches see sizeable

increases in turnout. Indeed, any combination that includes EDR increases turnout.

16

Cumulatively, the results suggest that creating the opportunity for voters to “one-stop shop”

offers a way to turn the negative of early voting into a net positive. Figure 3 displays the

estimated effects and 95 percent confidence intervals for both the weighted and unweighted

models din graphical form for easy comparison. From this graphic it is apparent that early

voting on its own is unlike all other combinations of laws, each of which has no effect or a

positive effect on turnout.

Figure 3 about here

As a brief digression, we note that one other reason prior studies of SDR have found

inconsistent results is that they have not taken into account variation in SDR is implementation

across the states. We suspect, in particular, that the length of time in which “one-stop shopping”

is available will make a substantial difference in turnout. In 2008 this window ranged from just

one day in New Mexico to over 40 days in three states. To investigate this possibility we

reestimate model II on states with SDR, and includes a new key variable: the length of time the

SDR window is open. The results in Table 2 show that each additional day of SDR availability

results in a .29% increase in turnout. Increasing the window length by 12 days (the standard

deviation of the variable) thus increases turnout by 3.5 points. The control variables largely

operate as expected. The length-of-window finding reinforces our expectation that

implementation matters. Two otherwise similar states could both have SDR “on the books,” but

the state that offers it for a longer time will see a greater positive turnout effect.

Table 2 about here

Individual Level Regression Analysis

We now turn to estimating turnout effects at the individual level. Here we are interested

in the factors that make individuals more (or less) likely to cast a ballot. Most individual-level

17

turnout analysis takes a standard form, using logit or probit regression with the vote (or reported

vote) as the dependent variable, and with the right-hand side consisting of various demographic

and systemic independent variables that purport to capture the important causal factors.

Our individual-level analysis uses the 2008 Voting and Registration Supplement File of

the CPS. The CPS, a common data set in voting analysis, is a large-scale sample survey

normally used to collect labor force data. In November of election years, the instrument asks a

short set of voting and registration items to a sample of about 130,000 people. Most questions in

the voting battery have between 60,000 and 90,000 valid observations.

The voting item is self-reported, asking whether people voted in the 2008 presidential

election (there is also a proxy reporting feature, which we describe below): respondents can

answer “yes,” “no,” “don’t know,” “refuse to answer,” or have no response recorded. Following

the common practice, we calculate overall turnout by dividing the number of “yes” responses by

the total number of individuals who are asked the question, counting as nonvoters those who

refused to answer, did not know, or did not respond. Because the voting items are only asked of

individuals 18 years or older, this gives us an estimate of turnout as a percentage of the voting

age population.12

Using this method, 64.9% of respondents in the CPS reported voting in 2008

(n = 92,360), a number significantly higher than the actual 2008 VAP turnout, estimated at

56.8% (McDonald 2009), but one of the most accurate among all election surveys.13

12

At the same time, the CPS excludes the institutionalized population, estimated at about four

million in 2000. In other calculations of the voting age population, these individuals are counted. 13

This over reporting phenomenon is well known, and has several causes, including sampling

bias (Burden 2000), false reports of voting (Gerber, Green and Larimer 2008), and mistaken

recall (Belli et al 1999). To complicate matters further, the CPS has an unusual feature in which

data on respondents can be provided by other members of the household if the respondent is not

home at the time the surveyor visit occurs. Having one’s vote status reported by proxy quite

obviously introduces another possible source of misreporting. Although there is no good way to

correct for misreported voting responses (Katz and Katz 2009), the large literature on the

18

We use a larger number of independent variables than most other models of turnout.

Alvarez, Bailey, and Katz (2008, 8-9) describe the “canonical model of voter turnout using CPS

data” as using age, residence in a Southern state, education, income, squared values of age and

education, and non-White as independent variables (see also Wolfinger and Rosenstone 1980).

However, the CPS includes a wide range of plausible and theoretically justifiable turnout

covariates, including questions on length of residence, gender, marital status, racial identity,

whether a respondent is a natural born citizen or naturalized, and if naturalized the year of entry

into the U.S, and whether a respondent’s voting status is self-reported or reported by proxy.

Given our interest in estimating the effects of different voting and registration systems, it makes

sense to include this additional information about respondents. As in the aggregate model, we

include variables describing the five possible combinations of early voting, SDR, and EDR, and

separate dummy variables for Oregon and Washington.

The results, reported in Table 3, are roughly consistent with the aggregate model. The

most important finding is that early voting has the same effect as in the individual model,

lowering turnout by over four percentage points. Most of the other registration rules and

combinations have no statistically significant effect. As in the aggregate model, it appears as

though EDR and SDR can offset the negative effects of early voting when the three practices are

combined. EDR has a modestly positive effect on the individual likelihood of voting, marginally

significant, but raising turnout by about three percentage points.

problem has generally concluded that the consequences for statistical inference are minor

(Highton 2005; although see Bernstein, Chadha, and Montjoy (2005) for a less sanguine take).

Overreporting is most common among people otherwise most likely to vote, in part because the

social pressure is greatest in this cohort (Bernstein, Chadha, and Montjoy 2001).

19

Figure 4 presents the effects translated into probabilities, along with the 95 percent

confidence intervals. It is again clear that EDR raises turnout, early voting lowers it, and other

combinations tend to have little effect.

Figure 4 about here

Although we lack the space to report them here, we have conducted a number of

empirical exercises to test the validity of our results. First, we pre-processed both the individual

and aggregate data using matching methods before estimating our models. The matched data

allow us to estimate causal effects more accurately and avoid making assumptions about

functions form. The results were nearly identical, with only somewhat larger standard errors.

Second, following Hanmer and others, we estimated difference-in-difference models on the

aggregate data to address the endogeneity concern. Here we regressed the change in turnout

between 2008 and 2004 on the changes in early voting and EDRs between those same two years.

We also controlled for competitiveness, included state fixed effects, and clustered standard errors

by state. The effects were smaller than the ones estimated here, but confirmed that early voting

decreases turnout and EDR increases it. These results are available from the authors upon

request.

Early Voters are Likely Voters

Both the county-level and individual-level analyses point to the same conclusion: early

voting by itself depresses turnout, and the depressive effects can be offset when early voting is

combined with SDR. How is it possible that the enormous additional convenience of early

voting can drive turnout down? Recall that our argument has two pieces, which together make

the case that early voting leads to lower turnout.

20

The first piece of the puzzle is that early voting serves to give already likely voters

additional opportunities to submit their ballot. Rather than bring new voters into the electorate,

early voting simply redistributes the votes of likely voters over an extended pre-election period.

We have long known that the inconvenience of registration, rather than the difficulty of

voting itself, is what deters most citizens from participating (Erikson 1981; Timpone 1998). The

additional convenience of early voting is worthless to a potential voter who finds that she is

actually not registered, and therefore unqualified to vote. This problem can be rectified if on-

the-spot registration is available. Without SDR, a voter would have to register in advance, often

weeks before the vote is actually cast, and an unregistered voter who runs across an early voting

booth in a shopping center has no reason to stop. Even with SDR, though, early voting requires

a high degree of attentiveness, particularly in those states that allow early voting weeks before

election day.

We thus hypothesis is that early voting is more likely to provide opportunities to those

individuals already likely to vote. All other things being equal, we do not expect to see a

significant increase in turnout, because early voting simply provides opportunities for these

likely voters; absent early voting, they would have appeared at polling places on election day and

voted then.

Fortunately, the CPS data offer a way to answer this question. Respondents are asked if

they voted in person or by mail, and whether they voted on election day or before. The CPS

marginals are close to the national estimates of early and mail voting, and thus offer a valid way

to assess the effects of the different voting rules. Among those in the CPS sample who said they

voted, 27.7% of reported casting their ballot prior to election day (our definition of early voting).

The actual figure for 2008 is 30% (McDonald 2009). Matching the CPS mail-in result with

21

national estimates is more difficult, because there is no single source for the actual number of

votes submitted by mail. In the CPS sample, 15.9% of respondents reported voting by mail.14

Esing EAC data, we estimate the actual number of mail-in votes to be 18.6% of the total vote in

2008.15

With this information, we can construct a four category choice variable for individuals:

they can vote on election day, vote prior to election day in person, vote prior to election day by

mail, or not vote. Multinomial logit is the appropriate method for this problem, and the results

will highlight the effect of the independent variables on the specific choices that voters and

nonvoters make. The results of our application, using the same independent variables as the

basic individual-level model, are reported in Table 4. In the model, the baseline (or excluded)

category is voting on election day, so all coefficients are interpreted relative to those.16

Table 4 about here

14

Some respondents reported that they voted by mail on election day (or reported the same by

proxy). This is possible in all-mail states and in states that allow absentee ballot drop-off on

election day (e.g., California), or states that count absentee ballots postmarked on election day.

The overwhelming majority of mail-in voters (95.2%) said they voted prior to election day. 15

The EAC does not track mail-in votes, but we can approximate the number using the data

collected on voting methods. The EAC’s 2008 survey put the total 2008 vote at 133,944,538

(Election Assistance Commission 2009b, 22-23 [Table 29A: Ballots Cast By Means of Voting]).

Based on the EAC data, we know that 99.8 million of these votes were cast in person, either on

election day or earlier. We assume that all remaining absentee and UOCAVA votes were mailed

in, giving a total of 23.1 million mail-in votes. To this we add the 1,816,596 ballots submitted in

Oregon’s all-mail election system, giving us a total of 24,941,987 mail-in votes, or 18.6% of the

total. The EAC survey failed to classify roughly 8 million votes, because of data and reporting

problems at the state level. Almost all of these unclassified votes occurred in Alabama,

Massachusetts and South Carolina. These states have very restrictive absentee voting rules, and

in 2008 Alabama required absentee ballots to be hand-delivered to county officials. As a result,

we think that very few of the uncategorized votes were mailed, and are confident that our 18.6%

estimate is reasonable and comparable to the results in the CPS. Consequently, we conclude that

inferences from the CPS mail and early voting results are reliable. 16

We have updated our multinomial logit analysis to include dummy variables for Oregon and

Washington that we added to the baseline logit model, but the substantive interpretation of the

variables of interest do not change. These will appear in the next version of the paper.

22

In terms of election laws, the results show that in states with EDR, voters are

significantly more likely to vote on election day rather than early or abstain. In contrast, in states

with no-excuse early voting, voters are much more likely to vote early, but are also more likely

to abstain. Because they combine early voting and one-stop shopping, the other three

combinations of laws contribute to more abstention but also higher levels of early voting. Is it

only EDR in isolation that raises turnout and election day voting; it is only early voting in

isolation that reduces turnout and election day voting.

The other coefficients we are interested in are those which we know indicate a higher

likelihood of voting, based on existing research. The coefficients for education, income, age,

and gender are all positive and statistically significant in columns 3 and 4, telling us that early

voters score higher on these dimensions, and are therefore more likely to vote than election day

voters. Early voters are older, wealthier, more educated, and more likely to be women, all

variables that are highly correlated with turnout. We can state with confidence that the early

voters comprise a population that, based on demographics, is more likely to vote than the

population of voters that cast their ballots on election day.17

We can also state with high

confidence that early voters were far more likely than election day voters to be African

American, a result we attribute to the massive get-out-the-vote (GOTV) efforts by the Obama

campaign.

There is a more direct way to demonstrate that early voters, as a group, are more likely to

vote than voters who cast their ballot on election day. We use the predicted probabilities of

17

This may seem a tautology, in that we are comparing the probabilities of voting across two

groups that we know have voted. How can we say that early voters are more likely to vote than

election day voters, when we know that both groups have actually voted? The difference arises

when we move beyond our sample, to make inferences about the population. From our

multinomial logit, we can say that early voters have demographic profiles that make them likely

voters. When compared to those in our sample who voted on election day, we can say that

23

voting generated by the first individual level model of the vote (Table 3). This model generates a

vector comprised of an estimated probability of voting for each respondent in our sample.

We can compare the average estimated voting probabilities of early voters and election

day voters, using a straightforward t-test of means. Early voters have an average predicted

probability of voting that is more than is 2.1 percentage points higher than election day voters (t

= 13.44, p < .0001). Early voting is not bringing new voters into the electorate. Instead, as we

have emphasized, it serves more as a mechanism of convenience for those already likely to vote.

Remove early voting, and these early voters would simply show up on election day.

Early Voting Reduces Election Day Stimulation

The fact that early voters probably would have voted anyway can explain why early

voting does not raise turnout, but it does explain why it would depress turnout. Here, we raise

the second part of our explanation that that early voting robs election day of the stimulating

effect it would otherwise have on nonvoters (or marginal voters). There is a large literature

demonstrating the impact of political campaigns on mobilizing voters and increasing turnout.

Partisan contacts, direct mail, phone calls, leafleting, and mass media (Green and Gerber 2008),

levels of competition and campaign spending (Jackson 1997, 2002), campaign advertizing

(Freedman, Franz, and Goldstein 2004),18

campaign yard signs (Panagopoulos 2009), texted

reminders to vote (Dale and Strauss 2009), party transfers to states and campaign visits by

presidential candidates (Holbrook and McClurg 2005) all have an impact on turnout. Campaigns

may draw down their mobilization efforts when they have already brought in large numbers of

early voters; there may be less advertising, or fewer efforts to organize election day activities.

When much of the eligible population has already voted in advance of election day, there is less

18

But see Krasno and Green (2008) for experimental evidence that shows no effect of campaigns

ads on turnout.

24

payoff for continued get-out-the-vote activities. If this reduced activity in high early voting

states is not counterbalanced by the increased convenience of voting prior to the election, the net

effect would be negative. We believe that the stimulation provided by a single election day

comprises much more than strategic elite mobilization, including such things as discussion in the

workplace and extensive coverage on local news, but campaign activity is a reasonable proxy for

how much electoral stimulation is occurring.

While comprehensive empirical tests of this point await further study, we provide some

preliminary evidence from political advertizing in the 2008 presidential campaign. Here we

draw upon data on television ads from the Wisconsin Advertising Project. As an illustration,

Figure 5 displays the airings from the McCain campaign in California, with blue dots indicating

days when early voting was in place. Rather than ramping up to election day, the ads are clearly

clumped around the beginning of early voting in the state on October 6th. While this could be

seen as a symbolic gesture or an act of desperation (given that Obama had a large lead in

California), the 1,637 ads the McCain campaign ran in the nine days before and after the start of

early voting are clearly timed to influence early voters.

Figure 5 about here

To show this more generally, we plot advertising volume by day for states with different

levels of early voting. Figure 6 isolates battleground states from non-battleground states (using a

difference of 17 points in the two-party vote to identify them) and states with more or less early

voting (using 50% of total votes cast to identify them). There were no states that were both

battlegrounds and with more than 50% early voting, so this leaves just three combinations to

analyze, but the most useful distinction is across levels of early voting in battlegrounds. Little

advertising was done in non-battleground states. The figure shows that in states with lower

25

levels of early voting, campaign intensity was high and continued to rise up until election day.

In contrast, in states with extensive early voting, advertising volume was substantially lower and

does not appear to have risen monotonically up to the election. Instead, it seems that advertising

leveled off or even declined after the opening of the early voting period. In short, even

conditional on battleground status, early voting states saw less overall campaign mobilization

and that mobilization peaked earlier, removing much of the stimulation that could have happened

close to or on election day.

Figure 6 about here

More comprehensive tests of the demobilizing effects of early voting should include

analysis of campaigns’ get-out-the-vote efforts, location of field offices, party transfers, and

other efforts aimed at stimulating turnout.19

If our claim is correct, mobilization efforts should

diminish in battleground states with high levels of early voting when compared to competitive

states in which a smaller percentage of the electorate has already voted. Broadening the

conception of mobilization to other, nonstrategic forms such as local news coverage, discussion

with friends and family, and other signs of election day activity should provide even more

evidence that election laws that reduce direct voting costs but also result in higher indirect costs

can indeed result in lower levels of voter turnout.

Conclusion

We make one empirical claim and one methodological contribution. Methodologically,

we have shown that election reforms cannot be studied in isolation. Instead, researchers must

consider the different combinations of voting reforms as the actually appear, and note the

differences in what may appear at first look the same practice such as same-day-registration laws

19

Our initial analysis of party transfers finds that national parties transferred less money into

early voting states, even after controlling for competitiveness and other factors.

26

with different windows. This is the only way to capture the full effects of these complex,

overlapping, and often arcane rules.

Our empirical claim is unambiguous: among all of the potential combinations of reforms,

the only consistent way to increase turnout is to permit election day registration. Same day

registration is a “second best” solution, marginally increasing turnout if the window for

registration is sufficiently long. We conclude that early voting might bring out some new voters,

on net it reduces turnout by robbing election day of its stimulating effects. This depressant effect

is only offset if election day registration is also present to provide a vehicle for the last-minute

mobilization of marginal voters. Early voting has become the most common reform in recent

election cycles, and our findings show that unless it is combined with either a prolonged period

of SDR, or EDR, the result will be lower net turnout. One might reform elections for many

reasons beyond increasing turnout, including such considerations as cost and administrative

burden, but if policymakers wish to heighten voter participation they would be wise to consider

both the direct and indirect consequences of their actions.

27

Figure 1 : Early Voting and Turnout in the States

AK

AL

AR

AZ

CA

COCT

DC

DE

FLGA

HI

IA

IDIL

IN

KSKY

LA

MAMD

ME

MI

MN

MO

MS

MT

NCNDNE

NH

NJNM

NV

NY

OH

OK

OR

PA

RI

SC

SD

TNTX

UT

VA

VT

WA

WI

WV

WY

50

55

60

65

70

75

To

tal T

urn

ou

t

0 20 40 60 80Early Voting

Note: Dotted regression line represents all states. Solid regression line omits OR and WA.

28

Figure 2: Combinations of EDR, SDR, and Early Voting in 2008

EDR SDR

Early Voting

CT MN None NH None RI IA ND AK ME WI ID MT WY

AZ KS OR CO LA SD CA NC FL NE TN IL OH GA NV TX NM VT HI NJ UT IN OK WA WV

29

Figure 3: Effect of Voting Laws on Aggregate Turnout

Effect on VAP Turnout - Change in Turnout %

All (weighted)

All

Early + SDR (weighted)

Early + SDR

Early + EDR (weighted)

Early + EDR

Early (weighted)

Early

EDR (weighted)

EDR

-15 -10 -5 0 5 10 15

30

Figure 4: Effect of Voting Laws on Individual Turnout

31

Figure 5: Daily McCain Campaign Advertising in California

Note: Blue dots indicate days in which early voting was in effect.

Number of days until the election

32

Figure 6: Daily Campaign Advertizing by Battleground Status and Early Voting

Battleground States Battleground States

Early Voting < 50% Early Voting > 50%

Non-Battleground States

Early Voting < 50%

33

Table 1: Regression Estimates of Election Laws on County Turnout

I II

EDR 6.72**

(2.24)

7.86*

(4.30)

EDR + Early Voting 4.96***

(1.45)

5.40***

(1.44)

EDR + SDR + Early Voting 4.25*

(2.06)

11.01***

(2.02)

Early Voting + SDR .45

(1.79)

-.89

(2.25)

Early Voting -3.46*

(1.52)

-5.76***

(1.61)

Closing Date -.10

(.10)

.09

(.13)

ID Requirement .80

(1.32)

-.06

(1.64)

Ex-Felons Barred .10

(1.46)

1.26

(1.68)

Percent Black .12***

(.035)

.113**

(.040)

Median Income .0003***

(.00005)

.0002**

(.0007)

Percent College Graduates .32***

(.07)

.30***

(.07)

Percent 65 or Older .86***

(.09)

.671***

(.18)

Population (in 100,000s) -.39***

(.08)

-.14**

(.05)

Population Density -.0004**

(.0001)

-.0003***

(.0004)

Campaign Competitiveness -.08

(.07)

-.244***

(.07)

Oregon 6.54***

(1.13)

10.44***

(1.70)

Washington 3.62*

(1.92)

11.68

(2.31)***

Constant 31.98***

(4.04)

35.77***

(4.50)

R2

.419 .585

Weighted by Population No Yes Notes: N = 3109. ***p < .001 **p < .01,*p < .05, one-tailed test.

Cell entries are OLS regression estimates with standard errors in parentheses.

Robust standard errors clustered at the state level.

34

Table 2: Effect of SDR Window Length on County Turnout

Length of Window (in days) .29***

(.03)

Closing Date .03

(04)

ID Requirement .77

(.88)

Percent Black .05*

(.03)

Median Income .0002*

(.0001)

Percent with BA .32***

(.05)

Percent 65 or Older .67***

(.07)

Population (in 100,000s) -.14**

(.05)

Population Density -.0003

(.0002)

Campaign Competitiveness -.06**

(.04)

Constant 34.05***

(2.88)

R2

.464

Notes: N = 713. ***p < .001 **p < .01,*p < .05, one-tailed test.

Cell entries are OLS regression estimates with standard errors in parentheses.

Analysis is limited to states with SDR.

Robust standard errors clustered at the state level.

Fixed effects for individual states not reported.

Ex-felon disenfranchisement variable omitted because it does not vary in SDR states.

35

Table 3: Logit Estimates of Election Laws on Individual Turnout

EDR .17*

(.10)

EDR + Early Voting -.12

(.14)

EDR + SDR + Early Voting .08

(.09)

SDR + Early Voting -.02

(.06)

Early Voting -.20***

(.06)

Education .60***

(.02)

African-American .73***

(.06)

Hispanic -.06

(.1)

Self-Reported Vote .83***

(.03)

Naturalized Citizen -1.05 ***

(.17)

Naturalized 10+ years .47**

(.16)

30-day Registration close -.12*

(.06)

Married .43***

(.02)

Residence 1 Year .27***

(.03)

Income .08***

(.002)

Gender .15***

(.02)

Age .025***

(.002)

Age 18-24 .42***

(.04)

Age over 75 -.12*

(.05)

South -.04

(.06)

Campaign Competitiveness -.005

(.003)

Oregon .16***

(.05)

Washington .04

(.05)

Constant -3.85***

(.057)

Pseudo-R2

.145

Pct. Correct Predicted 73.4

N 74,327

***p < .001 **p < .01,*p < .05, one-tailed test.

Clustered standard error estimates (by state) reported in parentheses

36

Table 4: Multinominal Logit of Election Laws on Individual Turnout

Did Not Vote Voted Early in Person Voted Early by Mail

EDR -.14***

(.04)

-.11

(.13)

-.51***

(.07)

EDR + Early Voting .39***

(.06)

2.20***

(.09)

.86***

(.09)

EDR+ SDR + Early Voting .18***

(.04)

2.08***

(.07)

.80***

(.05)

Early Voting + SDR .37***

(.03)

2.02***

(.06)

1.40***

(.04)

Early Voting .58***

(.02)

2.13***

(.05)

1.52***

(.04)

Education -.55***

(.01)

.19***

(.02)

.18***

(.01)

African-American -.68***

(.03)

.54***

(.05)

.18***

(.02)

Hispanic .05

(.03)

.02

(.06)

-.14**

(.06)

Self-Reported Vote -.84***

(.02)

.04

(.03)

-.09***

(.03)

Naturalized Citizen 1.02***

(.11)

-.07

(.22)

-.10

(.21)

Naturalized 10+ years -.46***

(.12)

-.16

(.23)

.14

(.22)

30-day Registration close .11***

(.02)

.27***

(.03)

-.27***

(.04)

Married -.46***

(.02)

-.05

(.03)

-.18***

(.03)

Residence 1 Year -.33***

(.03)

-.26***

(.05)

-.26***

(.04)

Income -.08***

(.003)

.03***

(.004)

.01**

(.004)

Gender -.12***

(.02)

.09***

(.03)

.12***

(.03)

Age -.02***

(.001)

. 02***

(.001)

.03***

(.001)

Age 18-24 -.28***

(.03)

.28***

(.07)

.80***

(.06)

Age over 75 .20***

(.05)

-.11*

(.07)

.30***

(.05)

South .21***

(.03)

1.35***

(.04)

-.81***

(.04)

Campaign Competitiveness .001*

(.001)

-.02***

(.002)

-.02***

(.002)

Constant 3.51***

(.07)

-5.37***

(.13)

-4.00***

(.12)

Notes: Reference category is voting on election day; Pseudo-R2

=.145; N=74174

***p < .001 **p < .01,*p < .05, one-tailed test.

Cell entries are OLS regression estimates with standard errors in parentheses

37

References Addonizio, Elizabeth M., Donald P. Green, and James M. Glaser. 2007. “Putting the Party Back

into Politics: An Experiment Testing Whether Election Day Festivals Increase Voter

Turnout.” PS: Political Science & Politics 40:721-7.

Belli, Robert, Michael Traugott, Margaret Young, and Katherine McGonagle. 1999. “Reducing

Vote Overreporting in Surveys: Social Desirability, Memory Failure, and Source

Monitoring.” Public Opinion Quarterly 63:90-108.

Berinsky Adam J. 2005. “The Perverse Consequences of Electoral Reform in the United States.”

American Politics Research 33:471-91.

Berinsky, Adam J., Nancy Burns, and Michael W. Traugott. 2001. “Who Votes By Mail? A

Dynamic Model of the Individual-Level Consequences of Voting-By-Mail Systems.”

Public Opinion Quarterly 65:178-97.

Bowler, Shaun , David Brockington, and Todd Donovan. 2001. “Election Systems and Voter

Turnout: Experiments in the United States.” Journal of Politics 63:902-15.

Burden, Barry C. 2000. “Voter Turnout and the National Election Studies.” Political Analysis

8:389-98.

Demos. 2006. Election Day Registration Helps America Vote. Demos: A Network for Ideas and

Action, Washington. <http://www.demos.org/pubs/EDR%20Toolkit%20070506.pdf>.

Election Assistance Commission. 2009a. The Impact of the National Voter Registration Act of

1993 on the Administration of Elections for Federal Office 2007-2008: A Report to the

111th

Congress. U.S. Election Assistance Commission. June 30.

Election Assistance Commission. 2009b. 2008 Election Administration and Voting Survey: A

Summary of Key Findings. November.

38

Erikson, Robert S., and Lorraine C. Minnite. 2009. “Modeling Problems in the Voter

Identification-Voter Turnout Debate.” Election Law Journal 8:85-101.

Erikson, Robert S., Gerald C. Wright, and John P. McIver. 1993. Statehouse Democracy: Public

Opinion and Policy in the American States. New York: Cambridge University Press.

Fitzgerald Mary. 2005. “Greater Convenience but not Greater Turnout: The Impact of

Alternative Voting Methods on Electoral Participation in the United States.” American

Politics Research 33:842-67.

Fortier, John C. 2006. Absentee and Early Voting: Trends, Promises, and Perils. Washington,

DC: American Enterprise Institute Press.

Gerber, Alan S., Donald P. Green, and Christopher W. Larimer. 2008. “Social Pressure and

Voter Turnout: Evidence from a Large-Scale Field Experiment.” American Political

Science Review 102:33-48.

Giammo, Joseph D., and Brian J. Brox. Forthcoming. “Reducing the Costs of Participation: Are

States Getting a Return on Early Voting?” Political Research Quarterly.

Gronke, Paul, Eva Galanes-Rosenbaum, and Peter A. Miller. 2007. “Early Voting and Turnout.”

PS: Political Science and Politics 40:639-45.

Gronke, Paul, Eva Galanes-Rosenbaum, Peter A. Miller, and Daniel Toffey. 2008. “Convenience

Voting.” Annual Review of Political Science 11:437-55.

Gronke, Paul, Eva Galanes-Rosenbaum, and Peter A. Miller. 2008. “Early Voting and Voter

Turnout,” In Democracy in the States: Experiments in Election Reform, ed. Bruce E.

Cain, Todd Donovan, and Caroline J. Tolbert. Washington, DC: Brookings Institution

Press.

39

Hanmer, Michael J. 2007. “An Alternative Approach to Estimating Who is Most Likely to

Respond to Changes in Registration Laws.” Political Behavior 29:1-30.

Hanmer, Michael J. 2009. Discount Voting: Voter Registration Reforms and Their Effects. New

York, NY: Cambridge University Press.

Hanmer Michael J. and Michael W. Traugott. 2004. “The Impact of Voting by Mail on Voter

Behavior.” American Politics Research 32:375-405.

Hershey, Marjorie Randon. 2009. “What We Know about Voter-ID Laws, Registration, and

Turnout.” PS: Political Science & Politics 42:87-91.

Highton Ben. 1997. “Easy Registration and Voter Turnout.” Journal of Politics 59:565-75.

Highton, Benjamin. 2004. “Voter Registration and Turnout in the United States.” Perspectives

on Politics 2:507-15.

Highton, Benjamin. 2005. “Self-Reported Versus Proxy-Reported Voter Turnout in the Current

Population Survey.” Public Opinion Quarterly 69:113-23.

Holbrook, Thomas M. and Scott D. McClurg. 2005. “The Mobilization of Core Supporters:

Campaigns, Turnout, and Electoral Composition in United States Presidential Elections.”

American Journal of Political Science 49: 689-703

Jackson, Robert A. 1997. “The Mobilization of US State Electorates in the 1988 and 1990

Elections.” Journal of Politics 59:520-37.

Jackson, Robert A. 2002. “Gubernatorial and Senatorial Campaign Mobilization of Voters.”

Political Research Quarterly 55:825-44.

Karp, Jeffrey A. and Susan A. Banducci. 2001. “Absentee Voting, Mobilization, and

Participation.” American Politics Research 29:183-95.

40

Katz, Jonathan N., and Gabriel Katz. 2009. “Correcting for Survey Misreports Using Auxilliary

Information with an Application to Estimating Turnout. Caltech Voting Technology

Project Working Paper 74, May. <http://vote.caltech.edu/drupal/files/working_paper/WP-

74.pdf>.

King, Gary, Robert O. Keohane, and Sidney Verba. 1994. Designing Social Inquiry: Scientific

Research in Qualitative Research (Princeton: Princeton University Press)/

Knack, Stephen. 2001. “Election-day Registration: The Second Wave.” American Politics

Research 29:65-78.

Knack, Stephen, and James White. 2000. “Election-Day Registration and Turnout Inequality.”

Political Behavior 22:29-44.

Kousser, Thad and Megan Mullin, 2007. "Does Voting by Mail Increase Participation? Using

Matching to Analyze a Natural Experiment." Political Analysis 15:428-5.

Krasno, Jonathan S., and Donald P. Green. 2008 “Do Televised Presidential Ads Increase Voter

Turnout? Evidence from a Natural Experiment.” Journal of Politics 70:245-61.

Kropf, Martha, David Swindell, and Elizabeth Wemlinger. 2009. “The Effects of Early Voting

on Social Ties: Using Longitudinal Data.” Paper presented at the Non-Precinct Place

Voting Conference, Portland, OR.

Leighley, Jan E., and Jonathan Nagler. 2009. “Electoral Laws and Turnout, 1972-2008.” Paper

presented at the Fourth Annual Conference on Empirical Legal Studies, University of

Southern California.

Lijphart, Arend. 1997. “Unequal Participation: Democracy’s Unresolved Dilemma.” American

Political Science Review 91:1-14.

41

McDonald, Michael, 2009. “(Nearly) Final 2008 Early Voting Statistics,” updated January 11,

2009. <http://elections.gmu.edu/Early_Voting_2008_Final.html>

Magleby, David B. 1987. “Participation in Mail Ballot Elections.” Western Politics Quarterly

40:79-91.

Milyo, Jeff. 2009. “The Voter ID Mess: Estimating the Effects of State Voter ID Laws on Voter

Turnout and Self-Reported Voting Irregularities.” Paper presented at the annual meeting

of the Midwest Political Science Association, Chicago.

Nagler, Jonathan. 1991. “The Effect of Registration Laws and Education on U.S. Voter

Turnout.” American Politics Research 85:1393-405.

Patterson, Samuel, and Gregory Caldeira. 1985. “Mailing in the Vote: Correlates and

Consequences of Absentee Voting.” American Journal of Political Science 29:766-88.

Panagopoulos, Costas. 2009. “Street fight: The Impact of a Street Sign Campaign on Voter

Turnout.” Electoral Studies 28:309-13.

Primo, David M., Matthew L. Jacobmeier, and Jeffrey Milyo. 2007. “Estimating the Impact of

State Policies and Institutions with Mixed-Level Data.” State Politics & Policy Quarterly

7:446-59.

Rosenstone, Stephen, and John Mark Hansen. 1993. Mobilization, Participation, and Democracy

in America. New York: Macmillan

Smith, James T., and John Comer. 2005. “Consequential Reforms or Innocuous Tinkering?

Another Look at Efforts to Increase Turnout in American Elections.” Paper presented at

the annual meeting of the Midwest Political Science Association, Chicago.

Southwell Priscilla L. 2004. “Five Years Later: A Re-assessment of Oregon’s vote by Mail

Electoral Process.” PS: Political Science and Politics 98:89-93

42

Southwell, Priscilla L. and Justin I. Burchett. 2000. “The Effect of All-Mail Elections on Voter

Turnout.” American Politics Quarterly 28:72-9

Squire, Peverill, Raymond E. Wolfinger, and David P. Glass. 1987. “Residential Mobility and

Voter Turnout.” 81:45-65.

Stein Robert M. 1998. “Introduction: Early Voting.” Public Opinion Quarterly. 62:57-69.

Stein, Robert M. and Patricia Garcia-Monet. 1997. “Voting Early but Not Often.” Social Science

Quarterly 78:657-71.

Stein, Robert M and Greg Vonnahme, 2008. “Engaging the Unengaged Voter: Voter Centers and

Voter Turnout,” Journal of Politics 2:487-97.

Strauss, Aaron, and Allison Dale. 2009. “Don’t Forget to Vote: Text Message Reminders as a

Mobilization Tool.” American Journal of Political Science 53:787-804.

Thompson, Dennis F. 2004. “Election Time: Normative Implications of Temporal Properties of

the Electoral Process in the United States.” American Political Science Review 98:51-63.

Timpone, Richard T. 1998. “Structure, Behavior, and Voter Turnout in the United States.”

American Political Science Review 92:145-58.

Tolbert, Caroline, Todd Donovan, Bridgett King, and Shaun Bowler. 2008. “Early Voting and

Voter Turnout,” In Democracy in the States: Experiments in Election Reform, ed. Bruce

E. Cain, Todd Donovan, and Caroline J. Tolbert. Washington, DC: Brookings Institution

Press.

Wolfinger, Raymond E., Benjamin Highton, and Megan Mullin. 2005. “How Postregistration

Laws Affect the Turnout of Citizens Registered to Vote.” State Politics & Policy Quarterly

5:1-23.


Recommended