26
Election News and Numbers Making sense of polls, statistics and more for the 2008 election! QuickTime™ and a decompressor are needed to see this picture.
| Date post: | 01-Jan-2016 |
| Category: |
Documents |
| Upload: | emma-hudson |
| View: | 216 times |
| Download: | 1 times |
Election News and Numbers
Making sense of polls, statistics and more for the 2008 election!
QuickTime™ and a decompressor
are needed to see this picture.

Why should journalists know numbers & math?
• Explain what numbers mean to readers– Make complicated numbers understandable
• Create impact in stories• Give context to a situation
– Check credibility of government, industry, etc.• Do the numbers back up what they’re saying? • What are the numbers hiding?
Editing with numbers
• Balance!– Too few numbers unclear– Too many numbers confusing
• Context!– Be careful when comparing raw numbers
• Accuracy!– Know how to apply & check formulas
Polls and accuracy
• Consider the following:
• “Likely Voters”
• Cell-phone only voters
• Internet polling
“Likely Voters”
• “likely voters” are determined by pollsters. They are usually people who answer “yes” to questions like: Did you vote in the last election?
• Historically polls that count “likely voters” are more accurate
• Who does this leave out?
• Why might the “likely voter” rule not be as accurate this election?
Cell-phone only voters
• Laws prohibit that method for cell phones so pollsters would have to manually call which is $$$$$$$
• But Cell phone only voters only make up 13% of the populations and are mostly under 30 years of age. Some polls try to adjust results accordingly
Internet Polls
• What are some potential issues?
• What are some factors that might make these polls less accurate?
Polls and Surveys
• Poll—estimate of public opinion on a single topic– Which candidate will win the election?
• Survey—multiple questions asked to get data about a sample of the population– American Community Survey (U.S. Census)

Poll/Survey Sources
• www.pollingreport.com (multiple sources)• www.gallup.com (Gallup polls)• www.ciruli.com (polls and analysis from a
Colorado company)• http://ucblibraries.colorado.edu
– Browse research & subject guide for Polls or Public Opinion Information

5 W’s of describing polls
• WHO is behind the poll• WHAT is being polled (slight changes in
wording can affect response)• WHEN was the poll taken• WHERE did the sample come from
(nationwide vs. Colorado)• HOW was the poll conducted (random vs.
targeted, phone vs. Internet)

Polls
• Margin of Error– Maximum distance from the expressed value that the
true result should be– Expressed as +/- %– Why? The margin of error. In this case, the four
percent margin of error. That means that if you asked a question from this poll 100 times, 95 of those times the percentage of people giving a particular answer would be within 4 points of the percentage who gave that same answer in this poll.

Question 1
• .“Gallup Daily election tracking reports the percentage of registered voters who say they would support each candidate if the presidential election were held today.”
• In an October 10th poll 51 percent of registered voters said they would support Barack Obama while 41 percent said they would support John McCain. The margin of error is +/- 2.
• Considering the margin of error what is the lowest percent and highest percent of people who voted for Obama? For McCain?
• Take the percent polled and add the margin of error. Take the percent polled and subtract the margin of error.
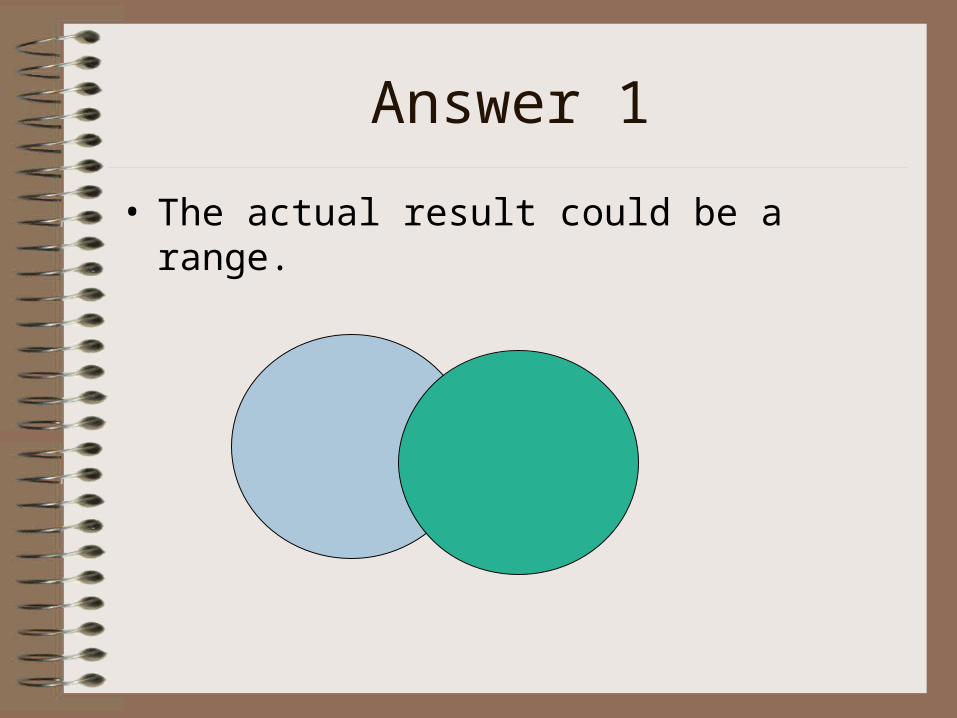
Answer 1
• The actual result could be a range.

Using polls in articles
• Always include margin of error when writing poll results in a story!
• Remember that sample size can affect Margin of Error: 400 people, margin of error ~ 5 %1000 people, margin of error ~ 3 %
• Political polls—often very close, margin of error can cancel out any apparent lead
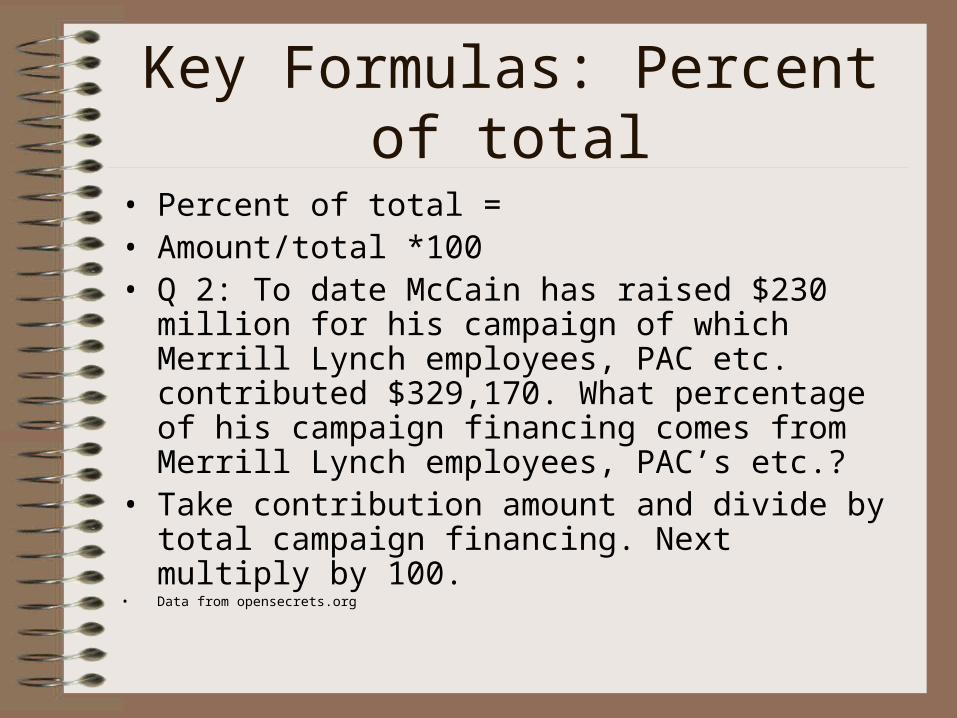
Key Formulas: Percent of total
• Percent of total =• Amount/total *100• Q 2: To date McCain has raised $230 million for his
campaign of which Merrill Lynch employees, PAC etc. contributed $329,170. What percentage of his campaign financing comes from Merrill Lynch employees, PAC’s etc.?
• Take contribution amount and divide by total campaign financing. Next multiply by 100.
• Data from opensecrets.org

Question 3
• Last year's city budget was $7,000,012. This year, you're told, the budget will be cut by 5 percent. How much will the budget be cut by (in dollars)?
• Take last years city budget and multiply by the percentage it will be cut. Make sure to change 5% to a decimal figure.

Key Formulas: per capita
• Per capita (often used with crime, murder, number registered voters etc.)
– Number of occurrences/Total population– Q4: In 2004 small- city had 58,000 registered voters and large-
city had 1,000,500 registered voters. Does this mean you’re less likely to meet a registered voter in small-town? Not quite…Small-city’s 2004 population: 102,000. Large-city’s 2004 population: 3,000,000 What’s the per capita registered voter rate?
– Small-city 2004 population: 102,000. Large-city 2004 population: 3,000,000
– What’s the per capita registered voter rate?– Number of registered voters divided by the towns population. Do this
for EACH town.
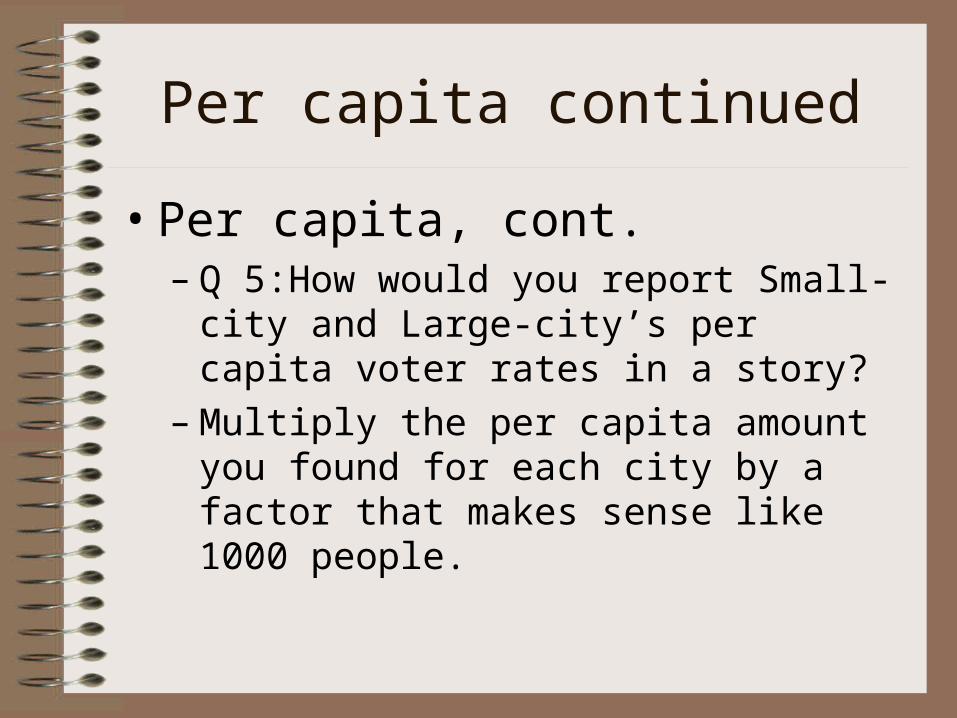
Per capita continued
• Per capita, cont.– Q 5:How would you report Small-city and
Large-city’s per capita voter rates in a story?– Multiply the per capita amount you found for
each city by a factor that makes sense like 1000 people.
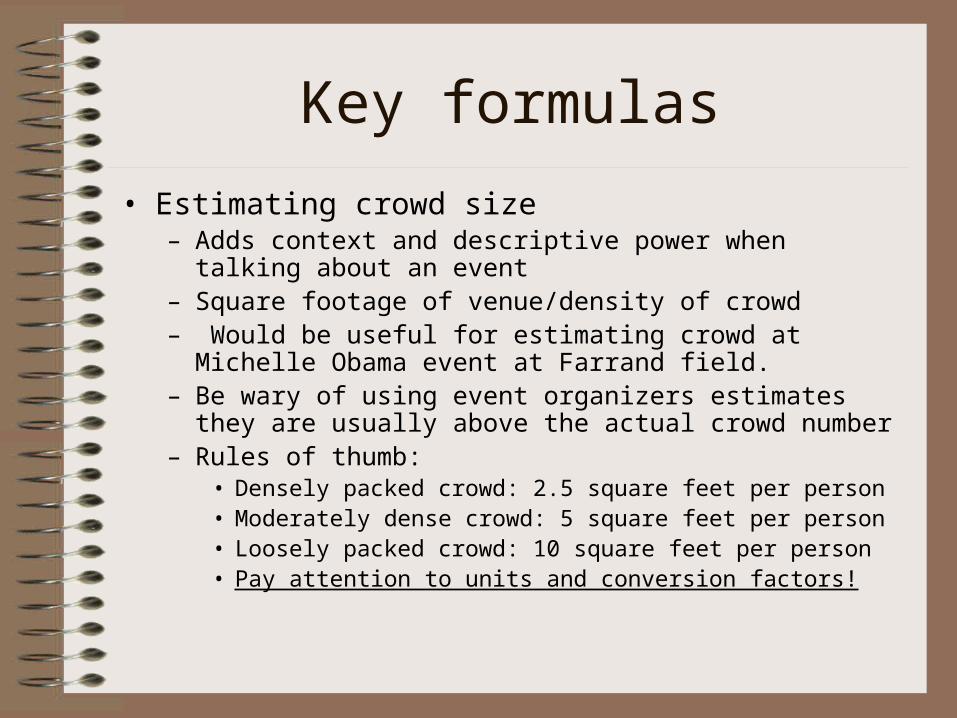
Key formulas
• Estimating crowd size – Adds context and descriptive power when talking about an event– Square footage of venue/density of crowd– Would be useful for estimating crowd at Michelle Obama event
at Farrand field.– Be wary of using event organizers estimates they are usually
above the actual crowd number– Rules of thumb:
• Densely packed crowd: 2.5 square feet per person• Moderately dense crowd: 5 square feet per person• Loosely packed crowd: 10 square feet per person• Pay attention to units and conversion factors!
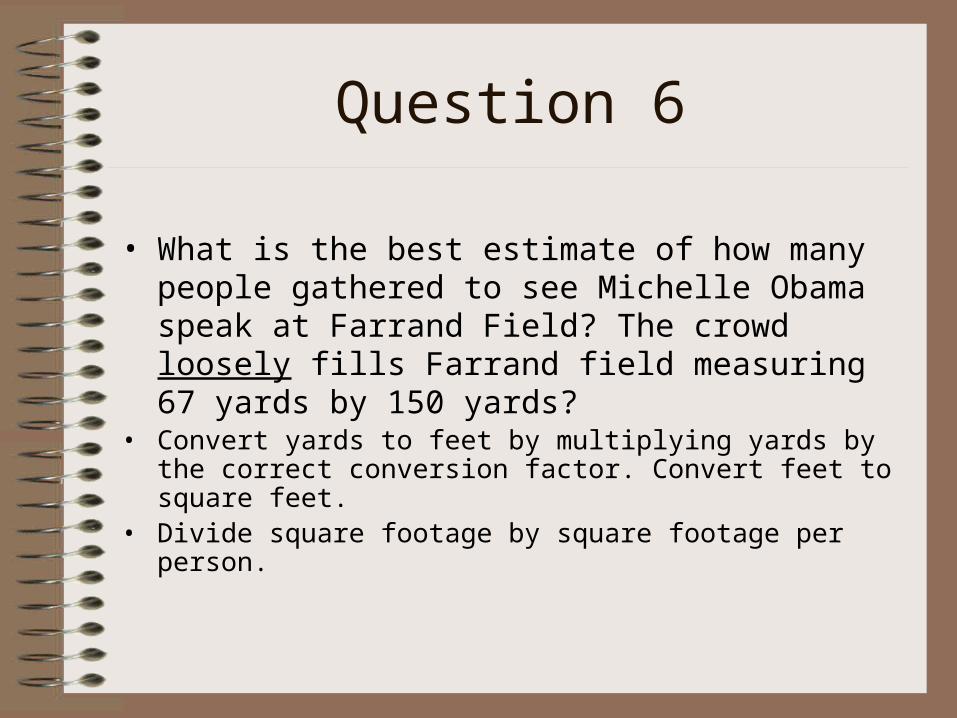
Question 6
• What is the best estimate of how many people gathered to see Michelle Obama speak at Farrand Field? The crowd loosely fills Farrand field measuring 67 yards by 150 yards?
• Convert yards to feet by multiplying yards by the correct conversion factor. Convert feet to square feet.
• Divide square footage by square footage per person.
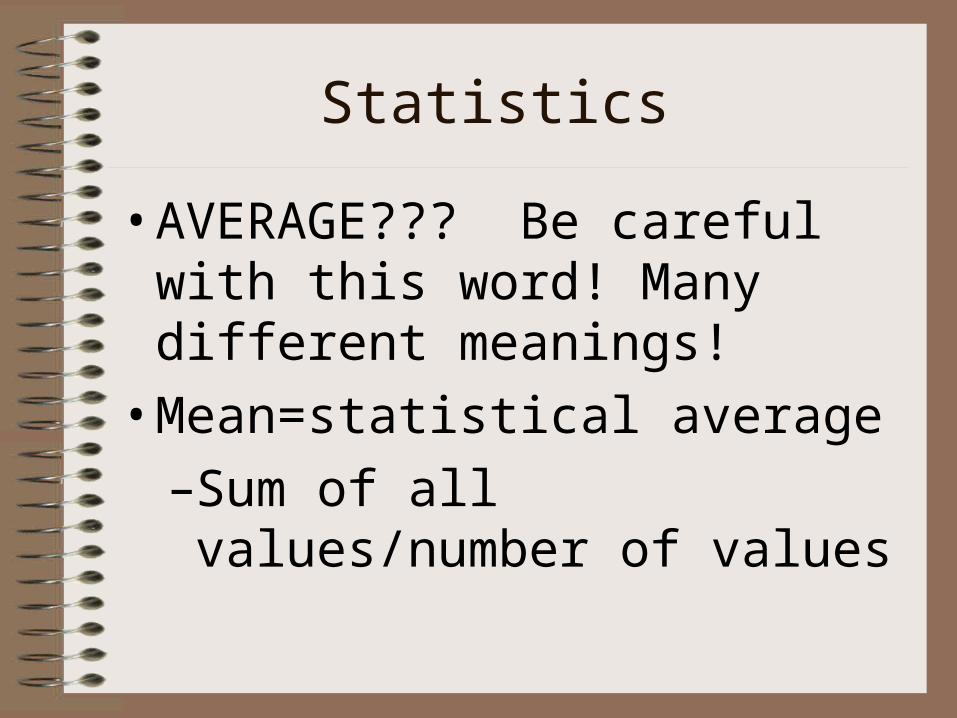
Statistics
• AVERAGE??? Be careful with this word! Many different meanings!
• Mean=statistical average
–Sum of all values/number of values

Question 7
• Barack Obama’s campaign received donations from many different groups of people. Lawyers/Law Firms donated $27,689,330, Retired donated $27,220,507, Education gave $12,222,365, Securities & Investment gave $10,847,652 and Business Services gave $7,451,886 to Obama’s campaign. What is the mean?
• Add up all the donations. Next, divide by the number of donations.

Statistics
• Median– The value in the middle
• $100,000; $50,000; $25,000; $15,000; $10,000• Median = $25,000• Often a better reflection of the range of values
• Cautions:– Mean can be skewed by what’s happening at the outer boundaries, but
median might not reflect changes happening in the high or low range– When looking at large sets of numbers use excel!
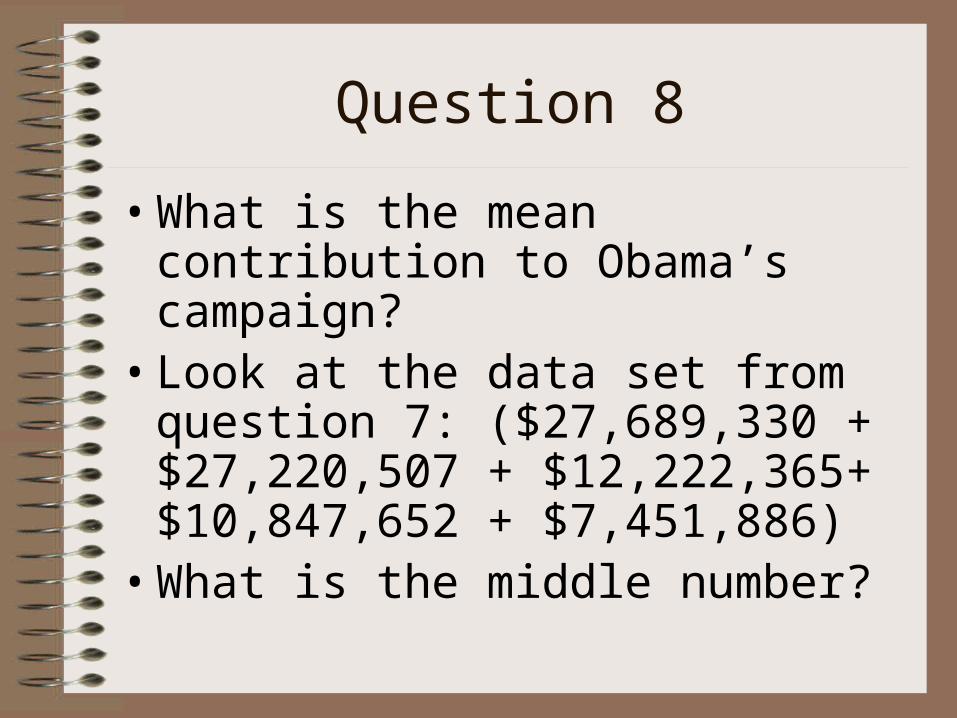
Question 8
• What is the mean contribution to Obama’s campaign?
• Look at the data set from question 7: ($27,689,330 + $27,220,507 + $12,222,365+ $10,847,652 + $7,451,886)
• What is the middle number?

Questions?
http://www.ire.org/education/math_test.html
Link to these questions and a few more to practice on
http://www.robertniles.com/stats/
Helpful site with good definitions

www.buffscar.synthasite.com


