53
Electives Electives Human and Human and Economic Economic
| Date post: | 18-Dec-2015 |
| Category: |
Documents |
| Upload: | miles-kelly |
| View: | 223 times |
| Download: | 0 times |

ElectivesElectives
Human and Human and EconomicEconomic

Today’s ScheduleToday’s Schedule 9.30 – 9.509.30 – 9.50 IntroductionIntroduction 9.50 – 11.009.50 – 11.00 Economic Elective 4Economic Elective 4 11.15 – 12.3011.15 – 12.30 Human Elective 5Human Elective 5 12.30 – 1.0012.30 – 1.00 LinkagesLinkages 1.00 – 2.001.00 – 2.00 LunchLunch 2.00 – 3.002.00 – 3.00 Examination Approach Examination Approach
and feedbackand feedback 3.00 – 3.303.00 – 3.30 Discussion Discussion 3.303.30 AdministrationAdministration

Geographical Skills Geographical Skills P. 23 SyllabusP. 23 Syllabus
Map interpretationMap interpretation Figure interpretationFigure interpretation Statistical analysisStatistical analysis Photograph analysisPhotograph analysis Figure drawingFigure drawing IT applicationsIT applications

Economic Elective Unit 4 Economic Elective Unit 4 P.20 P.20
GuidelinesGuidelines
Economic DevelopmentEconomic Development 16 16 periodsperiods
The Global EconomyThe Global Economy 20 periods20 periods Ireland and the European Ireland and the European
Union Union 11 periods11 periods Environmental Impact Environmental Impact 20 20
periodsperiods

Learning OutcomesLearning Outcomes
Ordinary LevelOrdinary Level DescribeDescribe uneven patterns in uneven patterns in
levels of economic levels of economic developmentdevelopment
TraceTrace the process of change the process of change in economic developmentin economic development
UnderstandUnderstand the development the development of a single interdependent of a single interdependent global economyglobal economy
Examine Ireland’s role as a Examine Ireland’s role as a member of EUmember of EU
Examine environmental Examine environmental impactimpact
Use listed skillsUse listed skills
ExplainExplain uneven patterns ---- uneven patterns ----
UnderstandUnderstand the process ----- the process -----
UnderstandUnderstand the impact of --- the impact of ---
AssessAssess Ireland’s role as a Ireland’s role as a member of the EU------member of the EU------
AssessAssess the environmental the environmental impact ---------impact ---------
Use listed skills -------Use listed skills -------

Human Elective Unit 5 Human Elective Unit 5 P.23 GuidelinesP.23 Guidelines
The Dynamics of The Dynamics of
PopulationPopulation 30 periods30 periods The Dynamics of The Dynamics of
SettlementSettlement 37 periods37 periods

Learning Outcomes Learning Outcomes P.27 SyllabusP.27 Syllabus
Ordinary LevelOrdinary Level Higher LevelHigher Level
UnderstandUnderstand population change population change Understand in detailUnderstand in detail .. ..
Describe impactDescribe impact of population of population Assess and Assess and evaluateevaluate varying varyingmovementsmovements impacts ….impacts ….
IdentifyIdentify problems associated problems associated Identify and analyseIdentify and analyse …..…..with growth of urban centreswith growth of urban centres
ExamineExamine rural and urban settlement patterns rural and urban settlement patterns
Understand and useUnderstand and use skills listed skills listed

AssessmentAssessment P.36 GuidelinesP.36 Guidelines
Three multipart questions (one to be Three multipart questions (one to be answered) on either Electives 4 and 5 answered) on either Electives 4 and 5 (including skills).(including skills).
Higher level Higher level 80 marks80 marks 20%20% 30 mins. 30 mins.
Ordinary levelOrdinary level 100 marks100 marks 25%25% 40 mins. 40 mins.

Elective Unit 4Elective Unit 4
Economic ActivitiesEconomic Activities

Economic DevelopmentEconomic Development
4.1 Distribution of economic activities4.1 Distribution of economic activities
- Gross National Product (GNP)- Gross National Product (GNP)
- Human Development Index (HDI)- Human Development Index (HDI)

DProviding services
for people
E Improving
people’s lives
AAll the industries in a country that
make and sell goods and services
BThe collecting of goods made by
nature
CMore secondary
and tertiary industry
FMaking goods
from raw materials.
Reviewing terms (Pg 2)
6 Development
2 Economic Growth 3 Tertiary Industry
4 The economy 5 Secondary Industry
1 Primary Industry

HDI Animation Courtesy UNDPHDI Animation Courtesy UNDP

Human Development Index (HDI)Human Development Index (HDI)
Composite IndexComposite Index Life expectancyLife expectancy Literacy and years spent in schoolLiteracy and years spent in school Standard of livingStandard of living
Values range from 0 to 1Values range from 0 to 1
Highest – Norway 0.956Highest – Norway 0.956
Lowest – Sierra Leone 0.273Lowest – Sierra Leone 0.273


Differences in HDIDifferences in HDI

HDI & GNI ActivitiesHDI & GNI Activities
Plot HDI ranks on world map (pg 3)Plot HDI ranks on world map (pg 3) Describing distribution of GNI (pg 3)Describing distribution of GNI (pg 3) Contrasting levels of HDI (pg 7)Contrasting levels of HDI (pg 7) Comparing HDI and GNP/GNI (pg 8)Comparing HDI and GNP/GNI (pg 8) Effect of Aids on HDI in AfricaEffect of Aids on HDI in Africa
(pgs 8 & 9) (pgs 8 & 9)

HDI versus GNPHDI versus GNP
HDIHDI Broader viewBroader view Social & economicSocial & economic Focused on peopleFocused on people Unpaid work Unpaid work
excludedexcluded Average hides Average hides
inequalityinequality
GNP/GNIGNP/GNI Narrow viewNarrow view EconomicEconomic Focused on Focused on
economyeconomy Unpaid work Unpaid work
excludedexcluded Average hides Average hides
inequalityinequality

Economic DevelopmentEconomic Development
4.2 Variations in levels of development4.2 Variations in levels of development Case studies of:Case studies of:
- Developed economy- Developed economyFootloose industryFootloose industryTourismTourism
- Developing economy- Developing economyColonialismColonialismTradeTrade

N atural
S ocial
E conomicW ho decides
Development Compass Rose (pg 10)

NaturalWhat river processes are likely to be at work?What soil types would you get in this area?How could natural processes affect peoples’ lives in this area
Who decides?What decisions have to be made?Who makes the decisions?What role does the government play in the area?
EconomicWhat natural resources are available? What infrastructure is present?How do the people make their living?What type of technology have the people?
SocialHow many people are there?Why are the people in a group?Who is doing the work?Who is relaxing?

Colonial Trade Colonial Trade (pg 24)(pg 24)

Colonial TradeColonial Trade
Imperial power Colony
Cheap Primary Products
Expensive Manufactured Goods
Money flow
Money flow

4.3 Globalization4.3 Globalization
A single interdependent global A single interdependent global economy has emerged with different economy has emerged with different
areas having different rolesareas having different roles

Exploring globalisationExploring globalisation
Sorting definitions Sorting definitions (pg 14)(pg 14)
Identifying key words Identifying key words (pg 14)(pg 14)
Examining dimensions of Examining dimensions of globalisation globalisation (pgs 16, 17, 18)(pgs 16, 17, 18)
Who benefits from globalisation?Who benefits from globalisation? Winners & losers activity Winners & losers activity (pg 14& 15)(pg 14& 15)
Multi-national company Multi-national company (pg 19 & 20)(pg 19 & 20)

Aspects of GlobalisationAspects of Globalisation
EconomicEconomic Social/culturalSocial/cultural PoliticalPolitical EnvironmentalEnvironmental


(pg 17)

(pg 18)

(pg 18)

(pg 17)

4.4 Ireland and the European 4.4 Ireland and the European UnionUnion
Statement:Statement:
Ireland as a member of Ireland as a member of the EU is part of a major the EU is part of a major trading bloc within the trading bloc within the global economy.global economy.

Ireland’s Trade within the EUIreland’s Trade within the EU
Map of EuropeMap of Europe• Fill in Countries & CapitalsFill in Countries & Capitals• Shade in Euro zone countriesShade in Euro zone countries• Shade in remaining EU countriesShade in remaining EU countries
Tables / Graphs of Trade figuresTables / Graphs of Trade figures• Read information from tables, graphs Read information from tables, graphs
and mapsand maps• Simple calculations with figuresSimple calculations with figures

Direction of Irish imports Direction of Irish imports (pg 21)(pg 21)

Direction of Irish exports Direction of Irish exports (pg 21)(pg 21)

Ireland: ExportsIreland: Exports Ireland: ImportsIreland: Imports
YearYearThousand Thousand
EuroEuro YearYearThousand Thousand
EuroEuro
19951995 35,330,08135,330,081 19951995 26,180,85626,180,856
19961996 38,608,92638,608,926 19961996 28,479,46328,479,463
19971997 44,867,97344,867,973 19971997 32,863,48832,863,488
19981998 57,321,81857,321,818 19981998 39,714,99539,714,995
19991999 66,956,20966,956,209 19991999 44,327,06444,327,064
20002000 83,888,90083,888,900 20002000 55,908,80055,908,800
20012001 92,689,90092,689,900 20012001 57,384,20057,384,200
20022002 93,675,20093,675,200 20022002 55,628,10055,628,100
20032003 81,995,10081,995,100 20032003 47,853,60047,853,600
Ireland’s Trade within the EU Ireland’s Trade within the EU (pg 23)(pg 23)

European trade flows European trade flows (pg 24)(pg 24)


Common Agricultural PolicyCommon Agricultural Policy Common Fisheries PolicyCommon Fisheries Policy Regional Development FundsRegional Development Funds Social FundingSocial Funding
Impact of EU on the Irish EconomyImpact of EU on the Irish Economy

NIGHT LIGHTS FROM EUROPEAN CITIESNIGHT LIGHTS FROM EUROPEAN CITIES
A satellite view of the night-time light emissions from cities, houses, industries and other light sources.
There is a strong correlation with market potentials and the regional levels of economic development measured – as usual- in terms of GDP per capita.
Source: C. D. Elvidge et alia, Photogrammetric Engineering and Remote Sensing, June 1977.

Income/Development LevelsIncome/Development Levels
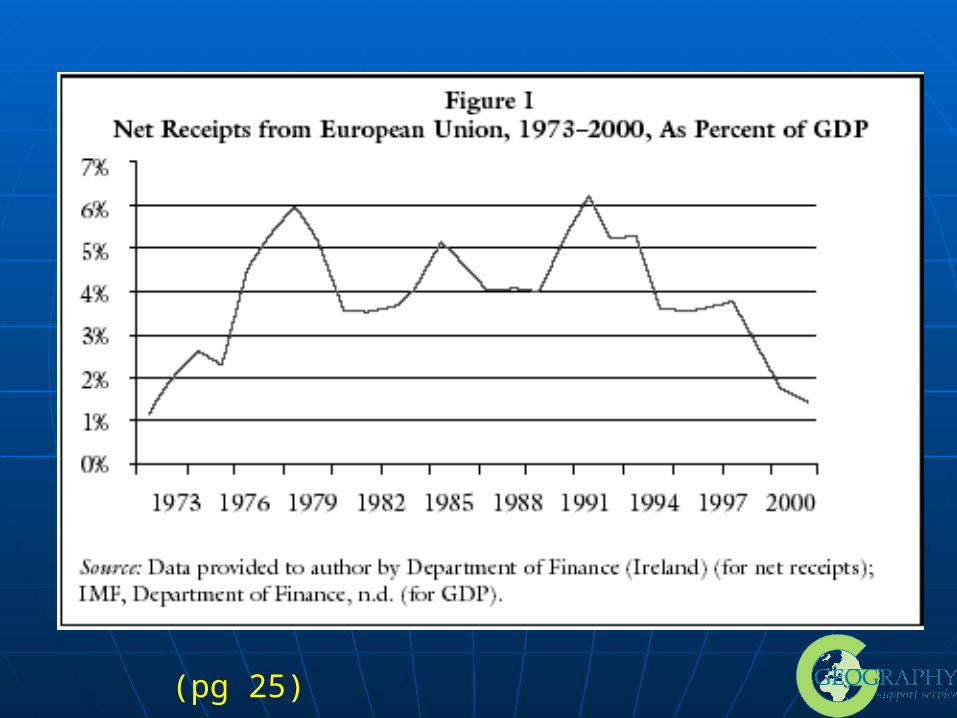
(pg 25)


BMW BMW (pgs 26, 27, 28, 29)(pgs 26, 27, 28, 29)

CAP: Common Agricultural PolicyCAP: Common Agricultural Policy New Policy comes into effect 2005New Policy comes into effect 2005
• Decouples payment from outputDecouples payment from output• Beef, sheep and cereal farmers will receive an Beef, sheep and cereal farmers will receive an
annual payment equal to the average they annual payment equal to the average they received in the three years 2000 – 2002received in the three years 2000 – 2002
• Quota system for beef, sheep and tillage will be Quota system for beef, sheep and tillage will be abolishedabolished
• Milk Quota system will be maintained but Milk Quota system will be maintained but support structure will be reduced with farmers support structure will be reduced with farmers receiving direct compensation for reduction in receiving direct compensation for reduction in supportssupports

CFP: Common Fisheries PolicyCFP: Common Fisheries Policy
1983 - Protection of Fish Stocks1983 - Protection of Fish Stocks• QuotasQuotas
Irish Quotas based on pre 1983 Irish Quotas based on pre 1983 catchescatches• 11% of EU Waters 11% of EU Waters • 5.8% of TAC Total Allowable Catch5.8% of TAC Total Allowable Catch
Expansion difficultExpansion difficult

4.5 Environmental 4.5 Environmental ImpactImpact
Statement:Statement:
Economic activities have an Economic activities have an environmental impact.environmental impact.

Topics for StudyTopics for Study
Use of renewable and non-renewable Use of renewable and non-renewable resourcesresources
Impact of using fossil fuelsImpact of using fossil fuels Use of alternative energy sourcesUse of alternative energy sources Environmental Pollution/ local/ Environmental Pollution/ local/
national/global national/global Sustainable economic developmentSustainable economic development Conflicts between economic and Conflicts between economic and
environmental interestsenvironmental interests

Greenhouse gas emissions Greenhouse gas emissions 1990=1001990=100
YearYearIrelandIreland 2008-2012 target2008-2012 target
19901990 100100 113113
19911991 102102 113113
19921992 104104 113113
19931993 103103 113113
19941994 106106 113113
19951995 108108 113113
19961996 111111 113113
19971997 117117 113113
19981998 120120 113113
19991999 124124 113113
20002000 128.3128.3 113113
20012001 131131 113113

Greenhouse gas emissions Greenhouse gas emissions (pg 29, 30)(pg 29, 30)
100.0102.0
104.0 103.0
106.0108.0
111.0
117.0
120.0
124.0
128.3
131.0
100
105
110
115
120
125
130
135
1990 1991 1992 1993 1994 1995 1996 1997 1998 1999 2000 2001
1990=100
Ireland 2008-2012 target

(pg 30)

RIVER WATER RIVER WATER (pg 31)(pg 31)
Graph 10.5 Ireland: River water quality, 1987-2000Graph 10.5 Ireland: River water quality, 1987-2000
% of channel length% of channel length
QualityQuality 1987-19901987-1990 1991-19941991-1994 1995-19971995-1997 1998-20001998-2000
UnpollutedUnpolluted 77.377.3 71.271.2 67.067.0 69.869.8
Slightly pollutedSlightly polluted 12.012.0 16.816.8 18.218.2 17.017.0
Moderately pollutedModerately polluted 9.79.7 11.411.4 13.813.8 12.412.4
Seriously pollutedSeriously polluted 0.90.9 0.60.6 0.90.9 0.80.8
TotalTotal 100.0100.0 100.0100.0 100.0100.0 100.0100.0

Water Pollution Water Pollution (pg 31)(pg 31)
CoastalCoastal• Oil SpillagesOil Spillages
Fish KillsFish Kills BeachesBeaches EtcEtc
InlandInland• Industrial EffluentsIndustrial Effluents
Fish KillsFish Kills Water QualityWater Quality EtcEtc
River Water Quality 1987 - 2000
0
20
40
60
80
100
1987-1990 1991-1994 1995-1997 1998-2000
Unpolluted
Slightly polluted
Moderatelypolluted
Seriouslypolluted
Source: Environmental Protection Agency
% of channel length


