June 2014, Volume 2, No. 1 (Serial No. 2), pp. 45-58 Journal of Traffic and Transportation Engineering, ISSN 2328-2142, USA Electric Buses in Urban Transport—The Situation and Development Trends Jakub Slavík Self-employed business consultant, Říčany u Prahy 25101, Czech Republic Abstract: A study called “E-mobilita v MHD” (e-mobility in urban mass transit) has been conducted by the author’s private consultancy to inform Czech public transport operators about the technologies and operational experience to date and stimulate the e-bus utilization as well as their involvement in e-bus research and development projects. The study covers trolley-buses, diesel hybrids and e-buses including fuel cell buses. These electric urban buses have been compared with combustion engine vehicles represented by diesel and CNG (compressed natural gas) buses, in terms of energy consumption and cost, greenhouse gas emissions, noise and life cycle cost. Relations between urban transport e-mobility and the “smart grid” concept have been presented as well. Comprehensive reports prepared on the European Union and the USA levels have been the basis for the study, completed by information from the field research, focused especially on the bus operational reliability and other parameters important for a transport operator and covering, interalia, 12 case studies. The results show electric buses as a promising urban transport mode with massive technology development overcoming their operational limitations. Synergies between electric buses and other urban systems, such as power supply, are notable as well. Key words: Electric bus, trolley-bus, fuel cell bus, charging, urban transport. 1. Introduction Electric powertrains for urban buses are undergoing fast development in both technological and market fields—however, not always noticed by their potential users, i.e., bus operators, and the public transport contractors. Many common stereotypes do not always apply any more, e.g., about “over-expensive” electric buses, “unreliable” diesel hybrids or “unproven” fuel cell buses. A study called “E-mobilita v MHD” (or “the e-mobility in urban mass transit” in English—hereafter “the study”) has therefore been conducted by the author’s private consultancy for the Czech Transport Company Association to inform the stakeholders about the electric bus development and stimulate their interest in these environment friendly vehicles and hence, the electric bus market. The key reason for conducting a new, separate study instead of just translating available documents from the Corresponding author: Jakub Slavík, MBA, principal consultant, research field: public transport. E-mail: [email protected]. European Union and the USA (e.g., Refs. [1, 2]) was that they were either rather general, not containing practical examples, or too much focused on a single powertrain type. Their results have also been somewhat mutually incomparable. Therefore, it was decided to adopt a managerial, rather than technological, approach to the problem and to adapt the used methodology to the readers—managers and other decision makers from operational practice and public administration. The results of the previously mentioned two key sources have been completed by findings from operational practice and put on a comparable basis as much as possible, preferring instructiveness to exactness if necessary. The study has been conducted in partnership with the following bus and electric equipment manufacturers: ABB, Cegelec, EVC Group, Siemens, Solaris, SOR, Škoda Electric and Volvo. The study partners provided the study with their latest product information and they also co-sponsored the study as DAVID PUBLISHING D
Transcript
June 2014, Volume 2, No. 1 (Serial No. 2), pp. 45-58 Journal of Traffic and Transportation Engineering, ISSN 2328-2142, USA
Electric Buses in Urban Transport—The Situation and
Development Trends
Jakub Slavík
Self-employed business consultant, Říčany u Prahy 25101, Czech Republic
Abstract: A study called “E-mobilita v MHD” (e-mobility in urban mass transit) has been conducted by the author’s private
consultancy to inform Czech public transport operators about the technologies and operational experience to date and stimulate the
e-bus utilization as well as their involvement in e-bus research and development projects. The study covers trolley-buses, diesel hybrids and e-buses including fuel cell buses. These electric urban buses have been compared with combustion engine vehicles represented by diesel and CNG (compressed natural gas) buses, in terms of energy consumption and cost, greenhouse gas emissions, noise and life cycle cost. Relations between urban transport e-mobility and the “smart grid” concept have been presented as well. Comprehensive reports prepared on the European Union and the USA levels have been the basis for the study, completed by information from the field research, focused especially on the bus operational reliability and other parameters important for a transport operator and covering, interalia, 12 case studies. The results show electric buses as a promising urban transport mode with massive technology development overcoming their operational limitations. Synergies between electric buses and other urban systems, such as power supply, are notable as well. Key words: Electric bus, trolley-bus, fuel cell bus, charging, urban transport.
1. Introduction
Electric powertrains for urban buses are undergoing
fast development in both technological and market
fields—however, not always noticed by their potential
users, i.e., bus operators, and the public transport
contractors. Many common stereotypes do not always
apply any more, e.g., about “over-expensive” electric
buses, “unreliable” diesel hybrids or “unproven” fuel
cell buses. A study called “E-mobilita v MHD” (or “the
e-mobility in urban mass transit” in English—hereafter
“the study”) has therefore been conducted by the
author’s private consultancy for the Czech Transport
Company Association to inform the stakeholders about
the electric bus development and stimulate their
interest in these environment friendly vehicles and
hence, the electric bus market.
The key reason for conducting a new, separate study
instead of just translating available documents from the
Corresponding author: Jakub Slavík, MBA, principal consultant, research field: public transport. E-mail: [email protected].
European Union and the USA (e.g., Refs. [1, 2]) was
that they were either rather general, not containing
practical examples, or too much focused on a single
powertrain type. Their results have also been
somewhat mutually incomparable.
Therefore, it was decided to adopt a managerial,
rather than technological, approach to the problem and
to adapt the used methodology to the
readers—managers and other decision makers from
operational practice and public administration. The
results of the previously mentioned two key sources
have been completed by findings from operational
practice and put on a comparable basis as much as
possible, preferring instructiveness to exactness if
necessary.
The study has been conducted in partnership with
the following bus and electric equipment
manufacturers: ABB, Cegelec, EVC Group, Siemens,
Solaris, SOR, Škoda Electric and Volvo. The study
partners provided the study with their latest product
information and they also co-sponsored the study as
DAVID PUBLISHING
D
Electric Buses in Urban Transport—The Situation and Development Trends
46
their promotion. Doing this, they accepted the author’s
requirements for the information content, structure and
relevance, to avoid “promotion stories” instead of
relevant facts. The operational data were supplied by
transport operators or found in publicly available
sources, such as project web sites.
The TOP-EXPO agency, together with the
Proelektrotechniky.cz portal operated by the author’s
firm, have been the study media partners, supporting
the wide presentation of its results.
The study has been made publicly available in
summer 2013. Now, about one year after the study’s
publishing, it is obvious that the study aim was met, as
the growing interest in electric buses by the Czech
operators and other stakeholders shows. There is also
much new information available since then (e.g., Ref.
[3] or new project information1), enough to update and
enlarge the study. The market will tell whether, when
and how this will be done.
2. Study Scope, Methodology and Input Data
2.1 Study Objectives, Scope and Methodology
As indicated in the introduction, the study’s primary
objective is to inform Czech public transport operators
and their owners about the electric bus technologies,
operational experience and expected development and
to stimulate the interest in e-bus operation and
involvement in the related development projects. The
broader objective is to inform Government bodies and
other important stakeholders concerned, through the
National Electro-Mobility Association, about the e-bus
strategic opportunities, together with the need for
1 Field data from the following sources: The Ministry of Transport, The National Association of Electro-mobility and Modern Technologies, The Czech Technical University in Prague—Faculty of Transportation Sciences, The Ostrava Transport Company, EKOVA ELECTRIC a.s., ÚJV Řež, a. s., the Prague Transport Company, Transport for London (the UK) and SunLine Transit Agency (USA); product and operational information from the study partners; published outputs of HyFleet: CUTE, 100 Bus Electriques and Trolley projects; dedicated media: Proelektrotechniky.cz, Fuel Cell Today, Railway Gazette International and Eltis.org. (altogether referred to as “the field data”).
resourcing from public funds.
This study objectives imply that the principal
approach to the problem solution has to be based on
strategic business management, as defined, e.g., by
Johnson et al. [4] and applied in the specific public
sector conditions, e.g., by Chapman and Cowdell [5].
In terms of this theory (as well as rich practice), the
study may be an important part of the strategic analysis,
both for the public service organizations concerned and
for private companies involved as suppliers.
Standard urban bus type (12 m or comparable) in
standard urban line operation has been under the study
key focus. Possible differences are explained below.
The vehicle industry market life cycle has been used
as the electric bus classification guideline:
Trolley-bus as a product in the mature market
stage;
Diesel hybrid bus as a product in the market
growth stage;
Electric bus (independent of catenary), both with
battery and/or capacitor energy storage and with fuel
cell as the primary energy source, as a product in the
market development stage.
To avoid misunderstandings, in this paper:
Electric buses using batteries and/or capacitors as
the only energy storages are called “e-buses”;
E-buses with energy storage capacity big enough
to be charged just once a day in the depot are called
“overnight e-buses” while e-buses with lower energy
storage capacity that need to be recharged also during
the day shift (often several times) are called
“opportunity e-buses”;
Electric buses using fuel cells as primary energy
sources (sole or in hybrid combination with batteries
and/or capacitors) are called “fuel cell buses” or
“fc-buses”;
Diesel hybrid buses, unless precisely specified,
cover both serial diesel hybrid buses (i.e., the diesel
engine generating power for traction motors and not
being directly coupled to the driving axle) and parallel
diesel hybrid buses (i.e., the driving axle powered
Electric Buses in Urban Transport—The Situation and Development Trends
47
either by a traction motor or by the diesel engine
through the mechanical gear).
Using the adopted theoretical background, the
problem under the study scope has been approached as
follows.
The service markets (or more precisely, market
segments related to the public transit market) relevant
to the electric buses under the study scope have been
defined first.
The electric bus powertrains have been then
described in technological and managerial terms, to
show the technology development as well as
limitations in relation to the public transport market
requirements.
The electric buses as defined above have been
compared among each other and with purely
combustion engine vehicles represented by diesel and
CNG (compressed natural gas) powertrains, in terms
of:
energy consumption;
fuel/traction power cost;
GHG (greenhouse gas) emissions and noise;
life cycle cost and its likely development;
operational reliability.
This comparison has been completed by operational
parameters such as range or reliability, as found from
particular field data2.
The relation between urban transport e-mobility and
the “smart grid” concept, very much relevant to electric
buses but reaching beyond the transport sector, has
been explained, based on most up-to-date information
from technological media as listed3.
Outcomes have been derived from the research,
focusing on long term perspectives and
recommendations for industries, transport operators
and funding public bodies.
2.2 The Information Sources
The basis for the study has been a comprehensive
2Ibid. 1, p. 46. 3Ibid. 1, p. 46.
report prepared on the EU level [1] (hereafter “EU
study 2012” and an annual report by the US
Department of Energy—The NREL (National
Renewable Energy Laboratory)) [2]. These sources
have been completed by information from transport
operators, manufacturers and dedicated project
sources4 listed together. This information is presented
as 12 case studies (see several shortened examples in
Appendix) and product factsheets, focused especially
on the bus operational reliability, the powertrain failure
percentage, the fuel or traction power consumption and
other parameters that are important for a transport
operator.
The numbers and figures from these sources are
mutually comparable in terms of their particular values
just in a very limited way, as different sources use
different calculation methodologies and just a few of
them cover the full range of parameters under the study
scope. Keeping the strategic managerial view is
therefore recommendable, rather than trying to get
exact outputs from inexact inputs. When doing so, it is
notable that most sources show the same or very
similar relations among the powertrains under the
study scope and the development trends.
3. Study Results
3.1 The Electric Bus Transport Markets
As defined above, the common urban bus transport
on regular routes as a segment in a broadly defined
passenger transport market is the key market under the
study focus. Serving this market is characterized by:
Serving routes with different traffic flows and
with the lengths ranging from single kilometers to tens
of them, with the overall daily mileage of about 200 km
to 250 km, depending on local conditions;
Operating in a dense street network with short
distances between stops that implies frequent
acceleration and stopping;
Adapting to daily and weekly peak and off-peak
4Ibid. 1, p. 46.
Electric Buses in Urban Transport—The Situation and Development Trends
48
demand periods;
The service availability, reliability and
punctuality against the timetable being the essential
service quality parameters, as perceived both by
passengers and the public service contractors;
Passenger ambience as another important focus,
to keep competitiveness with private motoring or other
relevant transport modes.
A 12 m low floor or low entry urban bus is the most
common vehicle for this market. Where the traffic flow
density is comparably lower or higher, an 8-9 m
midibus or an 18 m (or even 24 m) large bus are used
respectively.
Short (often loop) lines in historic urban centers,
often serving visitors, or dedicated shuttle services are
another market types, not wholly comparable with the
standard urban line operation as defined above. As
opposed to that, they have much shorter routes (usually
just single kilometers), less passenger demand, less
stops (especially in case of shuttle services) and a daily
mileage of about 50-100 km. Historically, electric
minibuses have been widely used to serve such markets
since late 1990s, e.g., in Italy. Although they are not
under the key study scope, some dedicated case studies
from these markets have been used to complete the
operational experience.
The vehicle industry market as defined in Section 2
can be seen as a supplier market in relation to this
service market.
3.2 The Energy Storage Sources
The traction batteries mostly use lithium-ion
technologies now. Earlier stage technologies, such as
lead-acid batteries or high temperature ZEBRA battery
(molten salt batteries) types have been used, especially
for electric minibuses. The traction battery concepts
are undergoing fast development to increase the power
density. However, the effective range for a standard
urban bus is still about 130-150 km, given the standard
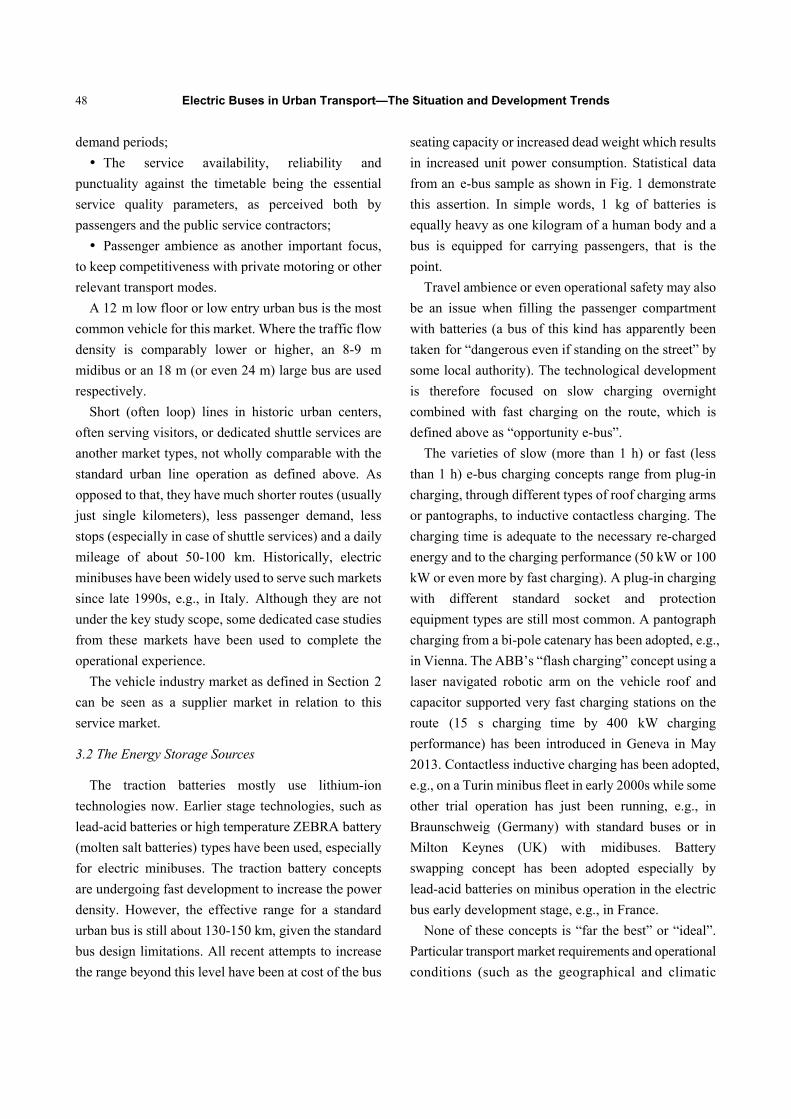
bus design limitations. All recent attempts to increase
the range beyond this level have been at cost of the bus
seating capacity or increased dead weight which results
in increased unit power consumption. Statistical data
from an e-bus sample as shown in Fig. 1 demonstrate
this assertion. In simple words, 1 kg of batteries is
equally heavy as one kilogram of a human body and a
bus is equipped for carrying passengers, that is the
point.
Travel ambience or even operational safety may also
be an issue when filling the passenger compartment
with batteries (a bus of this kind has apparently been
taken for “dangerous even if standing on the street” by
some local authority). The technological development
is therefore focused on slow charging overnight
combined with fast charging on the route, which is
defined above as “opportunity e-bus”.
The varieties of slow (more than 1 h) or fast (less
than 1 h) e-bus charging concepts range from plug-in
charging, through different types of roof charging arms
or pantographs, to inductive contactless charging. The
charging time is adequate to the necessary re-charged
energy and to the charging performance (50 kW or 100
kW or even more by fast charging). A plug-in charging
with different standard socket and protection
equipment types are still most common. A pantograph
charging from a bi-pole catenary has been adopted, e.g.,
in Vienna. The ABB’s “flash charging” concept using a
laser navigated robotic arm on the vehicle roof and
capacitor supported very fast charging stations on the
route (15 s charging time by 400 kW charging
performance) has been introduced in Geneva in May
2013. Contactless inductive charging has been adopted,
e.g., on a Turin minibus fleet in early 2000s while some
other trial operation has just been running, e.g., in
Braunschweig (Germany) with standard buses or in
Milton Keynes (UK) with midibuses. Battery
swapping concept has been adopted especially by
lead-acid batteries on minibus operation in the electric
bus early development stage, e.g., in France.
None of these concepts is “far the best” or “ideal”.
Particular transport market requirements and operational
conditions (such as the geographical and climatic
Fig. 1 Thconsumption capacity).
conditions, t
between serv
weighed a
parameters a
for money b
service contr
The fuel
PEM (proton
The term
identical wit
hydrogen po
in Berlin) or
experiencing
Supercapa
sometimes u
only) power
short perform
Hybrid co
and fuel c
considerably
demand for
3.3 The Trac
As Fig. 4
show the sa
consumption
actual value
consuming p
hybrid (an a
fuel cell and
0.020
0.018
0.016
0.014
0.012
0.010
0.008
0.006
0.004
0.002
0.000
Electr
he dependenc(the seat-km c
the distance
vices or the ro
against the
and cost, to d
both to the p
ractor.
cell mobile
n exchange m
“fuel cell po
th “hydrogen
owered combu
r, vice versa,
g their renaiss
acitors (als
used as addi
r storage, ma
mance require
ombinations
cell buses h
y energy savi
system integr
ction Energy
4 suggests, al
ame powertra
n, disregardi
es: a CNG
powertrain, f
average of the
d purely electr
y= 1E -
ric Buses in U
ce between rcover also the s
between stop
oad surface qu
technolog
deliver the be
passengers a
applications
membrane) co
owertrain” ma
n powertrain”
ustion engine
methanol fu
sance for veh
so “ultraca
itional (or, ex
anaging for th
ements on the
for both die
have been
ing concept, d
ration (Fig. 3
Consumption
ll the source
ain ranking by
ing the diffe
engine as t
followed by s
e serial and p
ric powertrain
- 06x2- 0.0004xR2= 0.744
Urban Transp
range and postanding passe
ps, the headw
uality) have t
gy performa
est possible v
and to the pu
s use mostly
oncept (Fig. 2
ay not be alw
as there are
e buses (used,
uel cells curre
hicle applicati
apacitors”)
xceptionally,
he very high
e bus moving
esel hybrid bu
employed a
despite their h
).
n and Cost
es under rese
y traction ene
ferences in t
the most ene
sole diesel, di
arallel concep
ns by e-buses
x + 0.0355
port—The Situ
ower
enger
ways
to be
ance
value
ublic
the
2).
ways
also
, e.g.,
ently
ions.
are
the
and
g off.
uses
as a
high
arch
ergy
their
ergy
iesel
pts),
s and
trol
gen
by t
inef
diff
fiel
the
data
the
Fig.Sour
Fig.cons
Fig.
5Ibid6Ibid
180%
160%
140%
120%
100%
80%
60%
40%
20%
0%
1/10
0k
md
iese
lequ
ival
ent
uation and De
lley-buses. T
neral powertra
the CNG pow
fficiencies i
ferences betw
d data are cau
operators as
a acquisition a
data source,
. 2 The PEM rce: ÚJV Řež, a
. 3 The hsumption [2]5.
4 The power
d. 1, p. 46. d. 1, p. 46.
Diesel (Pragueoperation averag
Diesel CNG
%
%
%
%
%
%
%
%
%
%
1/10
0 k
m d
iese
l equ
ival
ent
evelopment T
This just ref
ain physics in
wertrain are ge
in the com
ween the refe
used simply b
s well as dif
and processin
the results gi
fuel cell schema.s.
hybrid concep
rtrain energy co
e ge)
Diesel hybrid (Prague test operation)
Fue(H
CUT
T-bus Hybrid average
Energy consumption a
Hybrid combinations’ in
Trends
flects and c
n practice. Th
enerally caus
mbustion pr
erence study
by different c
fferent metho
ng. However,
ive a clear m
me.
pt influence
onsumption com
el cell only HyFleet: TE project)
Fuel cell hybattery (te
sample NR
Fuel cell
E-bus average
as a diesel percentage
nfluence on fuel consumpti
49
confirms the
e high values
sed by energy
rocess. The
[1] and the
conditions by
odologies for
disregarding
essage about
on the fuel
mparison [1]6.
ybrid est
REL)
FC batteries &supercaps
(TriHyBus)
Min. field value
on
EU study 2012
Max. field value
9
e
s
y
e
e
y
r
g
t
l
50
Fig. 5 The p
the powertr
comparison.
When pro
costs in the
sources (see
energy ineff
low cost (a
rather than b
higher than
hybrids, as
e-bus and t
particular e
compared to
3.4 The Env
As Fig. 6
considerably
well-to-whe
an average
most enviro
been used as
GHG emissi
depending o
on the p
conditions th
It is n
tank-to-whe
both concep
powertrains.
considering
electric pow
(CZ
K/k
m)
16.0014.0012.0010.008.006.004.002.000.00
Electr
powertrain ene
ains’ energy
.
ojected into
e Czech mar
e also in App
ficiency is pa
as influenced
by its produc
all electric
Fig. 5 show
trolley-bus in
e-bus light
o a standard d
ironmental Im
shows, the po
y in the well-t
el GHG emis
between the
nment-friend
s an all-Europ
ions. This ma
on their real p
particular po
hat may diffe
notable that
el GHG em
pts are lowe
. It is also im
the well-to
wertrains, the
Traction fuel/energ
ric Buses in U
ergy cost comp
y efficiencies
the fuel or
rket from th
pendix), the C
artially outwe
d by the nati
ction cost), bu
powertrains
ws. The diff
n this case r
design (see
design trolley
mpacts
owertrains un
to-tank, tank-
ssions. For th
most cost e
dly alternative
pean basis for
ay vary by par
power generat
ower gener
er from each o
both wel
missions by d
er than thos
mportant to se
o-tank GHG
ey are still m
gy cost per km, 12 m b
Urban Transp
parison.
in their mu
traction ene
he field resea
CNG powert
eighed by the
ional tax pol
ut it still rem
including di
fference betw
results from
e in Appen
y-bus.
nder research v
-to-wheel and
he study purp
effective and
e in Ref. [1]
r the well-to-
rticular count
tion structure
ration facili
other.
ll-to-wheel
diesel hybrid
se by the C
e that even w
G emissions
more environm
bus (descending orde
port—The Situ
utual
ergy
arch
train
fuel
licy,
mains
iesel
ween
the
ndix)
vary
d the
pose,
d the
has
tank
tries,
and
ties’
and
s of
CNG
when
by
ment
Fig.
Fig.
frie
pow
esp
elec
non
ave
stud
rela
F
low
with
elec
aux
abs
com
T
mod
deta
sum
app
frie
er) 1,4
1,2
1,0
8
6
4
2
(dB
)
uation and De
. 6 The power
. 7 The power
ndly, both
wertrains usin
ecially relev
ctric energy
n-carbon sour
erage. Newly
dy publishin
ations in gene
Fig. 7 shows t
w noise by us
h sole comb
ctric vehicles
xiliary device
olute silence
mbustion engi
The environm
des and pow
ailed research
mmarized, ne
pear to be mo
ndly in Euro
400
200
000
800
600
400
200
0
GH(20opt
(dB
)
evelopment T
rtrain GHG em
rtrain noise lev
locally and
ng combusti
vant for the
y mix (co
rce structure)
available inf
ng, such as
eral as well.
the noise leve
sing electric
ustion engin
s make alm
es and run
e when in m
ine vehicles.
mental influen
wertrains coul
h outside the
evertheless, t
ore energy e
opean condit
HG emissions g CO2 e030 forecast; power gtimum H2 production
Trends
mission compa
vel comparison
d globally,
ion engine o
Czech Rep
onsidering c
is very simil
formation sou
Ref. [3], co
el that, again,
powertrains
es. As obvio
ost no noise
very quietly
movement, as
nces by particu
ld be (and ar
e study scop
that electric
efficient and
tions, especia
equiv./km generation; average en structure)
arison [1].
n [1].
than those
only. This is
ublic whose
carbon and
lar to the EU
urces after the
onfirm these
confirms the
as compared
ous, standing
e except for
y yet not in
s opposed to
ular transport
re) subject to
pe. It can be
powertrains
environment
ally in urban
ecology/economy;
e
s
e
d
U
e
e
e
d
g
r
n
o
t
o
e
s
t
n
Electric Buses in Urban Transport—The Situation and Development Trends
51
transport regime as described above. There may be
differences in the particular values, depending on both
the transport operation parameters and the national
energy mix.
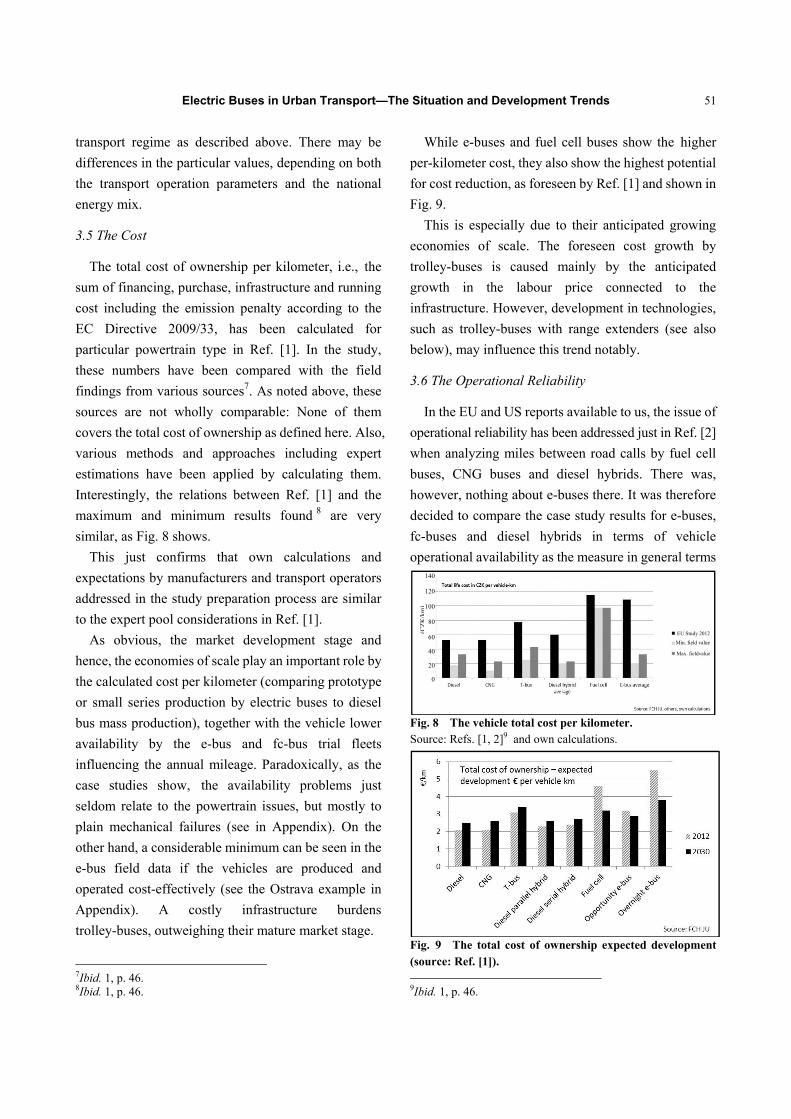
3.5 The Cost
The total cost of ownership per kilometer, i.e., the
sum of financing, purchase, infrastructure and running
cost including the emission penalty according to the
EC Directive 2009/33, has been calculated for
particular powertrain type in Ref. [1]. In the study,
these numbers have been compared with the field
findings from various sources7. As noted above, these
sources are not wholly comparable: None of them
covers the total cost of ownership as defined here. Also,
various methods and approaches including expert
estimations have been applied by calculating them.
Interestingly, the relations between Ref. [1] and the
maximum and minimum results found 8 are very
similar, as Fig. 8 shows.
This just confirms that own calculations and
expectations by manufacturers and transport operators
addressed in the study preparation process are similar
to the expert pool considerations in Ref. [1].
As obvious, the market development stage and
hence, the economies of scale play an important role by
the calculated cost per kilometer (comparing prototype
or small series production by electric buses to diesel
bus mass production), together with the vehicle lower
availability by the e-bus and fc-bus trial fleets
influencing the annual mileage. Paradoxically, as the
case studies show, the availability problems just
seldom relate to the powertrain issues, but mostly to
plain mechanical failures (see in Appendix). On the
other hand, a considerable minimum can be seen in the
e-bus field data if the vehicles are produced and
operated cost-effectively (see the Ostrava example in
Appendix). A costly infrastructure burdens
trolley-buses, outweighing their mature market stage.
7Ibid. 1, p. 46. 8Ibid. 1, p. 46.
While e-buses and fuel cell buses show the higher
per-kilometer cost, they also show the highest potential
for cost reduction, as foreseen by Ref. [1] and shown in
Fig. 9.
This is especially due to their anticipated growing
economies of scale. The foreseen cost growth by
trolley-buses is caused mainly by the anticipated
growth in the labour price connected to the
infrastructure. However, development in technologies,
such as trolley-buses with range extenders (see also
below), may influence this trend notably.
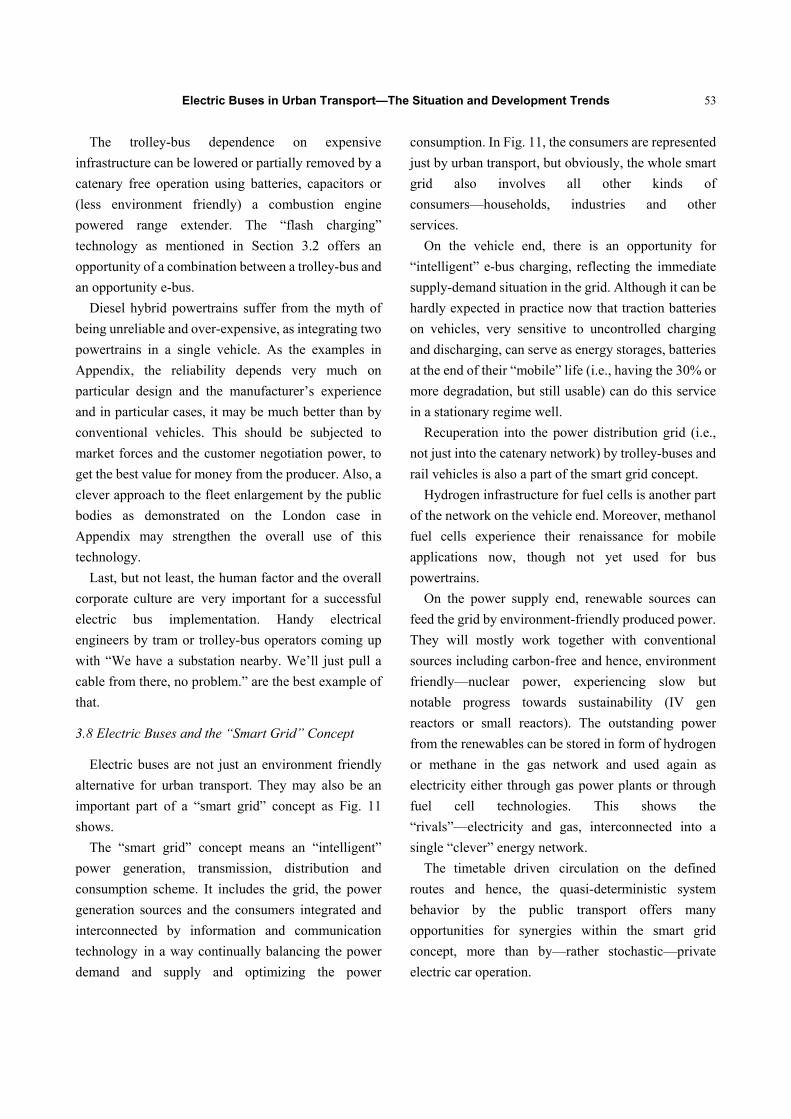
3.6 The Operational Reliability
In the EU and US reports available to us, the issue of
operational reliability has been addressed just in Ref. [2]
when analyzing miles between road calls by fuel cell
buses, CNG buses and diesel hybrids. There was,
however, nothing about e-buses there. It was therefore
decided to compare the case study results for e-buses,
fc-buses and diesel hybrids in terms of vehicle
operational availability as the measure in general terms
Fig. 8 The vehicle total cost per kilometer. Source: Refs. [1, 2]9 and own calculations.
Fig. 9 The total cost of ownership expected development (source: Ref. [1]). 9Ibid. 1, p. 46.
EU Study 2012
Min. field value
Max. fieldvalue
140
120
100
80
60
40
20
0
(CZ
K/k
m)
Electric Buses in Urban Transport—The Situation and Development Trends
52
(i.e., not precisely according to the technical definition
of “reliability”).
As Fig. 10 shows, all these vehicle types have
demonstrated a good availability at the upper levels of
the value ranges, fully comparable to conventional
vehicles. The least range, i.e., the least difference
between the best and the worst case, can be seen by
e-buses. This is caused especially by the e-bus
powertrain’s relatively simple design. The best
availability, but also the most significant difference
between the best and the worst case, can be seen by
diesel hybrids. This confirms the fact that these
vehicles can be very reliable, but it depends very much
on a particular design from a particular supplier. The
fc-buses are in the middle, influenced especially by two
factors: the fleets’ generally very small sizes and
mechanical problems as the most common reason for
unavailability—see above. Surprisingly or not, the fuel
cell itself has been the least vulnerable part of an fc-bus
powertrain.
This all shows that the electric bus reliability is
influenced especially by the particular vehicle design
and assembly rather than by the powertrain in general.
Also, marginal mechanical failures (such as a broken
outside mirror) may cause vehicle unavailability
negligible by large fleets but notable by a single
vehicle.
3.7 The Problems and the Solutions
Nothing in the world is ideal. However, each
problem is an opportunity for a new solution. This
applies also for electric buses.
The e-bus limitations given by their low daily range
due to the achievable power density by current traction
batteries can be resolved by charging on the route. This
results in the “opportunity e-bus” concept as defined in
Section 2.1. The daily range limitation can also be
removed by using e-buses on peak hour services with
intermediate recharging, as the Ostrava case in
Appendix shows.
Fuel cell buses are the other very promising electric
bus concept as the only catenary free electric
alternative having a single filling range comparable
with combustion engine powertrain. Bringing it into a
series production, however, still needs much research
and development as well as the hydrogen infrastructure
high initial investment.
Both e-buses and fc-buses as technologies in the
early development stage require much external
resources—human, technological and financial—for
industrial research and development, to be covered by
public bodies and by the industries. Regrettably,
public-private research and development projects of
this kind comprising research universities,
manufacturers and transport operators, as common in
Western Europe and the USA, are still rare in the
Czech Republic. The current EU and other
international programs and initiatives (such as the
Horizon 2020 or CIVITAS) motivating cities and other
related subjects to participate in such projects may
change this situation.
It should be stressed that transport operators’
participation in such projects is inevitable as no
laboratory can create realistic operational conditions
and generate the respective feedback data. This,
however, needs financial stimulation to the operators to
take the risk of a trial vehicle unavailability or
unreliability.
Fig. 10 The electric bus operational availability10. Source: field research.
10Ibid. 1, p. 46.
0%10%20%30%40%50%60%70%80%90%100%
E‐bus FC‐bus Diesel hybrid
Min. field value
Max. field value
E‐bus, fc‐bus and diesel hybrid operational availability
Fc-bus
Electric Buses in Urban Transport—The Situation and Development Trends
53
The trolley-bus dependence on expensive
infrastructure can be lowered or partially removed by a
catenary free operation using batteries, capacitors or
(less environment friendly) a combustion engine
powered range extender. The “flash charging”
technology as mentioned in Section 3.2 offers an
opportunity of a combination between a trolley-bus and
an opportunity e-bus.
Diesel hybrid powertrains suffer from the myth of
being unreliable and over-expensive, as integrating two
powertrains in a single vehicle. As the examples in
Appendix, the reliability depends very much on
particular design and the manufacturer’s experience
and in particular cases, it may be much better than by
conventional vehicles. This should be subjected to
market forces and the customer negotiation power, to
get the best value for money from the producer. Also, a
clever approach to the fleet enlargement by the public
bodies as demonstrated on the London case in
Appendix may strengthen the overall use of this
technology.
Last, but not least, the human factor and the overall
corporate culture are very important for a successful
electric bus implementation. Handy electrical
engineers by tram or trolley-bus operators coming up
with “We have a substation nearby. We’ll just pull a
cable from there, no problem.” are the best example of
that.
3.8 Electric Buses and the “Smart Grid” Concept
Electric buses are not just an environment friendly
alternative for urban transport. They may also be an
important part of a “smart grid” concept as Fig. 11
shows.
The “smart grid” concept means an “intelligent”
power generation, transmission, distribution and
consumption scheme. It includes the grid, the power
generation sources and the consumers integrated and
interconnected by information and communication
technology in a way continually balancing the power
demand and supply and optimizing the power
consumption. In Fig. 11, the consumers are represented
just by urban transport, but obviously, the whole smart
grid also involves all other kinds of
consumers—households, industries and other
services.
On the vehicle end, there is an opportunity for
“intelligent” e-bus charging, reflecting the immediate
supply-demand situation in the grid. Although it can be
hardly expected in practice now that traction batteries
on vehicles, very sensitive to uncontrolled charging
and discharging, can serve as energy storages, batteries
at the end of their “mobile” life (i.e., having the 30% or
more degradation, but still usable) can do this service
in a stationary regime well.
Recuperation into the power distribution grid (i.e.,
not just into the catenary network) by trolley-buses and
rail vehicles is also a part of the smart grid concept.
Hydrogen infrastructure for fuel cells is another part
of the network on the vehicle end. Moreover, methanol
fuel cells experience their renaissance for mobile
applications now, though not yet used for bus
powertrains.
On the power supply end, renewable sources can
feed the grid by environment-friendly produced power.
They will mostly work together with conventional
sources including carbon-free and hence, environment
friendly—nuclear power, experiencing slow but
notable progress towards sustainability (IV gen
reactors or small reactors). The outstanding power
from the renewables can be stored in form of hydrogen
or methane in the gas network and used again as
electricity either through gas power plants or through
fuel cell technologies. This shows the
“rivals”—electricity and gas, interconnected into a
single “clever” energy network.
The timetable driven circulation on the defined
routes and hence, the quasi-deterministic system
behavior by the public transport offers many
opportunities for synergies within the smart grid
concept, more than by—rather stochastic—private
electric car operation.
Electric Buses in Urban Transport—The Situation and Development Trends
54
Fig. 11 Electric buses and the “smart grid” concept.
The smart grid concept or the smart city concept
(when combining sustainable urban mobility,
sustainable built environment and the integrated
infrastructure) has already been experiencing trial
applications in various forms and various stages
worldwide. Moreover, most of the described
technologies are just available, either as a standard
commercial product (such as intelligent substations) or
as equipment undergoing extensive trial operation
(such as several “power-to-gas” projects).
It seems, however, that common technological
issues are not that crucial for implementing these
concepts in practice as business or purely human
issues.
For example, while an electric transit operator is
motivated to save electricity and the technology
enables that, the power producer and distributor, on the
contrary, wants to sell as much electricity as possible.
Thus, e.g., installing an intelligent substation may
threaten meeting the contractual obligations on the
transit operator’s end. Using the saved electricity for
charging other electric vehicles (such as e-buses) is a
good solution of that problem, applied in practice, e.g.,
in Vienna (see in Appendix).
Also, even environment aware consumers may be
very conservative to change their habits in everyday
practice, unless having a very good reason for doing so.
Not surprisingly, exploring suitable business models
is usually an important part of most related projects or
studies.
Data (or cyberspace) security as a separate (and
serious) problem package far beyond the study scope is
another key issue when implementing the smart grid or
smart city concept in a large scale practice. Simply
speaking, no one is really interested in allowing a
creative hacker (not necessarily a terrorist) to cause a
local black-out or another disaster when attacking the
information network being a part of the smart grid.
This can just show in a nutshell why these concepts
are not just a matter of suitable products and sufficient
budgets, but they need to be developed in their full
complexity.
Information about the smart grid or smart city
concepts and the related technologies is continually
followed by technological media as listed11.
4. Conclusions
The study has shown that although different sources
11Ibid. 1, p. 46.
(bi-directoral information flows in parallel with medis flows)
Hydrogen infrastructure
Gas
Electrolyser
Electric Buses in Urban Transport—The Situation and Development Trends
55
show different values, the principal conclusions for the
current state, development trends and future
opportunities of electric powertrains for urban
transport including urban buses are mutually in
accordance.
The electric powertrain technology develops very
fast and offers a big variety of opportunities for
particular transport market conditions and
requirements. It therefore needs to be continually
watched and assessed, to tailor the most suitable
technology and operational solutions for each
particular transport market conditions.
Opportunity e-buses (recharged on the route) and
fuel cell buses are the most promising bus technologies
for the future urban transport e-mobility in terms of
operational parameters, cost, environmental effects as
well as long term national energy strategies. They,
however, need much public as well as private
investment to the research and development.
Diesel hybrid buses are a developed product
competing to CNG buses in terms of costs and showing
better environmental parameters. They, as a product in
a developed market, should be sensibly supported
within urban public transport subsidizing processes,
leaving enough space to market forces to deliver the
best possible value for money.
Trolley-buses can use new energy storage and
charging technologies, to outweigh the disadvantage in
dependence on the catenary as well as high
infrastructure cost. The note about urban public
transport subsidizing applies here as well, considering
also the necessary infrastructure renewal.
Transport operators’ close participation in the
related research and development is necessary to obtain
real and reliable field data that cannot be supplemented
by laboratory tests. Such participation, however, needs
to be stimulated financially, to compensate for
inevitable operational risks caused to the operator by
unproven equipment. While such public-private
projects can be found in Western Europe and the USA,
they are still just a rare phenomenon in the
Czech Republic which, however, may change very
soon.
The electric urban transport (including electric buses)
involvement in the “smart grid” concept and the
resulting opportunities within as well as beyond the
transport sector should be carefully followed on the
government level and the concept development should
be supported by public funding or co-funding.
References
[1] Fuel Cells and Hydrogen Joint Undertaking. 2012. Urban
buses: Alternative powertrains for Europe. Fact-based
analysis of the role of diesel hybrid, hydrogen fuel cell,
trolley and battery electric powertrains.
[2] Eudy, L., Chandler, K., and Gikakis, C. 2012. Fuel Cell
Buses in U.S. Transit Fleets: Current Status 2012.
Technical report NREL/TP-5600-56406.
[3] Civitas WIKI Consortium. 2013. Civitas Policy Note: Smart
Choices for Cities—Clean Buses for Your City. Civitas
WIKI project report.
[4] Johnson, G., Scholes, K., and Whittington, R. 2008.