), I ;; , JOURNAL OF RESEARCH of the National Burea u of Standards-Co Engineering and Instrumentation Vol. 69C, N o. 4, October-D ecember 1965 Electric Currents and Potentials Resulting From the Flow of Charged Liquid Hydrocarbons Through Short Pipes M. R. Shafer, D. W. Baker, and K. R. Benson (June 21, 1965) Th e electri cal currents and potentials produced in pipes of interm ediate and very hi gh resistiviti es, by the fl ow of a c harged liquid hydrocarbon have bee n investigated. Th e maximum pipe c urr ents to the ground were in th e range 1 to 6 mi c roamp eres. Depending upon the elec tri ca l resistance of the pip es, these c urr ents produ ce d pote ntials ranging fr om esse ntially zero to values in excess of 30,000 volts which were s uffi ciently se vere to cause elec tri c al bre akd o wn and arcs within some of the pip es und er inves ti ga ti on. It is concluded that hazardous pipe potentials, resulting from static el ec· tn clty,ca n be eliminated in prac ti ca l applications if the electri cal res,stan ce from each and any portion of the IIlt erlO r s urface of the pipe to the ground does not exceed about 107 ohms. Key Words: Breakdown, charged liquid hydro ca rbons, charging tendency, c har ge se paration, current, filt ers, inner liner, petroleum liquids, potential, relaxa ti on, resis tan ce, static elec tric it y, tetraAuoroethylene tubin g. 1. Introduction The petroleum industry ha s long bee n con ce rn ed with the problem of static elec tricity r es ulting from the flow of relatively non co ndu cting liquid hydrocar- bons through pip es, filter s, and other components. Considerabl e lite ratur e is available which considers methods by which such c harges ar e produ ce d and the hazards arising from the intr oduction of electrically charged petroleum liquids int o r ece iving tanks , as frequently occurs during refinery and fueling operations. Problems related to the e lectrical currents and po- tentials produced in pip es and hos es through which c harged petroleum liquids flow have not been investi· gated thoroughly. Carruthers and Marsh (1)1 and Carruthers and Wigley [2] considered this problem recently and developed equations relating the currents and potentials produced with the electrical re sistance of the pipe, the electrical characteristics of the fuel and its velocity. Experimental checks wer e pe r- formed using pipes of essentially infinite and zero electrical resistance. Although thes e conditions were well suited for investigation s of charge relaxa- tion, ne 't her conditi on provided experime ntal veri· fication of the potentials produc ed in pip es having large, but not infinit e, valu es of elec trical resistan ce . Und er the sponsorship of the De partm ent of the Navy , Bureau of Naval We apon s, the Nat ional Bureau of Standard s ha s c ondu cted an inv es tigation to deter- mine the desirabl e elec trical resistance charac- 1 Figur es in br ac ke ts indi ca te the lite ratur e reference s on page 3 1 6. eris ti cs of hos es used to int e rconnect the various fu el handling components of air c raft and other internal combustion e ngin es . It is believed that so me of th e r es ults of the inv es tigation are of s uffi cie nt general int eres t for pr ese ntation here as they provide furth er experimental ve rifi ca tion of the theory and id eas pre- sented in [1] and [2] and their Discu ss ions. Th e experimental inv es tigations to be d escribed we re co nc e rn ed primarily with a dete rmination of the magnitude of electrical currents and voltages encountered in pipes of int e rm e diat e and very high r es istivities through whi c h elec trically c harged liquid petrole um flows. Th e pip es had a nominal inside diam e ter of 0.875-in. and lengths in the range of 20 to 48 in. Flowrates of 5 to 30 gal per minute were used with fuels having conductivities of 8 to 200 picomho per meter. Pipe currents to the gro und encompassed the range 10- 8 to 6 X 10- 6 A. De pend- ing upon the electrical resistanc e of the pip es, the se currents produced potentials ranging from esse ntially zero to values in excess of 30,000 V, which were suf- ficiently high to cause el ec tric al bre akdown and arcs within some of the pip es und er tes t. 2. Theoretical Considerations Consider a pipe of length L, as shown in figure 1, through which a relatively nonconducting liquid is flowin g at a mean axial velocity v. The liquid enter- ing the section mayor may not contain a significant initial charge qi per unit length of pipe which cor- responds to a convection current Ii = qiV entering the section under consideration. Likewise the liquid leaves the pipe with a charge qu per unit length of 307
Transcript
), I
;; ,
JOURNAL OF RESEARCH of the National Bureau of Standards-Co Engineering and Instrumentation Vol. 69C, No. 4, October- December 1965
Electric Currents and Potentials Resulting From the Flow of Charged Liquid Hydrocarbons Through Short Pipes
M. R. Shafer, D. W. Baker, and K. R. Benson
(June 21, 1965)
The elec trical c urre nts and pote ntials produced in pipes of intermediate and very hi gh resistiviti es, by the fl ow of a c harged liquid hydrocarbon have been investigated . The maximum pipe currents to the ground were in the range 1 to 6 microamperes. Depending upon the electrical resis tance of the p ipes, these c urrents produced pote ntials ranging from esse ntiall y zero to values in excess of 30,000 volts whic h were suffi cie ntly severe to cause electri cal breakdown and arcs within some of the pipes unde r investiga tion. It is concluded that haza rdous pipe pote ntials, resulting from s tati c elec· tnclty,can be eliminated in practi ca l applica tions if the elec trical res ,s tance from each and a ny portion of the IIlterlOr surface of the pipe to the ground does not exceed about 107 ohms.
Key Words : Breakdown, charged liquid hydrocarbons, char ging tende ncy, c harge separation, c urre nt , filt ers, inner liner, petroleum liquids , potential , relaxation, res is tance, stati c electri cit y, te traAuoroethylene tubing.
1. Introduction
The petroleum industry has long been concerned with the proble m of s tatic elec tri city resulting from the flow of relatively nonconducting liquid hydrocarbons through pipes, filters, and other components. Considerable literature is available which considers methods by which such charges are produced and the hazards arising from the introduction of electrically charged petroleum liquids into receiving tanks , as frequently occurs during refinery and fueling operations.
Problems related to the electrical currents and potentials produced in pipes and hoses through which charged petroleum liquids flow have not been investi· gated thoroughly. Carruthers and Marsh (1)1 and Carruthers and Wigley [2] considered this problem recently and developed equations relating the currents and potentials produced with the electrical resistance of the pipe, the electrical characteristics of the fuel and its velocity. Experimental checks were performed using pipes of essentially infinite and zero electrical resistance. Although these conditions were well suited for investigations of charge relaxation, ne 'ther condition provided experimental veri· fication of the potentials produced in pipes having large, but not infinite, values of electrical resistance.
Under the sponsorship of the De partme nt of the Navy, Bureau of Naval Weapons, the National Bureau of Standards has conducted an investigation to determine the desirable elec trical resistance charac-
1 Figures in brac ke ts indica te the lit e rature refe rences on page 3 16.
e ri sti cs of hoses used to interconnect the various fuel handling compone nts of aircraft and other internal combustion e ngines. It is believed that so me of the results of the inves tigation are of s uffi cie nt general interest for presentation here as they provide further experimental verifi cation of the theor y and ideas presented in [1] and [2] and their Discussions.
The experimental inves tigation s to be described were concerned primarily with a de termination of the magnitude of electrical currents and voltages encountered in pipes of intermediate and very high resistivities through whic h elec trically charged liquid pe troleum flows. The pipes had a nominal inside diameter of 0.875-in. and le ngth s in the range of 20 to 48 in. Flowrates of 5 to 30 gal per minute were used with fuels having conductivities of 8 to 200 picomho per meter. Pipe currents to the ground encompassed the range 10- 8 to 6 X 10- 6 A. Depending upon the electrical resistance of the pipes, these currents produced potentials ranging from essentially zero to values in excess of 30,000 V, which were sufficiently high to cause electrical breakdown and arcs within some of the pipes unde r tes t.
2. Theoretical Considerations
Consider a pipe of length L , as shown in figure 1, through which a relatively nonconducting liquid is flowing at a mean axial velocity v. The liquid entering the section mayor may not con tain a significant initial charge qi per unit length of pipe which corresponds to a convection current Ii = qiV entering the section under consideration. Likewise the liquid leaves the pipe with a charge qu per unit length of
307
f41 .. ---- L - --------..I-I
FIGURE 1. ELectric currents resuLting from the flow .of a fluid.
pipe causing an exit convection current I" = quV. As discussed in [1], the value of qu and hence Itt is dependent upon: the magnitude of l;, the resistivity of the fuel, the residence time, t , during which the fuel remains within the length of pipe , and the amount of charge separation which occurs at the fuel-pipe interface.
The equilibrium current Ip = Ii - I", flowing from the pipe to the ground, is a direct measure of the net rate at which charges are deposited on the interior surface of the pipe during passage of the fuel. It is conveniently measured by electrically insulating the pipe section from the remainder of the flow circuit and from the ground, and electrically connecting each end of this section to the ground through a suitable ammeter.
Convenient instrumentation for the direct measure of Ii is not available. However, when a chargeproducing component such as a microfilter is placed immediately upstream of the test section, the current If between the filter and the ground is approximately equal to l;. This filter current is conveniently measured by an ammeter if the filter is electrically insulated from the remainder of the flow circuit. Thus, If = Ii provided the fuel entering the filter is essentially uncharged.
The relation between I p and l;, as developed in the appendix, is
(1)
where 10 is the convection current that would emerge with the liquid from an infinitely long pipe under the same conditions. If Ii is caused by a filter placed immediately upstream from the test section and is large compared to 1o, then the relation
(2)
s hould be correct for the more severe charging conditions.
The term A. is the ratio of resistance time, L/v, of the liquid in the pipe to relaxation time, T, of the liquid. Relaxation time is the time required for the charge existing in the stationary fuel to be reduced 63 pen;ent in magnitud e by electrostatic forces.
Con sidering a pipe grounded at each end, an ap· proximate relation for the maximum potential devel-
oped on the pipe wall, as a result of current I p , is
(3)
where RT is the end-to-end resistance. Commencing with an expression from [1] for the voltage developed on the pipe wall at any distance from the inlet, this relation has been developed in the appendix subject to the following assumptions:
(a) The ratio A. has numerical value less than 6. (b) The electrical resistance RT of the pipe is small
compared to that of the liquid contained within the pipe.
The constant 0.1 of eq (3) varies through the approxi· mate range 0.08 to 0.13 for values of A. < 6. Values of 'A > 6 are encountered only with long pipes , fuel of very high conductivities, or very low fuel velocities for which conditions nearly all of the separation of charges, qi, occurs near the entrance of the pipe. Values of 'A < 6 are those normally encountered during the flow of liquid petroleum products, and a constant factor of 0.1 can be selected for this range of A. with little sacrifice in accuracy.
The assumption that pipe resistance R1' is small compared to that of the liquid within the pipe is valid for pipes having resistances no greater than 1010 n per linear inch of length even when fuels having conductivities as large as 200 pmho/m are involved. Pipes having higher electrical resistances are not considered desirable because of the possibility of electrical discharges resulting from the extremely high voltages produced. Thus, it is believed the assumptions involved in deriving the approximate relation expressed in eq (3) are valid as far as practical applications are concerned.
It is of interest to note that eq (3) is essentially identical to the relation V max = 0.106(Ii - Io)RT which was presented by Dr. Klinkenberg in the Discussion of [2].
Data were obtained during these experiments which verifies eqs (2) and (3) using pipe specimens having R-l' values in the range zero to 1010 n. Also, the influence of the electrical resistance of the pipe on the current Ip was investigated; and the electrical breakdown phenomena which occur when large values of Ip are encountered in pipes having extremely high values of RT were observed.
3. Experimental Apparatus
The flow circuit, shown in figure 2, included a supply tank containing 50 gal of naptha and a centrifugal pump of 30 gpm capacity. The flow then passed through a suitable flowmeter into the micro filter used for the generation of the initial charge qi. A by-pass valve was installed to provide a method of directing the flow through or around the filter as desired. The pipe sample under test was connected immediately downstream from the filter and the fuel then returned through a flow control valve to either the supply or receiver tank as desired. Each end of the pipe sample, as well as the entrance connection to the
308
>
1
filte r, was electrically insulated from the flow sys te m by short lengths of nonconductive te trafluoroe thyle ne (TFE) tubing. Short adapte rs, of me tal tubing, were used as connectors be t wee n t he e nd s of th e tes t pipe and the insulating tubin g. They were inse rted into the ends of the tes t pipe to a de pth of about one inc h, thus formin g int e rnal e lectrodes. Th ese two electrodes were elec tri cally connec ted to eac h other and to the ground through an ammeter for the meas· urement of If). Like wise , the filter was connected to the ground through another ammeter for the meas· urement of If. All other portions of the flow system were constructed from conductive materials and grounded as in normal service.
The liquid used throughout the tests was a waterwhite , hydrocarbon naptha designated as MIL-F-7024A, Type II. This naptha has a 60/60 of specific gravity of 0.771 , a kinematic viscosity at 80 of of about 1.2 centistokes , an initial distillation point above 300 of, and a flash point above 100 of . Th e electric al conduc tivity of the naptha as received , in 55-gal drum s, at our laboratory is about 1 pmho/m. Co ntaminants we re added to obtain the apprec iable filter charging effects required.
Two differe nt filt ers we re used . Each had an exte rnal me tal body conta inin g a phe noli c resin impregnated pape r elf' me nt. On e filt er had a 25-,um s ize element of a pleated des ign containin g a total of 35 pleats I -in. dee p by 4.5- in . long givin g a total filte r s urface area of about 300 in.2 The no min al fl ow rating of thi s e leme nt was 25 gpm with a fu el of 1 ce ntis troke vi scos it y. Th e seco nd filt. e r had a 10-,um s ize ele me nt of a s tac ked-pape r was he r des ign hav ing a le ngth of 4 in ., an outside diame te r of 1.5 in ., giving a total filt e r surface a rea of about ] 8 in .2 Thi s e leme nt had a nomin al fl ow ra tin g of 5 gpm with a fu el of 1 centi s toke vi scos it y. Both of th ese filter s and their ele me nts were id enti cal in s ize a nd design to those commonly used in fu el sys te ms of some internal combus tion e ngin es.
The amm eters used for the meas ure ment of hand Ip were multipurpose elec trome ters having a range 10- 13 to 3 A full scale. The voltage drop of these instruments ne ve r exceeded I V durin g the me as ureme nt of c urren t.
~-W -SUPPLY
TANK
T
FI GU RE 2. Diagrarn of the flow circuit.
RECEIVER TANK
Pipe pote ntials of less than 100 V were measured with a multipurpose elec trometer having a resistance to ground of the order of 1014 D. Voltages in the range 100 to 10,000 V were meas ured with electros tati c voltme ters havin g res is tances to ground of the order of 10 16 D. No atte mpts were made to me asure pote ntials exceeding 10,000 V as corona effec ts with the resulting breakdown of res is tance were always encountered in this region.
Pin-type probes were con struc ted for the measurement of the potentials developed on t he inner surfaces of the pipe walls . As will be di sc ussed in de tail, the test specime ns we re te trafluoroe thyle ne (TFE) tubing containing an inn er lin er of intermediate resistivity and having a total wall thi ckness of 0.040-in. The probes contained pin points about 0.06-in. long and were inse rt ed through the tubin g from the outs id e, thus puncturin g and making electri cal contac t with the inside conduc tive ]j ner of the pipe. Two pins pierced the wall at e ac h probe location.
Fuel conductiviti es were de termin ed by a co nductivit y cell construc ted .in acco rdance with fi gure 8 of refe re nce [3 1. Th e ac tual plat.e se parati on was 7.9 mm. A cons tant tes t pote ntial of 150 V dc was used res ultin g in a tes t putential gradi ent of 19 V/ mm. Signifi cant polari zation was obtained durin g t he de te rmination of fuel co nduc tiviti es as e vide nced by a considerable and co ntinuous decr ease in curre nt with time unde r th e condition of a cons tant appLi ed voltage. For co mparative purposes , the c urre nt used to comput e fu el conduc tivit y was that occurrin g 30 sec aft e r a ppl yin g the tes t voltage to th e cell. Expe ri e nce with thi s and othe r method s of conducti vity measurement indicates that the de te rmination of fuel conduc tivity is not an ex ac t art..
4. Test Specimens
The pipe samples used durin g th e inves tigation had nominal insid e diame te rs of 0.875- in. and the ir le ngth s we re in th e range 20 to 48 in. On e sample was a 22- in . length of s tainless s teel tubing whi c h for purposes of thi s inves ti gation is consid er ed to have zero elec tric al res istan ce. All of t he othe r sam pIes were formed from the th ermoplas ti c te trafluoroe thylene (TFE) which in a pure s tate has a volume res istivit y > 1018 D-c m. Eac h sample of TFE pipe had a wall thickness of about 0.040-in . The die lec tri c s tre ngth of the pure TFE was s uc h th a t electri cal breakdown would not occ ur whe n a pote ntial of 30,000 V de was applied ac ross the wall.
Experime ntal samples of intermediate resistivit y TFE tube were produced for use in thi s inves tigation by me mbers of the aircraft hose indu s try. These diffe red from cOllve ntiona l, pure TFE in that eac h contained an inne r layer to whic h s mall amounts of carbon had bee n added. This resulted in an inner liner of moderate conductivity , about O.OlO-in. thi ck, extending the full length of the pipe and attached to and s urrounded by an outer wall of nonconductive TFE about 0.030-in. thick. Thus, electrical conduction was in the longitudinal direction only.
309
en :; I o
lll:
lO" r---------.--------.--------~--------~
108 L-________ L-______ ~ ________ ~ ________ ~
TEST CURRENT, AMPERE
FIGURE 3 .. End-t~-end resistance of two samples of TFE pipe with carbon £nner liners showing the variation in resistance with current.
o Sample A. • Sample B
Pipes made in this manner have a voltage dependent, nonlinear, electrical resistance which tends to decrease appreciably with increased potential gradient. Thus, in performing tests to determine the ohmic resistances of the samples, it was found that current is a nonlinear function of the applied voltage. Typical results of end-to-end resistance tests of two of the pipe samples, 36 in_ long, are shown in figure 3. These resistance values were obtained by applying selected constant test potentials across the pipe sections and measuring the resulting current. Unless stated otherwise, RT values listed in this paper are those obtained with a test current of IJLA.
5. Tests and Results
5.1. Fuel Contamination and Filter Charging Tendency
Initial tests were conducted to investigate the relation between fuel contamination and the charging tendency of paper micro filters. The flow circuit, as shown in figure 2, utilized a two-tank system to enable use of one tank for supply and the other as a receiver. This system is desirable for experiments with fuels of low conductivities as it ensures uncharged fuel entering the pump inlet line. Thus, service operating conditions are duplicated closely. In these tests, a 48-in. length of semiconductive TFE tube (RT= 50MD) was used as the pipe sample, and the filter current, h, and pipe current /p to the ground were measured.
The naptha had an initial conductivity of about 1 pmho/m. The two contaminants investigated were asphaltenes and a commercial antistatic compound (ASC). Fuel conductivities in the range 2 to 200
pmho/m were obtained by varying the concentration of these two materials. The asphaltenes were dispersed quickly and evenly throughout the test naptha by first dissolving in isopropylbenzene (Cumene). In order to generate large charging currents, these initial tests were performed with the 5-gpm stacked paper filter at a flowrate of 8 gpm through the filter. This corresponds to an average velocity of 4 ft/sec across the section of the 0.875 i. d. TFE pipe specimen.
The results of the stacked-paper filter charging tendency tests are shown in figure 4, a plot of filter current versus the fuel conductivity. Contamination with asphaltenes gave very significant filter charging currents with fuel conductivities above 10 pmho/m. The maximum charging tendency obtained by contamination with the antistatic compound (ASC) was only about 1/25 of that obtained with the asphaltenes under identical test conditions. Also, with the ASC contaminant, charging tendency decreased rapidly to a low value as conductivity exceeded 100 pmho/m. One additional point on figure 4 shows the effect of adding a small amount of the ASC to the asphaltenes mixture having an original conductivity of about 200 pmho/m. A considerable decrease in charging tendency was noted with a relatively small increase in fuel conductivity.
The charging tendency of the napthas containing the asphaltenes and ASC contaminants were also studied using the apparatus described on page 50 of reference [3]. Briefly, this provides a method of determining the amount of electric charge produced as a fuel flows by gravity through a steel capillary having an inside diameter of 3 mm and a length of
3 x 10⁻⁶,-______________ ,-______________ ....-____ ---,
W Il: W Q.
~ <!
....... Z W Il: II: ::> o Il: W
~ ii:
108 L-____________ ~ ____________ ~~ __ ~
I 10 100 300 FUEL CONDUCTIVITY, PICOMHOI METER
FIGURE 4 . Charging tendency of a stacked-paper jilter at a constc:nt flowrc:te of 8 gpm showing the influence of fuel conductivity wah two different fuel contaminants.
0.5 m. No relationship was found to exist between charging tendencies obtained with the paper filter as compared to those obtained using the steel capillary. In fact, the ASC contaminant gave approximately the same charging tendencies in th e steel capillary as was obtained with asphaltene contamination.
Also in tests of other fuels having conductiviti es of 84 and 165 pmho/m caused by unknown contaminants, relatively insignificant charging tendencies
~ were indicated by tests with the steel capillary while extremely large charging currents were obtained when the same fuels flowed through paper microfilters.
f
>
)
r
I
Thus , the investigation of the relation between contamination , fuel conductivity, and charging tendency showed that the charging tendency of a given liquid hydrocarbon is not related to fuel conductivity alone. Rather, as might be expected, it is dependent upon both the material and the amount of the con-taminant in the liquid and upon the wall material at the liquid-wall interface . The investigation also showed that maximum charging tendency in microfilters will likely occur when fuel conductivity exceeds 10 pmho/m .
5.2. Preliminary Tests With Various Pipe Samples
Preliminary experiments were conducted with various pipe samples to determine: (a) the magnitude of pipe currents to be expected from pipes ins talled immediately downstream from the microfilters; (b) the influence of Aowrate upon these pipe currents; and (c) whether the elec trical conductivity of the pipe had a significant influence upon these curre nts. Fuel having a conductivity of 165 pmho/m was used throughout the preliminary tes ts. Pipe c urrent, I p , was measured, but unfortunately , the filter current, h, was not measured during the preliminary tes ts. However, an effort was made to keep the test conditions the same as the different pipe specimens were investigated. Thus, it can be assumed that the convection currents, l;, entering the different test specimens were approximately equal at identical flowrate conditions. Only the pleated·paper filter was used during these tests. The filter by-pass valve in figure 2 was closed; thus all flow passed through the filter.
The pipe specimens selected for the preliminary tests all had a le ngth of 22 in. These included a stainless steel tube and two samples of TFE pipe containing carbon inner liners having Rr values of 106 and 109 D. Voltage measure me nts were not made and the pin·type probes were not applied to the test samples.
The results of the preliminary tests are shown in figure 5. It is seen that Ip increased significantly with flowrate and that the larges t values observed were in the range 2 to 6 }LA. Also, the pipe currents were about equal in magnitude for all values of pipe resistance investigated. Thus, it was verified (as might be expected) that pipe resistance has very
:. little influence, if any, upon the rate of relaxation of charges from the charged fuel to the walls of the pipe.
c
w 10- 6 --
cr w a.. :::< <l
~ 2 w cr cr :::> <)
w a.. CL Rp OHMS
10-7 x STEEL 0
o TFE WITH LINER 10 6
C TFE WITH LINER 109
4x 10⁻⁸ L-__ -'--__ ---'-_________ ---l
5 10 15 20 25 30 FLOW, gpm
FIGURE 5. Current to the ground from pipes of different resistiv· ities, as influenced by fiowrate (each pipe 22·in. long installed downstream from a pleated·paper jilter, fuel conductivity 165 pmho/m) .
5.3. Electrical Breakdown in Nonconductive Pipes
Whe n a nonconductive TFE pipe sample 22·in. long, was inserted in this same flow circ uit, electrical sparks and other discharges occurring from the sample were observed. Also pinhole punctures appeared in the walls of the sample through which fuel slowly seeped to the atmosphere. The conditions leading to the electrical breakdown of the pure TFE pipe follow.
An unpunctured, translucent sample of bare TFE pipe 22·in. long, wall thickness 0.040-in., was installed downstream from a paper micro filter. The sample was electrically insulated from the remainder of the flow system by short lengths of TFE tubing. Short metal adapters were inserted between each end of the sample and the insulating tubing. These two adapters were electrically connec ted to each other and to the ground. A probe for measuring electrostatic potential was installed on the outside at the center of the sample. This consisted of a TFE in· sulator bushing, O.25-in. wall thickness, having an aluminum foil strip wrapped around the exterior and connected to an electrostatic voltmeter. There was no other grounded metallic object close to the TFE pipe.
With the room darkened so electrical discharges could be seen more readily and using a fuel having a conductivity of about 165 pmho/m, flow through the system was quickly adjusted to 15 gpm at 25 psig.
311
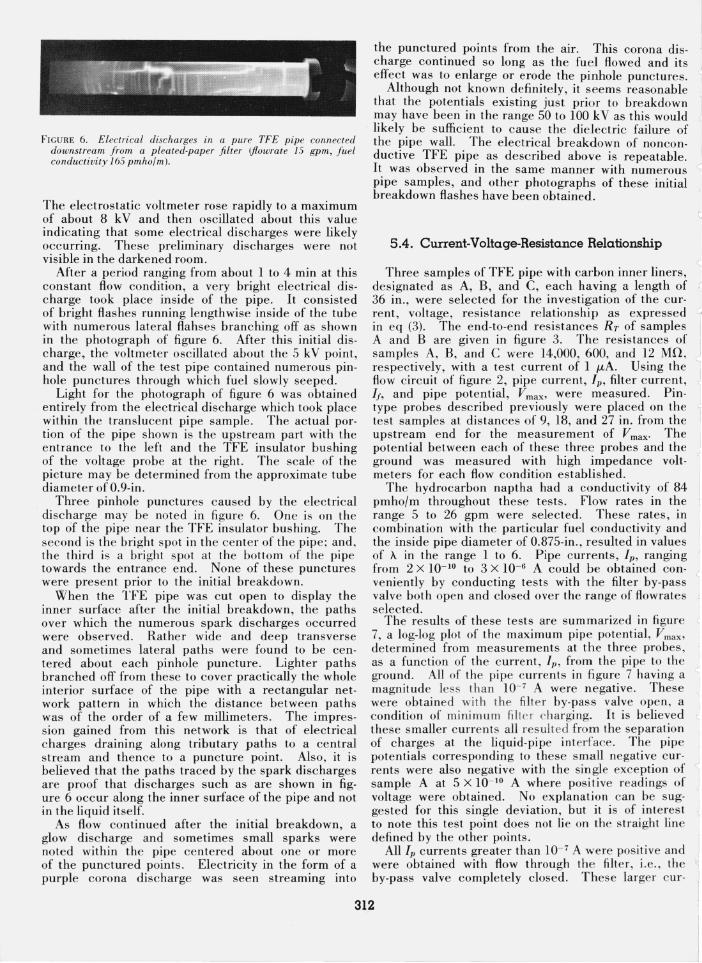
F1GURE 6. Electrical discharges in a pure TFE pipe connected downstream from a pleated-paper jilter (jlowrate 15 gpm, fuel conductivity 165 pmho/m).
The electrostatic voltmeter rose rapidly to a maximum of about 8 k V and then oscillated about this value indicating that some electrical discharges were likely occurring. These preliminary discharges were not visible in the darkened room.
After a period ranging from about 1 to 4 min at this constant flow condition, a very bright electrical discharge took place inside of the pipe. It consisted of bright flashes running lengthwise inside of the tube with numerous lateral flahses branching off as shown in the photograph of figure 6. After this initial discharge, the voltmeter oscillated about the 5 kV point, and the wall of the test pipe contained numerous pinhole punctures through which fuel slowly seeped.
Light for the photograph of figure 6 was obtained entirely from the electrical discharge which took place within the translucent pipe sample. The actual portion of the pipe shown is the upstream part with the entrance to the left and the TFE insulator bushing of the voltage probe at the right. The scale of the picture may be determined from the approximate tube diameter of 0.9-in.
Three pinhole punctures caused by the electrical discharge may be noted in figure 6. One is on the top of the pipe near the TFE insulator bushing. The second is the bright spot in the center of the pipe; and , the third is a bright spot at the bottom of the pipe towards the entrance end. None of these punctures were present prior to the initial breakdown.
When the TFE pipe was cut open to display the inner surface after the initial breakdown, the paths over which the numerous spark discharges occurred were observed. Rather wide and deep transverse and sometimes lateral paths were found to be centered about each pinhole puncture. Lighter paths branched off from these to cover practically the whole interior surface of the pipe with a rectangular network pattern in which the distance between paths was of the order of a few millimeters. The impression gained from this network is that of electrical charges draining along tributary paths to a central stream and thence to a puncture point. Also, it is believed that the paths traced by the spark discharges are proof that discharges such as are shown in figure 6 occur along the inner surface of the pipe and not in the liquid itself.
As flow continued after the initial breakdown, a glow discharge and sometimes small sparks were noted within the pipe centered about one or more of the punctured points. Electricity in the form of a purple corona discharge was seen streaming into
the punctured points from the air. This corona discharge continued so long as the fuel flowed and its effect was to enlarge or erode the pinhole punctures.
Although not known definitely, it seems reasonable that the potentials existing just prior to breakdown may have been in the range 50 to 100 k V as this would likely be sufficient to cause the dielectric failure of the pipe wall. The electrical breakdown of nonconductive TFE pipe as described above is repeatable. It was observed in the same manner with numerous pipe samples, and other photographs of these initial breakdown flashes have been obtained.
5.4. Current-Voltage-Resistance Relationship
Three samples of TFE pipe with carbon inner liners, designated as A, B, and C, each having a length of 36 in., were selected for the investigation of the current, voltage, resistance relationship as expressed " in eq (3). The end-to-end resistances Rr of samples A and B are given in figure 3. The resistances of samples A, B, and C were 14,000, 600, and 12 MD , respectively, with a test current of 1 iJ-A. Using the flow circuit of figure 2, pipe current, I p , filter current, h, and pipe potential, V max, were measured. Pintype probes described previously were placed on the test samples at distances of 9, 18, and 27 in. from the upstream end for the measurement of V max' The potential between each of these three probes and the ground was measured with high impedance voltmeters for each flow condition established.
The hydrocarbon naptha had a conductivity of 84 pmho/m throughout these tests . Flow rates in the range 5 to 26 gpm were selected. These rates, in combination with the particular fuel conductivity and the inside pipe diameter of 0.875-in., resulted in values of A. in the range 1 to 6. Pipe currents, I p , ranging from 2 X 10- 10 to 3 X 10- 6 A could be obtained conveniently by conducting tests with the filter by-pass valve both open and closed over the range of flowrates selected.
The results of these tests are summarized in figure ' 7, a log-log plot of the maximum pipe potential, V max,
determined from measurements at the three probes , as a function of the current, lp, from the pipe to the ground. All of the pipe currents in figure 7 having a magnitude less t han 10- 7 A were negative. These were obtained with the fi lter by-pass valve open , a condition of mini mum filter charging_ It is believed these smaller currents all res ulted from the separation of charges at the liquid-pipe interface. The pipe potentials corresponding to these small negative currents were also negative with the single exception of sample A at 5 X 10- 10 A where positive readings of voltage were obtained. No explanation can be suggested for this single deviation, but it is of interest to note this test point does not lie on the straight line defined by the other points.
All Ip currents greater than 10- 7 A were positive and were obtained with flow through the filter , i.e., th e ,I
by-pass valve completely closed. These larger cur·
312
)
~
4 10
RTo~tM~I~A SAMPLE 0 0 A 1.41110
• 61t 108
1.2:. 10 1
10'
z
'" ~ 0
10'
'" .. 0:
~ " // X <l
" ./' 10
./
IO~I O 1<,' 10-8 10-7 10-6
PIPE CURRENT, 1p ' AMPERE
FIGURE 7. Maximum potential verSlLS pipe current in pipes with carbon inner liners (length .16 in., jlowrate range 5 to 26 gpm,fuel conductivity 84 pm.ho/ m).
rents were the res ult of the se paration from th e fuel to the walJ of the pipe of c harges prod uced during
( fl ow throu" h the filte r. Also, all pote ntials res ulting from the p~s itive c urrents were like wise positive ..
Still referring to fi gure 7, it is see n th at o n ~ s tra l ~ht , line for each pipe sample de fin es the tes t pomts qUIte
closely and the slopes of these three Lines are app roxImately equal. Also, the s lopes are co nsiderabl y less than 45°, indicating that the resis tances of the three pipe samples we re not cons ta nt , but te nded to decrease with increas ing voltage.
The expe rime ntall y de te rmined maximum pipe potentials of figure 7 can be co mpared to those p.redi c ted by eq (3) provided R-r va lues correspondmg to the pipe curre nts unde r cons ide ra ti on are used. Fi"ure 3 "ives these values for samples A and B. In selec ting °a value of R.,. from thi s figure which corresponds to a designated Ip c urre nt, it is . assume? that the ne t de position of c harges is relatIvely unIform le ngthwise along the pipe. Thu s, the average current exis ting in the wall of the pipe can be considered to be approximately 0.25 /p. This is the c urrent which has been used in obtaining values of R.,. from fi gure 3. .
Th e co mpari so n of calculated and measured max Imum pipe pote nti a ls for sam ples A and B is presented in table 1. Co ns ide ring th e prac ti cal diffi c ulti es
TABLE 1. Comparison of calculated and measured m.axim.wn pipe voltages
> Maximum pipt· vol l age NT
SlJ rnpie t" (fig. 3) Ca lcula led ~l ea!'.u red
Vmllx = 0. 1 1< "/ 11 (fig. 7)
Amperes Ohllls Volts Vult s A 10- 1 4 X 10 111 400 700
10- 1> 2.2 X 101U 2.200 2.700 10-·' 1.2 X 10 10 12.000 11 .000
B 10-' 9.:; X 10' 90 100 10-" 4. 7 X Ill' 470 490
involved in meas urin g RT a nd V max acc urately it is beli e ved th a t good agree me nt be tween t he calculated a nd meas ured va lues was ob ta ined . Certainlyagreeme nt s uch as t hi s is quite adequate for the prac tical purpose of es tima t in g pot e nti a ls to be e ncounte red in pipes through whic h a known c urre nt It I to the ground is e ncou nter ed. However, it mus t be reali zed th at eq (3) app lies onl y to the cond iti on s in whi ch th e co ndu c tive port ion of th e pipe is in ac tu al cont ac t with t he fu e l throughout it s le ngt h and t he pi pe is in e lec trica l contact with th e ground on ly a t th e two e nd s. Groundin g of t he conduc tive purtion of the pipe at man y locations throu ghout th e le ngth wi ll oC course result in lowe r volt ages. In s ul a ti ng th e condu c ti ve porti on of th e pipe from the fu e l wi ll lik e ly res ult in pot e nti a ls hav ing magnitud es s uffi c ient to ca use elec tri cal breakdown.
5.5. Charge Relaxation in Short Pipes
Both filter c urre nt , I" and pipe c urre nt , I tl • wt"re meas ured durin g th e experime nt s re port ed in figures 4 and 7. During that portio n oC th ese tes ts in whi c h th e fu e l passed throu gh th e fi lt e r. th e va lues of I,a lways cxceeded 0.5 f.1.A . Th ese are ve ry large co mpa red to th e c urre nt s ge ne ra ted a t the fu el -pipe int e rCace wh e n t he fu e l bypassed t he filt e r. Thu s, for flow throu gh th e fi lt e r, it ca n be ass ume d th a t th e meas ured I" va lu es a re equi va le nt to th e c ha rges whic h mi gra ted to the pipe wa ll during passage of the c harged fu e l th rou gh the pipe . Thu s, da ta a re ava il a bl e to ve rify eq (2). It I = 1/(1 - e- A) .
Th e res ults of thi s check of the relati on I {I ""' IJJ-e- X)
a re s how n in fi gure 8. Each plotted point is the ra tio
1. 2
0
1.0 0 0 0 •
x 0
- (t-e->")
" Cl.
RT LENGTH
OHM S IN .
o 1. 4 x 10¹⁰ 36 0 .2
.6.0x I0 6 36
x 1.2 x 10 7 36
o 5.0x 10⁷ 48 0
0 2 3 4 5
F IGURE 8. Experim.ental verification of the relation [,JI, = (1 - e-A)
for variolLs pipe samples,jlow rates , andfuel conductivities.
313
I/J/lf as calculated from the measured values of these two currents. The solid line represents the function (1 - e- X) versus A, computed from the relation A = L/vr. Data corresponding to the three pipe samples 36-in. long were all obtained with a constant fuel conductivity of 84 pmho/m, and flowrate in the range 5 to 26 gpm. Data for the one pipe sample 48-in. long were obtained at a constant flow of 8 gpm with fuel conductivities in the range 11 to 200 pmho/m using asphaltenes as the contaminant. The few experimental points obtained for the A range 5 to 10 are not included in this figure because these measured values of I/J/h were all within a few percent of unity. It is believed that the agreement shown in figure 8 is reasonable over the range of conditions encountered. However, some of the points indicate relaxation may at times occur more rapidly than predicted. Certainly these results help to verify that relaxation of a charged liquid flowing in a pipe is essentially independent of the electrical resistance of the pipe for resistance values in the range zero to about 1010 o.
It is believed, but not definitely known, that at least some of the deviations shown in figure 8 are related to the determination of fuel conductivity. Perhaps the effective conductivity of the charged fuel in the pipe can be influenced by the potential gradients existing. Thus, it is possible that present methods of determining fuel conductivity are not completely adequate for the experimental verification of the theoretical relations.
6. Discussion
The purpose of this section is to discuss and further emphasize those results leading to the desirable resistance characterisitcs of pipes and hoses through which charged liquid petroleum products may flow. It is believed that the experimental conditions of flowrate, and of pipe diameter, length, and installation downstream from microfilters duplicate closely conditions frequently encountered, especially in fuel systems of the larger size il1ternal combustion engines. Admittedly, this investigation was concerned primarily with the more severe conditions rather than with average conditions. Also, the fuel conductivities of 84 and 16~ pmho/m used during many of the tests are higher than those normally encountered. However, experiments with fuels of lower conductivities show that maximum filter charging effects usually occur in the conductivity range 10 to 200 pmho/m depending upon the filter design and the rate of flow. Experience has shown that conductivities in the range 10 to 30 pmho/m are encountered rather frequently in liquid petroleum fuels flowing into the engines.
Perhaps one point should be emphasized concerning fuel conductivity. In investigations concerned with the more severe filter charging conditions and the resultant currents and potentials in pipes installed downstream, it has been found, as shown in figure 4, that greatest electrification effects are obtained with fuels of moderate conductivities, range 10 to 200 pmho/m, rather than those having low conductivities
of the order of one pmho/m. Therefore, elaborate precautions to remove absorbed water and as much of the contamination as possible are not necessary during investigations involving the generation of large filter charging currents. Nevertheless , in this connection some effects of water should be mentioned. As discussed in [3] and investigated briefly by the authors, ordinary tap water, which has relatively very high conductivity, does not increase fuel conductivity even when present to the extent of 5 percent or so. In fact, water frequently tends to leach out and reduce I
the amount of contaminant in a fuel with the resultant effect of a possibly large decrease in conductivity. f
Finally, water mixed with fuel, especially when dispersed in the form of droplets, usually increases electrification considerably during flow through pipes and filters.
It has been shown that electrical breakdown can occur when a charged fuel flows through nonconductive pipes. These phenomena are perhaps similar to the charging of an electrical condenser until the resulting potential gradients are sufficient to cause breakdown. Thereafter, depending upon the current and the particular materials involved, either a continuous discharge will be obtained through the breakdown path, or a series of intermittent discharges will result.
The question arises as to what happens when the nonconductive pipe has a sufficiently high dielectric strength so failure through the wall does not occur at the time of the arc discharge. An example of such conditions is described below.
Variable-area meters are used frequently in the laboratory for the flowrate measurement of hydrocarbon liquids. The metering tubes of these instruments are moulded of thick heavy glass, have a length in the range 1 to 3 ft, and frequently have no internal bonding wire or its equivalent. Occasionally such meters are connected downstream from microfilters ~ which charge the fuel significantly under certain operating conditions.
It is rather well known that electrical discharges occur at times in glass-tube flowmeters so installed. Photographs of such discharges are very similar in appearance to figure 6 except that puncture or breakage of the glass pipe does not occur. Rather, the strong lengthwise spark terminates at any convenient metallic ground within the end of the glass tube. Numerous lateral flashes are noted also. Although not definitely known, it appears from photographs, that the electric arcs occur on the internal surfaces of the glass pipe. Arcs extending five or more inches up into the glass tubes have been observed under the more severe conditions.
The use of an internal bonding or ground wire in nonconducting pipes should reduce maximum potentials significantly and thus eliminate the possible hazard arising from electrical arc discharges. This internal bonding wire will likely have little, if any, influence upon the rate at which separation of charge from the highly charged fuel occurs.
The possibility of placing a conductive skin around the outside of nonconductive hoses was mentioned
314
~ in th e Discussion of refere nce [2]. Thi s idea may be practical provided the transverse leakage of elec
)tri c ity from the interior of th e hose to th e conducting skin does not puncture th e wall. Experience has demons trated thi s is not practical when appli ed to
, hoses containing a thin tube of pure TFE surrou nded by an exterior, grounded, metal braid. In s uch hoses,
:,di sc harges of electricity s imil a r to that of figure 6, frequently puncture th e TFE tube resu lting in liquid
;> leakage throu gh the wall. One solution to the prob-le m is the developme nt of a practical inn e r lin e r or
~ coating of modera t e resistivity which would be ~ grounded at each end of t he hose. I Considel-ing now the fl o:v of a. highly ch arge~ li.q~id ) hydrocarbon through a pIpe of moderate reSIstivIty,
the ex perime ntal res ults help to verify that the rat e r of charge separation from th e fu el to the pipe wall is ~ esse n~ially in?e pe nde nt of the pipe material or of i~s
elec tri cal res is tance. The re lat ion Ip= li(l- e- A) IS l in reasonable agre. e ment with the ex perime ntal results I provided Ii is la rge co mpared to 10, whe re 10 is the ;) convection c urre nt fl ow ing out with th e fu el from an I infinitely long pipe of the sa me mate ri al. ~ The max imum magn itudes of the c urre nts I" e n
countered in th e in vestigati on we re in th e ra nge 1 to ( 6 tJ-~. These a re of the sa me .o rd e r of I~lagnitud.e a nd { are III reaso nabl e agreeme nt WIth a possIble maxlmu.m
value of 10 tJ-A c ited a t tim es in the literature. If a ::, safety factor is des ired , a maximum valu e of I" = 100
tJ-A will pe rhaps cover all operatin g co nditions which , could be enco unte red in practical app lications.
Th e rather limited experime nts indi cate that the maximum voltages occurring in pipes ca n be predi c ted with reasonable accuracy by th e re lation V max = O.lR'J'lp provided A < 6. According to eq (5) in the appe ndix and as s hown in figure 9, for any given valu e of R'J' and I p , maximum potentials will be less for valu es of
(> A considerabl y greate r than 6. However, s uch conditions are not us ually enco untered in practical ap plications. If potentials exis tin g within pipes are not to exceed an arbitrary value of 1,000 V for a possible maximum pipe current of 100 tJ-A , th en the e nd-to-e nd resis tance of the pipe may be co mputed as R'/' = 1,000/
L (0.1 X 100 X 10-(;) = lOS n. ~ Thus, a value of RT not to exceed about 108 n may > be s U l?ge~ ted for pipes and h?ses i.ntended. for use
with bqUld hydrocarbon s . It IS belIeved thiS upper r limit is s ufficiently low to eliminate the hazard of spark
di scharges occurring e ither within or through th e walls of hoses and pipes through which a liquid hyd rocarbon fl ows. However, this suggested maximum
l" value for R'J' is subj ec t to three conditions: (a) th e pipe ~ must be uniformly conductive throughout its length;
(b) the conductive portion of the pipe mus t be in co ntact with the fuel throu ghout th e le ngth of the pipe; and (c) the conductive portion of th e pipe must be elec tri cally connec ted to the ground at each end of the pipe.
i;() When co nve ntional e nd fittings of aircraft hose are used as elec trodes, th e end-to-e nd resistance R'/' is
~~ not a reli able parameter for specification purposes because it does not ass ure that the inte rior surface
of the pipe is co nductive a nd elec tricall y connected to the ground . However , thi s req uire ment will be c hec ked if the resistance from each and any portion of the interior s urface of the pipe to the ground is meas ured ins tead of th e e nd-to·e nd resistance. Cons ider a n empty pipe ground ed a t eac h e nd . An inte rn al electrode loca ted at the ce nt e r of thi s pipe has the e ffec t of placing two R'/'/2 res·is tances in parallel res ultin g in an effec tive res is tance to th e ground of R'/'/4. With allowance for thi s, and cons idering orders of magnitude onl y, it is co ncl ud ed that hazardous pipe potentials resulting fro m s tat ic e lec tri c ity can be elimin ated if th e e lec tri cal res is ta nce from each and a ny portiun of th e interior s urface of th e pipe to th e ground does not exceed abo ut 107 n. Th e use of a n internal electrode in meas urin g the resi s ta nce of pipes and hoses will be inco nve ni ent at tim es, but thi s method does provide an e lect rical path to th e g round s imilar to that seen by th e liquids conta ined within the pipe during norm al usage.
It is acknowledged without rese rva tion that th e relations and ideas prese nted in [1] and [2] and th eir Discussions provided nearly all of the bac kground materi al re quired for thi s in vestigation. It me rely remained necessary to demons tra te tha t such relation s and ideas we re appli ca ble to th e parti c ul a r problem under consideration. Thus, it is gra tifyin g to be able to prese nt additional experim en ta l data which, for prac tical purposes, is in good agreement with the work of previous investi gators .
7. Conclusions 1. High e lec tri cal c harge densiti es can be produced
in petrole um liquid s h avi ng moderate to high e lec tri ca l condu ctiviti es (10 or more pmho/m) whe n suc h liquids fl ow throu gh conve nti onal mic rofi lters. Howeve r, th e c harging tendency of th e liquid is not de pe nde nt upon fuel conductivity alone. Rath er. it is de pendent upon the amount and materia l of whi c h the co nta min ant is co mposed and th e materi al a t the liquid·solid interface.
2. Maximum curren ts in th e ra nge one to 6 tJ-A were obtained from the pipe to the ground whe n hi ghl y c harged petroleum liquids fl owed through short pipes or hoses. These co mparatively la rge c urrents we re caused by the mi grati on to th e wall of th e pipe of the elec tri cal charges co ntained within the c harged fue l.
3. Th e rate of separation of electrical c harges from the c harged fuel is esse nti ally independe nt of th e pipe material a nd its elect rical resis ta nce.
4. When the ra te of charge separation is s ufficien tly high in pipes co nstruc ted from noncondu ctive materials, electri cal discharges in th e form of sparks and arcs will occur. These discharges will o ri gin a te on the inner surface of the pipe. They may be contained e ntirely within the pipe or may cause puncture or other failure of th e pipe wall depe nding upon th e pipe material , the wall thi c kness, and the ground locations involved.
5. Maximum potentials produced by static electric phenomena within pipes, grounded at each end, may be predicted with r easonable accuracy by a simple
315
relation provided the electrical resistance of the pipe and its c urrent to the ground are known.
6. Considering pipes or hoses through which a highly charged petroleum liquid may flow , an electrical resistance from each and any portion of the interior surface of the pipe to the ground not exceeding about 107 n is adequate to limit pipe potentials resulting from static electricity to less than 1,000 V.
The financial support and personal interes t shown during this program by the Navy Department , Bureau of Naval Weapons, is gratefully acknowledged. Also, the appreciation of the authors is here by expressed for the considerable technical guidance received throughout the program from Francis Hermach of the Electri city Division of the National Bureau of Standards. Finally, the considerable contribution of indus try in supplying experimental pipe samples for the inves tigation is also acknowledged.
8. References [1] Carruthers, J. A. and Marsh, K. L Charge re laxation in hydro·
carbon liquids Auwing through conductin g and non conducting pipes , .1. Ins titute of Petroleum 48, No. 462. Jun e 1962, pp. 169- 179.
[21 Carruthers , J. A. and Wigle y, K . .1., The estimation of electrus tatic potentials, fi e lds, and ene rgies in a rectangular metal tank containing c harged fuel, .1. Institute of Petruleum 48, No. 462 , June 1962, pp. 180- 195.
[3] Klinkenberg, A. and van der Minne , J. L. (ed), Electrostatics in the pe troleum industry, Amsterdam: Elsevier, 1958.
9. Appendix
The object of this appendix is to develop an approximate relation for the maximum electrical potentials developed on the inner wall surface of pipes as a result of static elec tric phe nome na caused by the flow of hydrocarbon liquids. Essentially thi s theory is a simplification of that developed by Carruthers and Marsh [1] subject to the assumptions that the electrical resistance of the pipe is low compared to that of the liquid and that the ratio of the residence ti me of the liquid in the pipe to the relaxation time of the liquid has a value less than 6. Both of these assump· tions appear to be valid as applied to the more severe conditions likely to be encountered in practi cal applications.
IJ = current betwee n the ground and the filt er Ii = qiv = convection current enterin g: tlH' pipe due
to the flow of liquid containin g a n initial charge qi per unit length of pipe
1/1 = current flowing from the pipe to the ground 10= convection current which would emerge with
the liquid from an infinitely long pipe L = length of pi pe m =x/L
RT = L/,B = end·to·end resistance of the pipe VIII = the potentia] on the inner wall of the pipe at a
position m =x/L from the pipe entrance
V max = the maximum potential existing on the inner wall of the pipe
Vr = the potential on the inner wall of the pipe at a distance x from the pipe entrance
v = mean axial velocity of the liquid x = distance along pipe from the entrance ,B = conductance per unit length of pipe wall as·
suming the conductivity of the pipe wall is considerably greater than that of the liquid
A = L/VT = ratio of the residence time for the liquid in the pipe to the relaxation time of the liquid
T = relaxation time of the liquid. Its value is com· puted from eeo/k where k is liquid conduc· tivity, e the dielectric constant of the liquid, and eo the electric constant of free space. When k is expressed in mho/m, T in seconds, and e is taken as 2, T=17.7 X 1O- 12/k.
Carruthers and Marsh [1] in a consideration of the potentials produced by the flow of hydrocarbon liquids have de veloped the expression
VT [ X ] V,. = (Ii - / 0) Ii (1 - e-X / VT) - L (1 - e- L/ VT) (1)
for the pote ntial at any point of the cross section of
~
v
liquid and pipe. \ If it is assumed that the electrical resistance of the
pipe is small compared to that of the liquid contained ' within the pipe, RT=L/,B, and by letting m =x/L and A = L/VT, eq (1) may be written as
RT V", = (Ii - 10) T [(1- e-mA)- m(l-e- A)]. (2)
Also in [1], the expression
(3)
is developed for the convection current, III , emerging with the liquid when the pipe is of finite length. This assumes both the relaxation of Ii and the generation of 10 at the fuel'pipe interface are exponential proces· ses. As shown in the discussion of figure 1, III = Ii - II" " and from eq (3) the currents I p , Ii, and 10 are related by the expression
(4)
Substituting for (Ii - 10) in eq (2) another expression
R'i [(1 - e-1nA) ] Vm=IpT (l-e-A) -m =KI/1RT (5)
is obtained for the potential at any point along the pipe. Figure 9 shows K plotted as a function of A for
selected values of m. It is seen that K varies between 0.13 and 0.08 for values of A less than 6. As A becomes , greater than 6, K decreases rapidly becoming less
316
I I
?>
'£' I
,-... < . I~ , ' " . , '
, --, '--' -I'" "
0 .14
. 12
. 10
.08
.06
O'
.02 0 .2
-------~ ~'\
\'\ \\ r- mo 025
\ \ ( r- m o O.' /. r-- m .. O.S
10 50
1 [0 -e- m') ] FIGURE 9. The relation K = ~ (l _ e - ') m as a function of "
for selected values of m.
317
than 0.02 for A = 50. Values of A exceeding 6 are e ncounte red only with long pipes, fuels of very high conductiviti es, or ve ry low fuel velocities; conditions in which nea rl y all of th e c harge relaxation occurs in a short upstream porti on of the pipe. Valu es of A less than 6 corres pond to th e more seve re co nditions en counte red in prac tical app li cations. The refore, with little sacrifi ce in accuracy an average value of K = O.l can be used to obtain an approx im ate ex press ion for the maxImum potential produced in a pipe , a nd
Vmax = O.l RTfp (6)
whe re Kr is the e nd-to-e nd res is ta nce of a pipe, grounded at each e nd , from whi ch a c urre nt /p is flowin g to the ground.


![Inward rectifying currents stabilize the membrane ... · distal dendrites [20,21], where I (H) shortens the decay time course of excitatory post-synaptic potentials (EPSP) and af-fects](https://static.documents.pub/doc/80x56/608f3d31a48d4839c2485827/inward-rectifying-currents-stabilize-the-membrane-distal-dendrites-2021.jpg)


