Page 1
7/27/2019 Electric Motor Signature Analysis
http://slidepdf.com/reader/full/electric-motor-signature-analysis 1/119
APPROVED:
Mitty C. Plummer, Major Professor Philip R. Foster, Committee Member J. Lynn Johnson, Committee Member Daniel N. Hopkins, Industrial Representative, Principal
Engineer, TXUAlbert B. Grubbs, Chair of the Department of Engineering
TechnologyC. Neal Tate, Dean of the Robert B. Toulouse School of
Graduate Studies
USING MOTOR ELECTRICAL SIGNATURE ANALYSIS TO DETERMINE THE
MECHANICAL CONDITION OF VANE-AXIAL FANS
Donald Scott Doan, B.S.
Thesis Prepared for the Degree of
MASTER OF SCIENCE
UNIVERSITY OF NORTH TEXAS
May 2002
Page 2
7/27/2019 Electric Motor Signature Analysis
http://slidepdf.com/reader/full/electric-motor-signature-analysis 2/119
Doan, Donald Scott, Using Motor Electrical Signature Analysis to Determine the
Mechanical Condition of Vane-Axial Fans. Master of Science in Engineering
Technology, May 2002, 112 pp., 12 tables, 32 illustrations, and 32 references.
The purpose of this research was a proof of concept using a fan motor stator as
transducer to monitor motor rotor and attached axial fan for mechanical motion. The
proof was to determine whether bearing faults and fan imbalances could be detected in
vane-axial fans using Motor Electrical Signature Analysis (MESA).
The data was statistically analyzed to determine if the MESA systems could
distinguish between baseline conditions and discrete fault frequencies for the three test
conditions: bearing inner race defect, bearing outer race defect, and fan imbalance. The
statistical conclusions for these proofs of concept were that MESA could identify all
three faulted conditions.
Page 3
7/27/2019 Electric Motor Signature Analysis
http://slidepdf.com/reader/full/electric-motor-signature-analysis 3/119
ii
ACKNOWLEDGMENTS
I would like to acknowledge and express my gratitude to my advisor and major
professor, Dr. Mitty Plummer. His guidance and support in counseling me through this
project and the research process were invaluable.
I would like to thank my committee members, Dr. Phillip Foster and Dr. Lynn
Johnson for their support of this project and the time they spent reviewing my thesis. I
would especially like to acknowledge my Industrial Representative, Dr. Dan Hopkins. In
addition, I would like to extent my gratitude to industrial teams:
Mr. Noah Bethel of PdMA for the use of the PdMA system for Motor Current
Demodulation testing; Dr. Ernesto Wiedenbrug of Baker Instruments Inc. for the use of
their system for Instantaneous Torque; and Brian Rucker of SWANTECH, LLC for the
use of the Shock Pulse Monitoring System. Without the support of these vendors and
their commitment to this research, this project would not have been realized.
I express my sincere gratitude to Mr. Henry Carr and his staff at TXU Generation
for assisting me with the testing and configuration changes to the test fan. I would also
like to thank to Operations Smart Team 3 for their support of this project. Finally, I wish
to thank Ms. Pamela Fuller for the many hours she spent helping me proofread the drafts
of this thesis.
Page 4
7/27/2019 Electric Motor Signature Analysis
http://slidepdf.com/reader/full/electric-motor-signature-analysis 4/119
iii
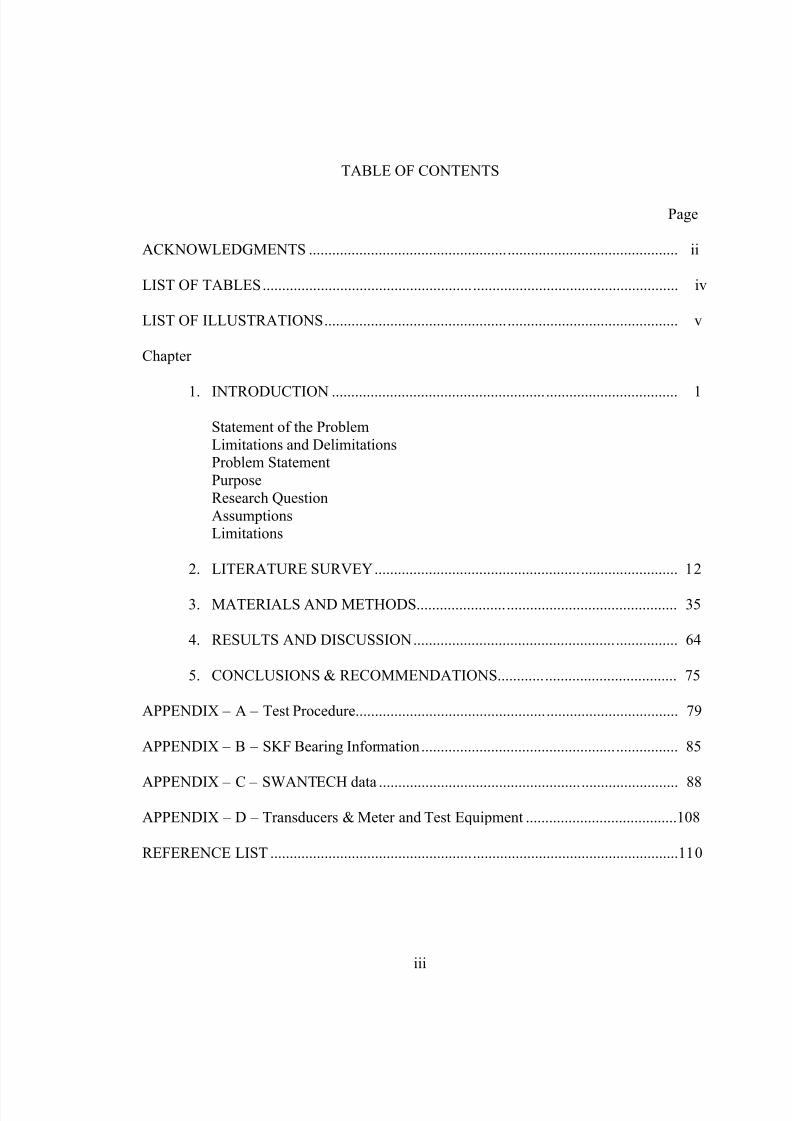
TABLE OF CONTENTS
Page
ACKNOWLEDGMENTS ............................................................................................... ii
LIST OF TABLES........................................................................................................... iv
LIST OF ILLUSTRATIONS........................................................................................... v
Chapter
1. INTRODUCTION ......................................................................................... 1
Statement of the ProblemLimitations and DelimitationsProblem StatementPurposeResearch QuestionAssumptionsLimitations
2. LITERATURE SURVEY.............................................................................. 12
3. MATERIALS AND METHODS................................................................... 35
4. RESULTS AND DISCUSSION.................................................................... 64
5. CONCLUSIONS & RECOMMENDATIONS.............................................. 75
APPENDIX – A – Test Procedure................................................................................... 79
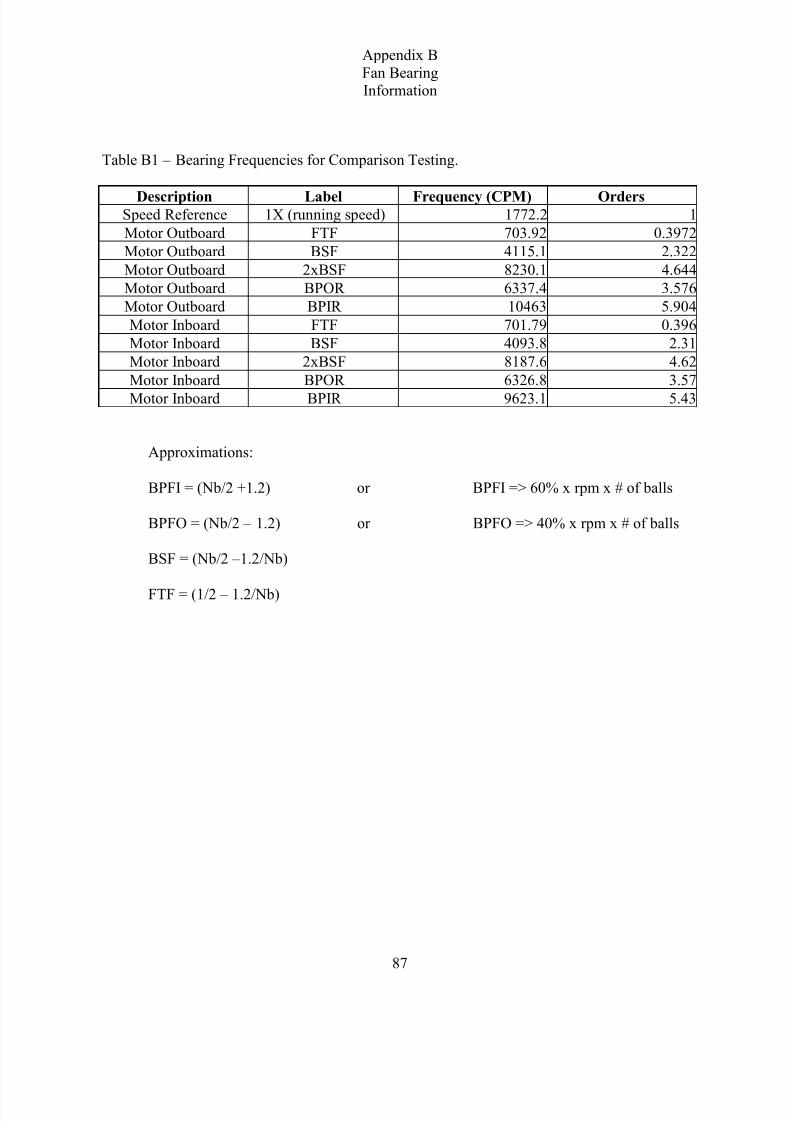
APPENDIX – B – SKF Bearing Information.................................................................. 85
APPENDIX – C – SWANTECH data ............................................................................. 88
APPENDIX – D – Transducers & Meter and Test Equipment .......................................108
REFERENCE LIST .........................................................................................................110
Page 5
7/27/2019 Electric Motor Signature Analysis
http://slidepdf.com/reader/full/electric-motor-signature-analysis 5/119
iv
LIST OF TABLES
Table Page
1. Imbalance to Baseline, Comparison Model of Vibration on the Bearing Cap .......44
2. SD395B specifications............................................................................................49
3. Bently Nevada Specifications .................................................................................50
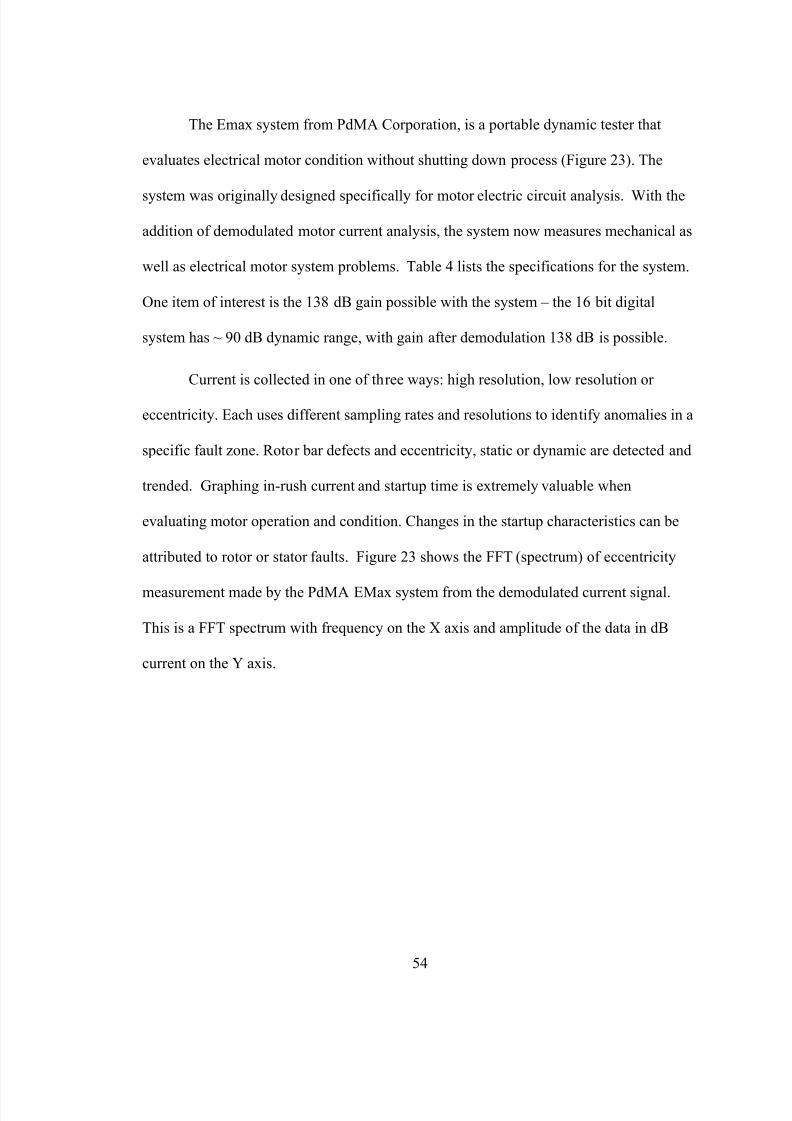
4. Emax specifications ................................................................................................53
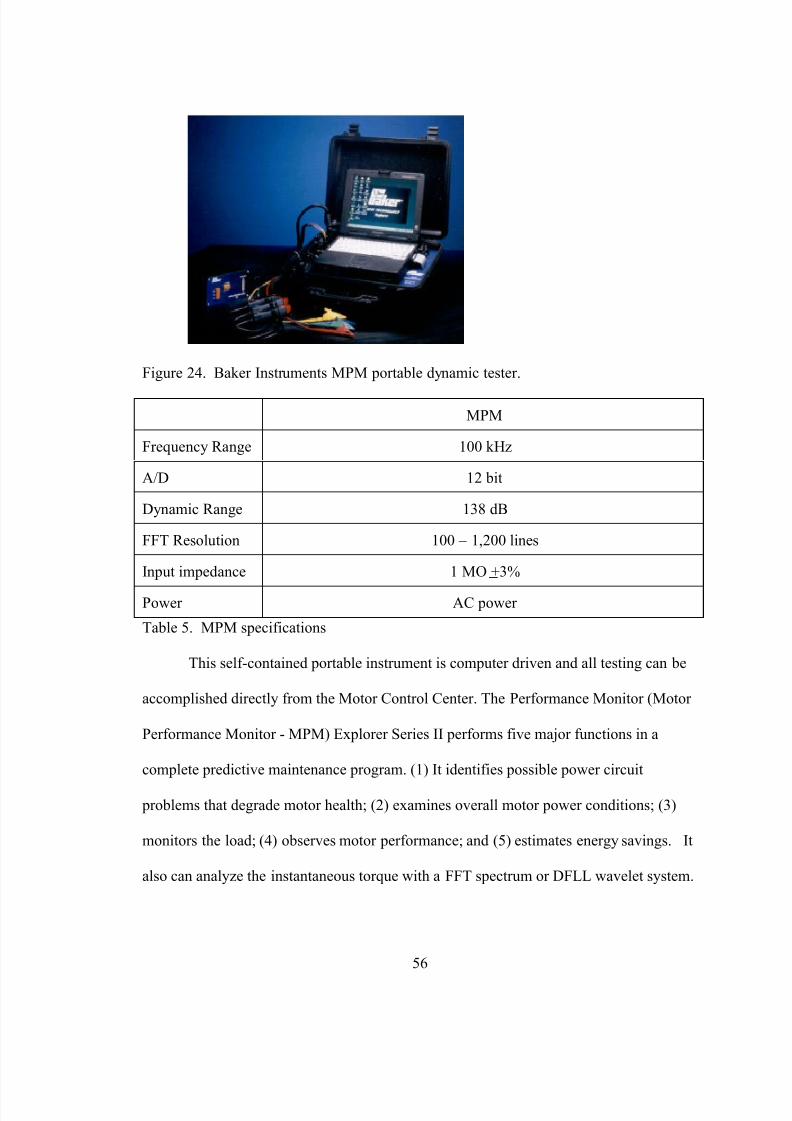
5. MPM specifications ................................................................................................56
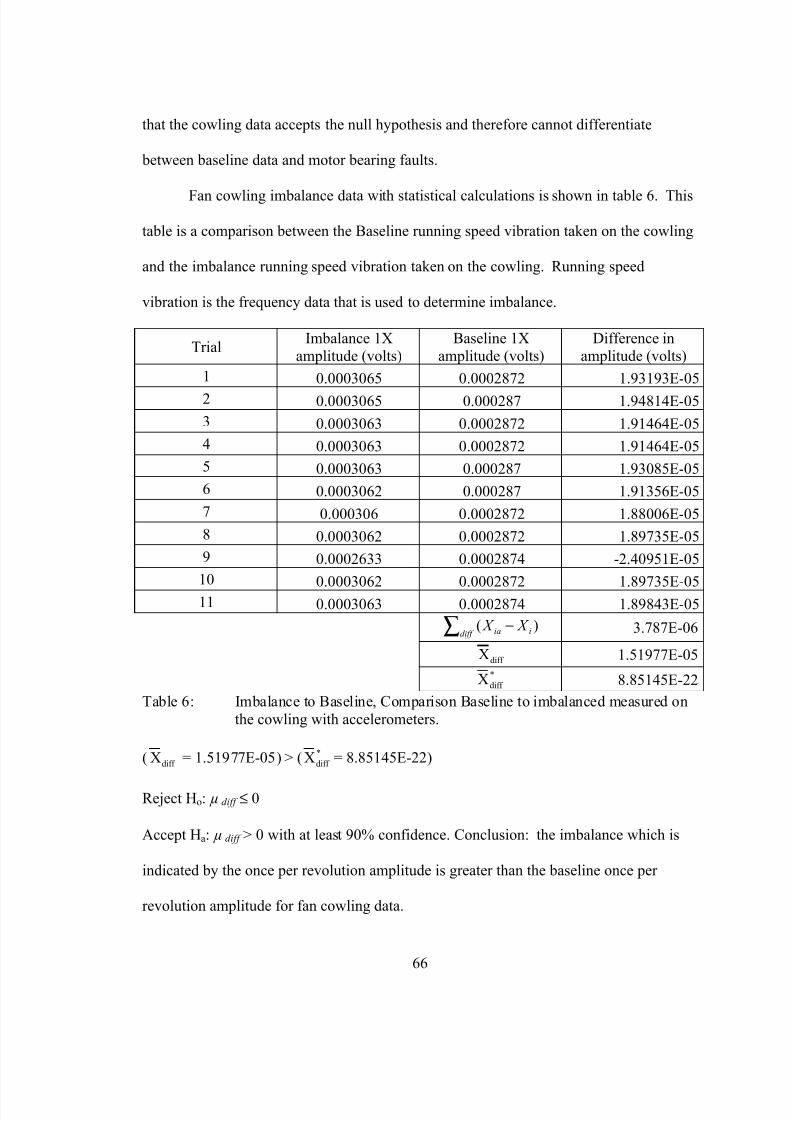
6. Imbalance to Baseline, Comparison Baseline to imbalanced measured on thecowling with accelerometers...................................................................................66
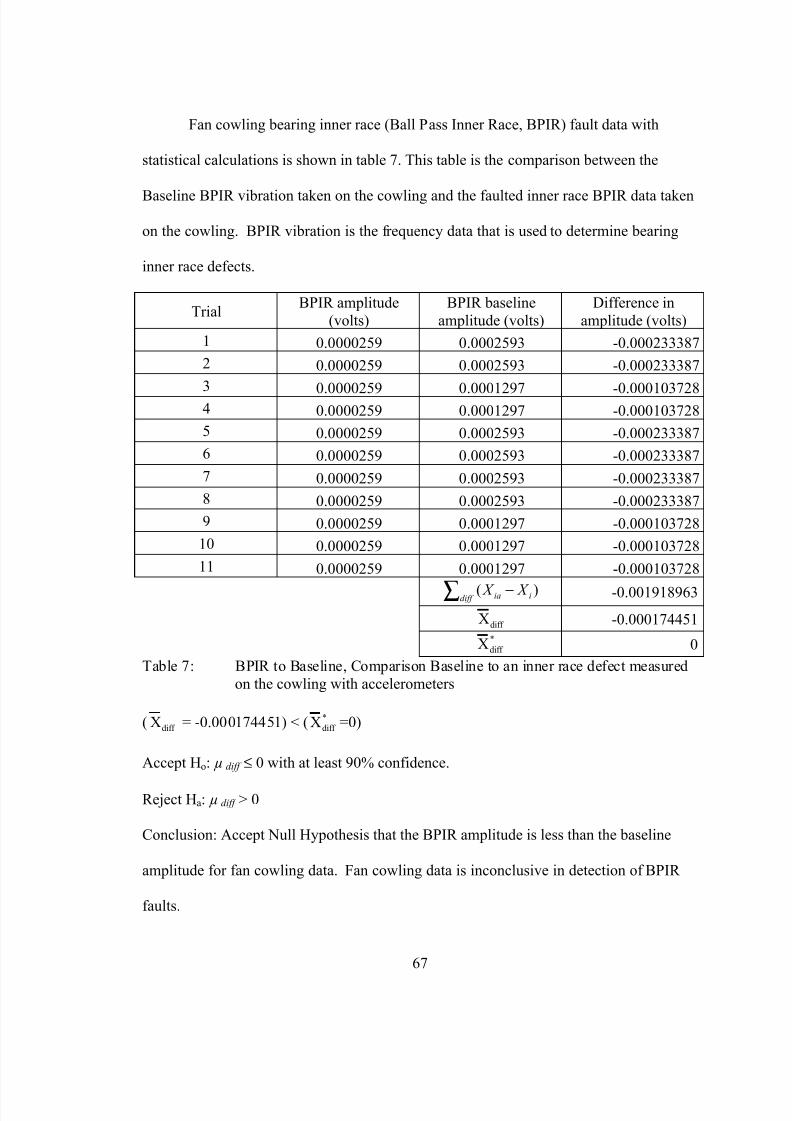
7. BPIR to Baseline, Comparison Baseline to an inner race defect measured on thecowling with accelerometers...................................................................................67
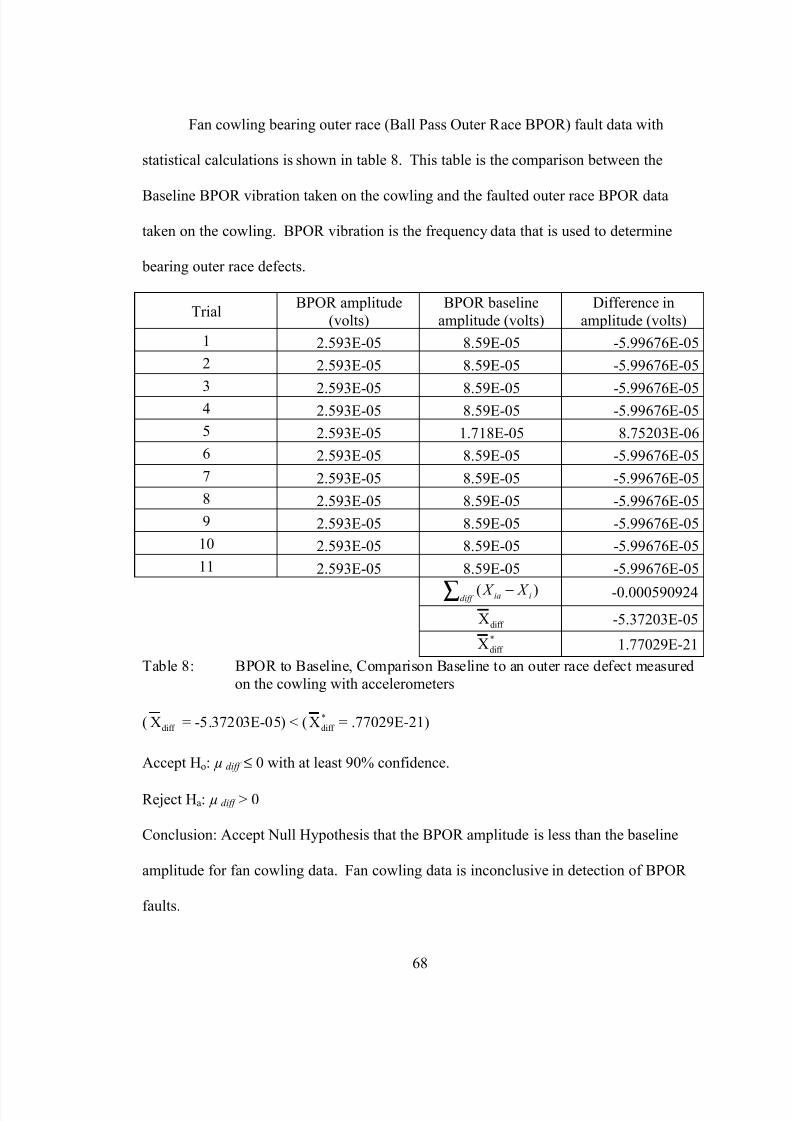
8. BPOR to Baseline, Comparison Baseline to an outer race defect measured on thecowling with accelerometers...................................................................................68
9. Imbalance to Baseline, Comparison using PdMA Emax system............................69
10. BPIR to Baseline, Comparison of Baseline and bearing inner race defect using thePdMA Emax system ...............................................................................................70
11. Imbalance to Baseline, Comparison using Baker MPM system.............................71
12. BPOR to Baseline, Comparison of Baseline and bearing inner race defect using theBaker MPM system.................................................................................................72
Page 6
7/27/2019 Electric Motor Signature Analysis
http://slidepdf.com/reader/full/electric-motor-signature-analysis 6/119
Page 7
7/27/2019 Electric Motor Signature Analysis
http://slidepdf.com/reader/full/electric-motor-signature-analysis 7/119
vi
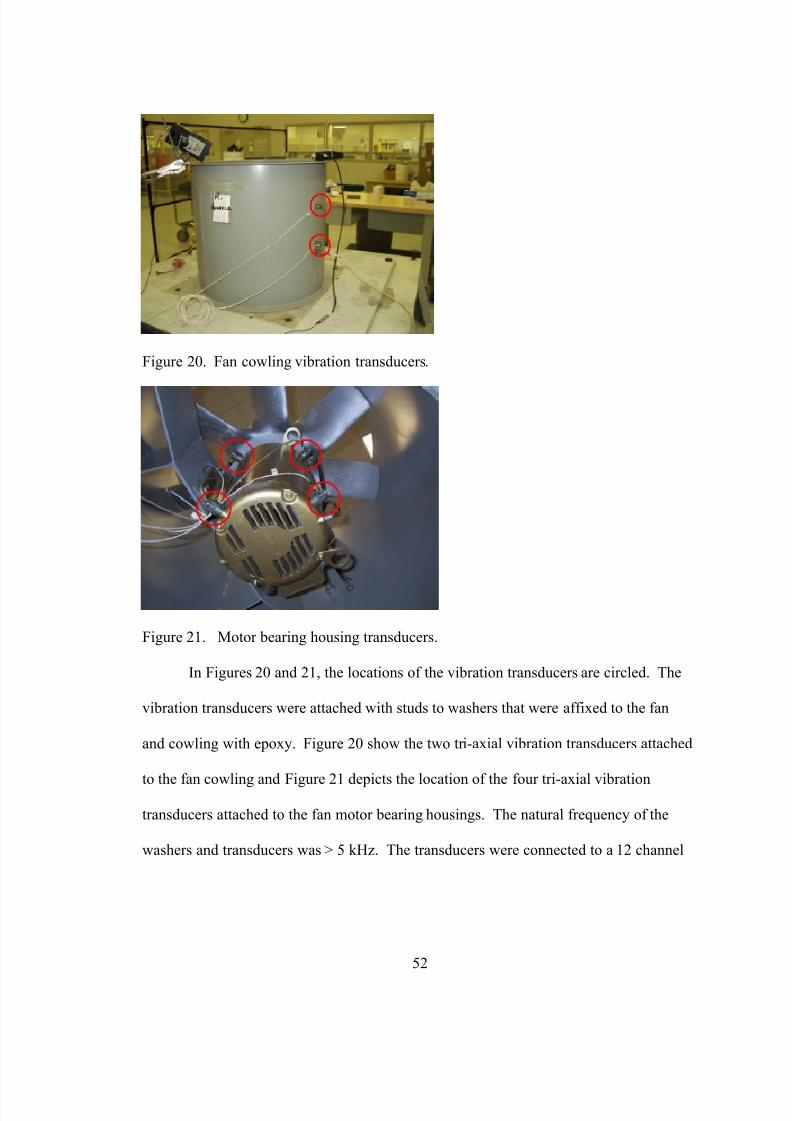
20. Fan Cowling Vibration Transducers..........................................................................52
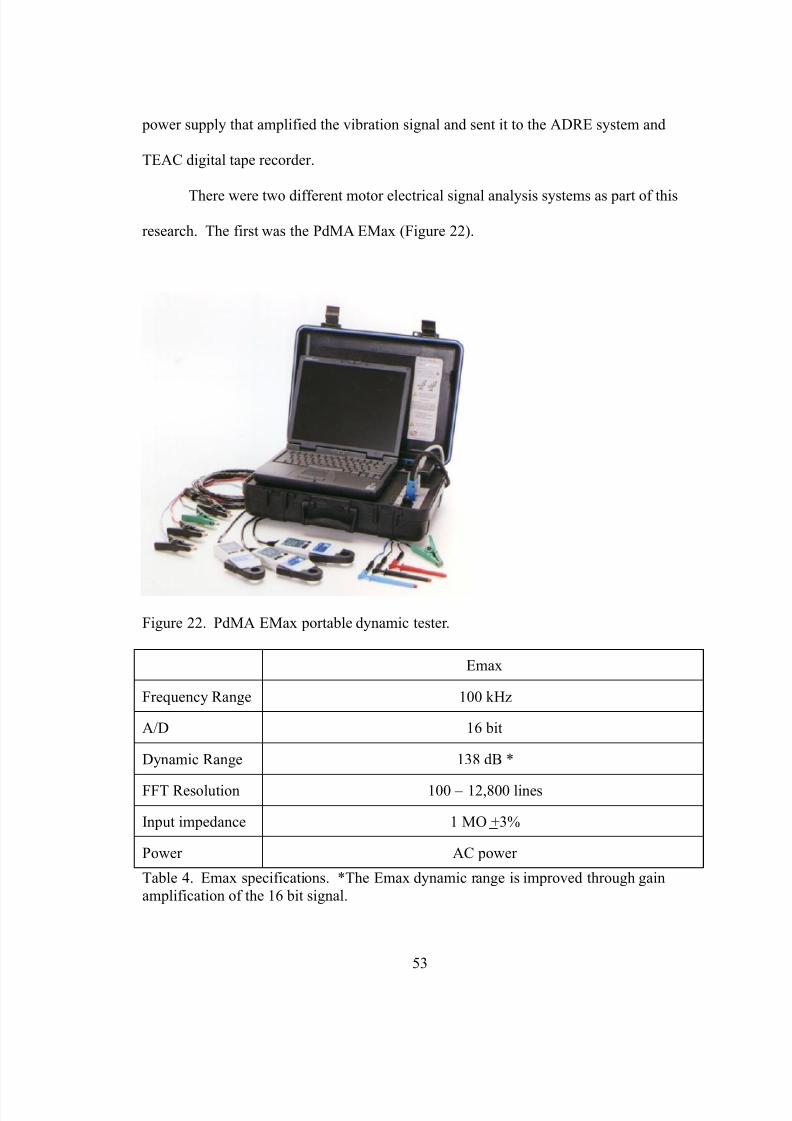
21. Motor Bearing Housing Vibration Transducers ........................................................52
22. PdMA EMax Portable Dynamic Tester .....................................................................53
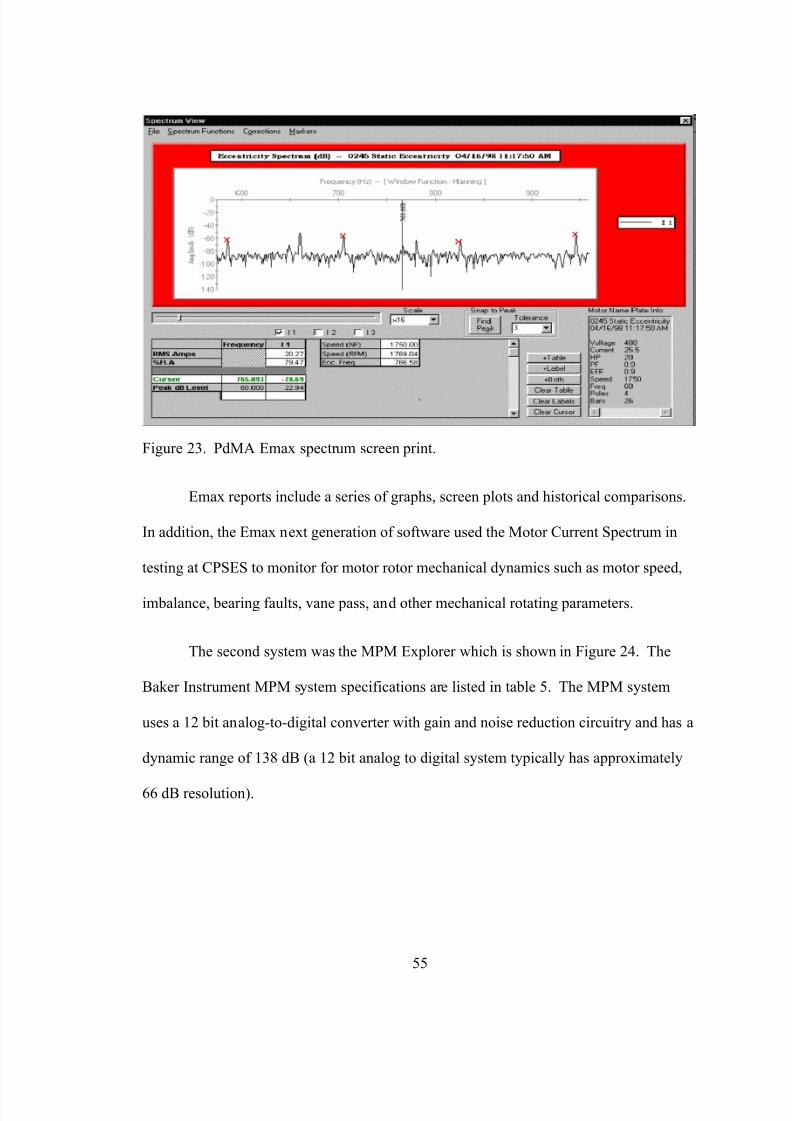
23. PdMA EMax Spectrum Screen Print.........................................................................55
24. Baker MPM Portable Dynamic Tester.......................................................................56
25. Baker MPM Spectrum Screen Print ..........................................................................57
26. SWANTECH Data Collection System ......................................................................58
27. SKF 6502 Deep Grooved Rolling Element Bearing..................................................59
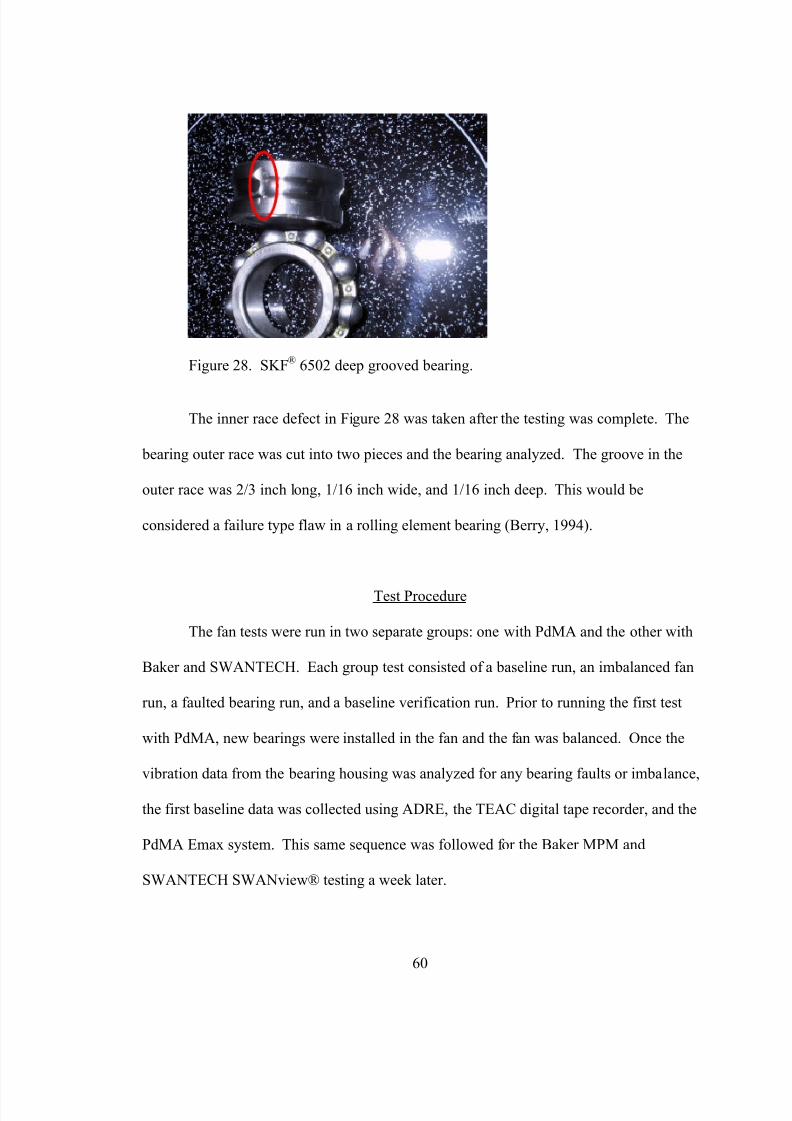
28. SKF 6502 Deep Grooved Bearing with Inner Race Defect.......................................60
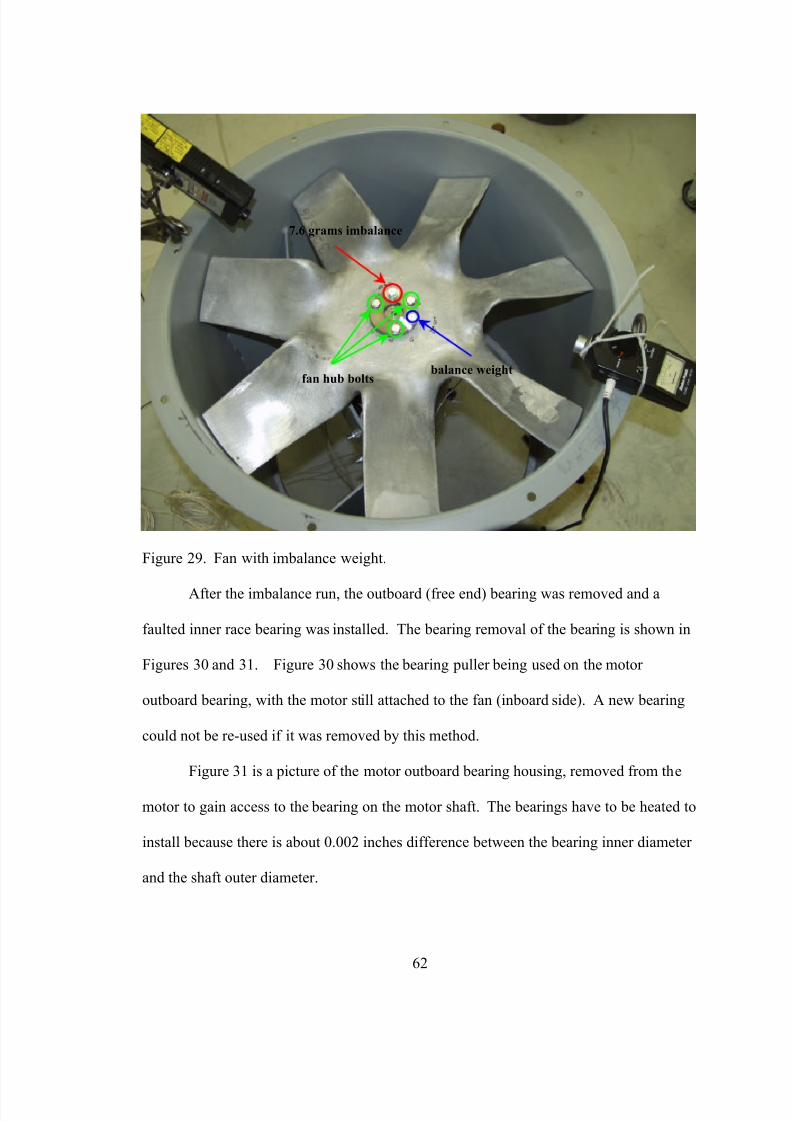
29. Fan with Imbalance Weight.......................................................................................62
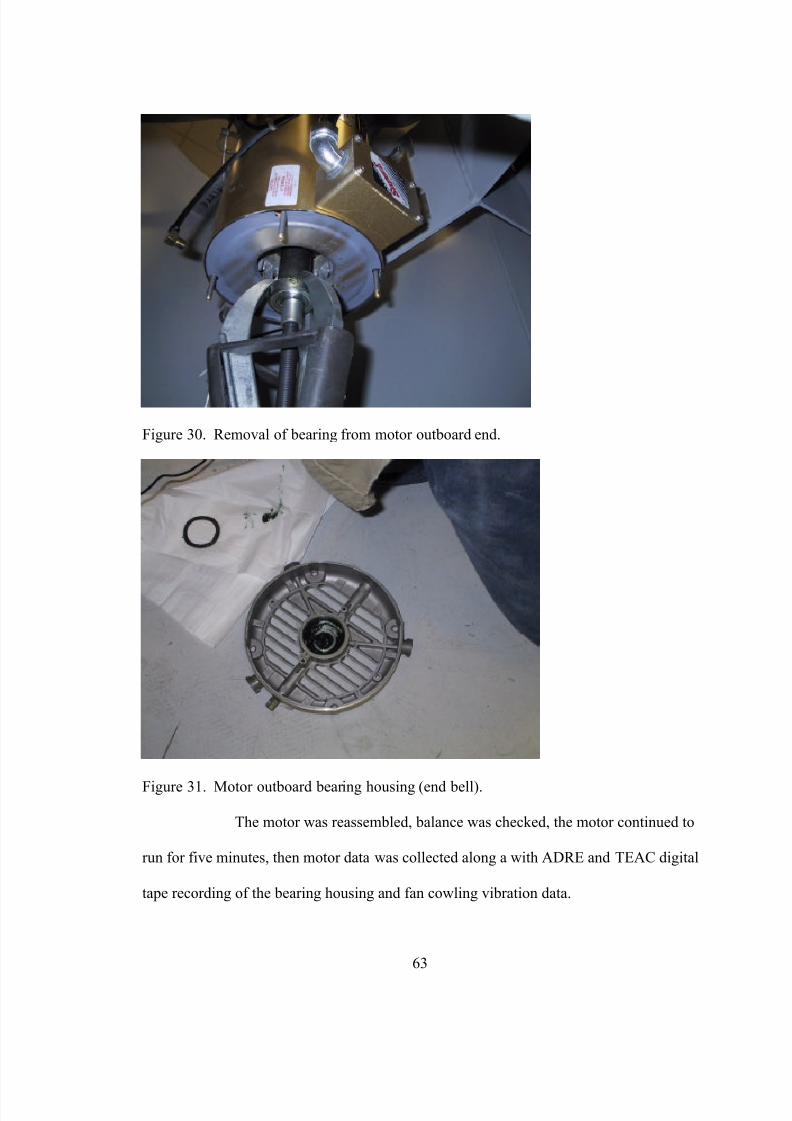
30. Removal of Bearing From Motor Outboard End.......................................................63
31. Motor Outboard Bearing Housing (End Bell) ...........................................................63
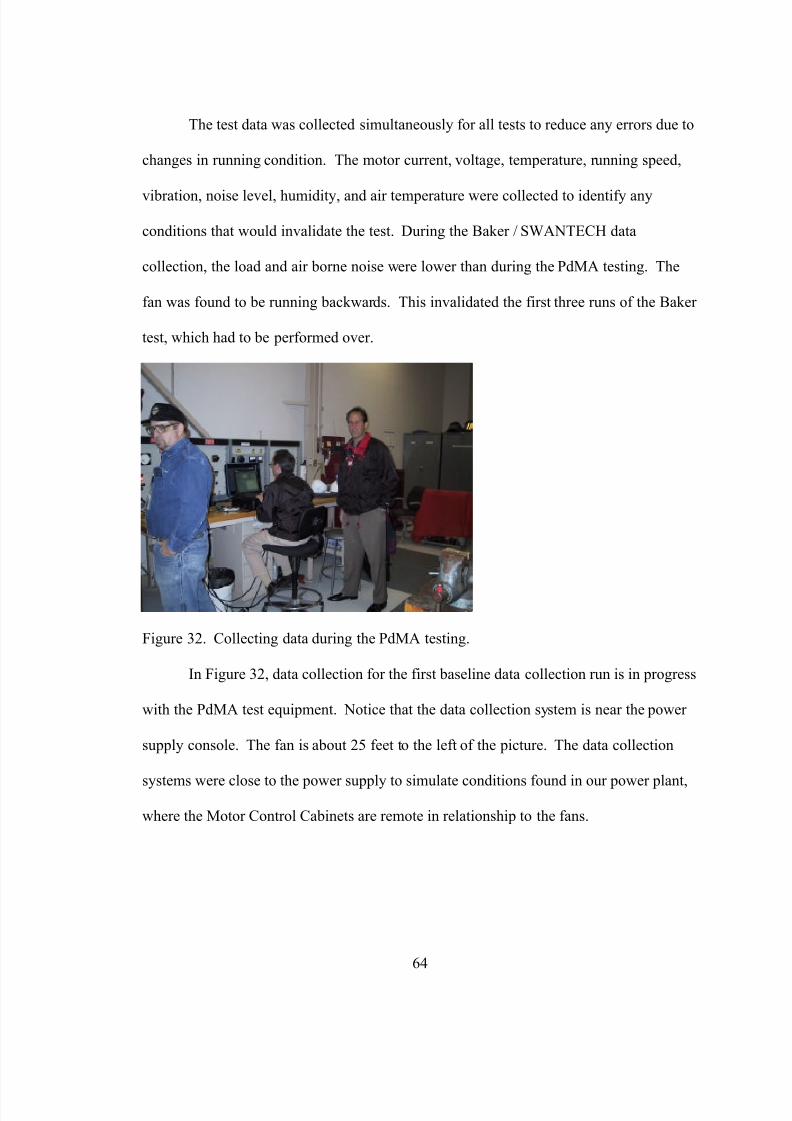
32. Collecting data during the PdMA testing...................................................................64
Page 8
7/27/2019 Electric Motor Signature Analysis
http://slidepdf.com/reader/full/electric-motor-signature-analysis 8/119
1
CHAPTER 1
INTRODUCTION
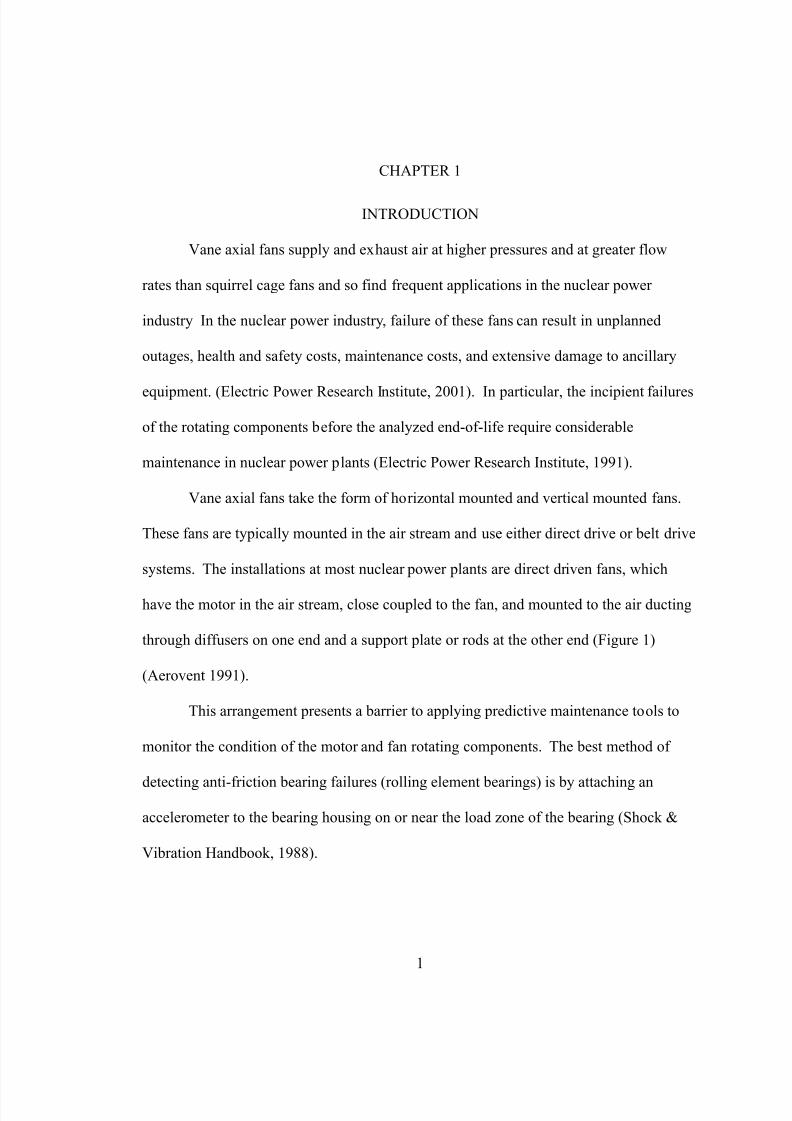
Vane axial fans supply and exhaust air at higher pressures and at greater flow
rates than squirrel cage fans and so find frequent applications in the nuclear power
industry In the nuclear power industry, failure of these fans can result in unplanned
outages, health and safety costs, maintenance costs, and extensive damage to ancillary
equipment. (Electric Power Research Institute, 2001). In particular, the incipient failures
of the rotating components before the analyzed end-of-life require considerable
maintenance in nuclear power plants (Electric Power Research Institute, 1991).
Vane axial fans take the form of horizontal mounted and vertical mounted fans.
These fans are typically mounted in the air stream and use either direct drive or belt drive
systems. The installations at most nuclear power plants are direct driven fans, which
have the motor in the air stream, close coupled to the fan, and mounted to the air ducting
through diffusers on one end and a support plate or rods at the other end (Figure 1)
(Aerovent 1991).
This arrangement presents a barrier to applying predictive maintenance tools to
monitor the condition of the motor and fan rotating components. The best method of
detecting anti-friction bearing failures (rolling element bearings) is by attaching an
accelerometer to the bearing housing on or near the load zone of the bearing (Shock &
Vibration Handbook, 1988).
Page 9
7/27/2019 Electric Motor Signature Analysis
http://slidepdf.com/reader/full/electric-motor-signature-analysis 9/119
2
Figure 1. Typical Direct Drive Vane-axial Fans (Aerovent Products, 1996).
Airflow
Typical all-thread
Airflow
Motor
Diffuser Fan Blade
Vertical Vane-Axial Fan
Airflow flows from the
fan to motor
Horizontal Vane-Axial Fan
Page 10
7/27/2019 Electric Motor Signature Analysis
http://slidepdf.com/reader/full/electric-motor-signature-analysis 10/119
3
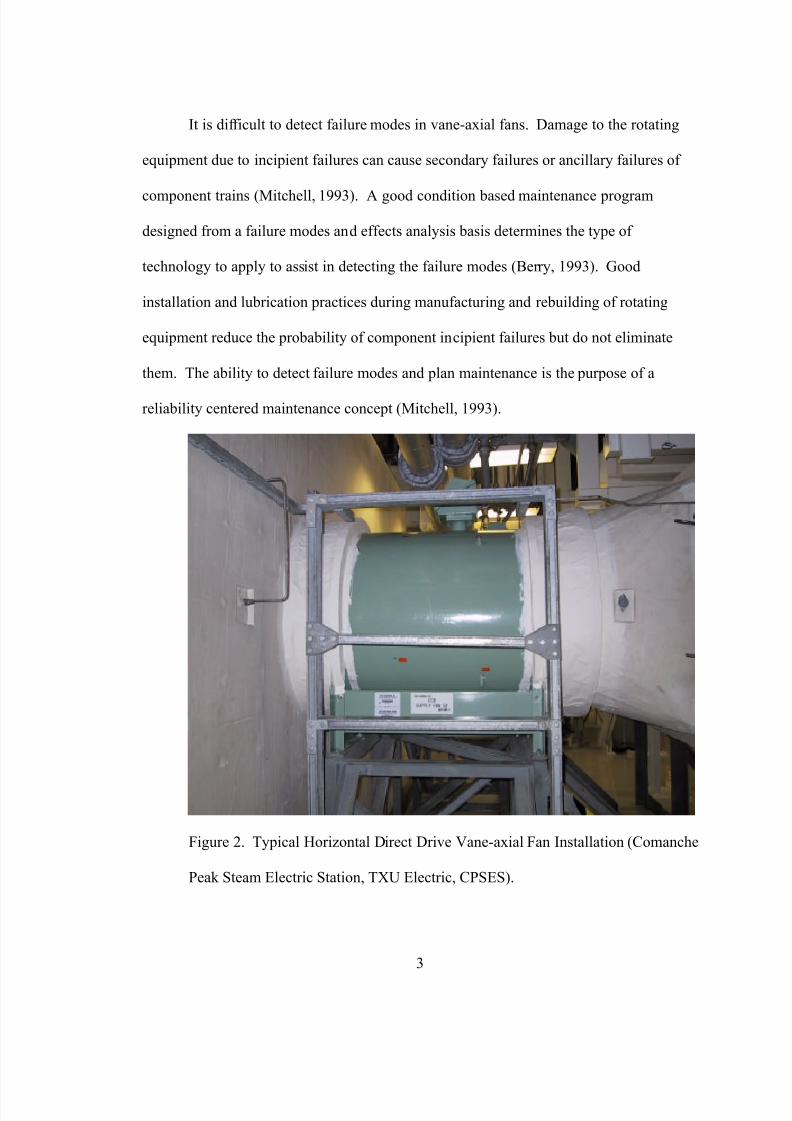
It is difficult to detect failure modes in vane-axial fans. Damage to the rotating
equipment due to incipient failures can cause secondary failures or ancillary failures of
component trains (Mitchell, 1993). A good condition based maintenance program
designed from a failure modes and effects analysis basis determines the type of
technology to apply to assist in detecting the failure modes (Berry, 1993). Good
installation and lubrication practices during manufacturing and rebuilding of rotating
equipment reduce the probability of component incipient failures but do not eliminate
them. The ability to detect failure modes and plan maintenance is the purpose of a
reliability centered maintenance concept (Mitchell, 1993).
Figure 2. Typical Horizontal Direct Drive Vane-axial Fan Installation (Comanche
Peak Steam Electric Station, TXU Electric, CPSES).
Page 11
7/27/2019 Electric Motor Signature Analysis
http://slidepdf.com/reader/full/electric-motor-signature-analysis 11/119
4
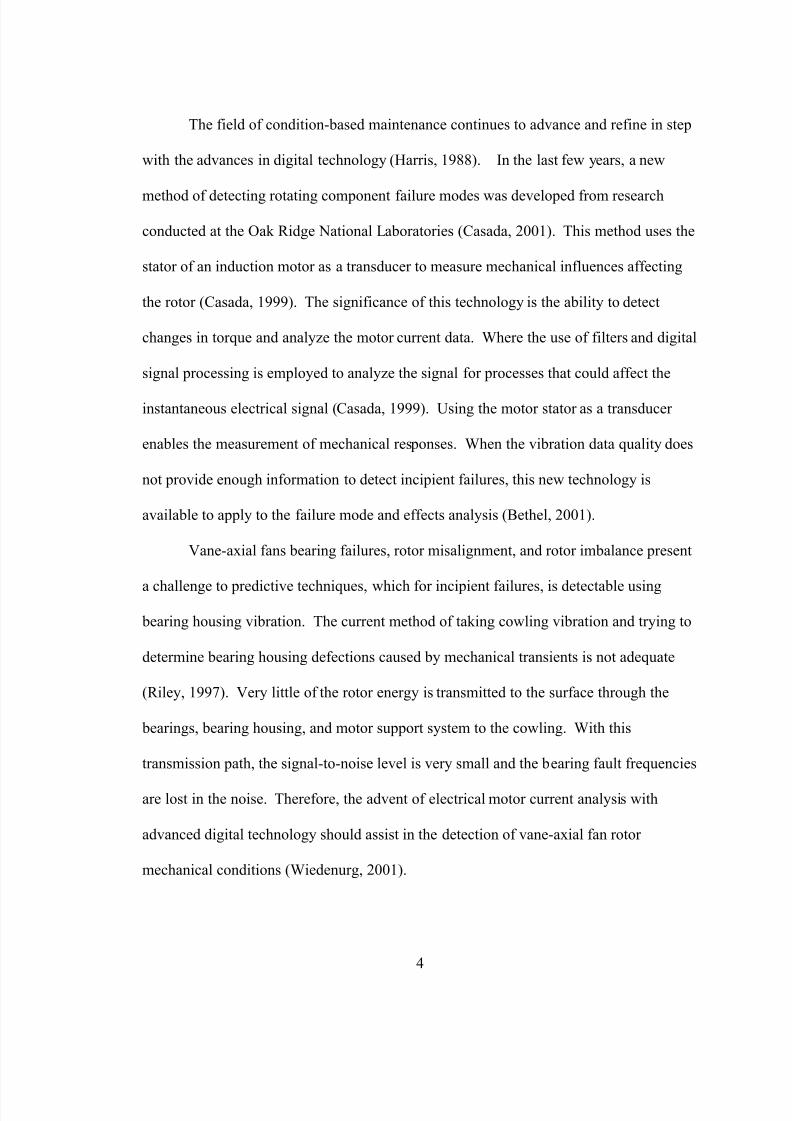
The field of condition-based maintenance continues to advance and refine in step
with the advances in digital technology (Harris, 1988). In the last few years, a new
method of detecting rotating component failure modes was developed from research
conducted at the Oak Ridge National Laboratories (Casada, 2001). This method uses the
stator of an induction motor as a transducer to measure mechanical influences affecting
the rotor (Casada, 1999). The significance of this technology is the ability to detect
changes in torque and analyze the motor current data. Where the use of filters and digital
signal processing is employed to analyze the signal for processes that could affect the
instantaneous electrical signal (Casada, 1999). Using the motor stator as a transducer
enables the measurement of mechanical responses. When the vibration data quality does
not provide enough information to detect incipient failures, this new technology is
available to apply to the failure mode and effects analysis (Bethel, 2001).
Vane-axial fans bearing failures, rotor misalignment, and rotor imbalance present
a challenge to predictive techniques, which for incipient failures, is detectable using
bearing housing vibration. The current method of taking cowling vibration and trying to
determine bearing housing defections caused by mechanical transients is not adequate
(Riley, 1997). Very little of the rotor energy is transmitted to the surface through the
bearings, bearing housing, and motor support system to the cowling. With this
transmission path, the signal-to-noise level is very small and the bearing fault frequencies
are lost in the noise. Therefore, the advent of electrical motor current analysis with
advanced digital technology should assist in the detection of vane-axial fan rotor
mechanical conditions (Wiedenurg, 2001).
Page 12
7/27/2019 Electric Motor Signature Analysis
http://slidepdf.com/reader/full/electric-motor-signature-analysis 12/119
5
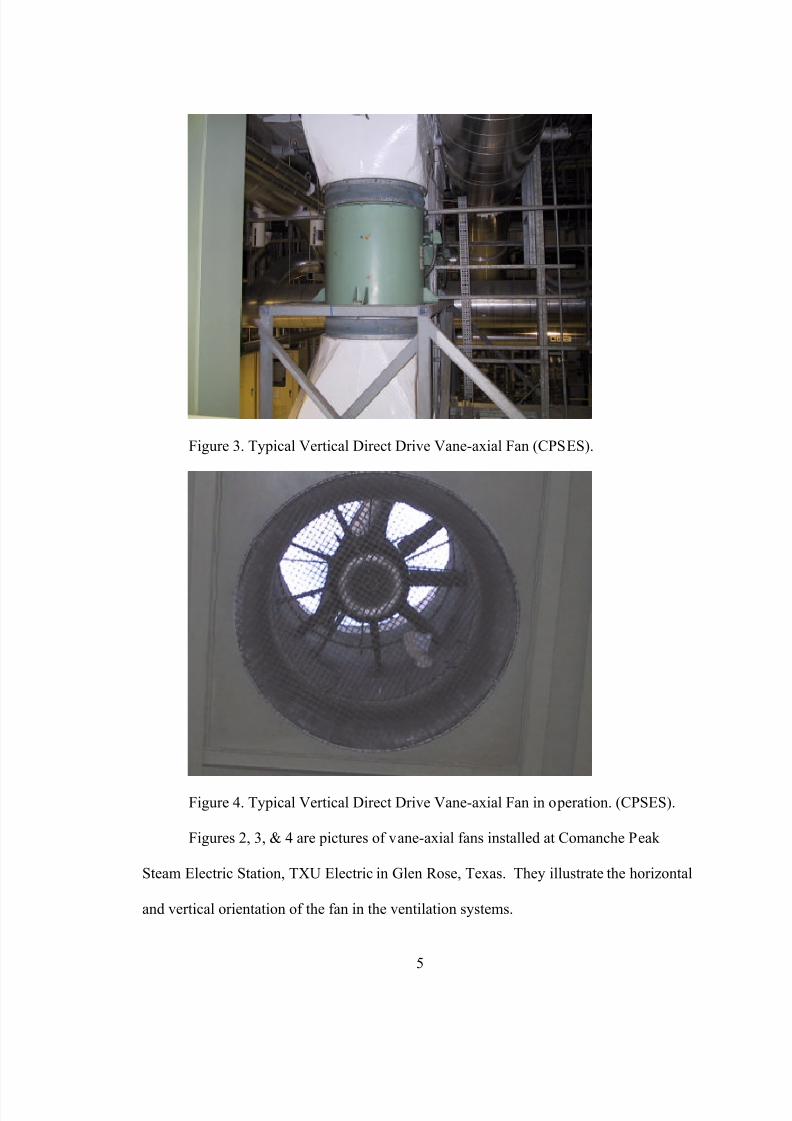
Figure 3. Typical Vertical Direct Drive Vane-axial Fan (CPSES).
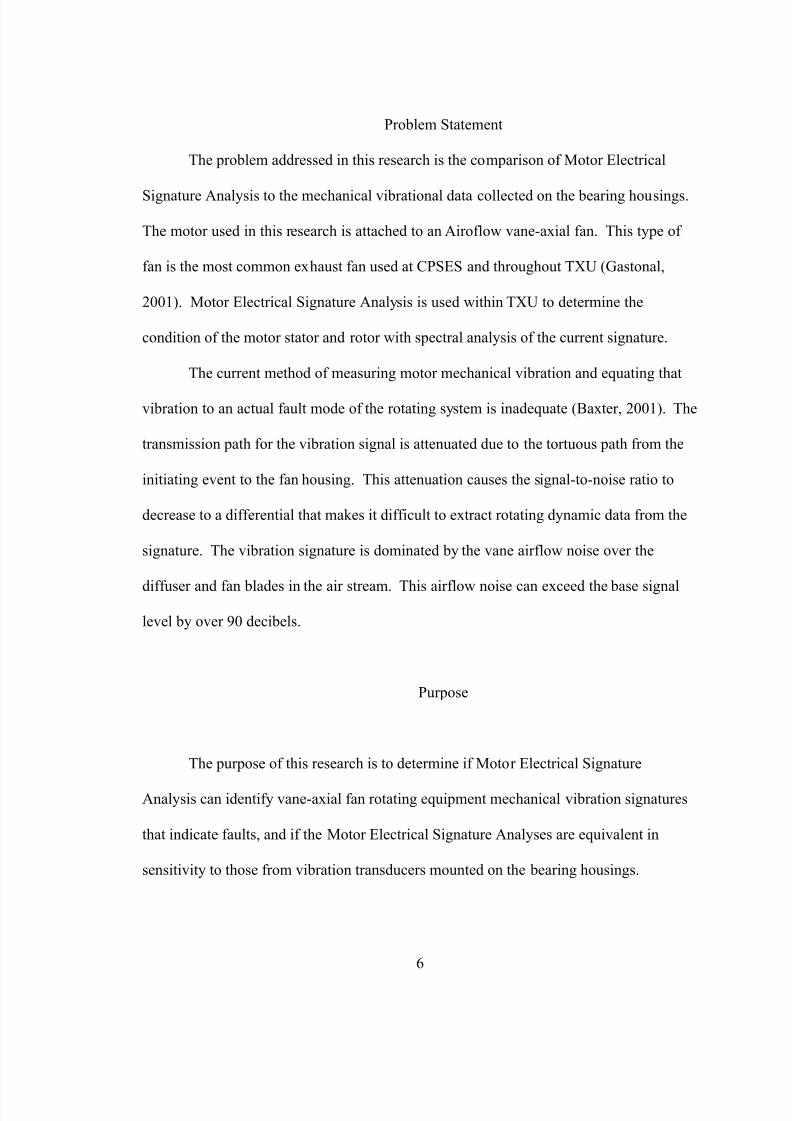
Figure 4. Typical Vertical Direct Drive Vane-axial Fan in operation. (CPSES).
Figures 2, 3, & 4 are pictures of vane-axial fans installed at Comanche Peak
Steam Electric Station, TXU Electric in Glen Rose, Texas. They illustrate the horizontal
and vertical orientation of the fan in the ventilation systems.
Page 13
7/27/2019 Electric Motor Signature Analysis
http://slidepdf.com/reader/full/electric-motor-signature-analysis 13/119
6
Problem Statement
The problem addressed in this research is the comparison of Motor Electrical
Signature Analysis to the mechanical vibrational data collected on the bearing housings.
The motor used in this research is attached to an Airoflow vane-axial fan. This type of
fan is the most common exhaust fan used at CPSES and throughout TXU (Gastonal,
2001). Motor Electrical Signature Analysis is used within TXU to determine the
condition of the motor stator and rotor with spectral analysis of the current signature.
The current method of measuring motor mechanical vibration and equating that
vibration to an actual fault mode of the rotating system is inadequate (Baxter, 2001). The
transmission path for the vibration signal is attenuated due to the tortuous path from the
initiating event to the fan housing. This attenuation causes the signal-to-noise ratio to
decrease to a differential that makes it difficult to extract rotating dynamic data from the
signature. The vibration signature is dominated by the vane airflow noise over the
diffuser and fan blades in the air stream. This airflow noise can exceed the base signal
level by over 90 decibels.
Purpose
The purpose of this research is to determine if Motor Electrical Signature
Analysis can identify vane-axial fan rotating equipment mechanical vibration signatures
that indicate faults, and if the Motor Electrical Signature Analyses are equivalent in
sensitivity to those from vibration transducers mounted on the bearing housings.
Page 14
7/27/2019 Electric Motor Signature Analysis
http://slidepdf.com/reader/full/electric-motor-signature-analysis 14/119
7
Research Questions
There were two research questions addressed by this thesis. The first research
question deals with the Motor Electrical Signature Analysis of bearing defect
frequencies:
1. Will the use of cowling mechanical vibration detect rotating system faults in the
motor rotor system compared to the bearing housing mechanical vibration?
This question has a corresponding null hypothesis 1 (Ho)1: there is no difference
between the change in the mechanical signature on the cowling and the change in the
baseline mechanical signature on the bearings housing. This is represented by equation 1
below where µ is the population of data collected for this comparative test.
µ diff (cowling - baseline) = 0 (1)
This question has an alternative hypothesis 2 (Ha)1: the difference between
cowling population and the bearing population is greater than zero. This is represented by
equation 2.
µ dif (cowling - baseline) > 0 (2)
The second research question deals with the Motor Electrical Signature Analysis
and rotor eccentricity and the effects on the motor bearing and the motor electrical
signature.
Page 15
7/27/2019 Electric Motor Signature Analysis
http://slidepdf.com/reader/full/electric-motor-signature-analysis 15/119
8
2. Will the use of Motor Electrical Signature Analysis detect changes in magnitude
indicated by amplitudes of the frequencies produced by rotating equipment faults?
This question has a corresponding null hypothesis 2 (Ho)2: there is no difference
between the change in the electrical signature and the change in the baseline mechanical
signature on the bearings housing due to rotating equipment faults. This is represented
by equation 3 below where µ is the population of data collected for this comparative test.
µ dif (MCSA-baseline) = 0 (3)
This question has an alternate hypothesis 2 (Ha)2: there is an increase in the motor
electrical signature analysis running speed spectra and the baseline bearing casing
spectral data. This is represented by equation 4.
µ dif (MCSA imbalance-baseline imbalance) > 0 (4)
Page 16
7/27/2019 Electric Motor Signature Analysis
http://slidepdf.com/reader/full/electric-motor-signature-analysis 16/119
9
Assumptions
The following assumptions applied to the research performed in the test and
comparison phase of this thesis:
1. The measuring and test equipment used in this research were assumed to
provide accurate measurements because the systems used were compared to a
calibrated system that is traceable to the national standards (Appendix D).
The systems used in the comparison were received and operated by the
companies sponsoring the systems.
2. The fan system used in this research was a new fan assembly removed from
the CPSES warehouse for this test. The fan is a typical fan used in exhaust
systems at CPSES. The support system for the fan is an internal frame welded
to the cowling (ducting), and differs from Joy axial-vane fans. This difference
does not affect the quality of the vibration measurements on the fan cowling.
3. All the bearings were new and unused; therefore, the bearing quality was
assumed to be within manufacturing tolerances.
4. The test stand used in the running of the motor does not affect the rotor
dynamics of the fan system.
5. Installation techniques were consistent with the techniques used in the field.
6. The data collection techniques are consistent with the collection techniques
used in the field.
7. The supply power was of a quality that would not interfere with the motor
electrical signal data collection.
Page 17
7/27/2019 Electric Motor Signature Analysis
http://slidepdf.com/reader/full/electric-motor-signature-analysis 17/119
10
Limitations
This research had the following limitations:
1. The test was performed on one type of motor application.
2. One test fan was used.
3. The test was performed at ambient temperature and humidity.
4. The test was performed at the same barometric pressure.
5. No known mechanical faults were present that could skew the data.
6. Testing was performed at TXU’s Smart Team Three test facilities.
Terminology
1. CPSES – Comanche Peak Steam Electric Station, TXU Electric
2. BPIR – Ball Pass Inner Race
3. BPOR – Ball Pass Outer Race
4. DFLL – Digital Frequency Locked Loop
5. MESA – Motor Electrical Signature Analysis
6. EPRI – Electric Power Research Institute
7. FFT – Fast Fourier Transform
8. ORNL – Oakridge National Laboratory
9. TXU – The name of the parent utility for Comanche Peak Steam Electric
Station
Page 18
7/27/2019 Electric Motor Signature Analysis
http://slidepdf.com/reader/full/electric-motor-signature-analysis 18/119
11
Overview of the Remainder of the Research
Chapter 2 provides a review of literature related to the thesis. Specifically
discussed are the motor current demodulation, instantaneous torque motor electrical
signature analysis, and vibration analysis as it applies to this research. Chapter 2
concludes with a review of literature for the basis of motor electrical signature analysis in
the nuclear industry, and related research.
Chapter 3 provides the details of the research including research design, control of
variables, sample selection and treatment, test equipment, and testing methodology. The
statistical basis for this research including sample size and objective criteria is also
provided.
Chapter 4 contains the testing results and the analysis as well as the observations
made during the testing. The conclusions reached from this research are discussed in
Chapter 5. Chapter 5 also contains recommendations for further research.
Page 19
7/27/2019 Electric Motor Signature Analysis
http://slidepdf.com/reader/full/electric-motor-signature-analysis 19/119
12
CHAPTER 2
REVIEW OF LITERATURE
The review of literature focused primarily on: MESA, vibration signal analysis,
stress wave analysis, and the dynamics in a rolling element bearing support system. Any
relevant research related to this topic at TXU or that dealt with the measurement of motor
electrical signal to detect rotor dynamics was reviewed.
Motor Electrical Review
The Electric Power Research Institute (EPRI) provides background information
on electrical motor fundamentals (EPRI 1991). According to the EPRI reference, there
are many different types of motors in use in the electric power industry. The poly-phase
induction motors are used to provide good starting torque and running torque
characteristics for a variety of applications within the power plants. Because bearings are
the primary cause of motor failure, proper maintenance and monitoring are a primary
concern of plant engineers and maintenance personnel.
In the circuit analysis of squirrel cage induction motors there are two types of
circuits: approximate and exact versions. No truly “exact” circuit exists. The reason is
that the electromagnetic components are non-linear due to the interactions between the
coils of wire and magnetic core. The motor windings exhibit no direct linear relationship
between applied voltage and current.
A second shortcoming of the equivalent circuit is its use of lumped or discrete
circuit elements, such as a single value of inductance to represent what is actually a
Page 20
7/27/2019 Electric Motor Signature Analysis
http://slidepdf.com/reader/full/electric-motor-signature-analysis 20/119
13
distributed value. That is, a coil in the motor does not exhibit an inductance and
resistance for the entire length, but each length has its own resistance and inductance.
These two items, lumped / discrete components and non-linear characteristics of
induction motors, inhibit the ability to use the motor stator as a transducer for the
mechanical characteristics of the rotor. With the complexity of each motor and the non-
linear quantities, a method of detecting rotor ailments using the stator was limited to rotor
bar issues and eccentricity between the rotor and stator (Casada, 1999).
When first evaluating a motor, the first method of data research is the nameplate
method. This is the most trivial and least intrusive, and in consequence usually the least
accurate. The motor ratings: efficiency, insulation class of winding, horsepower, current
draw, voltage, and service factor are listed on the nameplate. It is unlikely that the
machine will perform at the nominal efficiency. Load variations, as well as the non-
linearity of the motor along with source imbalances and harmonic components change the
efficiency. The nameplate is derived from a statistical evaluation of a class of motors and
does not necessarily coincide with the particular motor under observation (Wiedenbrug,
1998).
The electrical qualities of the motor are influenced by allowable manufacturing
tolerances, and the specifications allow for error in the nameplate data. NEMA specifies
up to 20% of error for the nameplate slip, and error in the rated current may be as large as
10% on a healthy induction motor, according to NEMA (Wiedenbrug, 1998).
The equivalent circuit is used to determine the characteristics of an induction
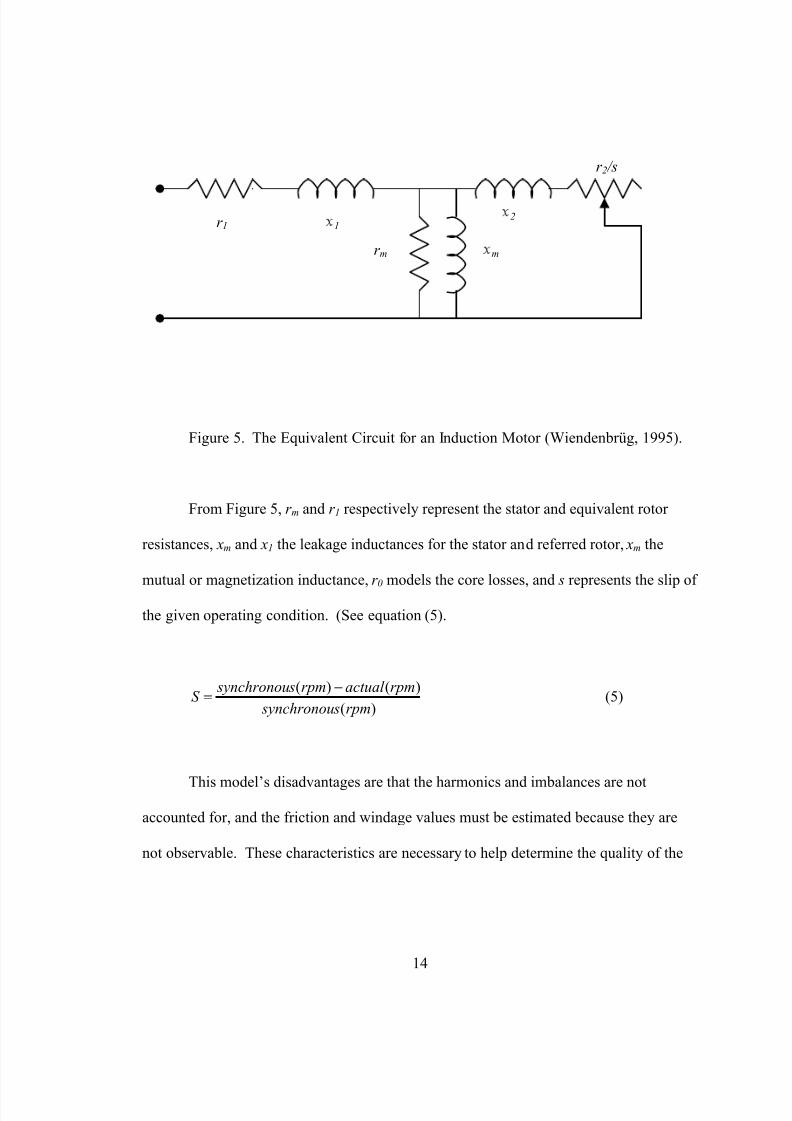
motor. Figure 5 shows the basic per phase equivalent circuit for an induction motor.
Page 21
7/27/2019 Electric Motor Signature Analysis
http://slidepdf.com/reader/full/electric-motor-signature-analysis 21/119
14
Figure 5. The Equivalent Circuit for an Induction Motor (Wiendenbrüg, 1995).
From Figure 5, r m and r 1 respectively represent the stator and equivalent rotor
resistances, xm and x1 the leakage inductances for the stator and referred rotor, xm the
mutual or magnetization inductance, r 0 models the core losses, and s represents the slip of
the given operating condition. (See equation (5).
)(
)()(
rpm s synchronou
rpmactual rpm s synchronouS
−= (5)
This model’s disadvantages are that the harmonics and imbalances are not
accounted for, and the friction and windage values must be estimated because they are
not observable. These characteristics are necessary to help determine the quality of the
r 1 1
r m m
2
r 2 /s
Page 22
7/27/2019 Electric Motor Signature Analysis
http://slidepdf.com/reader/full/electric-motor-signature-analysis 22/119
15
signal and the measurable values that could be used in determining the rotor condition.
The methods for the MESA have varied approaches (Wiedenbrug, 1998).
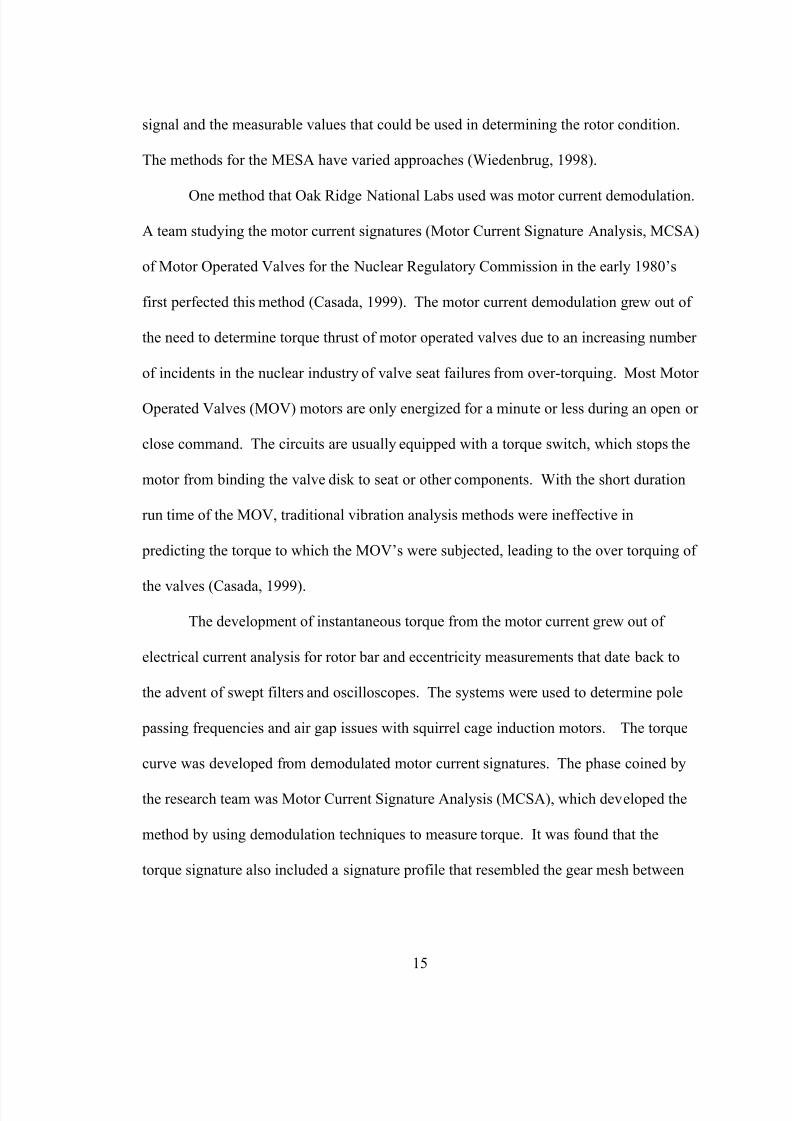
One method that Oak Ridge National Labs used was motor current demodulation.
A team studying the motor current signatures (Motor Current Signature Analysis, MCSA)
of Motor Operated Valves for the Nuclear Regulatory Commission in the early 1980’s
first perfected this method (Casada, 1999). The motor current demodulation grew out of
the need to determine torque thrust of motor operated valves due to an increasing number
of incidents in the nuclear industry of valve seat failures from over-torquing. Most Motor
Operated Valves (MOV) motors are only energized for a minute or less during an open or
close command. The circuits are usually equipped with a torque switch, which stops the
motor from binding the valve disk to seat or other components. With the short duration
run time of the MOV, traditional vibration analysis methods were ineffective in
predicting the torque to which the MOV’s were subjected, leading to the over torquing of
the valves (Casada, 1999).
The development of instantaneous torque from the motor current grew out of
electrical current analysis for rotor bar and eccentricity measurements that date back to
the advent of swept filters and oscilloscopes. The systems were used to determine pole
passing frequencies and air gap issues with squirrel cage induction motors. The torque
curve was developed from demodulated motor current signatures. The phase coined by
the research team was Motor Current Signature Analysis (MCSA), which developed the
method by using demodulation techniques to measure torque. It was found that the
torque signature also included a signature profile that resembled the gear mesh between
Page 23
7/27/2019 Electric Motor Signature Analysis
http://slidepdf.com/reader/full/electric-motor-signature-analysis 23/119
16
the drive and the gear system that transmitted the torque developed by the motor to drive
of the valve stem (Casada, 1999).
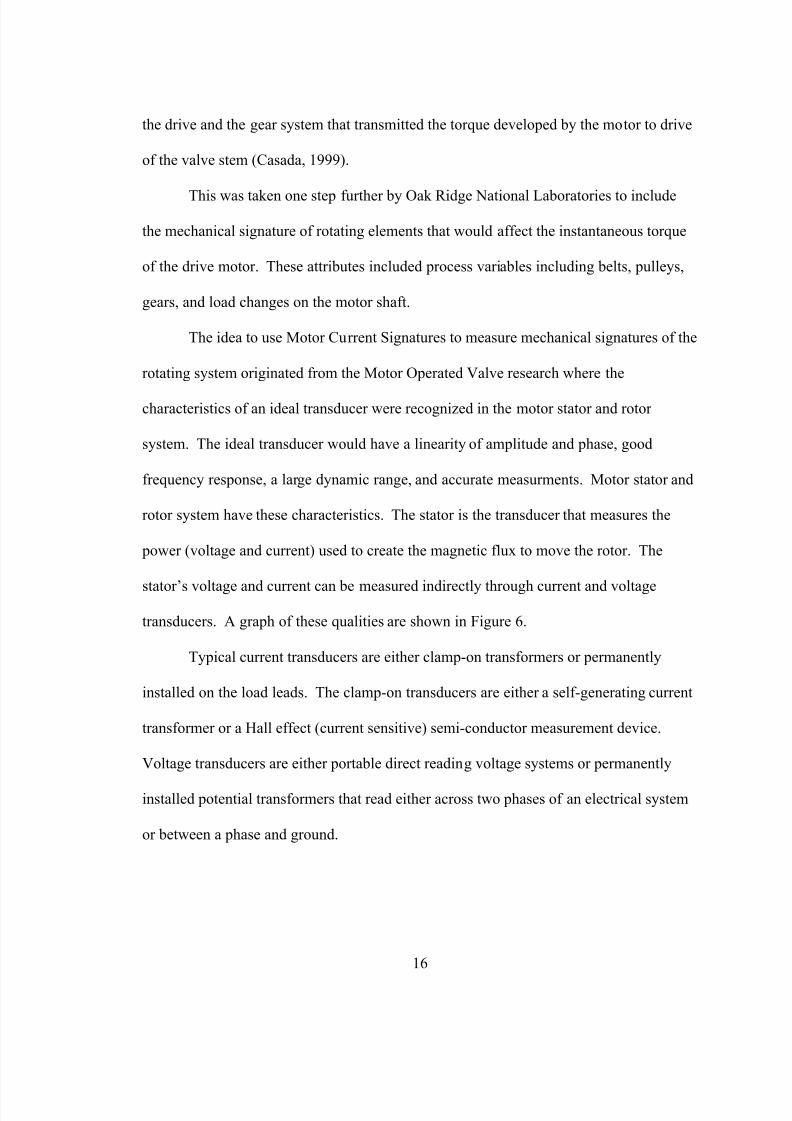
This was taken one step further by Oak Ridge National Laboratories to include
the mechanical signature of rotating elements that would affect the instantaneous torque
of the drive motor. These attributes included process variables including belts, pulleys,
gears, and load changes on the motor shaft.
The idea to use Motor Current Signatures to measure mechanical signatures of the
rotating system originated from the Motor Operated Valve research where the
characteristics of an ideal transducer were recognized in the motor stator and rotor
system. The ideal transducer would have a linearity of amplitude and phase, good
frequency response, a large dynamic range, and accurate measurments. Motor stator and
rotor system have these characteristics. The stator is the transducer that measures the
power (voltage and current) used to create the magnetic flux to move the rotor. The
stator’s voltage and current can be measured indirectly through current and voltage
transducers. A graph of these qualities are shown in Figure 6.
Typical current transducers are either clamp-on transformers or permanently
installed on the load leads. The clamp-on transducers are either a self-generating current
transformer or a Hall effect (current sensitive) semi-conductor measurement device.
Voltage transducers are either portable direct reading voltage systems or permanently
installed potential transformers that read either across two phases of an electrical system
or between a phase and ground.
Page 24
7/27/2019 Electric Motor Signature Analysis
http://slidepdf.com/reader/full/electric-motor-signature-analysis 24/119
17
Figure 6. Motor Data for Typical Induction Motor (reprinted by permission – Casada,
1999).
The proceeding figure shows the electrical characteristics of a one hundred fifty
horsepower induction motor. The vertical axis is broken into four (4) scales: torque,
power factor, current / power, and speed. The horizontal axis is the amount of output
power that is applied to the motor. This power is usually a function of the mechanical
system’s design (Casada, 1999). The curves are the different functions over the output
power of the motor. Oakridge National Laborites used these curves to develop the first
generation of Motor Current Signature Analysis (Casada, 1999).
Page 25
7/27/2019 Electric Motor Signature Analysis
http://slidepdf.com/reader/full/electric-motor-signature-analysis 25/119
18
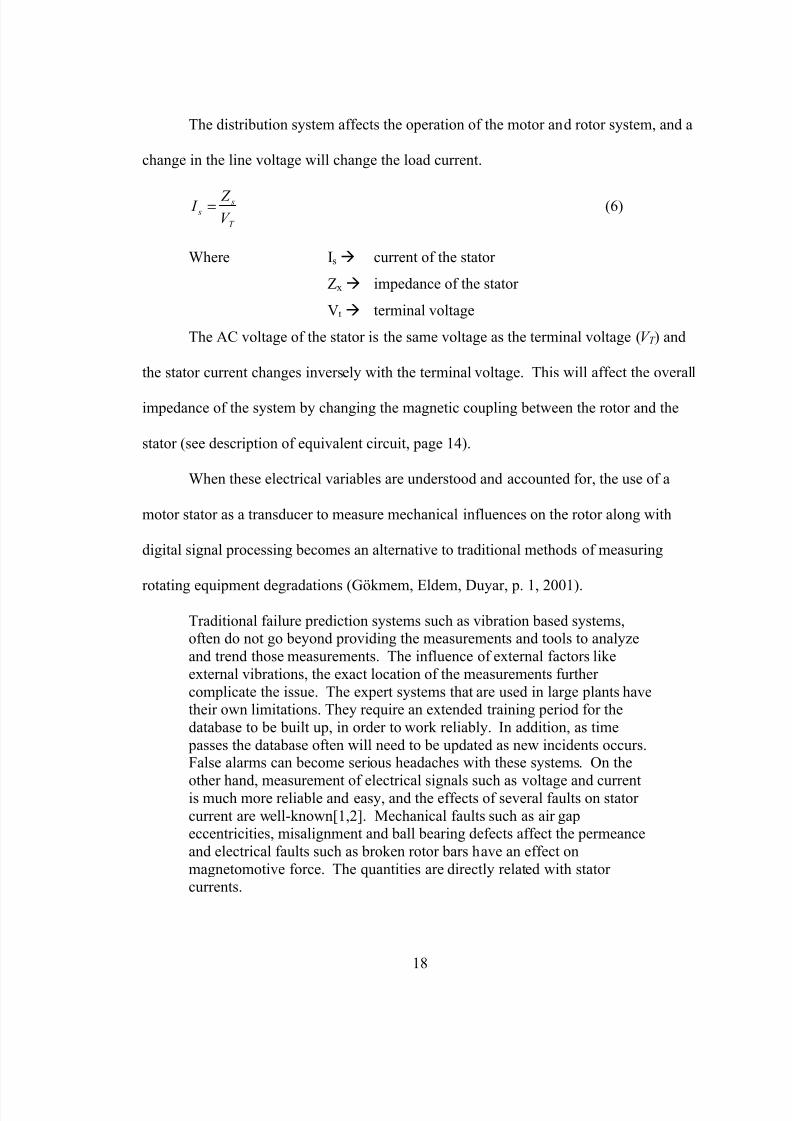
The distribution system affects the operation of the motor and rotor system, and a
change in the line voltage will change the load current.
T
s s
V Z I = (6)
Where Is à current of the stator
Zx à impedance of the stator
Vt à terminal voltage
The AC voltage of the stator is the same voltage as the terminal voltage (V T ) and
the stator current changes inversely with the terminal voltage. This will affect the overall
impedance of the system by changing the magnetic coupling between the rotor and the
stator (see description of equivalent circuit, page 14).
When these electrical variables are understood and accounted for, the use of a
motor stator as a transducer to measure mechanical influences on the rotor along with
digital signal processing becomes an alternative to traditional methods of measuring
rotating equipment degradations (Gökmem, Eldem, Duyar, p. 1, 2001).
Traditional failure prediction systems such as vibration based systems,often do not go beyond providing the measurements and tools to analyzeand trend those measurements. The influence of external factors likeexternal vibrations, the exact location of the measurements further complicate the issue. The expert systems that are used in large plants havetheir own limitations. They require an extended training period for thedatabase to be built up, in order to work reliably. In addition, as time passes the database often will need to be updated as new incidents occurs.False alarms can become serious headaches with these systems. On the
other hand, measurement of electrical signals such as voltage and currentis much more reliable and easy, and the effects of several faults on stator current are well-known[1,2]. Mechanical faults such as air gapeccentricities, misalignment and ball bearing defects affect the permeanceand electrical faults such as broken rotor bars have an effect onmagnetomotive force. The quantities are directly related with stator currents.
Page 26
7/27/2019 Electric Motor Signature Analysis
http://slidepdf.com/reader/full/electric-motor-signature-analysis 26/119
19
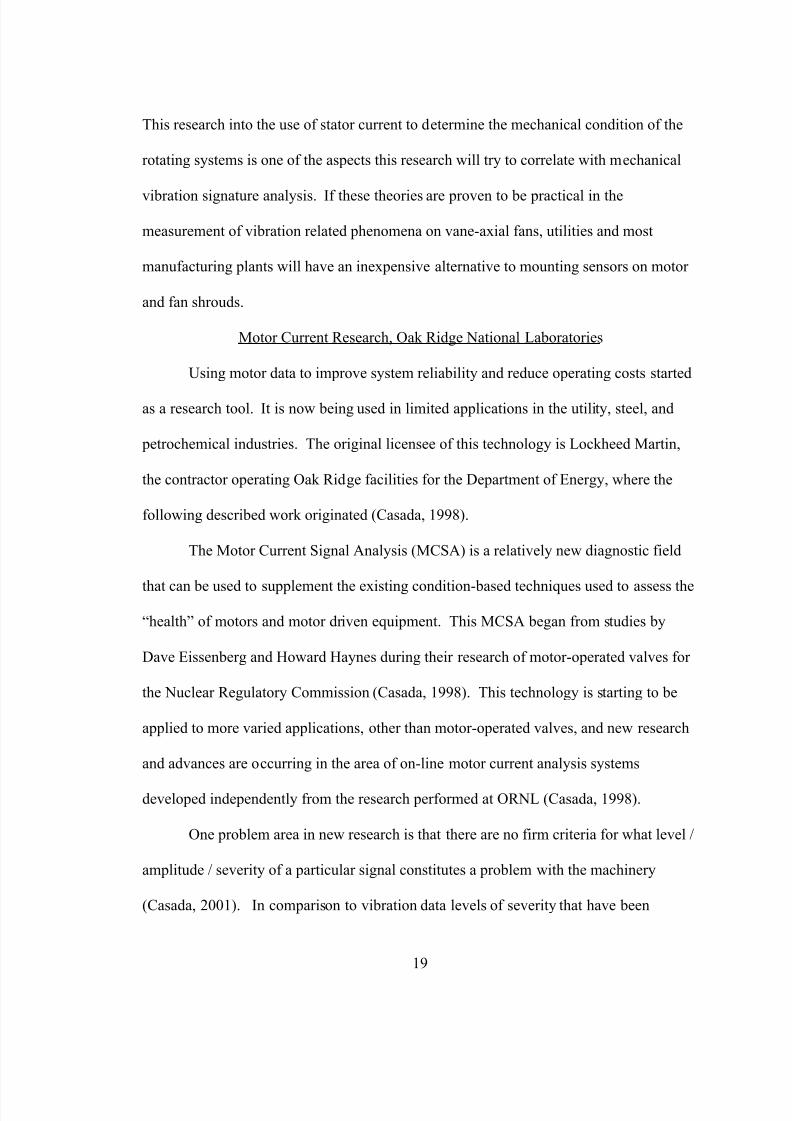
This research into the use of stator current to determine the mechanical condition of the
rotating systems is one of the aspects this research will try to correlate with mechanical
vibration signature analysis. If these theories are proven to be practical in the
measurement of vibration related phenomena on vane-axial fans, utilities and most
manufacturing plants will have an inexpensive alternative to mounting sensors on motor
and fan shrouds.
Motor Current Research, Oak Ridge National Laboratories
Using motor data to improve system reliability and reduce operating costs started
as a research tool. It is now being used in limited applications in the utility, steel, and
petrochemical industries. The original licensee of this technology is Lockheed Martin,
the contractor operating Oak Ridge facilities for the Department of Energy, where the
following described work originated (Casada, 1998).
The Motor Current Signal Analysis (MCSA) is a relatively new diagnostic field
that can be used to supplement the existing condition-based techniques used to assess the
“health” of motors and motor driven equipment. This MCSA began from studies by
Dave Eissenberg and Howard Haynes during their research of motor-operated valves for
the Nuclear Regulatory Commission (Casada, 1998). This technology is starting to be
applied to more varied applications, other than motor-operated valves, and new research
and advances are occurring in the area of on-line motor current analysis systems
developed independently from the research performed at ORNL (Casada, 1998).
One problem area in new research is that there are no firm criteria for what level /
amplitude / severity of a particular signal constitutes a problem with the machinery
(Casada, 2001). In comparison to vibration data levels of severity that have been
Page 27
7/27/2019 Electric Motor Signature Analysis
http://slidepdf.com/reader/full/electric-motor-signature-analysis 27/119
20
developed over the years of research and application, the “Rules of Thumb” have not
been uniformly adopted over the years. In the vibration domain as well as in this
emerging technology, trending is a more important activity in condition monitoring (in
most cases) than the absolute overall magnitude of the signal. This is due to difficulty of
quantifying the setting of rigid severity levels (Casada, 2001).
The use of motors as a possible transducer has its appeal because over half of the
electrical generation in the U.S.A. is used to drive induction motors. The cost of motor
usage exceeds $ 90 billion per year, there are over 125 million motors in the 1 to 125
horsepower range used in industrial applications (Casada, 1998 & EPRI, 1991). With
this large population of motors used in a multitude of different applications, the idea of
developing the motor stator as a transducer is appealing for repeatability and quality of
the reproduced signal (Casada, 2001).
The qualities of a good transducer are a good description of the stator rotor system
of an induction motor. Not only is the linearity, frequency response, dynamic range,
accuracy, and repeatability important during data collection, but it carries over to all steps
in the signal processing. One variable that is hard to control during data collection on
electrical equipment is the bus voltage variations. These variations in relation to the use
of a motor as a transducer affect the current signal in the stator of the motor. These
variances affect the current, but power is relatively stable since the power in an induction
motor is controlled in large by the load (Casada, 1998).
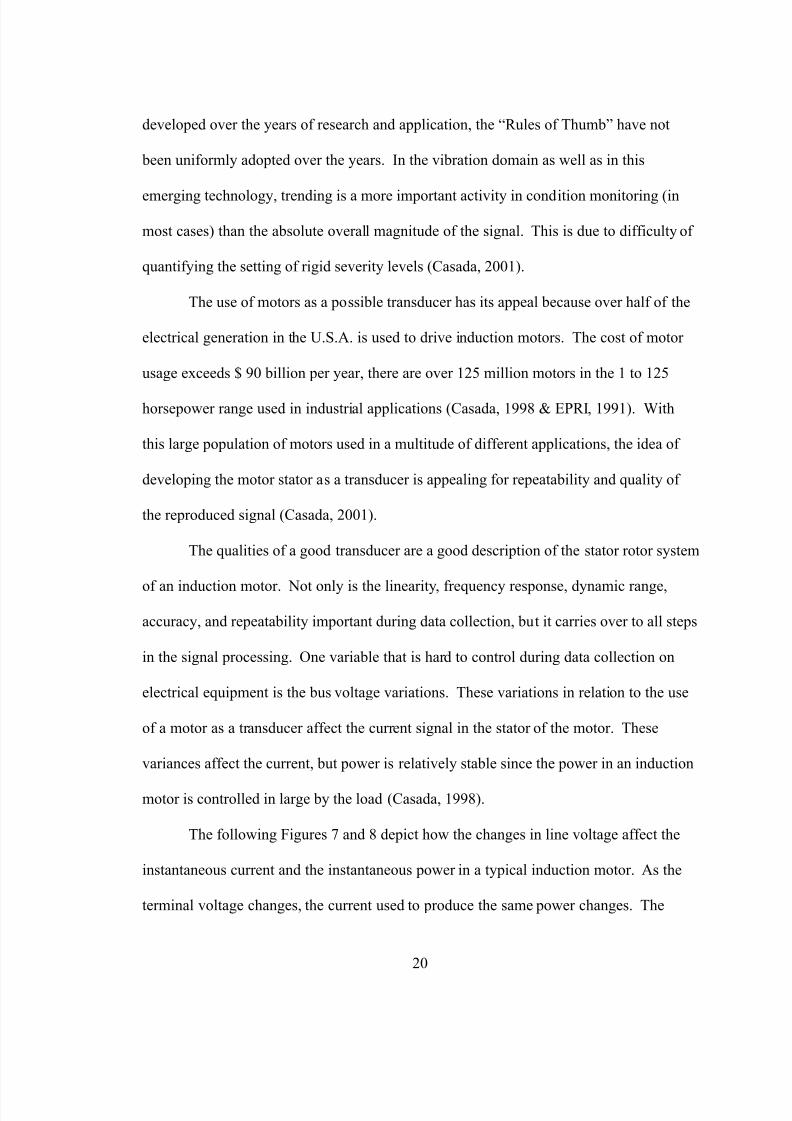
The following Figures 7 and 8 depict how the changes in line voltage affect the
instantaneous current and the instantaneous power in a typical induction motor. As the
terminal voltage changes, the current used to produce the same power changes. The
Page 28
7/27/2019 Electric Motor Signature Analysis
http://slidepdf.com/reader/full/electric-motor-signature-analysis 28/119
21
voltage and current are inversely proportional: as the terminal voltage increases, the
current decreases. In Figure 7, the bus voltage increase from 95% nominal to 100%
nominal terminal voltage while the average current decreases from 119.5 amps to 114
amps.
Figure 7. Changes in Bus Voltages Effect on Motor Current (Casada, 1998).
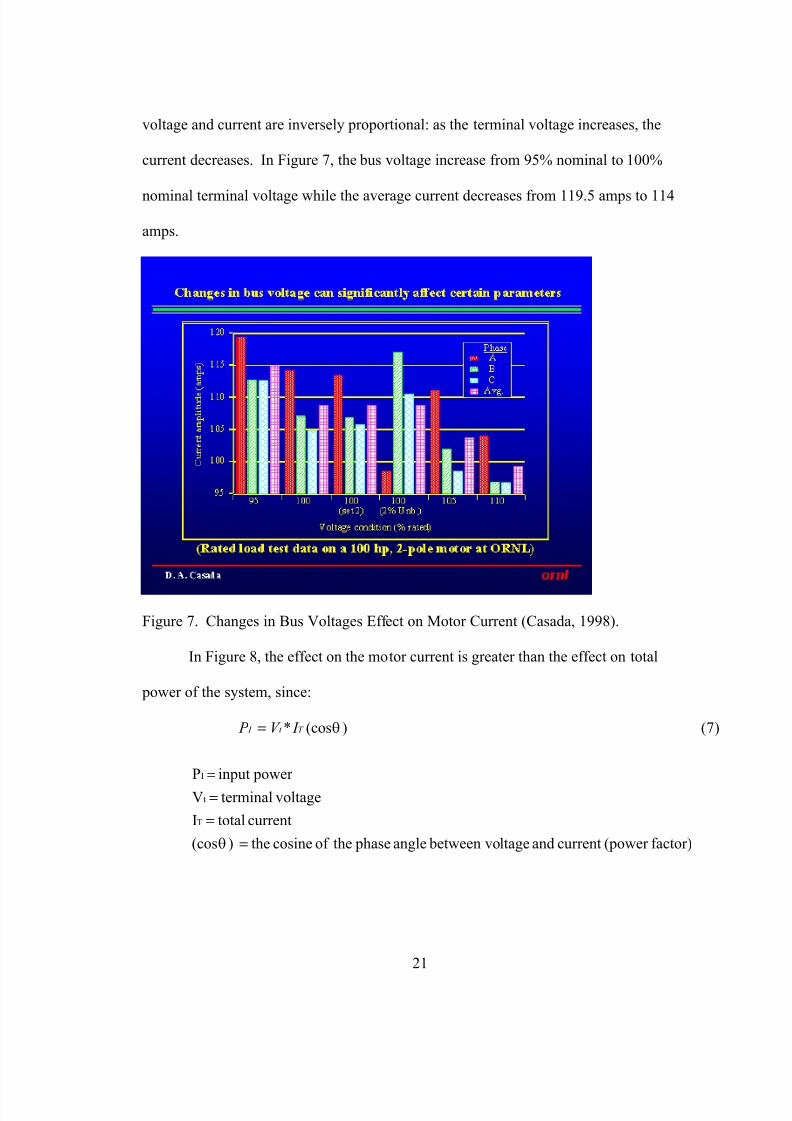
In Figure 8, the effect on the motor current is greater than the effect on total
power of the system, since:
factor)(power currentandltage between voangle phasetheof cosinethe)(cos
currenttotalI
voltageterminalV
power inputP
)7()(cos*
T
t
I
====
=
θ
θT t I I V P
Page 29
7/27/2019 Electric Motor Signature Analysis
http://slidepdf.com/reader/full/electric-motor-signature-analysis 29/119
22
The change in terminal voltage does not appreciably change the total power used by the
motor but does affect the current draw.
Figure 8. Relative Constant Power Consumption with Bus Voltage Changes (Casada,
1998).
Signal conditioning and the methods of processing the signal are important to the
stator if it is used as a transducer. Some of the diagnostic tools used in the processing of
the signal are broken into two distinct parts, demodulation and filtering. Demodulation
of the signal can be either analog or digital. The analog demodulation does not
significantly change the signal-to-noise ratio found in the original signal. Some digital
demodulation techniques will decrease the signal-to-noise ratio depending on dynamic
range of the processor and signal condition. The one area of improvement is the time
saved in the CPU computation by analog demodulation. Other factors that come into play
Page 30
7/27/2019 Electric Motor Signature Analysis
http://slidepdf.com/reader/full/electric-motor-signature-analysis 30/119
23
in the demodulation of induction motor signals are the amplitude of the signal and phase
relationship between the demodulated signal and the original (Casada, 1998).
The other part of the pre-processing prior to signal analysis is the filtering. The
different methods used for demodulation of current signals, or any signal for that matter,
is the use of low-pass for anti-aliasing, low frequency noise (DC) high-pass (Casada,
1998).
Demodulation of the current signal uses amplitude demodulation, which is the
same as an AM radio demodulator. The carrier wave is the 60 Hz alternating current,
after the current is demodulated. What is left is the signal due to varying load on the
motor. Since line-voltage affects the quality of the AC current, care is needed to ensure
line voltages are stable (Casada, 1998).
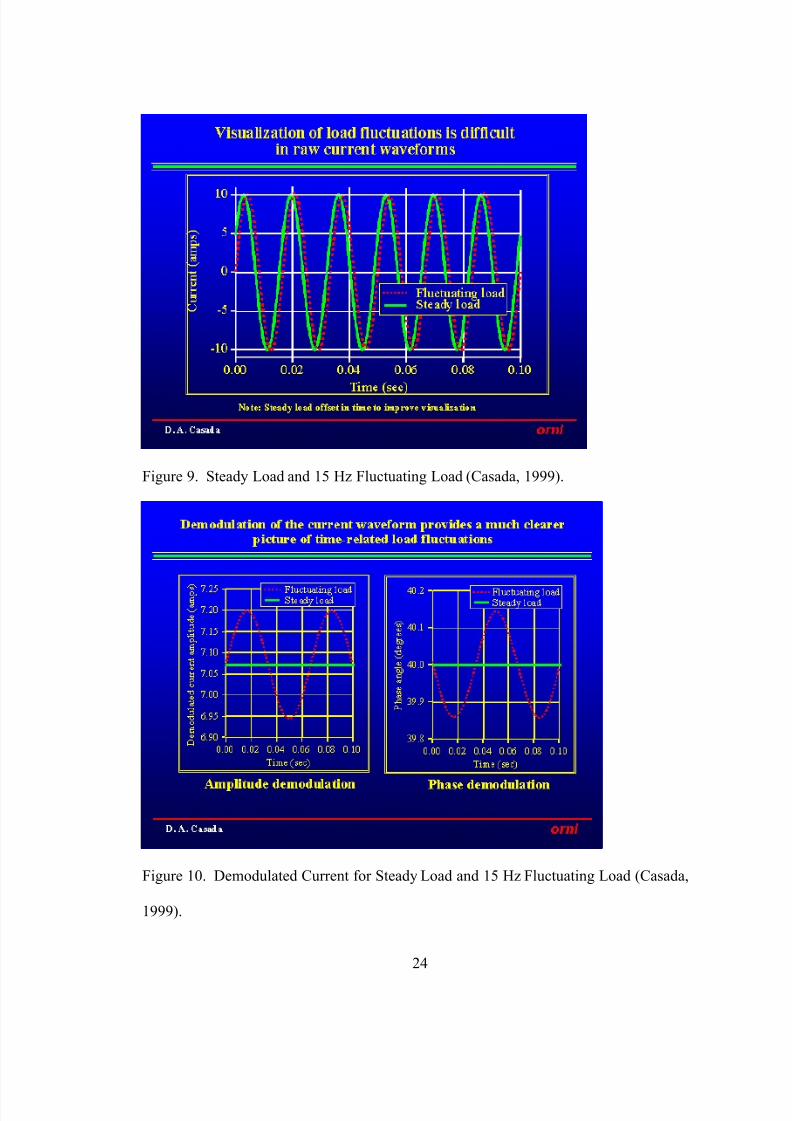
The following Figures 9 and 10 show an example of demodulating the AC current
in a motor assuming constant line voltages. Without demodulating the AC current, it is
almost impossible to differentiate the difference between a steady load signature and a
fluctuating load signature. In Figure 9, the fluctuation load is the red-dotted line, while
the steady load is the green line. There may be some phase difference with the peak
current time varying, but the actual load changes are difficult to discern.
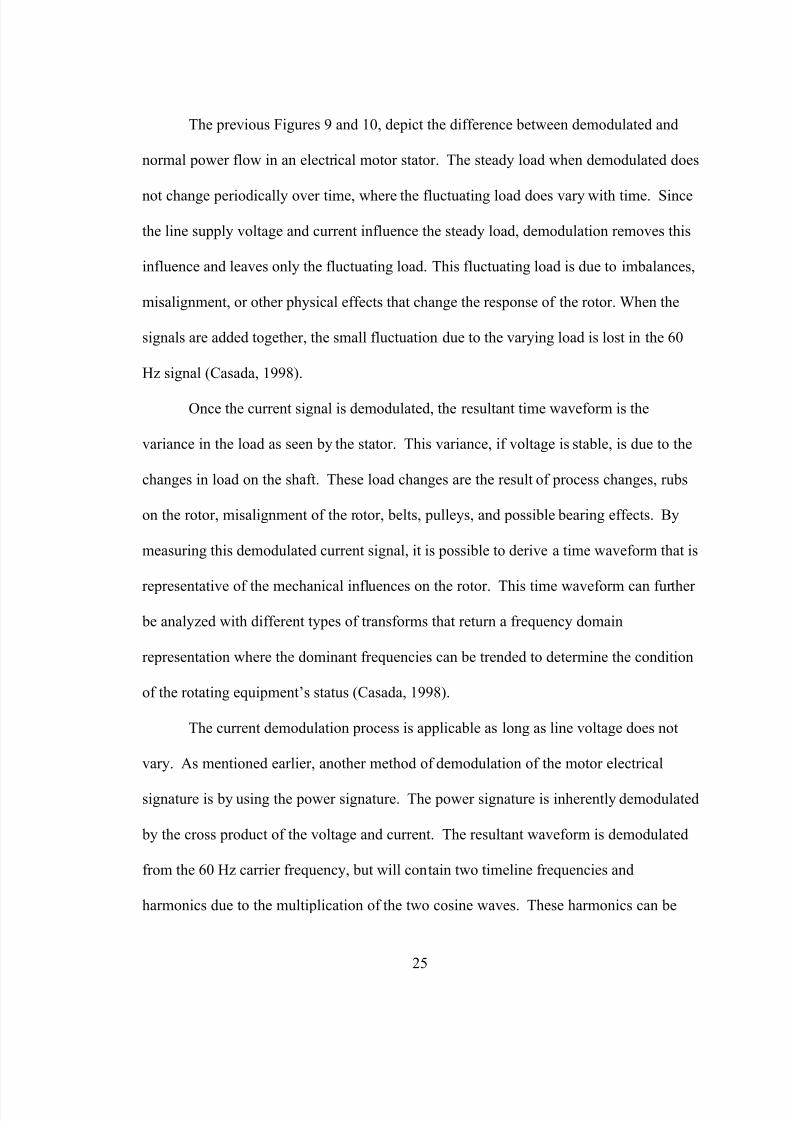
In Figure 10, the fluctuating load is once again the red-dotted line and the steady
load is the green line. This figure shows how, in demodulation, the steady load has no
current or phase variation over time whereas the fluctuation load current and phase varies
periodically over time.
Page 31
7/27/2019 Electric Motor Signature Analysis
http://slidepdf.com/reader/full/electric-motor-signature-analysis 31/119
Page 32
7/27/2019 Electric Motor Signature Analysis
http://slidepdf.com/reader/full/electric-motor-signature-analysis 32/119
25
The previous Figures 9 and 10, depict the difference between demodulated and
normal power flow in an electrical motor stator. The steady load when demodulated does
not change periodically over time, where the fluctuating load does vary with time. Since
the line supply voltage and current influence the steady load, demodulation removes this
influence and leaves only the fluctuating load. This fluctuating load is due to imbalances,
misalignment, or other physical effects that change the response of the rotor. When the
signals are added together, the small fluctuation due to the varying load is lost in the 60
Hz signal (Casada, 1998).
Once the current signal is demodulated, the resultant time waveform is the
variance in the load as seen by the stator. This variance, if voltage is stable, is due to the
changes in load on the shaft. These load changes are the result of process changes, rubs
on the rotor, misalignment of the rotor, belts, pulleys, and possible bearing effects. By
measuring this demodulated current signal, it is possible to derive a time waveform that is
representative of the mechanical influences on the rotor. This time waveform can further
be analyzed with different types of transforms that return a frequency domain
representation where the dominant frequencies can be trended to determine the condition
of the rotating equipment’s status (Casada, 1998).
The current demodulation process is applicable as long as line voltage does not
vary. As mentioned earlier, another method of demodulation of the motor electrical
signature is by using the power signature. The power signature is inherently demodulated
by the cross product of the voltage and current. The resultant waveform is demodulated
from the 60 Hz carrier frequency, but will contain two timeline frequencies and
harmonics due to the multiplication of the two cosine waves. These harmonics can be
Page 33
7/27/2019 Electric Motor Signature Analysis
http://slidepdf.com/reader/full/electric-motor-signature-analysis 33/119
26
removed by using a low pass filter system (Casada, 2001). Later in this chapter, we will
discuss the frequencies of concern in most AC induction motor’s mechanical signatures
and generation of these frequencies.
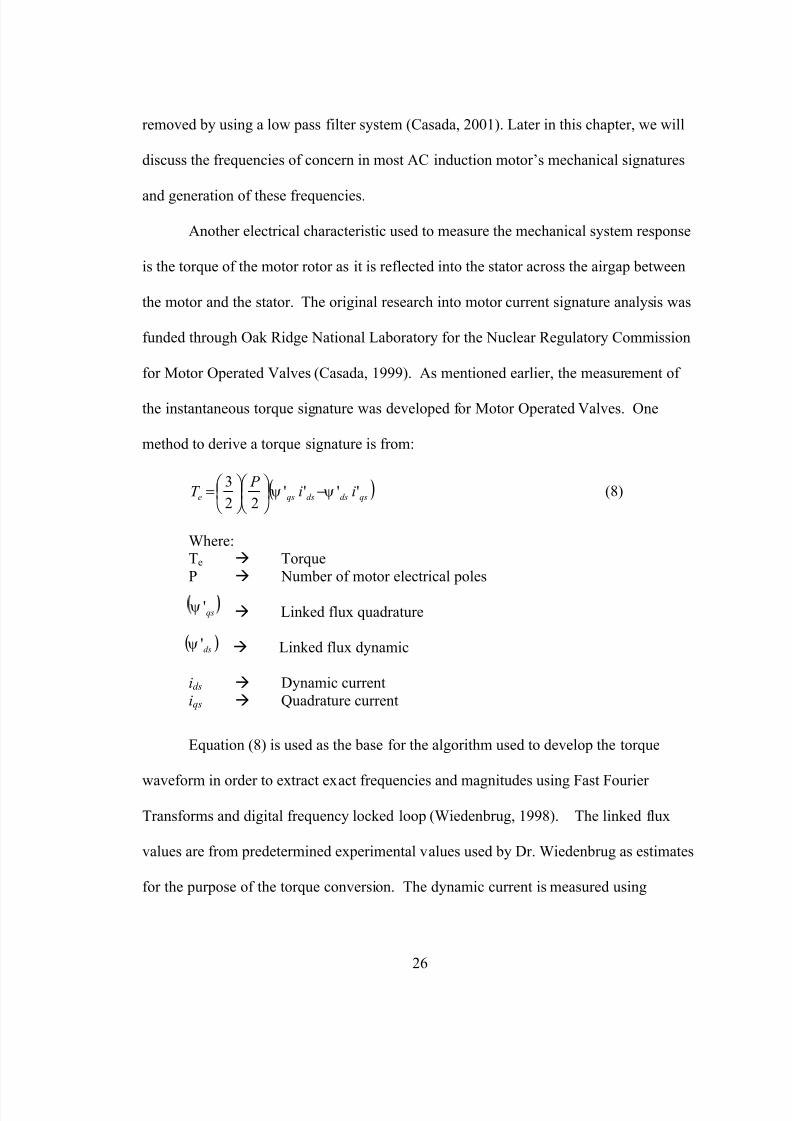
Another electrical characteristic used to measure the mechanical system response
is the torque of the motor rotor as it is reflected into the stator across the airgap between
the motor and the stator. The original research into motor current signature analysis was
funded through Oak Ridge National Laboratory for the Nuclear Regulatory Commission
for Motor Operated Valves (Casada, 1999). As mentioned earlier, the measurement of
the instantaneous torque signature was developed for Motor Operated Valves. One
method to derive a torque signature is from:
( )qsdsdsqse ii
P T ''''
22
3ψψ −
= (8)
Where:Te à TorqueP à Number of motor electrical poles
à Linked flux quadrature
à Linked flux dynamic
ids à Dynamic currentiqs à Quadrature current
Equation (8) is used as the base for the algorithm used to develop the torque
waveform in order to extract exact frequencies and magnitudes using Fast Fourier
Transforms and digital frequency locked loop (Wiedenbrug, 1998). The linked flux
values are from predetermined experimental values used by Dr. Wiedenbrug as estimates
for the purpose of the torque conversion. The dynamic current is measured using
qs'ψ
( )ds'ψ
Page 34
7/27/2019 Electric Motor Signature Analysis
http://slidepdf.com/reader/full/electric-motor-signature-analysis 34/119
27
“clamp-on” transducers and the quadrature current is calculated from the linked flux
calculations (Wiedenbrug, 1998).
The digital frequency locked loop (DFLL) is a wavelet function used to extract
the exact frequencies of complex waveforms, such as the torque signal, in a short sample
time. The advantage of DFLL is that the initial data collection time is quicker than the
time requirement for FFT and spectrum functions. FFT’s assume that the signal is of
infinite duration in time and since the signal is not infinite, artifacts arise such as alias
frequencies, sums and differences, etc. The wavelet has certain frequency components,
while bundling its energy to a short duration in time. It is very important to note that it is
not necessary to have a sinusoidal wave component for the wavelet to work. In induction
motors, the sinusoidal wave can be used effectively to filter out certain frequencies from
the spectrum (Wiedenbrug, 1998).
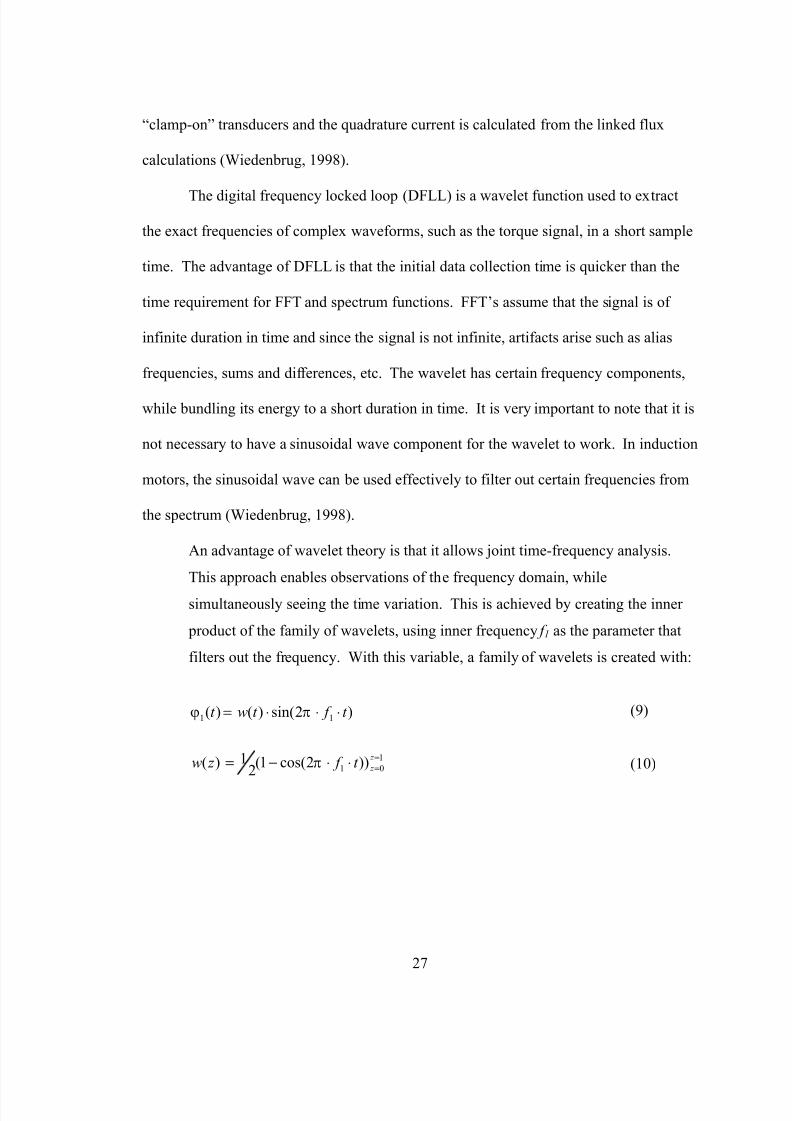
An advantage of wavelet theory is that it allows joint time-frequency analysis.
This approach enables observations of the frequency domain, while
simultaneously seeing the time variation. This is achieved by creating the inner
product of the family of wavelets, using inner frequency f 1 as the parameter that
filters out the frequency. With this variable, a family of wavelets is created with:
(9)
(10)1
01
11
))2cos(1(2
1)(
)2sin()()(
==⋅⋅−=
⋅⋅⋅=
z
z t f z w
t f t wt
π
πϕ
Page 35
7/27/2019 Electric Motor Signature Analysis
http://slidepdf.com/reader/full/electric-motor-signature-analysis 35/119
28
Where:
f 1à Wavelet functionwà Window functionzà Proportional to time, ranging from 0 to 1f l à Inner frequency used to filter out specific frequenciestà time
Equation 9 and 10, wavelet and window functions for DLL (Wiedenburg, 1998)
The wavelet theory is basically composed of two waveforms. The wavelet
function is used to filter torque using the windowing function to extract the frequency
domain amplitude and frequency as defined by the wavelet function. The wavelet
function is tuned to a specific frequency, then it is passed through the instantaneous
torque function which determines the frequency to within 0.001 Hz. This can be
accomplished within a 10-second data acquisition. This is substantially quicker than
using an FFT to capture data at the same resolution (Wiedenbrug, 1998).
Conversely, the FFT function is much slower at acquiring a high-resolution
frequency peak. For the same frequency resolution of 0.001 Hz in a 1000 Hz band, the
time to acquire the data is calculated by:
f T time FFT
∆=
1(11)
Tà time
f à frequency
maxmax
#
56.2
2
F
linesor
F T time FFT
n
= (12a)
Page 36
7/27/2019 Electric Motor Signature Analysis
http://slidepdf.com/reader/full/electric-motor-signature-analysis 36/119
29
For a resolution of 0.001 Hz at 10 Hz:
max10@sec100010
10000 Hz T time FFT b == (12b)
As can be seen in equation (12b), it takes 16.67 minutes to discern a frequency
peak with 0.001 Hz resolution. This is two magnitudes longer that the DFLL. Even
with the FFT being inherently slower in data acquisition, most of the signal processing
problems have been identified with it. The DFLL is still a new algorithm and the signal
processing problems are yet to be completely bounded (Wiedenbrug, 1998).
Technology Review
The two companies that assisted in this project each used different approaches in
the analysis of the data collected using motor current analysis. PdMA used motor current
demodulation and performed a high resolution FFT on the data collected. A high-
resolution FFT of a demodulated current signal for high-resolution differential frequency
has good noise-to-signal ratio. The higher the resolution, the less error or noise
introduced due to leakage between ensembles of data. To improve the signal-to-noise
ratio, the signal was sampled and averaged many times. This is one drawback of FFT
analysis: the higher the quality of the FFT, the longer the data acquisition takes.
PdMA
PdMA developed a tester that uses amplitude demodulation of the motor current
to describe a time waveform that is post processed as an FFT. Their process is based on
Page 37
7/27/2019 Electric Motor Signature Analysis
http://slidepdf.com/reader/full/electric-motor-signature-analysis 37/119
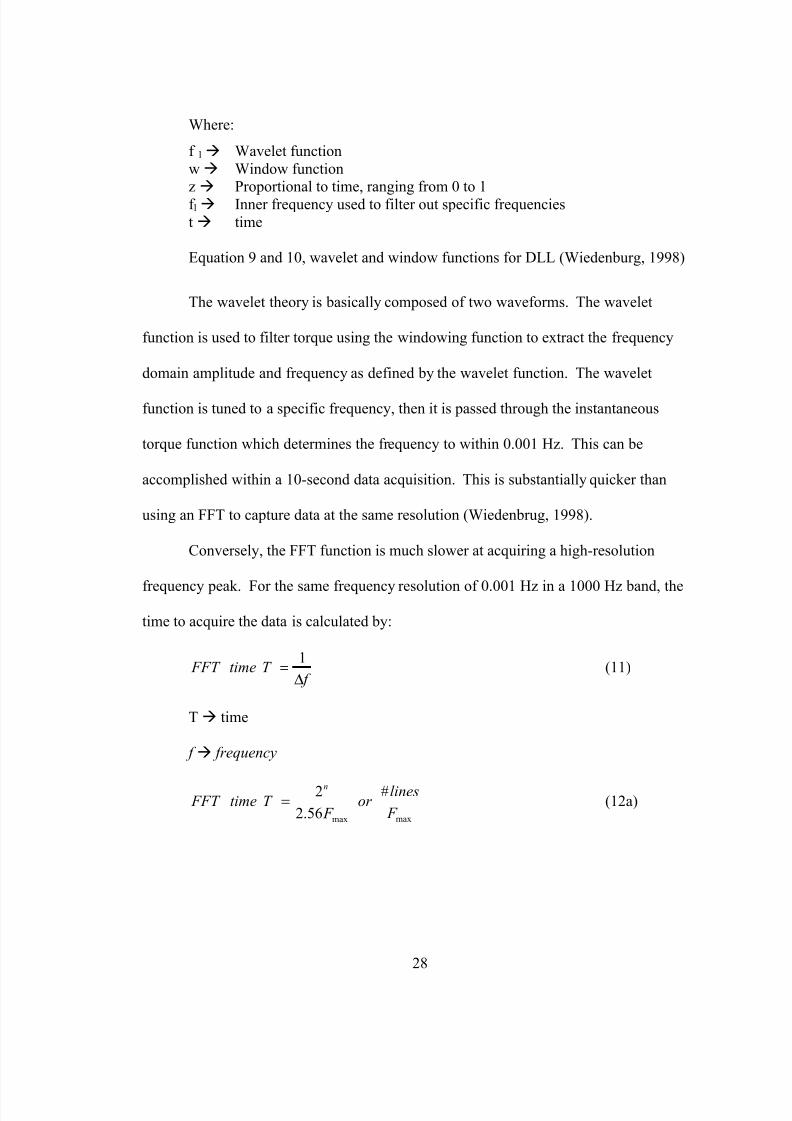
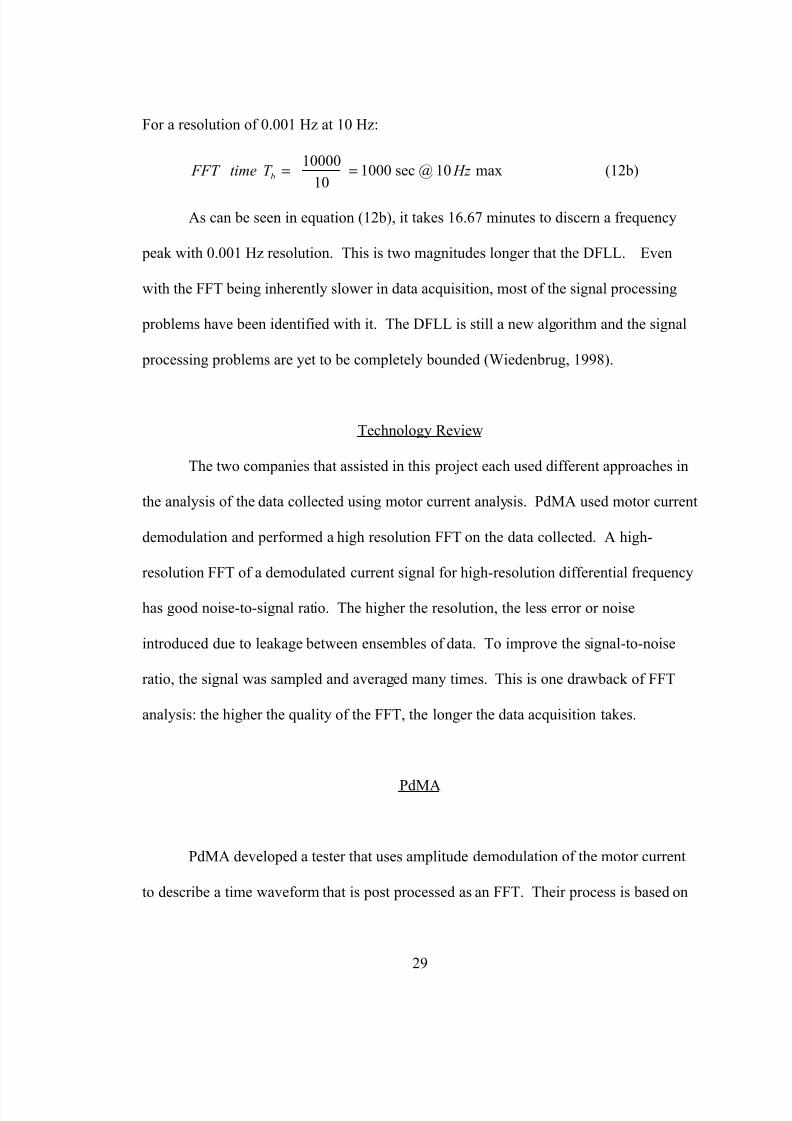
30
the modulation of the motor current varied (the rotor flux creating counter electromotive
force, CEMF) in accordance with a modulating wave. The load variations that repeat are
reflected into the stator currents through the motor’s CEMF. Demodulate the 60 Hz
signal, and what is left is a signature with the load varying frequencies (Bechard, 2001).
Figure 11. PdMA analyzer used in this research (Bethel, 2001).
In a motor operating at 60 Hz, consistently repeating variations in load are
reflected back into the stator windings, which causes amplitude changes in current flow
with the varying circuit impedance for the changing CEMF. This change is carried
through the branch circuit of the motor on the 60 Hz current signal. PdMA is using
software-driven amplitude demodulation to remove the 60 Hz signal which is able to
Page 38
7/27/2019 Electric Motor Signature Analysis
http://slidepdf.com/reader/full/electric-motor-signature-analysis 38/119
31
detect motor rotor speed, pole pass, mechanical pass-through and reflected frequencies. A
FFT is performed on the demodulated signal resulting in a spectrum that is used in
analysis. Without demodulation, the load related frequencies are buried in the noise-to-
signal ratio (Bechard, 2001).
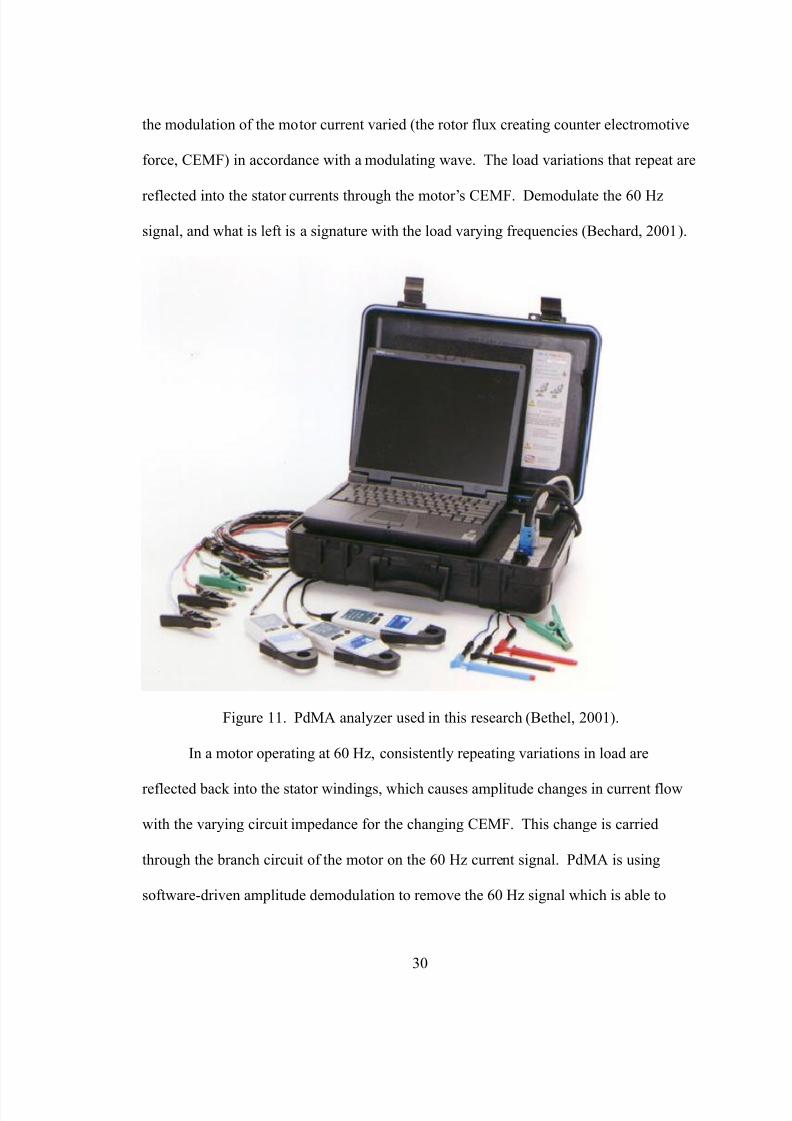
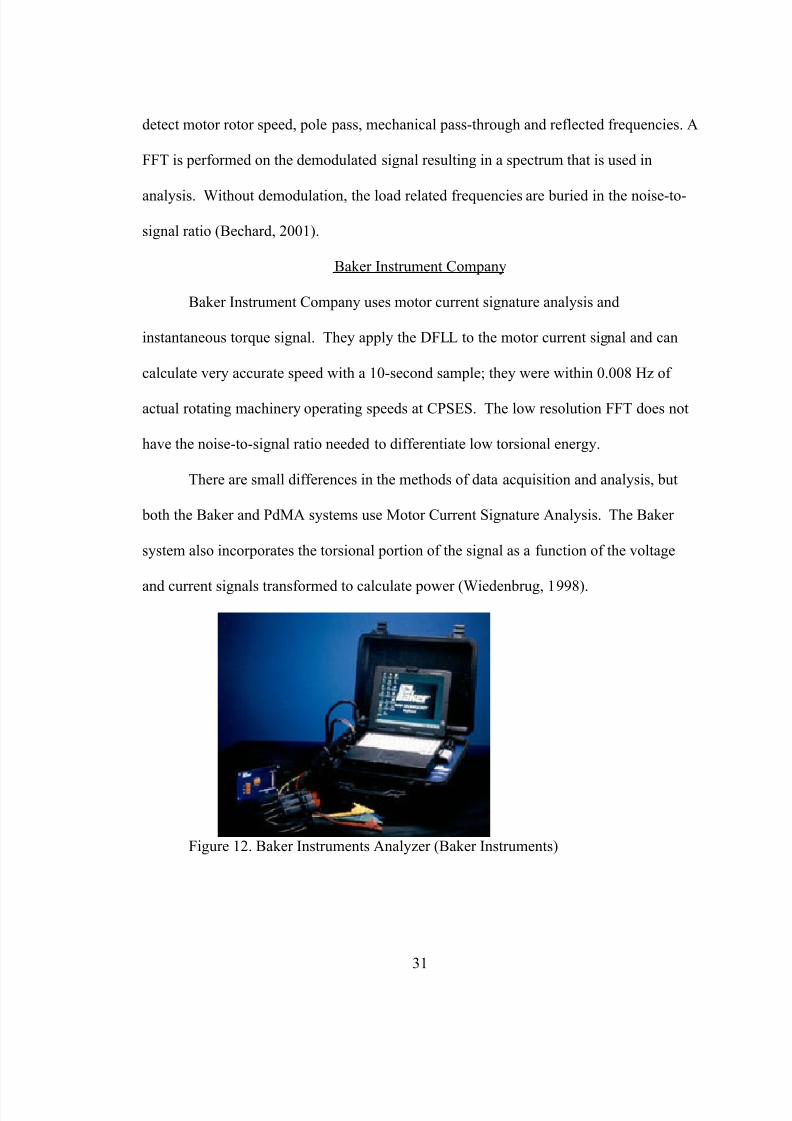
Baker Instrument Company
Baker Instrument Company uses motor current signature analysis and
instantaneous torque signal. They apply the DFLL to the motor current signal and can
calculate very accurate speed with a 10-second sample; they were within 0.008 Hz of
actual rotating machinery operating speeds at CPSES. The low resolution FFT does not
have the noise-to-signal ratio needed to differentiate low torsional energy.
There are small differences in the methods of data acquisition and analysis, but
both the Baker and PdMA systems use Motor Current Signature Analysis. The Baker
system also incorporates the torsional portion of the signal as a function of the voltage
and current signals transformed to calculate power (Wiedenbrug, 1998).
Figure 12. Baker Instruments Analyzer (Baker Instruments)
Page 39
7/27/2019 Electric Motor Signature Analysis
http://slidepdf.com/reader/full/electric-motor-signature-analysis 39/119
32
Other Projects in Motor Signature Analysis
Georgia Institute of Technology recently published a paper on Motor Current
Signature Analysis entitled “ A Method for Sensorless On-Line Vibration Monitoring of
Induction Motors”. This research was a laboratory project based on theoretical analysis,
simulated faults, and a linear relationship between the current harmonics and vibration
levels. The focus of this research was to evaluate the motor rotor-to-stator displacement
against the mechanical vibration signature. After making the correlation, the research
was further expanded to determine if sensorless vibration alert levels were possible
(Riley, Lin, Haberler, and Schoen, 1997).
Georgia Institute of Technology used current based Motor Electric Signature
Analysis that is based on the vibration displacement as a function of the motor current
harmonics in the permeance of the rotor to stator system.
A motor that vibrates from an external source at frequency f v, will result in an air
gap eccentricity that is primarily changing in a fixed axis. This can be modeled as
the sum of a forward and backward rotating eccentricity (off center rotation). In
many practical applications, the vibration is primarily in the vertical axis, and the
winding is at an unknown position. Additional vibration occurs due to rotating
asymmetries, such as load unbalance or misalignment. This is modeled as a
rotating permeance eccentricity at the rotating frequency.
Page 40
7/27/2019 Electric Motor Signature Analysis
http://slidepdf.com/reader/full/electric-motor-signature-analysis 40/119
33
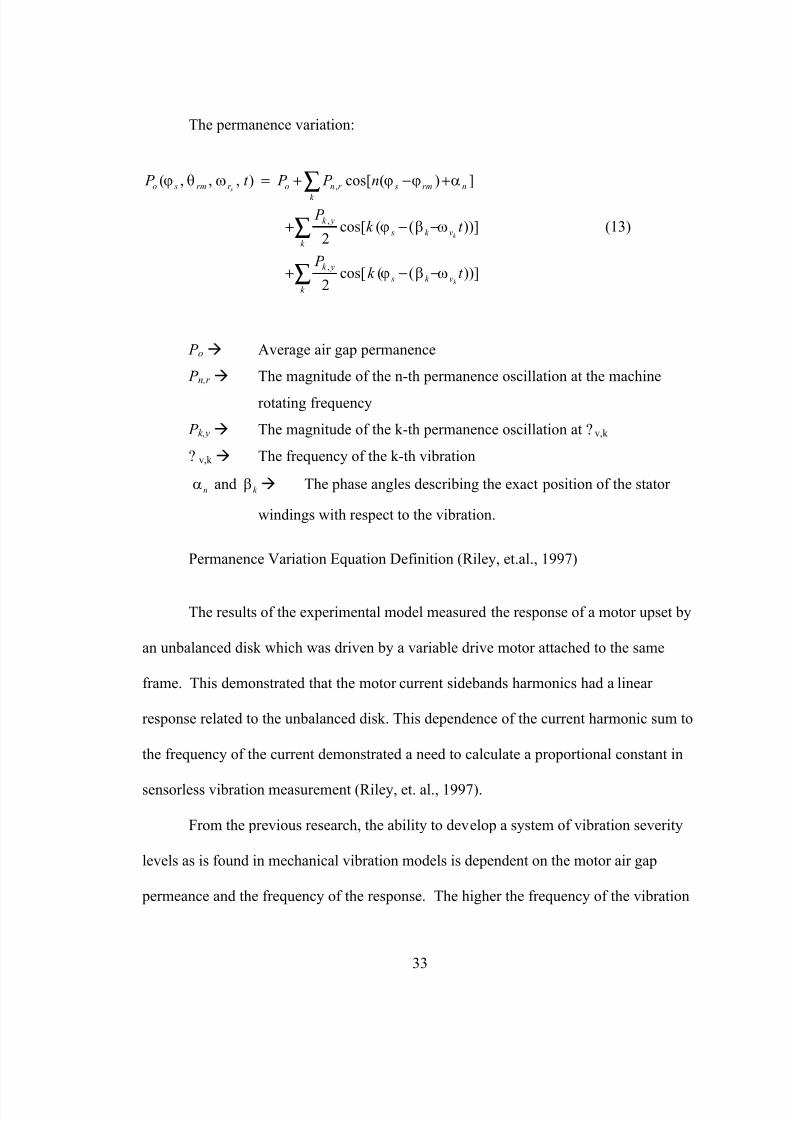
The permanence variation:
))]((cos[2
))]((cos[2
])(cos[),,,(
,
,
,
t k P
t k P
n P P t P
k
k
s
vk s
k
yk
k
vk s
yk
k
nrm sr nor rm so
ωβϕ
ωβϕ
αϕϕωθϕ
−−+
−−+
+−+=
∑
∑
∑
(13)
P o à Average air gap permanence
P n,r à The magnitude of the n-th permanence oscillation at the machine
rotating frequency
P k,y à The magnitude of the k-th permanence oscillation at ? v,k
? v,k à The frequency of the k-th vibration
nα and k β à The phase angles describing the exact position of the stator
windings with respect to the vibration.
Permanence Variation Equation Definition (Riley, et.al., 1997)
The results of the experimental model measured the response of a motor upset by
an unbalanced disk which was driven by a variable drive motor attached to the same
frame. This demonstrated that the motor current sidebands harmonics had a linear
response related to the unbalanced disk. This dependence of the current harmonic sum to
the frequency of the current demonstrated a need to calculate a proportional constant in
sensorless vibration measurement (Riley, et. al., 1997).
From the previous research, the ability to develop a system of vibration severity
levels as is found in mechanical vibration models is dependent on the motor air gap
permeance and the frequency of the response. The higher the frequency of the vibration
Page 41
7/27/2019 Electric Motor Signature Analysis
http://slidepdf.com/reader/full/electric-motor-signature-analysis 41/119
34
input, the lower the displacement of the rotor, therefore the smaller the resultant current
modulation. The smaller the vibration displacement, the smaller the rotor-to-stator flux
gap changes due to the reduced displacement the rotor has at higher frequencies. This
increases the difficulty in prescribing a precise limit to vibration severity limit due to
motor electrical signatures (Riley, et. al., 1997).
A standard relating Motor Electrical Signature Analysis (MESA) for vibration to
an absolute value of vibration has not been developed(Riley, Lin, Haberler, and Schoen,
1997). Therefore, the ability to apply know vibration severity limits was not possible in
this research. The method of trending the vibration changes and equating them to known
physical changes was decided the best method for a proof of concept research. Individual
frequencies that are known and used in vibration analysis to determine vibration faults in
a motor were chosen as the trending frequencies (Wowk, 1991). Changes in these
frequency trends were used to determine if a technology was able to detect the controlled
fault mechanism.
Page 42
7/27/2019 Electric Motor Signature Analysis
http://slidepdf.com/reader/full/electric-motor-signature-analysis 42/119
35
CHAPTER 3
METHODS AND MATERIALS
The review of literature in Chapter 2 demonstrates the need to predict the
condition of the rotating system in order to avoid incipient failures that could cause
excessive equipment downtime and ancillary failures. The review further indicated that,
in some fans, the motor electrical signature analysis may not capture all the failure
modes. In those cases, other technology could be used to fill the gaps in degradation
analysis. This research focused on determining if the use of motor electrical signature
analysis and stress wave analysis could detect three types of rotating equipment
degradation.
The test subject of this research was a vane-axial fan that was selected as
representative of fans in service at Comanche Peak Steam Electric Station (CPSES). The
fan was obtained from the CPSES warehouse – a stored spare for a building exhaust fan.
The fan was precision balanced prior to staring the test run. One set of bearings was
scored on the outer race and the other set of bearings was scored on the inner race. Then
the fan was unbalanced with 7.6 grams that resulted in an unbalance of 0.54 ounce
inches. All three different conditions were measured using simultaneous data collection
of the motor electrical signature, cowling vibration, bearing housing vibration, and stress
wave data (the stress wave measurement was part of a parallel project with EPRI).
Page 43
7/27/2019 Electric Motor Signature Analysis
http://slidepdf.com/reader/full/electric-motor-signature-analysis 43/119
36
Research Design
This research used baseline data to compare with the rest of the research data. By
designing this research such that all tests were performed in parallel, a comparison in the
ability of each technology to successfully detect each artificially induced failure mode
was possible. The use of a comparative sampling technique led the results to be reduced
using a Paired Comparison Test analysis (Diamond, 1996). This research was designed
to control those variables that could be controlled and could affect the motor and fan
vibration. Variables that were not expected to affect the results or were uncontrollable
(intervening variable) were not controlled.
Controlled Variables
The independent variable or factor which was the focus of this research was the
motor rotor response to various deviations from a known optimal operating system. The
known optimal system included new bearings, precision balance at each bearing, and a
controllable power supply system. A known imbalance of 7.6 grams was attached to
jacking bolt at 2 inches from the center of the fan. The imbalance test with good bearings
was performed to make a comparison between the controlled sample and the imbalance.
After an imbalance comparison run was made, the imbalance was removed and another
data set was taken to verify the system was in optimal condition. This test was repeated
twice, once with PdMA and again with the Baker Instrument’s Motor Electrical Signal
Analysis system and SWANTECH’s Stress Wave Analysis system (see appendix D).
Page 44
7/27/2019 Electric Motor Signature Analysis
http://slidepdf.com/reader/full/electric-motor-signature-analysis 44/119
37
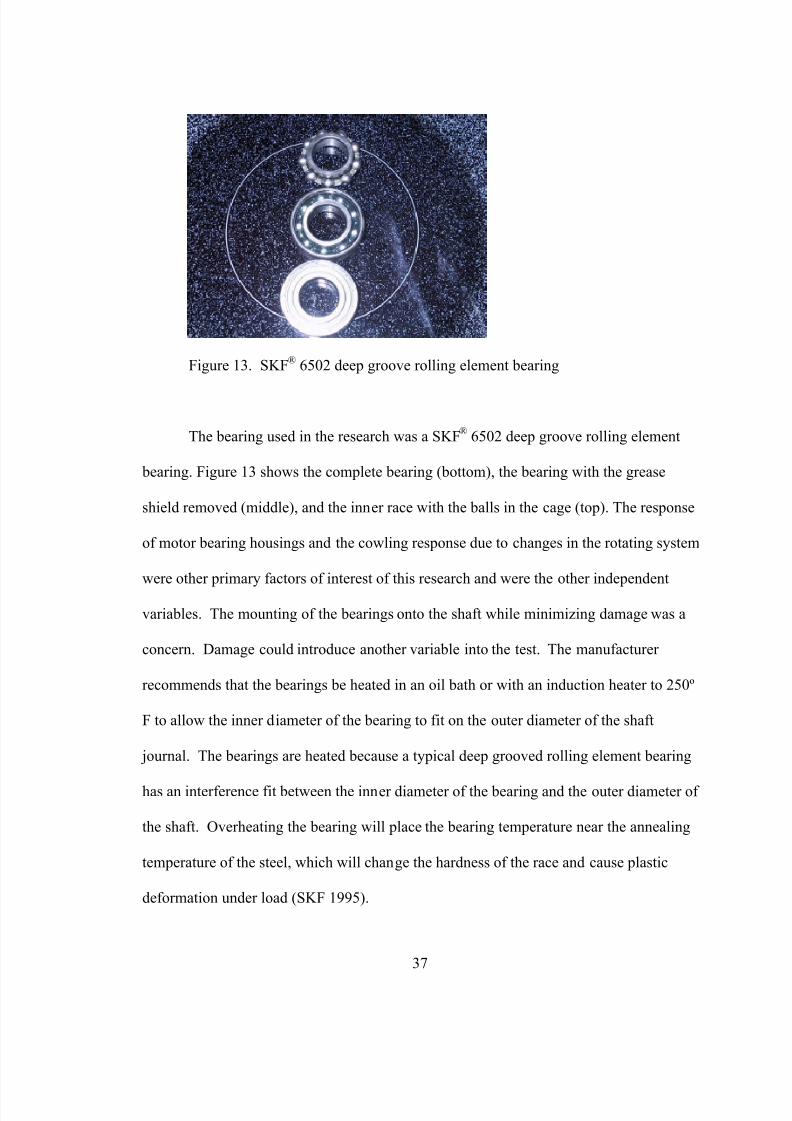
Figure 13. SKF® 6502 deep groove rolling element bearing
The bearing used in the research was a SKF® 6502 deep groove rolling element
bearing. Figure 13 shows the complete bearing (bottom), the bearing with the grease
shield removed (middle), and the inner race with the balls in the cage (top). The response
of motor bearing housings and the cowling response due to changes in the rotating system
were other primary factors of interest of this research and were the other independent
variables. The mounting of the bearings onto the shaft while minimizing damage was a
concern. Damage could introduce another variable into the test. The manufacturer
recommends that the bearings be heated in an oil bath or with an induction heater to 250º
F to allow the inner diameter of the bearing to fit on the outer diameter of the shaft
journal. The bearings are heated because a typical deep grooved rolling element bearing
has an interference fit between the inner diameter of the bearing and the outer diameter of
the shaft. Overheating the bearing will place the bearing temperature near the annealing
temperature of the steel, which will change the hardness of the race and cause plastic
deformation under load (SKF 1995).
Page 45
7/27/2019 Electric Motor Signature Analysis
http://slidepdf.com/reader/full/electric-motor-signature-analysis 45/119
38
The installation of the bearings and alignment of the bearings were the
moderating variable associated with the dynamic response of the system (Harris, 1988).
To control these variables, the same technician using the same equipment installed all the
bearings.
Temperature, barometric pressure, and humidity were the moderating variables
associated with the test that could affect the fluidic resistance of the air flowing through
the fan. This would in turn increase or decrease the load on the motor, affecting the
current signature for the motor electrical signal analysis. The test was conducted in an
air-conditioned space where the temperature was regulated and verified that barometric
pressure and humidity were within 10% of each other for each test (Gastonal, 2001).
We verified the power quality supplied to the motor for each test, the current,
voltage, and resistance of the connections could affect the motor current and voltage
readings that were used in the analysis. To be valid, the power quality should not differ
by more that 1% for the duration of any test (EPRI, 1991).
Uncontrolled Variables
The extraneous variables that were not expected to confuse the results and the
intervening variables were not controlled in the research. The controlled variables were
measured and if they drifted outside an acceptable level during the data collection, the
test was declared invalid.
Page 46
7/27/2019 Electric Motor Signature Analysis
http://slidepdf.com/reader/full/electric-motor-signature-analysis 46/119
Page 47
7/27/2019 Electric Motor Signature Analysis
http://slidepdf.com/reader/full/electric-motor-signature-analysis 47/119
40
Risk and Improvement
In this research, the consequence of committing an Alpha error (a), the alternative
hypothesis (Ha) as being true when the null hypothesis (Ho) is actually true, was that it
would have claimed: (1) that the cowling vibration was better than the bearing cap data in
fault detection. (2) that the motor electrical current signature analysis was able to detect
rotor system faults when data did not support fault detection; and (3) the motor electrical
torque signature analysis was able detect rotor system faults when data did not support
fault detection.
On the other hand, the consequence of committing a Beta error (ß) accepts that
the null hypothesis as being true when the alternative hypothesis is actually true, was that
it would have claimed: (1) the cowling vibration data was not a better method of fault
detection than the bearing cap vibration when it actually was better than bearing cap data.
(2) the motor electrical current signature analysis could not detect the difference between
baseline data and a faulted rotor system; and (3) the motor electrical torque signature
analysis could not detect the difference between baseline data and a faulted rotor system.
The probability of committing an a error is generally chosen to be in the range of
0.01 to .1. In my research, the authors typically used 0.05 when there was no significant
difference between a and ß errors (Diamond, 1989; Hinton, 1999; and Sternstein, 1996).
For this research, a was chosen to be 0.05. The probability for ß was chosen to be 0.10
due to the variance in vibration data from sample to sample.
Page 48
7/27/2019 Electric Motor Signature Analysis
http://slidepdf.com/reader/full/electric-motor-signature-analysis 48/119
41
In order to determine if the measurement has detected the desired trait, a
difference in the population’s mean between the baseline and the fault for each condition
needed to be tested. The greater the difference between the fault and the baseline data,
the smaller the sample size for the same risk. Smaller sample size would reduce the time
and cost of the analysis. In addition, there should be a distinct difference between the
baseline and faulted rotor system to justify the acceptance of the new technology for use.
I could find no comparative data for vane-axial fans for these technologies in my
research. Therefore, Paired Comparison was chosen as the approach used to determine if
a change was detected for determining the sample size and objective criteria (Diamond
1989).
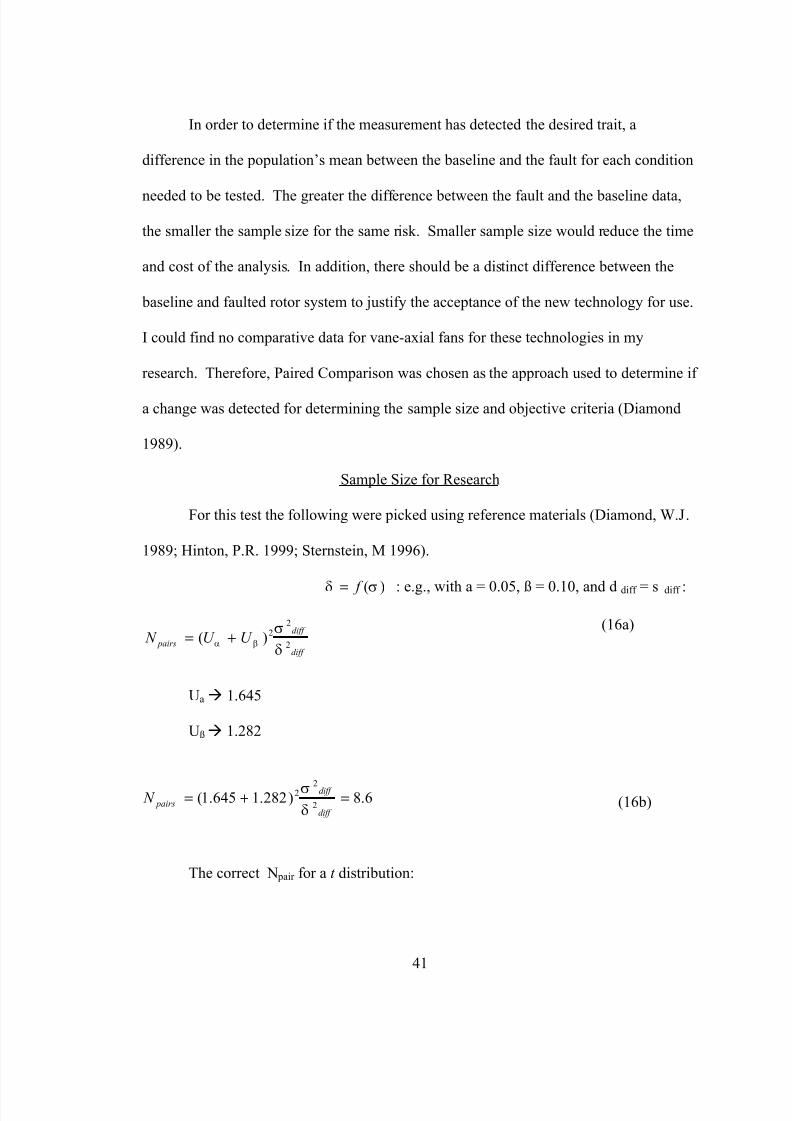
Sample Size for Research
For this test the following were picked using reference materials (Diamond, W.J.
1989; Hinton, P.R. 1999; Sternstein, M 1996).
)(σδ f = : e.g., with a = 0.05, ß = 0.10, and d diff = s diff :
(16a)
Uaà 1.645
Ußà 1.282
(16b)
The correct N pair for a t distribution:
diff
diff
pairs U U N 2
22)(δ
σβα +=
6.8)282.1645.1(2
22 =+=diff
diff
pairs N δ
σ
Page 49
7/27/2019 Electric Motor Signature Analysis
http://slidepdf.com/reader/full/electric-motor-signature-analysis 49/119
42
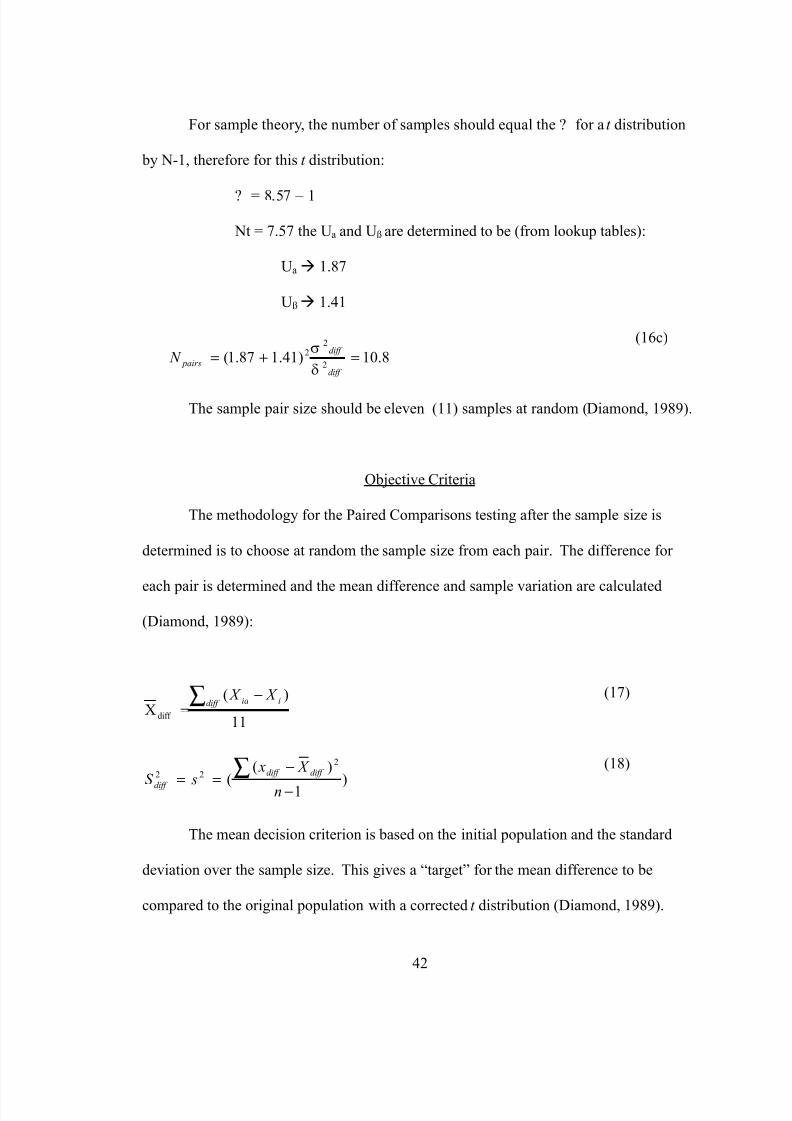
For sample theory, the number of samples should equal the ? for a t distribution
by N-1, therefore for this t distribution:
? = 8.57 – 1
Nt = 7.57 the Ua and Uß are determined to be (from lookup tables):
Uaà 1.87
Ußà 1.41
(16c)
The sample pair size should be eleven (11) samples at random (Diamond, 1989).
Objective Criteria
The methodology for the Paired Comparisons testing after the sample size is
determined is to choose at random the sample size from each pair. The difference for
each pair is determined and the mean difference and sample variation are calculated
(Diamond, 1989):
(17)
(18)
The mean decision criterion is based on the initial population and the standard
deviation over the sample size. This gives a “target” for the mean difference to be
compared to the original population with a corrected t distribution (Diamond, 1989).
8.10)41.187.1(2
22 =+=
diff
diff
pairs N δ
σ
)1
)(
(
11
)(X
2
22
diff
−
−
==
−=
∑
∑
n
X x
sS
X X
diff diff
diff
diff iia
Page 50
7/27/2019 Electric Motor Signature Analysis
http://slidepdf.com/reader/full/electric-motor-signature-analysis 50/119
43
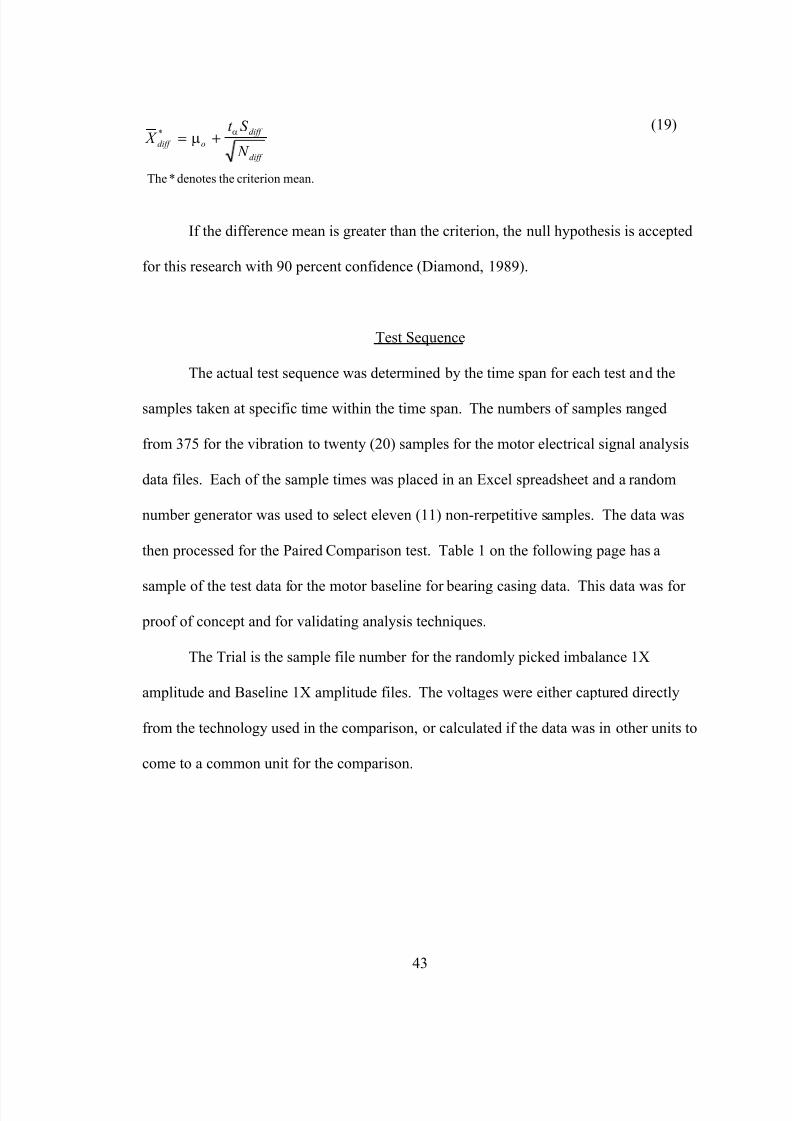
(19)
If the difference mean is greater than the criterion, the null hypothesis is accepted
for this research with 90 percent confidence (Diamond, 1989).
Test Sequence
The actual test sequence was determined by the time span for each test and the
samples taken at specific time within the time span. The numbers of samples ranged
from 375 for the vibration to twenty (20) samples for the motor electrical signal analysis
data files. Each of the sample times was placed in an Excel spreadsheet and a random
number generator was used to select eleven (11) non-rerpetitive samples. The data was
then processed for the Paired Comparison test. Table 1 on the following page has a
sample of the test data for the motor baseline for bearing casing data. This data was for
proof of concept and for validating analysis techniques.
The Trial is the sample file number for the randomly picked imbalance 1X
amplitude and Baseline 1X amplitude files. The voltages were either captured directly
from the technology used in the comparison, or calculated if the data was in other units to
come to a common unit for the comparison.
mean.criterionthedenotes*The
*
diff
diff
odiff N
S t X
αµ +=
Page 51
7/27/2019 Electric Motor Signature Analysis
http://slidepdf.com/reader/full/electric-motor-signature-analysis 51/119
44
TrialImbalance 1X
amplitude (volts)Baseline 1X
amplitude (volts)Difference in
amplitude (volts)
1 0.001401683 0.000835219 0.000566
2 0.001448703 0.000901405 0.000547
3 0.001451159 0.000902928 0.000548
4 0.001451159 0.000923814 0.000527
5 0.001495948 0.000973325 0.000523
6 0.00145034 0.0009259 0.000524
7 0.001402474 0.000925378 0.000477
8 0.001451159 0.000924857 0.000526
9 0.001404057 0.000948282 0.000456
10 0.001451977 0.000947747 0.000504
11 0.001403266 0.000924857 0.000478
)(∑ −diff iia X X 0.005678213
diff X 0.000525292*
diff X 2.83246E-20
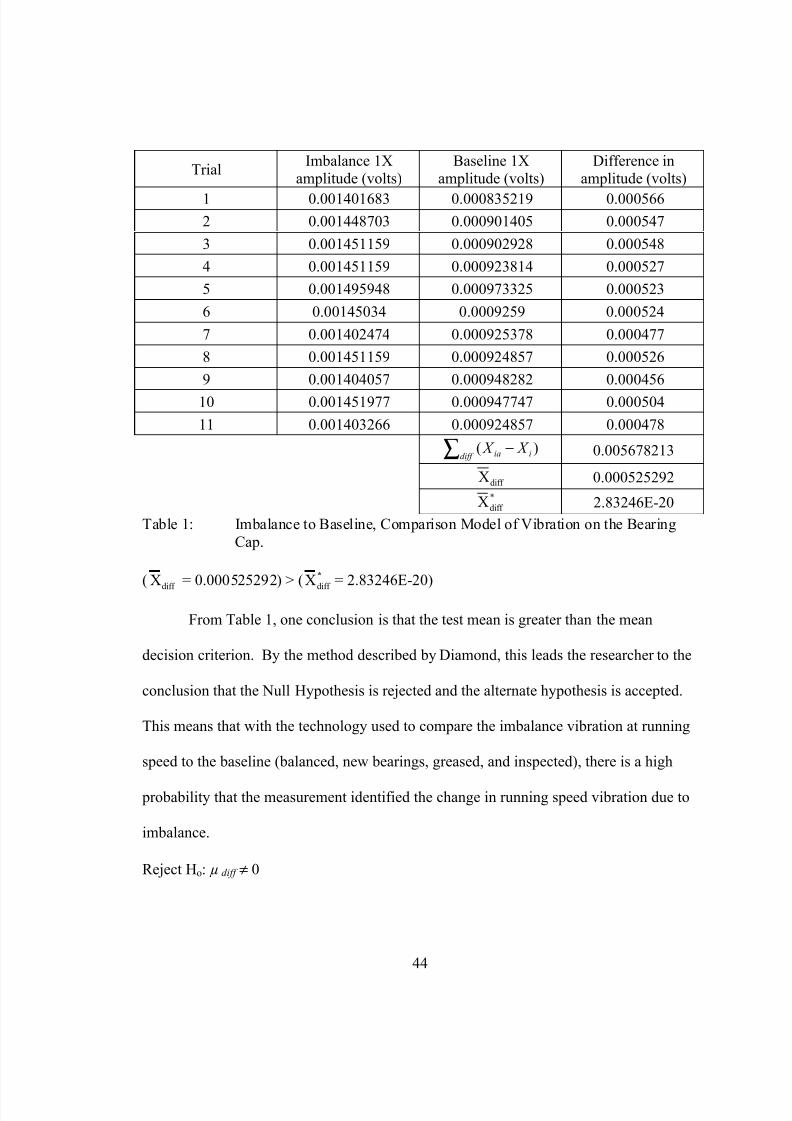
Table 1: Imbalance to Baseline, Comparison Model of Vibration on the BearingCap.
(diff
X = 0.000525292) > ( *
diff
X = 2.83246E-20)
From Table 1, one conclusion is that the test mean is greater than the mean
decision criterion. By the method described by Diamond, this leads the researcher to the
conclusion that the Null Hypothesis is rejected and the alternate hypothesis is accepted.
This means that with the technology used to compare the imbalance vibration at running
speed to the baseline (balanced, new bearings, greased, and inspected), there is a high
probability that the measurement identified the change in running speed vibration due to
imbalance.
Reject Ho: µ diff ≠ 0
Page 52
7/27/2019 Electric Motor Signature Analysis
http://slidepdf.com/reader/full/electric-motor-signature-analysis 52/119
45
Accept Ha: µ diff > 0 with at least 90% confidence. Conclusion: the imbalance amplitude
at once per revolution is greater than the baseline 1X amplitude for bearing cap data.
This is shown by the comparison of the mean difference being greater than the mean
decision criterion.
Test Fan
TXU Comanche Peak Steam Electric Station provided a fan representative of
those used in the plant to exhaust air from the Electric Control Buildings. This fan was
chosen because the internal support system has a long transmission path between the
motor bearings and the external fan cowling (can), and the limited power available to run
the fan in the test area. In addition, this type of fan is used to supply and exhaust air in
many applications within the Electrical Utilities (EPRI, 1991). The fan provided was a
24 inch vane axial fan manufactured by Aerovent using a direct drive from a Baldor
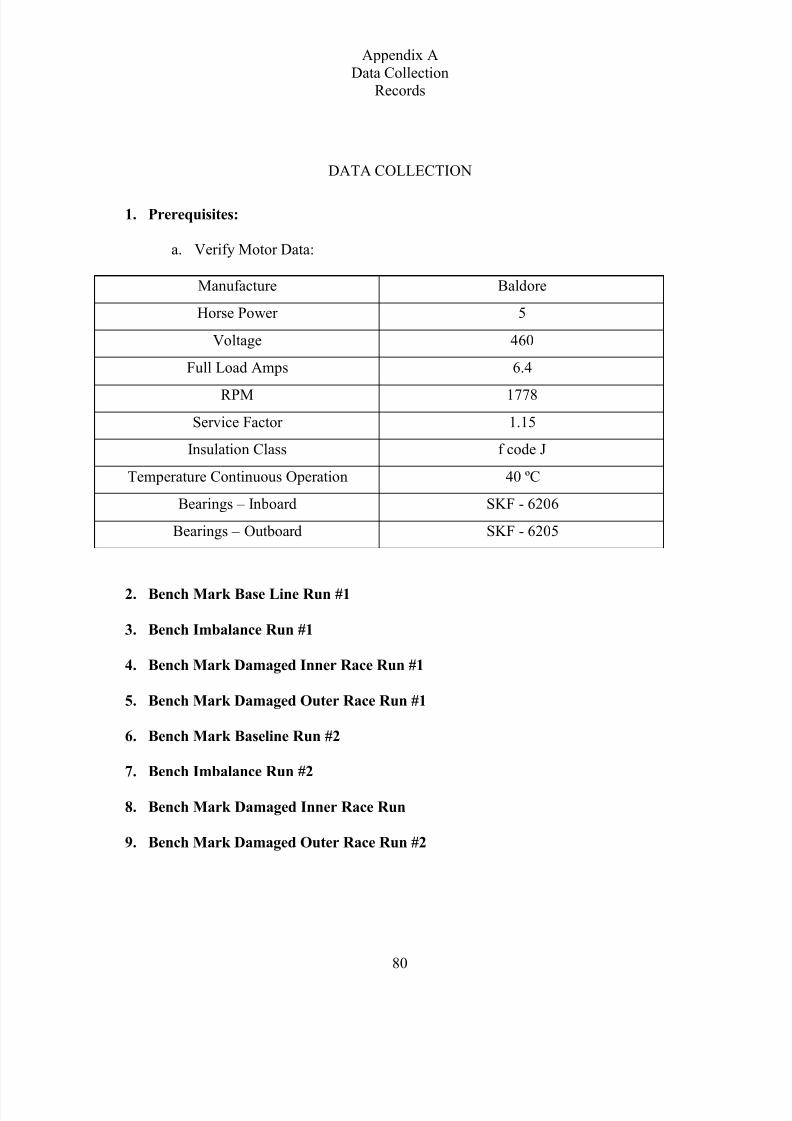
motor: 5 Hp motor, 3 phase, 460 VAC, 6.4 Amps (full load), 1778 RPM motor. Figure
14 depicts the fan utilized in this research.
Page 53
7/27/2019 Electric Motor Signature Analysis
http://slidepdf.com/reader/full/electric-motor-signature-analysis 53/119
46
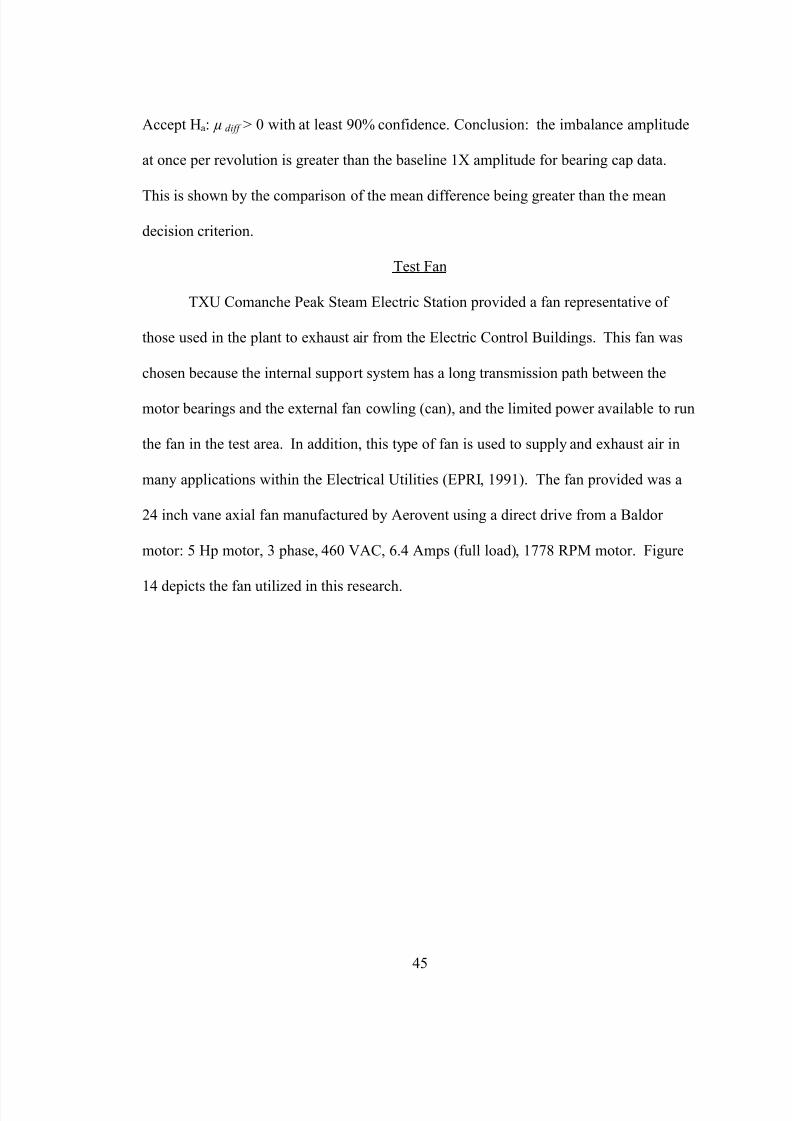
Figure 14. Aerovent 24-inch vane-axial fan.
As can be seen in Figure 14, the fan has seven (7) blades. The air is drawn over
the fan blades, down around the motor, and out into the ventilation ductwork. For this
test the fan was mounted on a frame with a very low natural frequency (shown in figure
15), less than 1/10 of the running speed of the motor. The low natural frequency was
chosen to ensure that the test frame would not interfere with the test data (Harris, 1988).
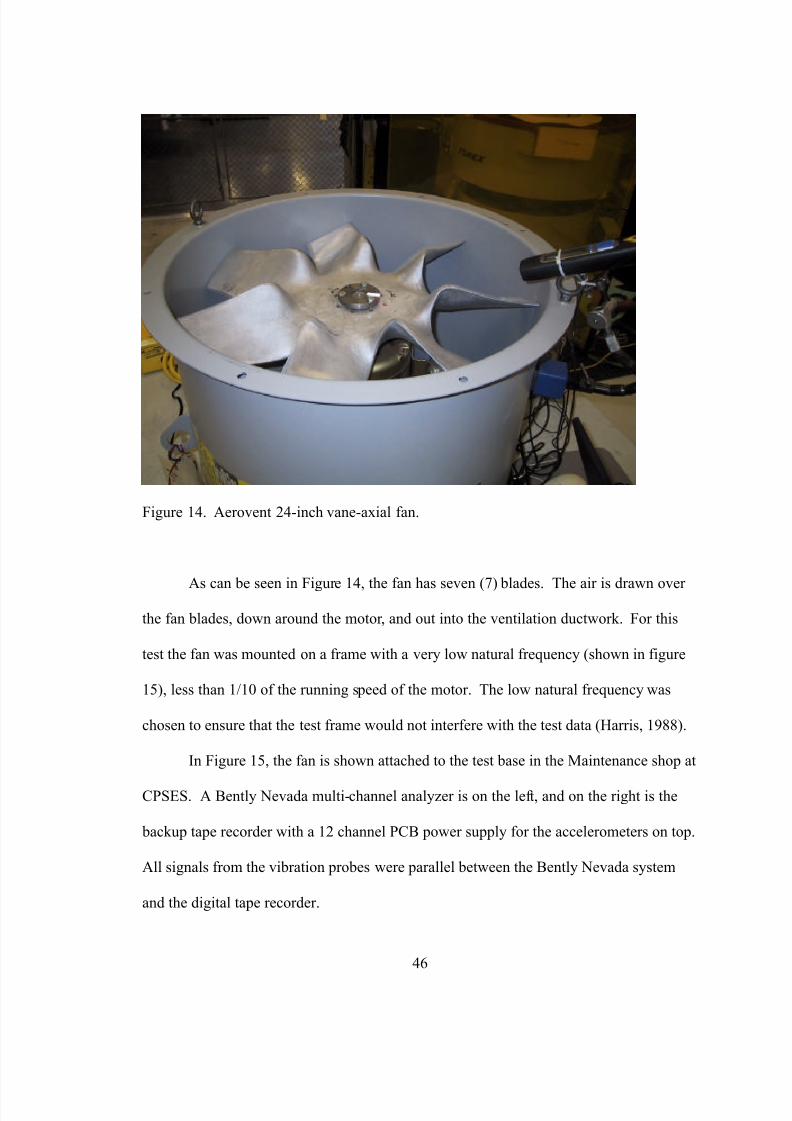
In Figure 15, the fan is shown attached to the test base in the Maintenance shop at
CPSES. A Bently Nevada multi-channel analyzer is on the left, and on the right is the
backup tape recorder with a 12 channel PCB power supply for the accelerometers on top.
All signals from the vibration probes were parallel between the Bently Nevada system
and the digital tape recorder.
Page 54
7/27/2019 Electric Motor Signature Analysis
http://slidepdf.com/reader/full/electric-motor-signature-analysis 54/119
47
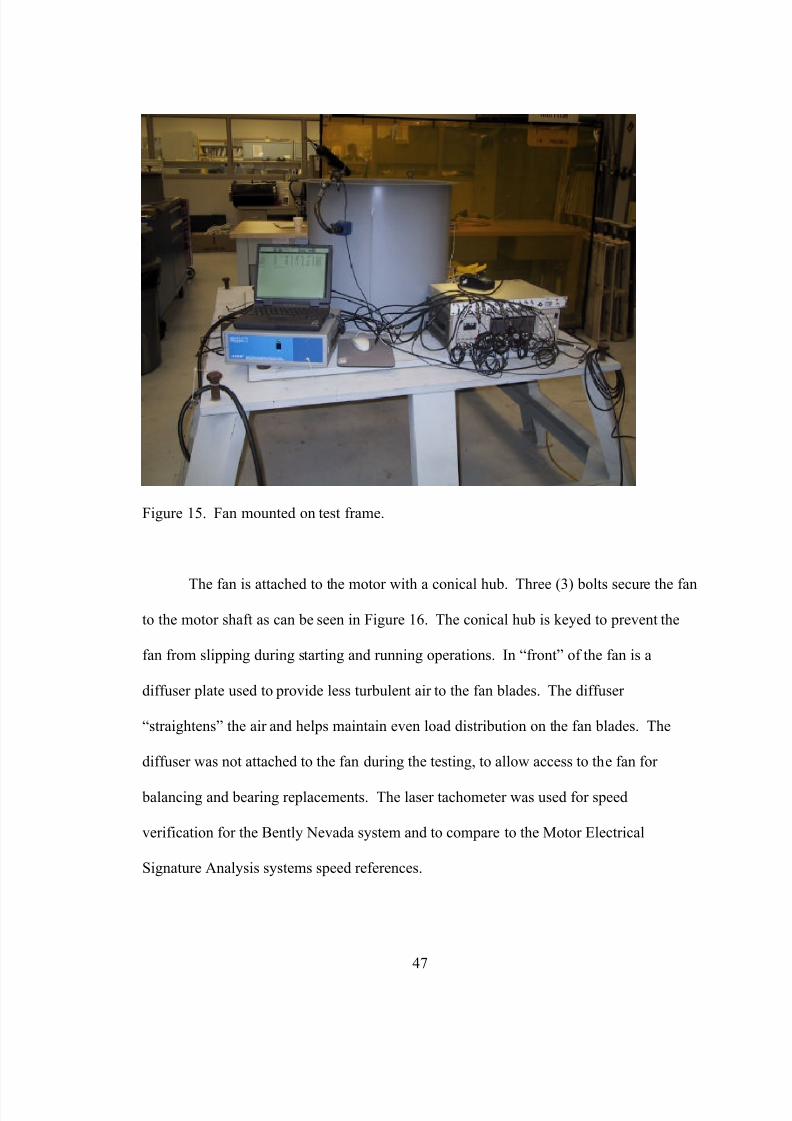
Figure 15. Fan mounted on test frame.
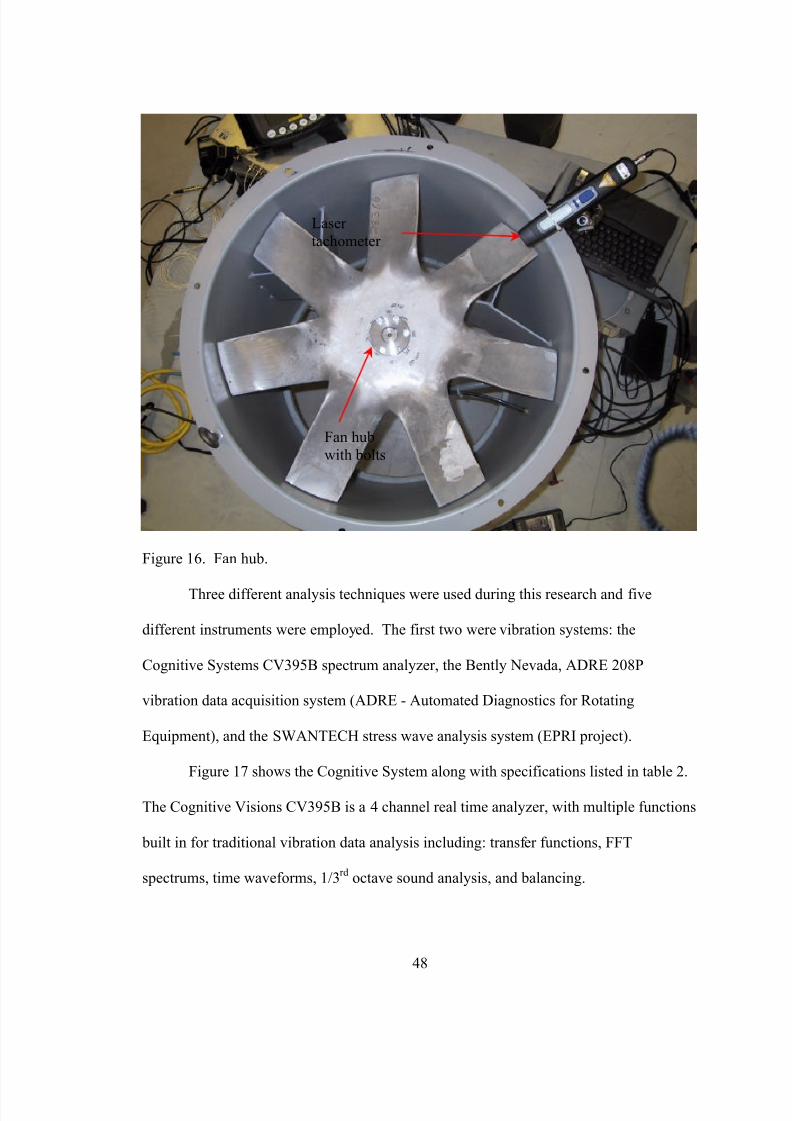
The fan is attached to the motor with a conical hub. Three (3) bolts secure the fan
to the motor shaft as can be seen in Figure 16. The conical hub is keyed to prevent the
fan from slipping during starting and running operations. In “front” of the fan is a
diffuser plate used to provide less turbulent air to the fan blades. The diffuser
“straightens” the air and helps maintain even load distribution on the fan blades. The
diffuser was not attached to the fan during the testing, to allow access to the fan for
balancing and bearing replacements. The laser tachometer was used for speed
verification for the Bently Nevada system and to compare to the Motor Electrical
Signature Analysis systems speed references.
Page 55
7/27/2019 Electric Motor Signature Analysis
http://slidepdf.com/reader/full/electric-motor-signature-analysis 55/119
48
Figure 16. Fan hub.
Three different analysis techniques were used during this research and five
different instruments were employed. The first two were vibration systems: the
Cognitive Systems CV395B spectrum analyzer, the Bently Nevada, ADRE 208P
vibration data acquisition system (ADRE - Automated Diagnostics for Rotating
Equipment), and the SWANTECH stress wave analysis system (EPRI project).
Figure 17 shows the Cognitive System along with specifications listed in table 2.
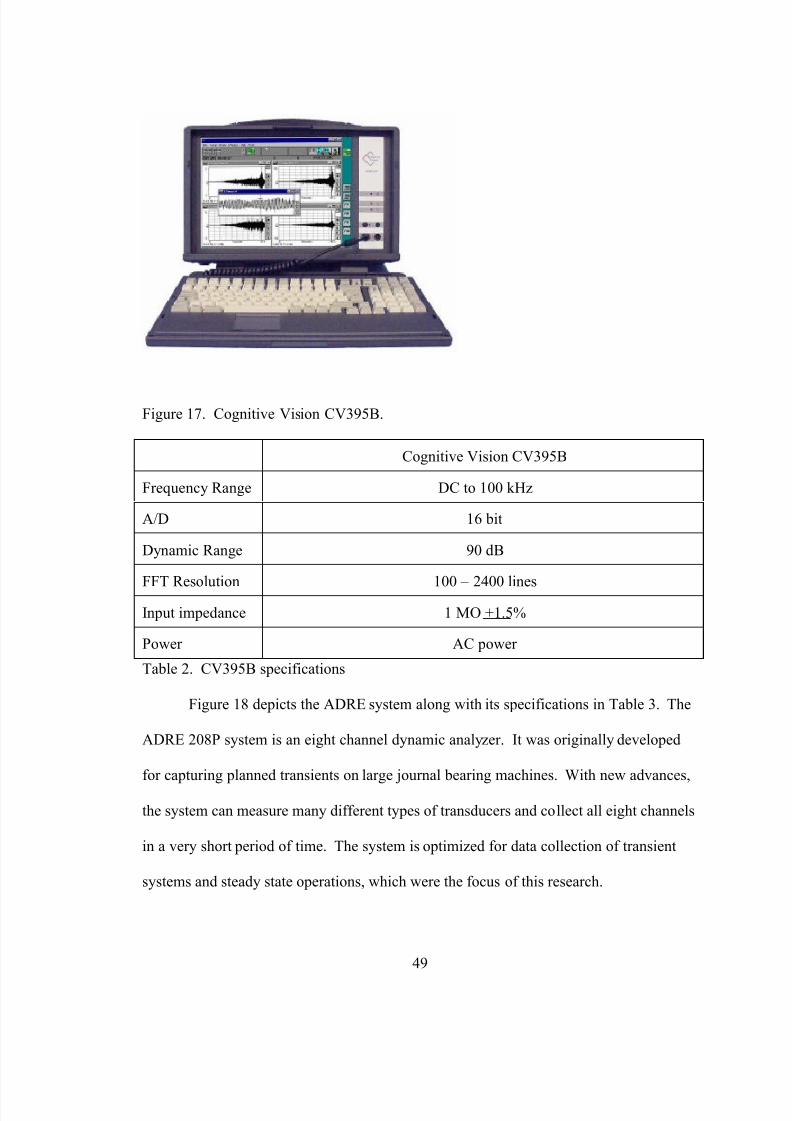
The Cognitive Visions CV395B is a 4 channel real time analyzer, with multiple functions
built in for traditional vibration data analysis including: transfer functions, FFT
spectrums, time waveforms, 1/3rd octave sound analysis, and balancing.
Fan hubwith bolts
Laser tachometer
Page 56
7/27/2019 Electric Motor Signature Analysis
http://slidepdf.com/reader/full/electric-motor-signature-analysis 56/119
49
Figure 17. Cognitive Vision CV395B.
Cognitive Vision CV395B
Frequency Range DC to 100 kHz
A/D 16 bit
Dynamic Range 90 dB
FFT Resolution 100 – 2400 linesInput impedance 1 MO +1.5%
Power AC power
Table 2. CV395B specifications
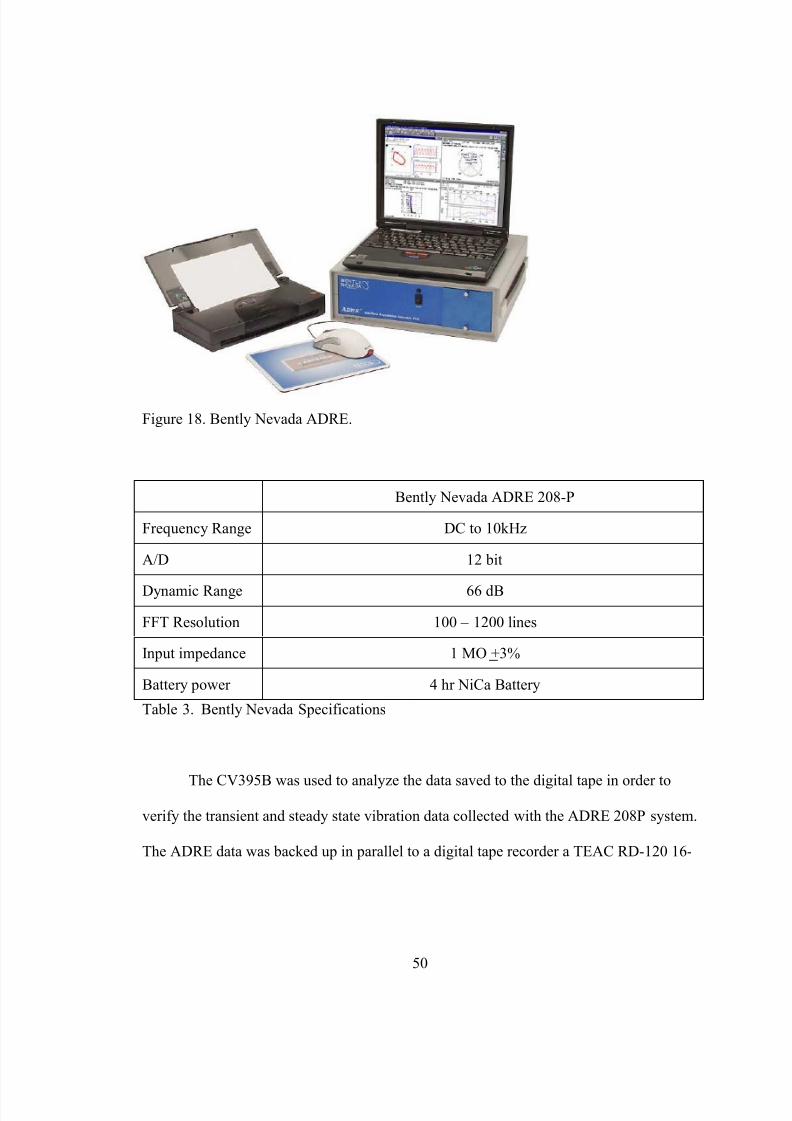
Figure 18 depicts the ADRE system along with its specifications in Table 3. The
ADRE 208P system is an eight channel dynamic analyzer. It was originally developed
for capturing planned transients on large journal bearing machines. With new advances,
the system can measure many different types of transducers and collect all eight channels
in a very short period of time. The system is optimized for data collection of transient
systems and steady state operations, which were the focus of this research.
Page 57
7/27/2019 Electric Motor Signature Analysis
http://slidepdf.com/reader/full/electric-motor-signature-analysis 57/119
50
Figure 18. Bently Nevada ADRE.
Bently Nevada ADRE 208-P
Frequency Range DC to 10kHz
A/D 12 bit
Dynamic Range 66 dB
FFT Resolution 100 – 1200 lines
Input impedance 1 MO +3%
Battery power 4 hr NiCa Battery
Table 3. Bently Nevada Specifications
The CV395B was used to analyze the data saved to the digital tape in order to
verify the transient and steady state vibration data collected with the ADRE 208P system.
The ADRE data was backed up in parallel to a digital tape recorder a TEAC RD-120 16-
Page 58
7/27/2019 Electric Motor Signature Analysis
http://slidepdf.com/reader/full/electric-motor-signature-analysis 58/119
51
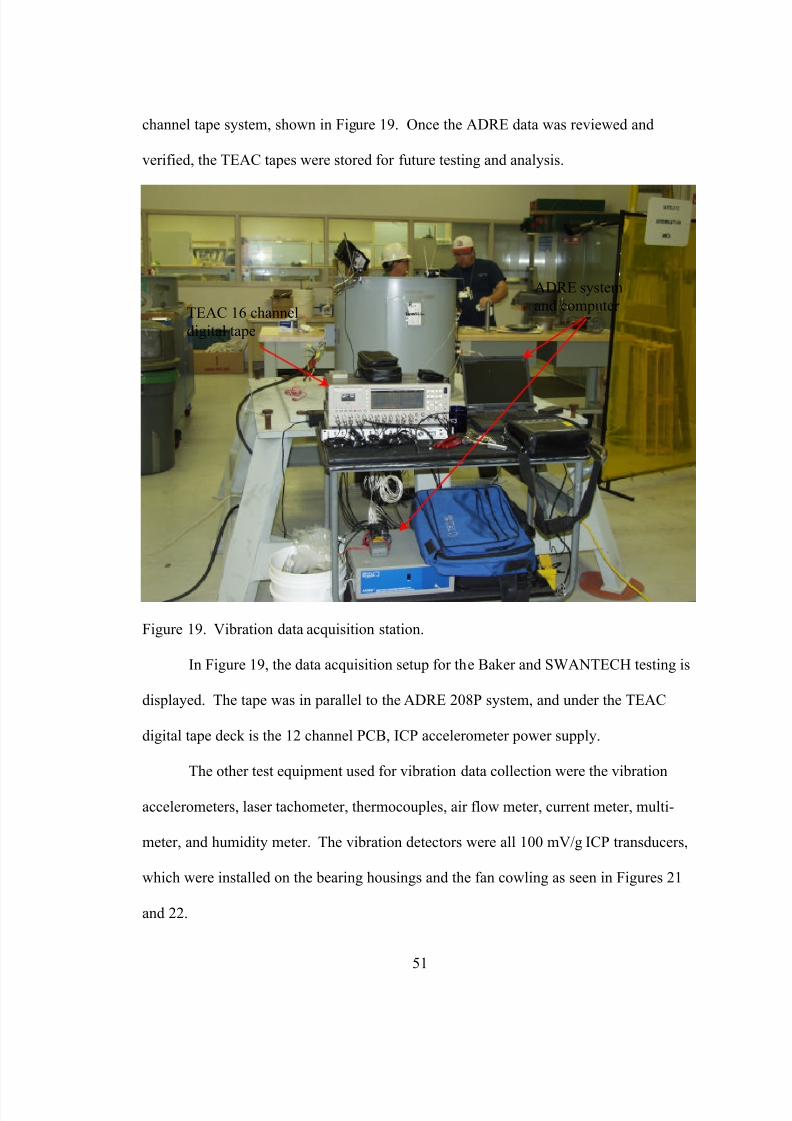
channel tape system, shown in Figure 19. Once the ADRE data was reviewed and
verified, the TEAC tapes were stored for future testing and analysis.
Figure 19. Vibration data acquisition station.
In Figure 19, the data acquisition setup for the Baker and SWANTECH testing is
displayed. The tape was in parallel to the ADRE 208P system, and under the TEAC
digital tape deck is the 12 channel PCB, ICP accelerometer power supply.
The other test equipment used for vibration data collection were the vibration
accelerometers, laser tachometer, thermocouples, air flow meter, current meter, multi-
meter, and humidity meter. The vibration detectors were all 100 mV/g ICP transducers,
which were installed on the bearing housings and the fan cowling as seen in Figures 21
and 22.
TEAC 16 channel
digital tape
ADRE system
and computer
Page 59
7/27/2019 Electric Motor Signature Analysis
http://slidepdf.com/reader/full/electric-motor-signature-analysis 59/119
52
Figure 20. Fan cowling vibration transducers.
Figure 21. Motor bearing housing transducers.
In Figures 20 and 21, the locations of the vibration transducers are circled. The
vibration transducers were attached with studs to washers that were affixed to the fan
and cowling with epoxy. Figure 20 show the two tri-axial vibration transducers attached
to the fan cowling and Figure 21 depicts the location of the four tri-axial vibration
transducers attached to the fan motor bearing housings. The natural frequency of the
washers and transducers was > 5 kHz. The transducers were connected to a 12 channel
Page 60
7/27/2019 Electric Motor Signature Analysis
http://slidepdf.com/reader/full/electric-motor-signature-analysis 60/119
53
power supply that amplified the vibration signal and sent it to the ADRE system and
TEAC digital tape recorder.
There were two different motor electrical signal analysis systems as part of this
research. The first was the PdMA EMax (Figure 22).
Figure 22. PdMA EMax portable dynamic tester.
Emax
Frequency Range 100 kHz
A/D 16 bit
Dynamic Range 138 dB *
FFT Resolution 100 – 12,800 lines
Input impedance 1 MO +3%
Power AC power
Table 4. Emax specifications. *The Emax dynamic range is improved through gainamplification of the 16 bit signal.
Page 61
7/27/2019 Electric Motor Signature Analysis
http://slidepdf.com/reader/full/electric-motor-signature-analysis 61/119
54
The Emax system from PdMA Corporation, is a portable dynamic tester that
evaluates electrical motor condition without shutting down process (Figure 23). The
system was originally designed specifically for motor electric circuit analysis. With the
addition of demodulated motor current analysis, the system now measures mechanical as
well as electrical motor system problems. Table 4 lists the specifications for the system.
One item of interest is the 138 dB gain possible with the system – the 16 bit digital
system has ~ 90 dB dynamic range, with gain after demodulation 138 dB is possible.
Current is collected in one of three ways: high resolution, low resolution or
eccentricity. Each uses different sampling rates and resolutions to identify anomalies in a
specific fault zone. Rotor bar defects and eccentricity, static or dynamic are detected and
trended. Graphing in-rush current and startup time is extremely valuable when
evaluating motor operation and condition. Changes in the startup characteristics can be
attributed to rotor or stator faults. Figure 23 shows the FFT (spectrum) of eccentricity
measurement made by the PdMA EMax system from the demodulated current signal.
This is a FFT spectrum with frequency on the X axis and amplitude of the data in dB
current on the Y axis.
Page 62
7/27/2019 Electric Motor Signature Analysis
http://slidepdf.com/reader/full/electric-motor-signature-analysis 62/119
55
Figure 23. PdMA Emax spectrum screen print.
Emax reports include a series of graphs, screen plots and historical comparisons.
In addition, the Emax next generation of software used the Motor Current Spectrum in
testing at CPSES to monitor for motor rotor mechanical dynamics such as motor speed,
imbalance, bearing faults, vane pass, and other mechanical rotating parameters.
The second system was the MPM Explorer which is shown in Figure 24. The
Baker Instrument MPM system specifications are listed in table 5. The MPM system
uses a 12 bit analog-to-digital converter with gain and noise reduction circuitry and has a
dynamic range of 138 dB (a 12 bit analog to digital system typically has approximately
66 dB resolution).
Page 63
7/27/2019 Electric Motor Signature Analysis
http://slidepdf.com/reader/full/electric-motor-signature-analysis 63/119
56
Figure 24. Baker Instruments MPM portable dynamic tester.
MPM
Frequency Range 100 kHz
A/D 12 bit
Dynamic Range 138 dB
FFT Resolution 100 – 1,200 lines
Input impedance 1 MO +3%
Power AC power
Table 5. MPM specifications
This self-contained portable instrument is computer driven and all testing can be
accomplished directly from the Motor Control Center. The Performance Monitor (Motor
Performance Monitor - MPM) Explorer Series II performs five major functions in a
complete predictive maintenance program. (1) It identifies possible power circuit
problems that degrade motor health; (2) examines overall motor power conditions; (3)
monitors the load; (4) observes motor performance; and (5) estimates energy savings. It
also can analyze the instantaneous torque with a FFT spectrum or DFLL wavelet system.
Page 64
7/27/2019 Electric Motor Signature Analysis
http://slidepdf.com/reader/full/electric-motor-signature-analysis 64/119
57
For this research the FFT spectrum was utilized. The DFLL module was not completely
developed in time for this testing.
The MPM is programmed to supply information on voltage balance, distortion,
voltage level, rotor cage condition, motor efficiency, effective service factor, and over
current, along with torque ripple and load history. This wide range of tests allows the
exploration of the true condition of motor integrity and the conditions related to motor
performance.
Figure 25. Baker MPM spectrum screen print.
For any test, the spectra data from voltage, current, or torque is available. Figure
25 is a screen print of torque spectrum taken from the baseline test for the EPRI project.
The torque data is demodulated because the torque is a function of the rotor speed. The
torque spectra were used for the different tests at Comanche Peak.
Another vibration technology was reviewed for EPRI during this research.
The technology is called Stress Wave Analysis. It uses an accelerometer with a natural
mounted frequency of 40 kHz. This accelerometer is connected to an analog band-pass
Page 65
7/27/2019 Electric Motor Signature Analysis
http://slidepdf.com/reader/full/electric-motor-signature-analysis 65/119
58
filter that filters frequencies below and above 40 kHz. The output is rectified and fed into
an analog-to-digital circuit. The system is shown in Figure 27 during the EPRI testing of
the fan system.
Figure 26. SWANTECH data collection system.
The system shown in Figure 26 is a SWANview® portable analyzer. It collects
data from two field transducers, which are tuned accelerometers designed to have a
resonance frequency of ~ 40 KHz. The transducer’s outputs are analog filtered at the
computer with a band pass filter around 40 KHz. This frequency limits mechanical
information due to the fundamental frequencies (mechanical noise) from entering the
process. The data is then processed by digital filters and demodulated to go into the
analyzer which is designed to measure the stresses in the system, along with a FFT
spectrum and a histogram of the Gaussian curve for the demodulated data.
This data was used to verify the ability of stress wave analysis to detect rolling
element bearing faults with sensors connected to the cowling of the suspect motor. This
Page 66
7/27/2019 Electric Motor Signature Analysis
http://slidepdf.com/reader/full/electric-motor-signature-analysis 66/119
59
data was used to verify the bearing cap data taken with normal accelerometers and
spectrum analysis.
Sample Preparation
The test group of bearings was staged and two bearings were picked, at random,
to be modified for the test. Two bearings were artificially flawed. One had the outer race
scored (Figure 27) and one bearing had the inner race scored (Figure 28) with an abrasive
high-speed grinder. These bearings were for the conceptual test of detecting bearing
faults using motor electrical signature analysis. The rest of the bearings were used for
baseline data collection and returning the motor and fan to the condition found on receipt.
Figure 27. SKF® 6503 deep groove bearing.
The outer race defect in Figure 27 was taken after the testing was complete. The
bearing outer race was cut into two pieces and the bearing analyzed. The groove in the
outer race was ½ inch long, 1/16 inch wide, and 1/16 inch deep. This would be
considered a failure type flaw in a rolling element bearing (Berry, 1994).
Page 67
7/27/2019 Electric Motor Signature Analysis
http://slidepdf.com/reader/full/electric-motor-signature-analysis 67/119
60
Figure 28. SKF® 6502 deep grooved bearing.
The inner race defect in Figure 28 was taken after the testing was complete. The
bearing outer race was cut into two pieces and the bearing analyzed. The groove in the
outer race was 2/3 inch long, 1/16 inch wide, and 1/16 inch deep. This would be
considered a failure type flaw in a rolling element bearing (Berry, 1994).
Test Procedure
The fan tests were run in two separate groups: one with PdMA and the other with
Baker and SWANTECH. Each group test consisted of a baseline run, an imbalanced fan
run, a faulted bearing run, and a baseline verification run. Prior to running the first test
with PdMA, new bearings were installed in the fan and the fan was balanced. Once the
vibration data from the bearing housing was analyzed for any bearing faults or imbalance,
the first baseline data was collected using ADRE, the TEAC digital tape recorder, and the
PdMA Emax system. This same sequence was followed for the Baker MPM and
SWANTECH SWANview® testing a week later.
Page 68
7/27/2019 Electric Motor Signature Analysis
http://slidepdf.com/reader/full/electric-motor-signature-analysis 68/119
61
After the baseline run, a weight was attached 2 inches from the centerline of the
shaft on the fan-coupling hub as shown in Figure 30. This introduced an eccentric
imbalance on the fan end of the motor, which translates 0.54 oz-inch of additional
imbalance (see equation 20) in the motor bearing housings. This equated to a doubling of
the vibration in inches per second at the motor outboard bearing. The motor was started
and the first set of comparison data was collected.
inchoz imbalance
gram
oz gramsinchesimbalance
gram
oz gramsmr inchoz imbalance
massradiusr
−=
=
−=−
=
54.0
03527.0*6.7*2
)1
03527.0(*)(
*)(Imbalance
(20)
Figure 29 shows the fan hub with the imbalance weights attached in the top of the
bolt ring. The weights between the bolts on the right side of the picture were the weights
added to balance the fan prior the test baseline run. These weights were not removed for
the remainder of the testing.
Page 69
7/27/2019 Electric Motor Signature Analysis
http://slidepdf.com/reader/full/electric-motor-signature-analysis 69/119
62
Figure 29. Fan with imbalance weight.
After the imbalance run, the outboard (free end) bearing was removed and a
faulted inner race bearing was installed. The bearing removal of the bearing is shown in
Figures 30 and 31. Figure 30 shows the bearing puller being used on the motor
outboard bearing, with the motor still attached to the fan (inboard side). A new bearing
could not be re-used if it was removed by this method.
Figure 31 is a picture of the motor outboard bearing housing, removed from the
motor to gain access to the bearing on the motor shaft. The bearings have to be heated to
install because there is about 0.002 inches difference between the bearing inner diameter
and the shaft outer diameter.
fan hub bolts
7.6 grams imbalance
balance weight
Page 70
7/27/2019 Electric Motor Signature Analysis
http://slidepdf.com/reader/full/electric-motor-signature-analysis 70/119
63
Figure 30. Removal of bearing from motor outboard end.
Figure 31. Motor outboard bearing housing (end bell).
The motor was reassembled, balance was checked, the motor continued to
run for five minutes, then motor data was collected along a with ADRE and TEAC digital
tape recording of the bearing housing and fan cowling vibration data.
Page 71
7/27/2019 Electric Motor Signature Analysis
http://slidepdf.com/reader/full/electric-motor-signature-analysis 71/119
64
The test data was collected simultaneously for all tests to reduce any errors due to
changes in running condition. The motor current, voltage, temperature, running speed,
vibration, noise level, humidity, and air temperature were collected to identify any
conditions that would invalidate the test. During the Baker / SWANTECH data
collection, the load and air borne noise were lower than during the PdMA testing. The
fan was found to be running backwards. This invalidated the first three runs of the Baker
test, which had to be performed over.
Figure 32. Collecting data during the PdMA testing.
In Figure 32, data collection for the first baseline data collection run is in progress
with the PdMA test equipment. Notice that the data collection system is near the power
supply console. The fan is about 25 feet to the left of the picture. The data collection
systems were close to the power supply to simulate conditions found in our power plant,
where the Motor Control Cabinets are remote in relationship to the fans.
Page 72
7/27/2019 Electric Motor Signature Analysis
http://slidepdf.com/reader/full/electric-motor-signature-analysis 72/119
65
CHAPTER 4
RESULTS AND ANALYSIS
Fan motor testing was conducted at the TXU SMART Team Three equipment
repair and inspection shop. The area was used exclusively for this research. The results
were downloaded off the different databases and transferred to Microsoft® Excel
spreadsheets. Test of the objective criterion, using the equations discussed in chapter 3,
was the primary method employed to analyze the test data. The vibration data on the fan
cowling did have measurable changes in amplitude at the specific frequencies of concern
for this comparison test, but the levels, once translated to vibration velocity (inches per
second), were in the noise floor of the overall signal. Additionally, the Stress Wave
Analysis data was used in validation of this new technology for future investigations.
Tests of Objective Criteria
Tables 6, 7, 8, 9, 10, 11, and 12 are based on the Comparative Analysis and show
the results of the testing compared to the objective criteria. Each of these tables contains
the average standard variance, test criterion, and the difference in means between the
baseline and the test conditions for each test.
Tables 5, 6, and 7 correspond to research question #1: Will the use of cowling
mechanical vibration detect faults in the motor rotor system compared to the bearing
housing mechanical vibration? The objective criteria were computed using equation (19).
Table 10 shows that the cowling data rejects the null hypothesis, and therefore can
differentiate between baseline and motor imbalance conditions. Tables 6 and 7 indicate
Page 73
7/27/2019 Electric Motor Signature Analysis
http://slidepdf.com/reader/full/electric-motor-signature-analysis 73/119
66
that the cowling data accepts the null hypothesis and therefore cannot differentiate
between baseline data and motor bearing faults.
Fan cowling imbalance data with statistical calculations is shown in table 6. This
table is a comparison between the Baseline running speed vibration taken on the cowling
and the imbalance running speed vibration taken on the cowling. Running speed
vibration is the frequency data that is used to determine imbalance.
TrialImbalance 1X
amplitude (volts)Baseline 1X
amplitude (volts)Difference in
amplitude (volts)
1 0.0003065 0.0002872 1.93193E-05
2 0.0003065 0.000287 1.94814E-05
3 0.0003063 0.0002872 1.91464E-05
4 0.0003063 0.0002872 1.91464E-05
5 0.0003063 0.000287 1.93085E-05
6 0.0003062 0.000287 1.91356E-05
7 0.000306 0.0002872 1.88006E-05
8 0.0003062 0.0002872 1.89735E-05
9 0.0002633 0.0002874 -2.40951E-05
100.0003062 0.0002872 1.89735E-0511 0.0003063 0.0002874 1.89843E-05
)(∑ −diff iia X X 3.787E-06
diff X 1.51977E-05*
diff X 8.85145E-22
Table 6: Imbalance to Baseline, Comparison Baseline to imbalanced measured onthe cowling with accelerometers.
( diff X = 1.51977E-05) > ( *
diff X = 8.85145E-22)
Reject Ho: µ diff ≤ 0
Accept Ha: µ diff > 0 with at least 90% confidence. Conclusion: the imbalance which is
indicated by the once per revolution amplitude is greater than the baseline once per
revolution amplitude for fan cowling data.
Page 74
7/27/2019 Electric Motor Signature Analysis
http://slidepdf.com/reader/full/electric-motor-signature-analysis 74/119
67
Fan cowling bearing inner race (Ball Pass Inner Race, BPIR) fault data with
statistical calculations is shown in table 7. This table is the comparison between the
Baseline BPIR vibration taken on the cowling and the faulted inner race BPIR data taken
on the cowling. BPIR vibration is the frequency data that is used to determine bearing
inner race defects.
TrialBPIR amplitude
(volts)BPIR baseline
amplitude (volts)Difference in
amplitude (volts)
1 0.0000259 0.0002593 -0.000233387
2 0.0000259 0.0002593 -0.000233387
3 0.0000259 0.0001297 -0.0001037284 0.0000259 0.0001297 -0.000103728
5 0.0000259 0.0002593 -0.000233387
6 0.0000259 0.0002593 -0.000233387
7 0.0000259 0.0002593 -0.000233387
8 0.0000259 0.0002593 -0.000233387
9 0.0000259 0.0001297 -0.000103728
10 0.0000259 0.0001297 -0.000103728
11 0.0000259 0.0001297 -0.000103728
)(∑ −diff iia X X -0.001918963
diff X -0.000174451*
diff X 0
Table 7: BPIR to Baseline, Comparison Baseline to an inner race defect measuredon the cowling with accelerometers
( diff X = -0.000174451) < ( *diff X =0)
Accept Ho: µ diff ≤ 0 with at least 90% confidence.
Reject Ha: µ diff > 0
Conclusion: Accept Null Hypothesis that the BPIR amplitude is less than the baseline
amplitude for fan cowling data. Fan cowling data is inconclusive in detection of BPIR
faults.
Page 75
7/27/2019 Electric Motor Signature Analysis
http://slidepdf.com/reader/full/electric-motor-signature-analysis 75/119
68
Fan cowling bearing outer race (Ball Pass Outer Race BPOR) fault data with
statistical calculations is shown in table 8. This table is the comparison between the
Baseline BPOR vibration taken on the cowling and the faulted outer race BPOR data
taken on the cowling. BPOR vibration is the frequency data that is used to determine
bearing outer race defects.
TrialBPOR amplitude
(volts)BPOR baseline
amplitude (volts)Difference in
amplitude (volts)
1 2.593E-05 8.59E-05 -5.99676E-05
2 2.593E-05 8.59E-05 -5.99676E-05
3 2.593E-05 8.59E-05 -5.99676E-054 2.593E-05 8.59E-05 -5.99676E-05
5 2.593E-05 1.718E-05 8.75203E-06
6 2.593E-05 8.59E-05 -5.99676E-05
7 2.593E-05 8.59E-05 -5.99676E-05
8 2.593E-05 8.59E-05 -5.99676E-05
9 2.593E-05 8.59E-05 -5.99676E-05
10 2.593E-05 8.59E-05 -5.99676E-05
11 2.593E-05 8.59E-05 -5.99676E-05
)(∑ −diff iia X X -0.000590924
diff X -5.37203E-05*
diff X 1.77029E-21
Table 8: BPOR to Baseline, Comparison Baseline to an outer race defect measuredon the cowling with accelerometers
( diff X = -5.37203E-05) < ( *diff X = .77029E-21)
Accept Ho: µ diff ≤ 0 with at least 90% confidence.
Reject Ha: µ diff > 0
Conclusion: Accept Null Hypothesis that the BPOR amplitude is less than the baseline
amplitude for fan cowling data. Fan cowling data is inconclusive in detection of BPOR
faults.
Page 76
7/27/2019 Electric Motor Signature Analysis
http://slidepdf.com/reader/full/electric-motor-signature-analysis 76/119
69
Tables 8, 9, 10, and 11 correspond to research question #2 which is divided into
two parts due to the differences in the methodology of data analysis performed by Baker
and by PdMA. The motor electrical signature analysis failed to accept the null
hypothesis and therefore accepted the alternate hypothesis; motor current analysis can
detect motor faulted conditions.
PdMA imbalance data with statistical calculations is shown in table 9. This table
is a comparison between the baseline running speed vibration taken with the PdMA
motor current analyzer and the imbalance running speed vibration taken with the PdMA
box. The running speed vibration is the frequency data that is used to determine
imbalance.
TrialImbalance 1X
amplitude (volts)Baseline 1X
amplitude (volts)Difference in
amplitude (volts)
1 0.775692 0.547031 0.22866091
2 0.765692 0.537031 0.22866091
3 0.745692 0.587031 0.15866091
4 0.695692 0.497031 0.198660915 0.665692 0.541203 0.12448871
6 0.725692 0.547031 0.17866091
7 0.595692 0.557031 0.03866091
8 0.769692 0.549931 0.21976091
9 0.761692 0.547031 0.21466091
10 0.742692 0.511231 0.23146091
11 0.775692 0.546131 0.22956091
)(∑ −diff iia X X 2.0518978
diff X 0.18653616*
diff X 3.98811E-17
Table 9: Imbalance to Baseline, Comparison using PdMA Emax system
( diff X = 0.18653616) > ( *
diff X =3.98811E-17)
Page 77
7/27/2019 Electric Motor Signature Analysis
http://slidepdf.com/reader/full/electric-motor-signature-analysis 77/119
70
Table 9 analysis continued:
Reject Ho: µ diff ≠ 0
Accept Ha: µ diff > 0 with at least 90% confidence. Conclusion: the imbalance which is
indicated by the once per revolution amplitude is greater than the baseline once per
revolution amplitude for the PdMA motor electrical signature analysis data.
PdMA bearing inner race (Ball Pass Inner Race BPIR) fault data with statistical
calculations is shown below in table 10. This table is a comparison between the Baseline
BPIR vibration taken with the PdMA Emax system and the faulted outer race BPIR data
taken with the PdMA Emax system. BPIR vibration is the frequency data that is used to
determine bearing inner race defects.
TrialBPIR amplitude
(volts)BPIR Baseline
amplitude (volts)Difference in
amplitude (volts)
1 0.14632136 0.12555643 0.02076493
2 0.14487030 0.11235864 0.032511657
3 0.14511590 0.11153624 0.033579657
4 0.14511590 0.13568943 0.0094264735 0.14959480 0.10120643 0.048388373
6 0.14503400 0.13565664 0.009377357
7 0.14024740 0.10125343 0.038993973
8 0.14511590 0.13589627 0.009219625
9 0.14040570 0.11478275 0.025622951
10 0.15519770 0.12756427 0.027633425
11 0.14032660 0.11996843 0.020358173
)(∑ −diff iia X X 0.275876592
diff X 0.02507969*diff X 2.71917E-18
Table 10: BPIR to Baseline, Comparison of Baseline and bearing inner race defectusing the PdMA Emax system
( diff X = 0.02507969) > ( *
diff X = 2.71917E-18)
Page 78
7/27/2019 Electric Motor Signature Analysis
http://slidepdf.com/reader/full/electric-motor-signature-analysis 78/119
71
Table 10 continued:
Reject Ho: µ diff ≠ 0
Accept Ha: µ diff > 0 with at least 90% confidence. Conclusion: the BPIR amplitude is
greater than the BPIR baseline amplitude for PdMA motor electrical signature analysis
data.
Baker imbalance with statistical calculations is shown below in table 11. This
table is a comparison between the baseline running speed vibration taken with the Baker
motor analyzer and the imbalance running speed vibration taken with the Baker box. The
running speed vibration is the frequency data that is used to determine imbalance.
TrialImbalance 1X
amplitude (volts)Baseline 1X
amplitude (volts)Difference in
amplitude (volts)
1 0.019950 0.0001334 0.0198166
2 0.019950 0.0001334 0.0198166
3 0.019110 0.0001334 0.0189766
4 0.021130 0.0001334 0.0209966
5 0.021130 0.0001334 0.0209966
6 0.019950 0.0001413 0.0198087
7 0.019950 0.0001334 0.0198166
8 0.019950 0.0001259 0.0198241
9 0.020540 0.0001413 0.0203987
10 0.019950 0.0001413 0.0198087
11 0.021130 0.0001334 0.0209966
)(∑ −diff iia X X 0.2212564
diff X 0.020114218
*diff X 4.53194E-19
Table 11: Imbalance to Baseline, Comparison using Baker MPM system
( diff X = 0.020114218) > ( *
diff X =4.53194E-19)
Reject Ho: µ diff ≠ 0
Page 79
7/27/2019 Electric Motor Signature Analysis
http://slidepdf.com/reader/full/electric-motor-signature-analysis 79/119
72
Table 11 continued:
Accept Ha: µ diff > 0 with at least 90% confidence. Conclusion: the imbalance which is
indicated by the once per revolution amplitude is greater than the baseline once per
revolution amplitude for Baker MPM motor electrical signature analysis data.
Baker MPM bearing outer race (Ball Pass Outer Race BPOR) fault data with
statistical calculations is shown in table 1.2 This table is a comparison between the
Baseline BPOR vibration taken with the Baker MPM system and the faulted outer race
BPOR data taken with the Baker MPM system. BPOR vibration is the frequency data
that is used to determine bearing outer race defects.
TrialBPOR amplitude
(volts)BPOR Baseline
amplitude (volts)Difference in
amplitude (volts)
1 0.01778 0.01334 0.00444
2 0.01679 0.01585 0.00094
3 0.01778 0.01655 0.00123
4 0.01911 0.01585 0.00326
5 0.01778 0.01778 0
6 0.01778 0.01585 0.00193
7 0.01911 0.01679 0.00232
8 0.01679 0.01585 0.00094
9 0.01334 0.01778 -0.00444
10 0.01778 0.01778 0
11 0.01778 0.01585 0.00193
)(∑ −diff iia X X 0.01255
diff X 0.001140909*
diff X 2.83246E-19Table 12: BPOR to Baseline, Comparison of Baseline and bearing inner race defect
using the Baker MPM system
( diff X = 0.001140909) > ( *
diff X = 2.83246E-19)
Reject Ho: µ diff ≠ 0
Page 80
7/27/2019 Electric Motor Signature Analysis
http://slidepdf.com/reader/full/electric-motor-signature-analysis 80/119
73
Table 12 continued:
Accept Ha: µ diff > 0 with at least 90% confidence. Conclusion: the BPOR amplitude is
greater than the BPOR baseline amplitude for Baker motor electrical signature analysis
data.
Observations
This research was primarily concerned with the proof of concept that motor
electrical signature analysis was able to detect motor rotor mechanical faults. During the
testing a few observations were noted:
1. The motor rotor rotation must be verified prior to commencing the test.
2. The motor rotor must be balanced in two planes prior to testing.
The motor rotation was not checked prior to the first set of Baker Instrument test
runs. This caused the motor current to be substantially lower than was found during the
PdMA testing. The Electrician supporting the testing noted the error, and testing started
over. During the second run of the test, the motor load was the same as in the PdMA test.
The motor was not balanced in two planes in the beginning of the PdMA testing.
Subsequently, the vibration readings were very high at the start of the test. The motor
had to be balanced a second time to remove a couple imbalance.
Fan Cowling Data
Although the fan cowling data did pick up the imbalance data, the change in
amplitude would have gone unnoticed in a vibration trending program. The amplitude of
the vibration values would not have raised concern. With the null hypothesis rejected for
Page 81
7/27/2019 Electric Motor Signature Analysis
http://slidepdf.com/reader/full/electric-motor-signature-analysis 81/119
74
the imbalance, CPSES will re-evaluate the imbalance spectra for vane-axial fans and
trend the value in the future.
The fan cowling data did not statistically identify changes in the amplitude of the
bearing fault frequencies, which was the purpose of embarking on this research. With the
confirmation that the cowling data did not “see” the bearing faulted conditions and the
low levels of imbalance, a method of determining faulted fan rotating system is needed.
Fan Bearing Housing Data
The fan bearing housing data was used as a baseline reference to ensure that the
faults were measurable and identifiable. Both the inboard and outboard bearing housing
readings statistically identified imbalance and bearing faults in the motor outboard
bearing. The reference (baseline) data used for comparing the faulted data is considered
a standard method of fault detection in the vibration industry (Berry, 1994).
Motor Electrical Signature Analysis
Both of the Motor Electrical Signature Analysis technologies were statistically
able to identify a change in the eccentricity (imbalance) of the rotating system. The
detection of bearing faults was statistically proven, but the levels of changes were so
slight that it will necessitate further investigation into the best methodology for
implementing MESA for bearing fault detection.
Page 82
7/27/2019 Electric Motor Signature Analysis
http://slidepdf.com/reader/full/electric-motor-signature-analysis 82/119
75
Stress Wave Analysis
This technology was not part of the statistical test for this research, but the
technology is able to detect bearing faults both on the bearing cap and on the fan cowling.
Where the vibration data could only see the close coupled data, the stress wave system
could “see” the effects of a bearing fault on the fan cowling.
The stress wave system did not detect the eccentricity of the fan. This was not
expected and will require further investigation to determine why imbalance was not
detected.
Page 83
7/27/2019 Electric Motor Signature Analysis
http://slidepdf.com/reader/full/electric-motor-signature-analysis 83/119
76
CHAPTER 5
CONCLUSION
The purpose of this research was to determine if Motor Electrical Signature
Analysis (MESA) would detect Vane-Axial fan degradation. Specifically it detects
imbalance, rolling element bearing inner race defects, and rolling element bearing outer
race defects. Another purpose of this research was to determine statistically if fan
cowling vibration data would detect Vane-Axial fan degradation.
Analysis of the research data resulted in a failure to reject the null hypothesis in
all but one instance. The one instance that the null hypothesis was accepted was the fan
cowling vibration data for imbalance. The results were very close to equal for the paired
comparison test. It was concluded from the analysis that this research can claim that
Motor Electrical Signature Analysis can detect Vane-Axial fan degradation. The research
does not support the ability of the fan cowling vibration data to detect Vane-Axial fan
degradation.
The MESA ability to detect degradation was statistically proven. However, the
severity of the degradation, and a standard or metric to determine the extent of
degradation was not correlated to the bearing housing vibration condition standards. For
this research, a proof of concept, the direct relationship of the MESA data to the vibration
data was not attempted due to the complexity of relating the air gap permeability to
bearing casing vibration standards.
Page 84
7/27/2019 Electric Motor Signature Analysis
http://slidepdf.com/reader/full/electric-motor-signature-analysis 84/119
77
The research into direct relationship was attempted by Georgia Tech and was
determined to vary machine to machine based on the air gap concentricity and
permeability for each motor rotor system (Riley, ET. AL., 1997). Therefore, my
research focused on the ability of these systems to detect a change in amplitudes at a
specific frequency of concern for a given rotor fault instead of a direct comparison to
vibration data.
The change in a specific frequency amplitude has practical applications in
monitoring the condition of rotating equipment associated with three phase induction
motors. The rolling element bearings generate different frequencies depending on the
type of failure mode of the bearing. These frequencies are always present, but do not
change unless the physical system changes (i.e. lubrication, surface defect, age, or load
changes) (Berry, 1994). The imbalance of the motor and alignment is also frequency
dependent, and the frequencies for imbalance and alignment are present in the MESA
signals. These frequencies, once identified, can be monitored for changes and if analysis
does not eliminate a fault or significant change, the motor rotor system’s condition can be
ascertained.
Finally, it can be concluded that MESA can detect the three types of rotor faults
that were introduced in this research. The fan cowling data was not able to detect bearing
faults, and was very close to the noise floor in detecting the imbalance. This suggests
that MESA could be implemented to trend the specific fault frequencies of a hard to
access Vane-Axial fan motor, and monitor for changes that could be detrimental to the
operation of the fan system.
Page 85
7/27/2019 Electric Motor Signature Analysis
http://slidepdf.com/reader/full/electric-motor-signature-analysis 85/119
78
RECOMMENDATIONS
From this research, it is concluded that the Motor Electrical Signature Analysis is
able to detect the faults that were installed in the fan. This method of motor rotating fault
detection should be reviewed for implementation as a part of condition based
maintenance practices. The ability to detect Vane-Axial fan mechanical faults has a very
low success rate in the utility industry (EPRI, 1998). Nevertheless, since this research
was focused on one type of application, Vane-Axial fans, and only three fault types,
further research is needed to expand the envelope of fault types and detection using
MESA. Since this was a proof of concept for a specific application, the technology may
or may not transfer to other equipment system driven with an induction motor.
The research was based on detection of bearings that were artificially degraded
and would cause motor or fan damage if left in operation. The purpose of condition
based maintenance is to detect faults before equipment failure and to help plan for work
on the equipment in a planned and non-impactive way. Since this research looked at
essentially failed bearings, research should be carried out with incrementally degraded
bearing fault by increasing the severity until the MESA systems detection envelope is
obtained.
In addition, even though the stress wave analysis system was not a part of this
research, the ability of the system to detect bearing fault should be statistically
investigated for bearing fault detection in other applications within the utility industry.
Page 86
7/27/2019 Electric Motor Signature Analysis
http://slidepdf.com/reader/full/electric-motor-signature-analysis 86/119
79
APPENDIX A
DATA COLLECTION
RECORDS
Page 87
7/27/2019 Electric Motor Signature Analysis
http://slidepdf.com/reader/full/electric-motor-signature-analysis 87/119
Appendix AData Collection
Records
80
DATA COLLECTION
1. Prerequisites:
a. Verify Motor Data:
Manufacture Baldore
Horse Power 5
Voltage 460
Full Load Amps 6.4
RPM 1778
Service Factor 1.15
Insulation Class f code J
Temperature Continuous Operation 40 ºC
Bearings – Inboard SKF - 6206
Bearings – Outboard SKF - 6205
2. Bench Mark Base Line Run #1
3. Bench Imbalance Run #1
4. Bench Mark Damaged Inner Race Run #1
5. Bench Mark Damaged Outer Race Run #1
6. Bench Mark Baseline Run #2
7. Bench Imbalance Run #2
8. Bench Mark Damaged Inner Race Run
9. Bench Mark Damaged Outer Race Run #2
Page 88
7/27/2019 Electric Motor Signature Analysis
http://slidepdf.com/reader/full/electric-motor-signature-analysis 88/119
Appendix AData Collection
Records
81
Vane-axial Fan
Data Collection Entry Sheet
1. Verify the prerequisite steps have been completed.
2. Check / verify all the signals at the data collection systems are active.
3. Record the test run: Section:__PdMA.
4. Perform the setup activities for next test run.
5. Check / verify each channel of data collection is active and has good signal.
Location Transducer Transducer
Direction
Component
Direction
Amplifier
Channel
ADRE Channel
Cowling – Fan End(Inboard)
TU-6123 X VerticalFIV
1 2
“ “ Y AxialFIA
2 --
“ “ Z HorizontalFIH
3 1
Cowling – Free End(Outboard)
TU-6121 X VerticalFOV
4 4
“ “ Y AxialFOA
5 --
“ “ Z HorizontalFOH
6 3
Motor - Fan End(Inboard)
TU-6145 Y AxialMIA
7 --
“ “ Z HorizontalMIH
8 5
Motor – Free End(Outboard)
TU-6126 Y AxialMOA
9 --
“ “ Z HorizontalMOH
10 7
Motor - Fan End(Inboard)
TU-6692 Z VerticalMIV
11 6
Motor – Free End(Outboard)
TU-6091 Z VerticalMOV
12 8
Page 89
7/27/2019 Electric Motor Signature Analysis
http://slidepdf.com/reader/full/electric-motor-signature-analysis 89/119
Appendix AData Collection
Records
82
6. Start the fan motor and record the following information: Vibration and PdMA
Measurement Value Date Time Notes
Temperature 57.5º F
Humidity 65%
Voltage 483
Inrush Current 33amps
Running Current 5.3 amps
Approx. % Load 80%
11/26/01 10:00 PdMA data set – took 6 sets of data the first
3 sets the shaft was not balanced.
Teac Tape Data Start o Stop 1 Tape1 Notes
Run T1 Tape R 1 10:00:57 10:14:03 13:02 Run #1 unbalanced
Run T2 “ 11:15:00 11:34:00 07:49 Run #2 unbalanced
Run T3 “ 11:43:00 11:54:00 10:55 Run #3 8 grams @ 200º
Run T4 “ 14:58:00 15:05:00 07:22 Run #4 balanced
Run T5 “ 15:07:30 15:15:10 07:37 Run #5, 7.4 g @ 200º
Run T6 “ 16:04:00 16:50:00 10:56 Run #6, balanced w/ BPIR defect
7. Start the fan motor and record the following information: Vibration and PdMA
Measurement Value Date Time Notes
Temperature 68º FHumidity 50%
Voltage 483
Inrush Current 20 amps
Running Current 2.3 amps
Approx. % Load 50%
12/03/01 10:00 Baker data sets took sets of data the first 3sets the shaft was not balanced. (found outon run # 9 that the fan was running backwards)
Run # 10 was a repeat of #9 but in correctdirection.
Teac Tape Data Start o Stop 1 Tape1 Notes
Run T7 Tape R 1 11:10:46 11:24:04 13:29 Run #7 balanced
Run T8 “ 13:16:01 13:24:37 07:42 Run #8 7.4 g @ 200º
Run T9 “ 14:26:17 14:40:10 13:56 Run # 9 BPIR Inboard
Run T10 “ 15:24:14 15:33:00 08:46 Run #10 BPOR Inboard
Run T11 “ 15:46:30 15:57:30 10:56 Run #11 BPOR forward
Page 90
7/27/2019 Electric Motor Signature Analysis
http://slidepdf.com/reader/full/electric-motor-signature-analysis 90/119
Appendix AData Collection
Records
83
8. Start the fan motor and record the following information: Vibration and PdMA
Measurement Value Date Time Notes
Temperature 71º F
Humidity 90%
Voltage 483
Inrush Current 33 amps
Running Current 3.8 amps
Approx. % Load 78%
12/04/01 09:00 Baker and SWANTECH rebuilt motor to balanced and good bearings, verifiedrotation. Tape R 1 ran out about 3-4minutes into the run, took DataPACinformation from live run.
Teac Tape Data Start o Stop 1 Tape1&2 Notes
Run T12 Tape R 1 09:10:00 ** ** Run #12 – balanced
Run T13 Tape R 2 09:44:55 09:51:58 07:01 Run #13 7.4 g @ 200º
Run T14 “ 10:19:35 10:27:30 08:13 Run #14 balanced BPOR
** Tape stopped in the middle of the run.
Page 91
7/27/2019 Electric Motor Signature Analysis
http://slidepdf.com/reader/full/electric-motor-signature-analysis 91/119
Appendix AData Collection
Records
84
8. Record the file names / record information for each technology in test:
PdMA
File
RunT1
RunT2
RunT3
RunT4
RunT5
RunT6
RunT7
RunT8
RunT9
RunT10
RunT11
RunT12
RunT13
RunT14
unbalanced X
unbalanced X
8.0 g 200º X
Balanced X
7.4 g 200º X
BPIR (MOB) X
Baker
File
Balanced
(BW)
X
7.4 g 200º(BW)
X
BPIR (MOB)(BW)
X
BPOR (MOB)(BW)
X
BPOR (MOB)(CR)
X
Balanced X
7.4 g 200º X
BPOR X
SWANTECH
Balanced X
7.4 g 200º X
BPOR X
10. Return fan to stowage status:
Page 92
7/27/2019 Electric Motor Signature Analysis
http://slidepdf.com/reader/full/electric-motor-signature-analysis 92/119
85
APPENDIX B
Fan BearingInformation
SKF
Motor Outboard Bearing – 6205Motor Inboard Bearing – 6206
Page 93
7/27/2019 Electric Motor Signature Analysis
http://slidepdf.com/reader/full/electric-motor-signature-analysis 93/119
Appendix BFan BearingInformation
86
The following Bearing Frequencies are from SKF and Entek (a Rockwell Automation
Company). The formulas are from the Shock and Vibration Handbook.
( )CPM or Hz rotation frequency fr
Diameter Ball Bd
Diameter Pitch Pd
Ballsof Number n AngleContact
Cos Pd
Bd f FTF Cage
Cos Pd
Bd f
Bd
Bp BSF Race Inner
Cos Pd
Bd f
n BPFO RaceOuter
Cos Pd Bd f n BPFI Race Inner
(
)1(2
1)(
])(1[2
)(
)1(2
)(
)1(2
)(
2
===
==
−=
−=
−=
+=
β
β
β
β
β
ballsof number n
D D Pd
=
+=
2
21
diameter Ball Bd
D D Pd
=
+=
2
21
From Brüel & Kjær
Page 94
7/27/2019 Electric Motor Signature Analysis
http://slidepdf.com/reader/full/electric-motor-signature-analysis 94/119
Page 95
7/27/2019 Electric Motor Signature Analysis
http://slidepdf.com/reader/full/electric-motor-signature-analysis 95/119
88
APPENDIX C
Stress Wave Analysis
SWANTECH
Page 96
7/27/2019 Electric Motor Signature Analysis
http://slidepdf.com/reader/full/electric-motor-signature-analysis 96/119
Appendix CSWANTECH data
89
DEMONSTRATION OVERVIEW
DATE:
December 4, 2001
LOCATION:
TXU Electric, Comanche Peak
ATTENDEES:
TXU
Donald Doan – Principal Nuclear Technologist: Vibration, Sound and Modal Analysis
SWANTECH
Brian Rucker – Regional Manager 8676 West W AvenueSchoolcraft, MI 49087(616) 679-3030 [email protected]
Brad Cartwright – Sr. Applications Engineer 6682 NW 16th TerraceFt. Lauderdale, FL 33309(954) 975-2212 [email protected]
PURPOSE OF DEMONSTRATION:
To demonstrate SWAN’s ability to detect and differentiate a healthy bearing from one with aninduced fault.
DEMONSTRATION MACHINERY:
Axial Vane fanSENSOR LOCATIONS:
Sensor 101 Motor BearingSensor 102 Outer Case
Page 97
7/27/2019 Electric Motor Signature Analysis
http://slidepdf.com/reader/full/electric-motor-signature-analysis 97/119
Appendix CSWANTECH data
90
SWANVIEW™ TOOLS:
This section introduces SWANView’s three primary tools, Stress Wave Energy (SWE),
Stress Wave Amplitude Histograms and Stress Wave Spectral Analysis, which are used to
determine the operating characteristics of the demonstration machinery. The analysis in the
following pages consists of looking at data from each sensor location in the following manner:
1. Created Operating History Charts capturing
data during routine Operation. TheOperating Histories trend SWE readingsover time and shows them against the backdrop of the green, yellow and redhealth indicating color zones. The result being an easy-to-interpret graphicalrepresentation of the health trend of the machine.
2. Examined the Stress Wave Amplitude Histogram (SWAH) to determine whether thedistribution was normal (bell shaped) and at the lower end of the amplitude scale (x-axis).This tool takes each individual sensor output-voltage reading (sampled at 20,000 readings per second) and distributes them into voltage-bins that correspond to the value of each
reading. In healthy machinery, the distribution should be a narrow bell shape (because thevoltage readings are consistent, thus distributed over a narrow voltage range) and at thelower end of the voltage scale (because minimal abnormalities are present to excite thesensor to higher amplitudes). As aperiodic events occur (usually the result of lubrication problems such as fluid or particulate contamination or skidding between rolling elements),the voltage readings occur over a much broader range at a higher amplitude. The result is amuch broader distribution that is shifted to the right on the voltage scale (x-axis).
3. Examined the Stress Wave Spectra for spectral lines more than 10 dB above background levels.SWAN sensors only detect events capable of exciting the sensor at 40,000 Hz. All thenormal machine dynamics are filtered out and what remains is a time history of shock or friction modulating events. In healthy machinery, a minimal number of shock events occur thus the spectral analysis yields only a relatively flat horizontal line with no significant
Normal Skewed
Page 98
7/27/2019 Electric Motor Signature Analysis
http://slidepdf.com/reader/full/electric-motor-signature-analysis 98/119
Appendix CSWANTECH data
91
spectral lines (spikes in the vertical direction). When a damage zone is present, a repetitiveshock event occurs as the damage zone makes contact with mating parts. This repetitiveshock event shows up in the spectral analysis as a spectral line (spike) at the frequency thatit occurs. When a spike does occur, the geometry of the rolling elements and the speed at
which they are rotating can be analyzed to determine the precise part that could cause shock at that frequency, thus indicating the damaged component and its location.
DATA AND RESULTS
The EPRI Seeded Fault Bearing test demonstrates how Stress Wave Analysis quickly
and easily differentiates a healthy component from a damaged one in a clear and unambiguous
manner. SWAN confirmed healthy operation of an electric fan motor known to be good while
showing a dramatic difference in the unit when a fault was induced. SWAN’s Stress Wave
Energy Index increased by over 375% from the healthy condition to the damaged condition, an
unmistakable indicator. In addition, both SWAN’s Histogram and Spectral Analysis clearly
differentiate the damaged unit from the normal.
An unbalance was induced on the fan for a brief period to test another technology’s
ability to detect this condition. SWAN sensors were connected to the unit during this phase of
testing and did not detect the unbalance. SWAN is very effective at detecting unbalance
conditions in machinery, although it is only detectable when it is severe enough to overload the
Healthy Repetitive shock
Page 99
7/27/2019 Electric Motor Signature Analysis
http://slidepdf.com/reader/full/electric-motor-signature-analysis 99/119
Appendix CSWANTECH data
92
bearing. In this case, the 4-gram unbalance was not enough to adversely affect the bearing’s
performance; therefore SWAN did not detect it.
Machinery of varying degradation is easily diagnosed and differentiated with the SWAN
System, as the data that follows will show. The data is also presented in an easy to interpret
graphical display that enables a user to determine the health of a machine or component within a
matter of minutes with minimal training.
The thresholds on the health-indicating color zones were set using the undamaged
bearing as a guide to what the nominal amount of friction would be from a healthy unit. In
reality, a comprehensive configuration would include data from multiple machines. A key
characteristic of SWAN technology is friction levels between like machines operating in a
healthy condition are very similar. Thus a unique baseline need not be set on every machine.
One properly established baseline can be used to immediately verify whether any like machine
is operating in a healthy state or not, significantly reducing the time, resources and data
compilation required by other conventional condition monitoring methods.
STRESS WAVE ENERGY
Stress Wave Energy is an excellent indication of the overall health of a machine because
it is a direct measurement and comparison of the amount of friction and impacting occurring.
The charts on Page 4 show the Stress Wave Energy trends for the Normal, Unbalanced and
Seeded Fault Bearing condition from both the Motor Bearing and Outer Case sensor locations.
The Seeded Fault Bearing is unmistakable as compared to both the Normal and Unbalanced
conditions. The Normal operating condition is characterized by a very linear data trend,
Page 100
7/27/2019 Electric Motor Signature Analysis
http://slidepdf.com/reader/full/electric-motor-signature-analysis 100/119
Appendix CSWANTECH data
93
completely horizontal and steady with very little variance. Contrast this to the Seeded Fault
condition where the data trends 350% higher than the Normal condition, well into the Yellow
and even the Red health indicating color zone. Note too the erratic nature of the trend as
compared to the very steady trend from the healthy condition. This is unmistakable evidence of
an undesirable operating condition that even the most novice analyst can discern.
Data from the Outer Case sensor location reacts identical to the Motor Bearing location
although the Stress Wave Energy values are considerably less. This is due to the sound path
restrictions from the bearing to the outer case where the sensor was mounted. Several
mechanical interfaces (including the epoxy required to affix the sensor mount) and thin support
structures obstructed the bearing from the sensor location. Regardless, this location was still an
effective location for differentiating the Normal from the Damaged condition.
Page 101
7/27/2019 Electric Motor Signature Analysis
http://slidepdf.com/reader/full/electric-motor-signature-analysis 101/119
Appendix CSWANTECH data
94
Stress Wave Energy: Motor Bearing Sensor
Page 102
7/27/2019 Electric Motor Signature Analysis
http://slidepdf.com/reader/full/electric-motor-signature-analysis 102/119
Appendix CSWANTECH data
95
Stress Wave Energy: Outer Case Sensor
Page 103
7/27/2019 Electric Motor Signature Analysis
http://slidepdf.com/reader/full/electric-motor-signature-analysis 103/119
Appendix CSWANTECH data
96
STRESS WAVE HISTOGRAM
The Histogram is an excellent tool for measuring the consistency of a machine. Of importancein the histogram is the shape of the distribution. A normal bell shaped curve with minimal“tailing” to the right on the x-axis is a sign of a well lubricated, consistent system. A broad- based distribution with excessive tailing to the right on the x-axis shows poor lubricationeffectiveness. Potential causes of a skewed Histogram could be particulate or fluidcontamination, skidding events, sliding contact or rubbing.
The Histogram from the ‘Normal Bearing’ from each sensor location (Page 5 & 6 - Top) offer excellent examples of how consistent, healthy operation manifests itself with this tool. The verynarrow-based gasussian (normal, bell shaped) distribution implies very little variance in the bearing performance and good lubrication effectiveness. Note too that the distribution is shifted
all the way to the left on the amplitude scale (mean voltage of 0.74 volts) showing that aminimal amount of excitation of the sensor is occurring.
In stark contrast to the Normal Bearing, the ‘Seeded Fault Bearing’ (Page 5 & 6 - Bottom)yields a histogram with classic signs of abnormal, aperiodic shock events; precisely what isexpected from contamination of lubrication that results when metallic particles have beenevacuated from the races. Notice the much broader distribution shifted to the right on theamplitude scale (mean voltage of 2.25 volts). This alone shows that the Seeded Fault Bearing ismuch more stressed than the Normal Bearing. The key indicator in this histogram however isthe excessive skewing (tailing to the right) Exceeding 6 Volts on the x-axis. This is classicevidence of particulate contamination as would be expected from a damaged bearing. It was
confirmed that particles from the induced bearing fault remained inside of the bearing.
In addition, during the Seeded Fault run, Stress Wave Energy can be seen taking a big upwardsstep from the Yellow Zone into the Red Zone on the Motor Bearing sensor location (see Page 4 – Top). This is strong evidence of a sizable particle breaking from the bearing and becomingground up in the bearing - another contributor to a skewed histogram.
Page 104
7/27/2019 Electric Motor Signature Analysis
http://slidepdf.com/reader/full/electric-motor-signature-analysis 104/119
Appendix CSWANTECH data
97
Histogram: Motor Sensor
Seeded Fault Bearing
Normal Bearing
Page 105
7/27/2019 Electric Motor Signature Analysis
http://slidepdf.com/reader/full/electric-motor-signature-analysis 105/119
Appendix CSWANTECH data
98
Histogram: Outer Case Sensor
Good Bearing
Seeded Fault Bearing 101: Motor Bottom
Page 106
7/27/2019 Electric Motor Signature Analysis
http://slidepdf.com/reader/full/electric-motor-signature-analysis 106/119
Appendix CSWANTECH data
99
STRESS WAVE SPECTRAL ANALYSIS
SWAN’s spectral analysis tool is ideal for isolating damage to dynamic components. Quitesimply, a flat spectrum verifies that no repetitive shock events typical of bearing or gear damage
are occurring. On the other hand, a spectrum with a significant spectral line or lines (a spike inthe vertical direction) at least 10 dB above background levels indicates a repetitive friction or shock event at that frequency. Readily available bearing and gear data assist in identifying themachine components that could potentially cause a shock event at a particular frequency
The difference between a healthy bearing and a damaged bearing are clearly shown with theStress Wave Spectral Analysis tool. The Spectral Analysis plots from both the Motor Bearingand Outer Case sensor locations (Pages 8 & 9) show clear differences from the Normal Bearingto the Seeded Fault Bearing. The Normal condition produces a very flat spectrum with a single peak at 106.2 Hz, the outer race defect frequency. A single peak as such indicates that there isin fact a minor disturbance in friction at the outer race of the bearing, perhaps light false
brinelling. Without harmonics, it is certainly not an impacting event or significant disturbance.
Contrast this to the Seeded Fault condition where numerous peaks at 106.2 Hz multiples(harmonics) are seen. In addition, an abundance of peaks at 11.6 Hz, the Fundamental TrainFrequency (cage) are present. This conclusively shows that a significant impacting event at106.2 Hz, the outer race, is occurring during the Seeded Fault condition. Since the induced faultwas damage to the outer race, this data confirms that the excessive increase in Stress WaveEnergy during the Seeded Fault run (see Page 4) was in fact the result of the induced outer racedamage.
Page 107
7/27/2019 Electric Motor Signature Analysis
http://slidepdf.com/reader/full/electric-motor-signature-analysis 107/119
Appendix CSWANTECH data
100
Stress Wave Spectrum: Motor Sensor
Seeded Fault Bearing
Normal Bearing
106 Hz
(1X)
106.2 Hz and Multiples (Outer Race Defect Frequencies)
11.6 Hz and Multiples (Cage Defect Frequencies)
Page 108
7/27/2019 Electric Motor Signature Analysis
http://slidepdf.com/reader/full/electric-motor-signature-analysis 108/119
Appendix CSWANTECH data
101
Stress Wave Spectrum: Outer Case Sensor
Normal Bearing
Seeded Fault Bearing
106.2 Hz and Multiples (Outer Race Defect Frequencies)
11.6 Hz and Multiples (Cage Defect Frequencies)
Page 109
7/27/2019 Electric Motor Signature Analysis
http://slidepdf.com/reader/full/electric-motor-signature-analysis 109/119
Appendix CSWANTECH data
102
CONCLUSIONS
The EPRI demonstration on the Axial Vane Fan shows that SWAN provides a degree of resolution into the operating condition of machinery previously unattainable with traditionaldiagnostic methods. The differences between healthy and damaged machinery components aredisplayed in a clear and unambiguous manner allowing even the most inexperienced analysts todifferentiate damaged from healthy operation – even in the early stages of a failure.
SWAN technology is second to none at not only detecting, but also trending the
progression of damage levels in machinery. The results on the Axial Vane Fan are a perfect
example of this. SWAN’s Stress Wave Energy measurement, a first line of defense measuring
the overall health of a machine, showed unmistakable evidence that Seeded Fault Condition
represented an undesirable operating condition that required immediate attention. The trends in
the high Yellow (and even Red) Health indicating color zones illustrate this in an unambiguous
manner. These values are 300-400% greater than the levels experienced during the Normal
Bearing runs.
Once the presence of damage is verified with the Stress Wave Energy readings, SWAN’sadditional tools are used to isolate the source of the damage. In the case of the Seeded FaultBearing, SWAN’s Histogram tool clearly shows excessive randomly occurring friction events.High Stress Wave Energy coupled with a broad based, skewed histogram confirms that the unitis operating with particulate contamination as a result of the induced fault.
SWAN’s Spectral Analysis tool also detected clear evidence of impacting at the outer race andcage of the bearing during the Seeded Fault run. The abundance of spectral lines from theSeeded Fault run at the outer race and cage frequencies confirms that the increases in StressWave Energy are a direct result of the induced bearing damage.
The SWAN System was specifically designed to support engineering and maintenance efforts by providing the information you need to do your job smarter and faster. The system is flexibleand has been proven in numerous aerospace, propulsion, industrial and turbine applications. Noother technology offers the simplicity of use and the superior level of fault detection accuracythat is provided by the SWAN System.
Page 110
7/27/2019 Electric Motor Signature Analysis
http://slidepdf.com/reader/full/electric-motor-signature-analysis 110/119
Appendix CSWANTECH data
103
COMPANY PROFILE
SWANTECH, LLC designs, manufactures, and markets advanced condition-monitoring products used to determine the health of operating machinery. Our patented Stress Wave
Analysis (SWAN™) technology provides early and quantifiable detection of defects andincorporates sophisticated diagnostic tools and artificial intelligence capabilities to provide true predictive maintenance. SWAN products make it possible to determine the existence of machine defects, identify which components are affected by the defect, and provides theopportunity to correct the problem prior to the occurrence of secondary damage or catastrophicmachine failure. As a maintenance tool, SWAN products can be used to improve machineryefficiency, reduce operating expenses, and protect the customer’s investment in their heavy
machinery.
SWANTECH’s corporate headquarters, including design engineering, manufacturing and testfacilities are located in Fort Lauderdale Florida, USA. A facility in Orlando, FL providesadditional design engineering services, test facilities and quick response manufacturingcapabilities for prototyping and system integration.
SWANTECH is the market expert in the development and application of Stress Wave Analysistechnology. This technology, along with SWAN diagnostic tools, provides the vital data neededto minimize downtime, optimize production and effectively allocate personnel resources.
SWANTECH’s exciting new technology has performed successfully in a wide variety of applications including:
Gas Turbine Engines for Electric Power GenerationCritical Airport Drive Motors for the FAAMarine Generators and Propulsion Equipment Aboard Navy and Commercial ShipsComplex Paper Mill MachineryGearbox Equipment in a Rolling MillRotating Components on Metro-Rail Cars for the Miami-Dade Mass Transit SystemF/A-18 Airframe Mounted GearboxC-130 Engine Gearbox
H-60 Helicopter GearboxAxial Fan Blower BearingsAutomotive TransmissionsSWAN was recently used to successfully detect and differentiate various types of ForeignObject Damage (FOD) in a seeded fault test at a major aircraft engine manufacturer.
Page 111
7/27/2019 Electric Motor Signature Analysis
http://slidepdf.com/reader/full/electric-motor-signature-analysis 111/119
Appendix CSWANTECH data
104
SWANTECH is dedicated to staying in the forefront of the design and development of advanced monitoring and predictive maintenance tools that increase machinery efficiency andreduce maintenance and product loss costs.
Once the presence of damage is verified with the Stress Wave Energy readings, SWAN’sadditional tools are used to isolate the source of the damage. In Carnival’s case, SWAN’sHistogram tool clearly shows excessive randomly occurring friction events from Air Conditioner Unit 4’s Motor, Non-Drive Bearing. High Stress Wave Energy coupled with a broad based, skewed histogram confirms this. The good bearings on the other hand have lowStress Wave Energy and normally distributed histograms. SWAN’s Spectral Analysis confirmsno localized surface damage to the bearings. The damage is in the form of uniform wear, whicheventually progresses to localized damage.
The true benefit of the SWAN system comes from comparative data taken over the course of time. The system becomes even more valuable as more data is collected and the Health
Indicating Color Zones are fine-tuned. With this repository of information, subtle changes become recognizable as abnormal conditions. These capabilities enable SWAN to provide theinformation needed to better understand the affects of manipulating test conditions in the testcell environment.
The SWAN System was specifically designed to support maintenance efforts by providing theinformation you need to do your job smarter and faster. The system is flexible and has been proven in numerous aerospace, propulsion, industrial and turbine applications. No other technology offers the simplicity of use and the superior level of fault detection accuracy that is provided by the SWAN System.
Page 112
7/27/2019 Electric Motor Signature Analysis
http://slidepdf.com/reader/full/electric-motor-signature-analysis 112/119
Appendix CSWANTECH data
105
What is Stress Wave Analysis (SWAN)?
Stress Wave Analysis (SWAN) technology represents over 25 years of research anddevelopment in the application of high frequency acoustic diagnostic techniques. SWAN
enables the separation of stress waves from the much lower frequency range of operatingmachinery vibration and audible noise. This innovative technology enables true predictivemaintenance for rotating and reciprocating machinery.
Reliable condition monitoring requires maintenance personnel to be able to identify machinedefects at early stages and be able to monitor the progression of the defect. At its earliest stages,a defect will not cause any significant loss in machine operating efficiency. Through continuedoperation, the defect will increase and become a potential source of secondary damage.
As machine parts come in contact with the defect, even at the earliest stages, shock and frictionevents generate ultrasound or Stress Wave Energy (SWE).
Stress Wave Analysis (SWAN) detects and measures this energy and damage levels well belowthe levels required to excite vibration sensors, and before sufficient damage has occurred toactivate metal chip detectors in lubrication systems.
A sensor firmly mounted on the structure detects stress waves, transmitted through themachine’s structure. A piezoelectric crystal in the sensor converts the stress wave energy into anelectrical signal which is then amplified and filtered by a high frequency band pass filter in theanalog signal conditioner to remove unwanted low frequency sound and vibration energy.
The output of the signal conditioner is a Stress Wave Pulse Train (SWPT) that represents a timehistory of individual shock and friction events in the machine. The digital processor thenanalyzes the SWPT to determine the peak level of the SWE and the total energy content
Page 113
7/27/2019 Electric Motor Signature Analysis
http://slidepdf.com/reader/full/electric-motor-signature-analysis 113/119
Appendix CSWANTECH data
106
generated by the shock event. The computed SWE is displayed on the system's control panel or monitor and can be recorded with other SWE readings.
SWAN measures even slight shock and friction events that occur between contact surfaces. The
level and pattern of anomalous shock events becomes a diagnostic tool.
THE FAILURE PROCESS
Regardless of when failures occur during a machine’s life cycle, they start as smalldiscrepancies and progress to larger ones that result in secondary damage, unacceptableoperating conditions, or catastrophic failure. Traditional diagnostic techniques do not provide aclear indication of problems until late in the failure process. SWAN Stress Wave Energy (SWE)measurements provide a QUANTITATIVE measure of internally generated shock and frictionenergy during the entire life cycle of a machine. SWE is trendable throughout the failure
process from its earliest stages to an unacceptable operating condition. The trend of SWEmeasurements from normal levels through caution and danger zones provides the informationnecessary for advance scheduling of corrective action, and true predictive maintenance.
Failure rate is a function of operating time, as shown in the classical bathtub curve. The probability of failure is larger during initial hours of machine operation, but quickly decreasesto a constant rate. Improper assembly, installation error, improper run-in, and rough shippingand handling conditions all contribute to this period of infant mortality (stage 1). Abnormallevels of SWE associated with infant mortality failure modes can be detected and correctiveaction taken during the acceptance testing. By monitoring the equipment early in its life cycle,unforeseen failures can be avoided and normal baseline levels set for monitoring the machine's
condition during the remainder of its useful life.
The second and third stages of a machine's life cycle are periods characterized by a constant, butrelatively low, probability of failure. For many critical pieces of rotating machinery, the time atwhich the probability of wear out failure begins is not known. This is because operating time or cycle limits are established for overhaul of the equipment prior to wear out. These overhaullimits are set conservatively in an effort to prevent increasing rates of unforeseen criticalequipment failure. The quantitative nature and predictive accuracy of SWE, as a measure of
Page 114
7/27/2019 Electric Motor Signature Analysis
http://slidepdf.com/reader/full/electric-motor-signature-analysis 114/119
Appendix CSWANTECH data
107
machine condition, allows the Time Between Overhauls (TBO) to be safely extended to thetime when wear out begins (stage 4). The benefits of this service life extension are not onlyeconomic, but operational as well. These operational benefits include both reduced downtimefor equipment replacement/overhaul and reduced overall failure rates (by deferring the
reoccurrence of infant mortality failures in newly installed/overhauled machines).
The time at which a machine enters the wear out phase of its life cycle is a function of itsinherent design reliability and its operation history. Thus different individual machines in a population of identical machines may begin to wear out at different times. The predictive
maintenance capability provided by SWAN allows every machine to be operated for as long asits failure rate can be maintained at acceptable levels through preventative maintenance andminor repairs. When it becomes necessary to operate a machine into the final stage of its lifecycle, SWAN is essential to provide advance notice of impending failure.
The SWAN system provides early problem detection and enables maintenance professionals totrack the progression of damage through acceptable levels of wear. The trending data provided by SWAN could be used to determine the probability of failure and even to determine themachine parts that are affected by the damage. This information is vital in the scheduling of pro-active maintenance and implementation of corrective action with minimal impact tomachinery operation.
SWAN Product Engineering is focused on standards-based solutions and packaging to ensureinteroperability with other vendor systems. SWAN’s System Architecture & Platforms areeasily expandable to monitor multiple locations and allow integration with other diagnosticsystems.
Page 115
7/27/2019 Electric Motor Signature Analysis
http://slidepdf.com/reader/full/electric-motor-signature-analysis 115/119
108
APPENDIX D
Transducers &Meter and Test Equipment
Page 116
7/27/2019 Electric Motor Signature Analysis
http://slidepdf.com/reader/full/electric-motor-signature-analysis 116/119
Appendix DTransducers &
Meter and Test Equipment
109
The following table lists the manufacture, serial number, calibration, and engineering units usedfor this research.
ManufactureSerial
Number
Calibration
DueUnits Location Comments
PCB TU-6103 09/12/02 100 mV/g Cowling Inboard X Tri-axial
PCB TU-6104 09/12/02 100 mV/g Cowling Outboard Y Tri-axial
PCB TU-6105 09/12/02 100 mV/g Motor Inboard X Tri-axial
PCB TU-6106 09/12/02 100 mV/g Motor Inboard Y Tri-axial
PCB TU-6107 09/12/02 100 mV/g Motor Inboard Y Tri-axial
PCB TU-6108 09/12/02 100 mV/g Motor Inboard Y Tri-axial
PCB TU-1440 06/20/02 Voltage All Channels PCB 12
ChannelPower Supply
Bently Nevada TU-1380 06/22/02 VibrationUnits
All Channels 8 ChannelData
AcquisitionInstrument
Entek IRD TU-1704 12/03/02 RPM Fan Shaft Laser Tachometer
All calibrations are done at TXU Electric, CPSES Metrology Lab and the calibrations are traced
to National Standards:
ANSI / NCSL Z-540-1-1994, American National Standards for Calibration
IEEE Standard 498-1985, Requirements for calibration and control of measurement and testequipment
ISO/IEC 17025, General requirements for the competence of testing and calibration laboratories
Page 117
7/27/2019 Electric Motor Signature Analysis
http://slidepdf.com/reader/full/electric-motor-signature-analysis 117/119
110
REFERENCES
Baxter, N. 2001, Interview by author, 13 November 2001. Notes. Glen Rose, Texas:Autor.
Bechard, P. 2001, E MAX Demodulation, Motor Reliability Technical Conference, May2001.
Berry J. E. 1993, Predictive Maintenance and Vibration Signature Analysis I . Columbus,Ohio, IRD Mechanalysis, Inc.
Berry J. E. 1994, Predictive Maintenance and Vibration Signature Analysis II . Columbus,
Ohio, IRD Mechanalysis, Inc.
Bethel, N.P. 2001, The Developing role of Current Analysis in Predictive Maintenance,
P/PM Technology, August 2001 P/PM Technology.
Brown, C.T. 2001, Interview by author, 12 November 2001. Notes. Glen Rose, Texas:Autor.
Casada D.A. 1998, Using Motor Data to Improve System Reliability and Reduce
Operating Costs, Oakridge National Laboratories: lecture series
Casada D.A. 1999, Using an electric motor as a Transducer to: monitor centrifugal pump(and other ancillary equipment) conditions, Oakridge National Laboratories: lectureseries
Casada,D.A. 2001, Interview by author, 9 November. Notes. Glen Rose, Texas: Author.
Diamond, S.J. 1989, Practical Experiment Designs (for Engineering and Scientists), NewYork, Van Norstrand Reinhold
EPRI, 1991 Power Plant Electrical Reference Volume 6 , EPRI, December 1991: 6-7 – 6-11. Palo Alto, Ca: Research Reports Center
Frarey, J. L. 1995, Machinery Vibration Analysis III Course, Vibration Institute, 1995
Gastonal, B. 2001, Interview by author, 12 November 2001. Notes. Glen Rose, Texas:Author.
General Installation, Operation and Maintenance Instructions for Aerovent Products,Aerovent, IM-100, September 1996.
Page 118
7/27/2019 Electric Motor Signature Analysis
http://slidepdf.com/reader/full/electric-motor-signature-analysis 118/119
111
Gökmem Burak, Eldem Vasfi, Duyar Ahmet, 2001, MCM : A New Technology in Predictive Maintenance, Paper from conference at Oak Ridge National Laborites ,2001.
Harris C. M. 1988, Shock and Vibration Handbook : ed. Harold B. Crawford and David E.Fogarty: R.R. Donnelley & Sons Company, McGraw Hill USA.
Hinton P.R. 1999, Statistics Explained : New York, NY Routledge
Mitchell J. S. 1993, Machinery Analysis and Monitoring : pg – pg. Tulsa, Oklahoma:PennWell Books.
Riley, C.M., Lin, B.K., Haberler, T.G., Schoen, R.R., 1997, A Method for Sensorless On-
Line Vibration Monitoring of Induction Machines, IEEE Paper
Rosen J. 2001, Wireless Sensor Array Project @ Exelon Limeric Generating station,EPRI.
SKF 1995, Bearing Handbook, San Diego, CA. SKF press
Sternstein, Martin, 1996, Statistics, Hauppauge, NY. Barron’s.
Taylor, J.I. 1994, The Vibration Analysis Handbook. Tampa, FL: Vibration Consultants
Wiedenbrug, E. J. 1999, Measurement Analysis and Efficiency Estimation of Three Phase
Induction Machines Using Instantaneous Electrical Quantities. Rochester, NY:Applied Image Inc.
Wiedenbrug, E.J. 2001, Instantaneous Torque as Predictive maintenance Tool for
Variable Frequency Drives and Line Operated Motors, Paper by Baker Instrumentation Company
Wiedenburg, E.J., Wallace, A. Motor Efficiency Determination: From Testing
Laboratory to Plant Installation, IEEE Paper
Wiedenburg, E.J., Wallace, A. Induction Machine Speed Extraction by Analysis of Stator
Current Signatures’ , IEEE Paper
Wiedenburg, E.J., Wallace, A., von Jouanne, A., 1997, Using the New EPRI/BPA Testing
Facility to Evaluate the Latest Technologies in Motors and Drivers, IEEE Paper
Wiedenburg, E.J., Wallace, A., Von Jouanne, A., Douglass, J., 1997, A Laboratory
Assessment of In-Service Motor Efficiency Testing Methods, IEEE Paper
Page 119
7/27/2019 Electric Motor Signature Analysis
http://slidepdf.com/reader/full/electric-motor-signature-analysis 119/119
Wiedenburg, E.J., Wallace, A., Von Jouanne, A., Andrews, P.S., 1997, The Measured
Effects of Under-Voltage, Over-Voltage and Unbalanced Voltage on the Efficiencyand Power Factor of Induction Motors over Wind Ranges of Load , IEEE Paper
Wiedenburg, E.J., Ramme A., Matheson E., von Jouanne, A., Wallace, A. 2001. Modernon-line testing of Induction Motors for Predictive Maintenance and Monitoring,
Paper by Baker Instrumentation Company and Oregon State University.
Wowk, Victor, 1991, Machinery Vibration Measurement and Analysis. Mexico,McGraw-Hill, Inc.