Electrical Impedance of a Pore Wall for the Flooded- Agglomerate Model of Porous Gas-Diffusion Electrodes
T. E. Springer and I. D. Raistrick*
Los Alamos National Laboratory, Los Alamos, New Mexico 87545
ABSTRACT
The dc and small-signal ac impedances of a flooded-agglomerate element of a porous gas-diffusion electrode have been calculated. The complete solution involves a nonlinear concentration profile within the agglomerate and requires nu- merical integration. An approximate solution has been developed leading to a simple equivalent circuit that is valid for most practical situations. The complete agglomerate model was combined with a thin-film diffusion element and the total impedance was calculated. Transfer functions were developed that also allow the simplified agglomerate representation to be combined with the thin-film element, greatly facilitating numerical fitting of the model to measured impedance data.
Mathematical models of porous electrodes have usually been restricted to steady-state situations. In principle, however, considerably more information is available from a study of the dynamic responses of such systems. Charge storage processes impart a time dependence to the re- sponse that can be resolved in a dynamic experiment. It is thus possible to separate the different contributions to the Overall electrode impedance into ohmic, diffusional, and kinetic terms. In addition, information is obtained about the storage mechaniSms themselves (such as double-layer charging and spatial variations in the concentrations of re- actant and product species) that may be valuable in under- standing or optimizing porous electrode design.
Electrochemical systems are nonlinear and there is, therefore, a significant simplification in addressing only the small-signal impedance behavior. In this paper we have restricted our analysis to the frequency domain im- pedance situation, but of course there is no reason for smaU-signal t ime domain results not to be transformed and compared with the transfer functions derived here. The overall objective of this work is to derive impedance functions, based on models of the electrode structure, that can be compared with small-signal ac measurements on real fuel cell electrodes, preferably using complex least squares fitting procedures (1-3).
In general, porous electrodes behave as distributed net- works (4). Different parts of the electrode are accessed by the current through paths of differing resistances. A sim- ple example of a one-dimensional distributed circuit is shown in Fig. la. This circuit represents a set of identical pores with uniform electrolyte resistance per unit depth, r (fl-cm), and uniform double-layer capacitance per unit depth into the electrode structure, cd (F/cm3). The faradaic impedance, zr (t2-cm3), may include charge transfer and mass transport components. Because zf is voltage depend- ent, the current distribution in the pore varies with dc po- tential. In addition, since Cd and z~ contain charge storage components, the distribution also depends on frequency. This dependence of current distribution on voltage and frequency must be taken into account in computing the overall impedance of the electrode (3).
In this paper, however, we concentrate on deriving the form of the faradaic impedance zf for a differential element of the wall of a single pore. The response of a complete pore, and hence of the collection of identical pores pre- sumed to make up the electrode, would then be calculated by integration of zf-' over the length of the pore, taking into account the distributed resistance and double-layer capacitance. This aspect of the model and its relation to impedance experiments will be discussed in a separate paper.
Therefore, the results of the present contribution will ac- curately represent the response of the whole electrode only if distributed effects are negligible. This is the case when current penetration of the electrode is complete, and the distributed circuit of Fig. la can be replaced by its
* Electrochemical Society Active Member.
1594
lumped equivalent, Fig. lb. Here, R, Cd, and Zf represent the sums of all the contributions of r, cd, and zf. In this case the local potential is the same everywhere and the elec- trode behaves as a large surface area, flat-plate electrode. This situation will tend to prevail at low current densities when the potential drop along the pore caused by the elec- trolyte resistance is small. Note that in these models we have neglected any contribution from the electronic resist- ance of the electrode.
We have previously developed a dynamic model for a thin-film description of a gas-diffusion electrode (3). Al- though the model described Well the ac behavior of the electrode under certain circumstances, it was apparent that the potential dependence of the various components of the impedance was inadequately accounted for. It was clear from the data that thin-film diffusion-limited behav- ior was present at high current densities, but, in addition, other contributions to the overall impedance were impor- tant at intermediate overpotentials. The physical model has therefore been extended to include the flooded- agglomerate approach of Giner and Hunter (5), in combi- nation with a thin-film diffusion process. The electrode structure, which is shown schematically in Fig. 2, is con- sidered to be a dual-scale macro-microporous intercon- nected region with the hydrophobic regions allowing reac- tant gas access to the surface of all agglomerate regions. The agglomerate consists of interconnected regions of cat- alyst containing carbon and electrolyte. Reactant gas, such as oxygen, can dissolve in the electrolyte and diffuse to the catalyst sites. The agglomerate region is separated from the hydrophobic gas channels by a thin film of electrolyte.
r
(a)
R
C d
(b)
Fig. 1. (a) One-dimensional circuit analog of a uniform pore with dis- tributed electrolyte resistance, double-layer capacitance, and faradaic resistance, (b) Lumped circuit equivalent for the case of complete cur- rent penetration.
J. Electrochem. Soc., Vol. 136, No. 6, June 1989 �9 The Electrochemical Society, Inc.
J. Electrochem. Soc., Vol. 136, No. 6, June 1989 �9 The Electrochemical Society, Inc. 1595
/
ELECTRODE MODEL ,',~; ;~" CATALYST
- 6 0 Y Ly
Fig. 2. Schematic drawing of electrode structure with macroporous gas region, thin-film and microporous agglomerate region, and insert of expected reactant concentration profile.
The concen t ra t ion profiles of the gas in the th in film and agg lomera te regions are qual i ta t ively shown in t h e figure. The concen t ra t ion profile in the agglomera te is nonl inear because the rate of e lec t rochemica l react ion at any poin t is d e p e n d e n t ( through a kinet ic express ion) on the local reac- tant concentra t ion.
The original mode l of Giner and Hunte r has been fur ther deve loped by Cutl ip and Iczkowski (6-7) and by B jS rnbom (8) who inc luded thin-fi lm and l u m p e d res is tance effects in s teady-state models . The p resen t paper ex tends the thin- f i lm/agglomerate m o d e l f rom steady-state into the fre- q u e n c y doma in and provides a s implif ied ac ne twork rep- resenta t ion of dynamic agglomera te diffusion.
A ra ther small a m o u n t of work has prev ious ly been car- r ied out on the t rans ient or ac behav ior of porous gas diffu- s ion electrodes, s ignif icant ly more a t tent ion hav ing been g iven to f looded e lec t rode s t ructures (9-14). Wabner e t a L (15) and Holze and Viels t ich (16) cons idered the i m p e d a n c e associa ted wi th oxygen reduc t ion at Tef lon-bonded elec- t rodes in t e rms of charge t ransfer and diffusion processes . They did no t take into account e i ther the agglomera te situ- a t ion or the d is t r ibuted na ture of the processes.
Model Description In Fig. 2, diffusion of reactant gas into a differential ele-
m e n t of the agglomera te takes place in the Y direct ion. Cur ren t flow, both in the e lec t ro lyte th in film and in the e lec t ronica l ly conduc t ing agglomerate , is in the X direc- t ion and is or thogonal to the diffusion direct ion. We have se lec ted a Cartesian geome t ry in which to formula te the model . On one side of the th in-f i lm/agglomerate region, the reac tant gas is a s sumed to have a un i fo rm concen t ra t ion C*. This is the equ i l ib r ium concen t ra t ion in e lec t ro lyte so- lu t ion at the interface. A thin-fi lm e lec t rolyte thickness , 6, r epresen t s that por t ion of the d issolved gas pa th f rom the bulk-gas region to the catalyst site having a diffusion coef- ficient, Dr, in wh ich no catalyst is present . The agglomera te reg ion is p ic tu red physical ly as a finely d iv ided intercon- nec ted ne twork of electrolyte-fi l led carbon wi th inter- spersed catalyst, and mathemat ica l ly as a un i fo rm region wi th a diffusion coefficient, D~, and a local s ink of dis- so lved reactant gas genera t ing an electron current per uni t v o l u m e of this catalytically~active, mic roporous region. We have def ined an effect ive rate constant , k ~ for the e lec t ron exchange . I f on the surface of the catalyst part icles (e .g . , Pt) the local rate cons tan t is k', then the current per uni t area on the catalyst surface is g iven by a Tafel re la t ion
i = n F k , C ( Y ) e x p [ a n F ~ ] = n F k , C e ~ L R T J
Ill
We have in t roduced I~ as a r educed overpotent ia l , and we are a s suming the potent ia l is sufficiently far r e m o v e d f rom
the revers ib le potent ia l to neglec t the reverse current . This is a just i f iable a s sumpt ion for the oxygen e lec t rode reac- tion, where open-ci rcui t potent ia ls are always signif icantly lower than the t h e r m o d y n a m i c revers ib le potential , and where cur ren t genera t ion in a l inear k inet ic reg ion is negli- gible. In this equa t ion the s ign of the overpotent ia l is t aken as posit ive. I f we cons ider a flat plate catalyst surface with the same diffusion surface area and current dens i ty as the agglomerate , then an effect ive rate cons tan t k ~ may be de- f ined in t e rms of the t rue rate cons tant k' as
k ~ = k ' A v L y [2]
where Av is the catalyst surface area per uni t v o l u m e of ag- g lomera te and Ly is the effect ive agglomera te thickness . The current per uni t v o l u m e is
k o iv = n F k ' A v C e ~ = n F - C e ~ [3]
L r
Elect ro ly te res is tance may be ignored in the Y dimen- sion, thus a l lowing the local overpotent ia l , ~, to be con- stant. That this observa t ion is t rue across the agglomera te th ickness Ly m a y be demons t ra t ed by not ing that the fol- lowing re la t ion holds b e t w e e n cur ren t pe r uni t vo lume, potential , and concent ra t ion
1 02~ O2C iv - - n F D ~ - [4]
p 0i n Oy ~
This equa t ion leads us to the conc lus ion that the potent ia l drop is propor t ional to the concent ra t ion drop across the agg lomera te
~1o - ~IL = n F p D a [C* - C (Ly)] [5]
A s s u m i n g that Da = 2 - 10 ~ cm2/s, C* = 10 .6 mol / cm 3, and ionic resis t ivi ty p = 1 l~-cm, then the potent ia l drop is only the order of a few microvol t s w h e n C(Ly) = 0. More impor- tant, this equa t ion is a quant i ta t ive demons t r a t ion of the need for a hydrophobic , macroporous ne twork to distr ib- u te gas t h roughou t the e lec t rode and of the fact that, on the average, the e lec t ro lyte current f low in the e lec t rode m u s t be or thogonal to the reactant gas diffusion. Thus, in general , the overpotent ia l only varies a long the X direc- tion, the major axis of the pores~ and this var ia t ion is a re- sul t of the res is tance of the thin e lec t ro lyte film. This effect will be inc luded in a complete , d i s t r ibu ted mode l of t he e lectrode, as d iscussed in the in t roduct ion.
In t e rms of the d imens ion less concentra t ions , c(y) , de- fined as C / C * and the d imens ionless overpotent ia l , ~ = ~ /b , the different ial equat ions descr ib ing the diffusion are as follows.
In the film region
{~C ~2C for - a <- Y -< 0: - - - + D r - - = 0 [6]
ot oY a
In the agglomera te region
Oc ~2c k ~ for 0 -<Y-<Ly: - - - + D a - ce ~ [7]
0t 0Y 2 Ly
where the r ight-hand t e rm is the reactant gas convers ion per uni t v o l u m e (Eq. [3]). The boundary condi t ions are
c(-6) = 1; c(-0) = c(+0) = co [8]
Oc Oc Oc D f - ~ ( -0) = D a - ~ (+0); ~ (Ly) = 0 [9]
To deve lop the t ime dependence , we will a l low the con- cent ra t ion ratio to be pe r tu rbed about its s teady-state dis- t r ibut ion c o and will define ~ as the Laplace t ransform of the pe r tu rbed ratio.
1596 d. Electrochem. Soc., Vol. 136, No. 6, June 1989 �9 The Electrochemical Society, Inc.
The DC Solution The steady-state solut ion of Eq. [6] for the concent ra t ion
in the film region is
Y c~ = (co ~ - 1) ~ + co ~ [1O]
The genera l form of the solut ion of Eq. [7] in the ag- g lomera te region is
~ - - ~ ~ _ , / k~ ~ c ~ = A exp Y + B exp Y
LyD~ ~ ' L ~ a
= A e x p q b e ~ y + B e x p - ~ P e ~ y [11]
The effect ive exchange cur ren t dens i ty may be def ined re la t ive to the diffusion or pore surface area as
io = n F k ~ * [14]
I f a comple te e lec t rode mode l were be ing descr ibed, this e x c h a n g e current dens i ty would have to be mul t ip l ied by % the roughness factor, or ratio of diffusion surface area to e lec t rode surface area to obtain the exchange current den- sity for an equ iva len t flat-plate electrode. We shall define a r educed current dens i ty pass ing f rom the agglomera te into the e lect rolyte as the actual current dens i ty i d iv ided by the e x c h a n g e cur ren t dens i ty
J = - - = e ~ c d = e ~ c ( y ) d y [15] io
Here we are us ing the fract ional distance, y for Y/Ly and for the overpotent ia l ratio ~/b. The po ten t i a l - independen t agglomera te-d i f fus ion paramete r ap, and the correspond- ing dc f i lm-diffusion pa ramete r F, are def ined as
x/k~ 8k ~ qb= ~ Da a n d F - D, [12]
The three u n k n o w n quanti t ies , A, B, and co ~ in Eq. [11], wh ich are funct ions of t~, may be de te rmined f rom the bounda ry condi t ions of Eq. [8] and [9]. The local dc concen- t ra t ion ratio profile in the agglomera te region becomes
cosh ape~ (y - 1)
F r o m Eq. [13] and [15]
tanh ape2 e~--
qSe~ J =
t anh qSe~ [16] 1 + Fe ~
dPe 2
The t e rm (tanh r may be recognized as a catalyst e f fec t iveness factor (6). The quan t i ty ape ~/2 is analogous to the Thie le modulus . When q5 approaches zero, this t e rm ap- proaches unity, and the current dens i ty is that for thin-fi lm dif fusion on a flat e lec t rode
cosh qbe~ c ~ (y) - [13] J - [17]
t anh r 1 + Fe ~ 1 + F e ~ - -
q~e~ which reduces to j = e ~ for the reduced current dens i ty
F igure 3 shows this concent ra t ion ratio th rough the ag- g lomera te region for two values of ep that inc lude some thin-f i lm cont r ibut ion and also the larger ap va lue wi th no thin-f i lm contr ibut ion. The concent ra t ion profile for each of these three geomet r ies is shown for three di f ferent over- potent ia l ratios. With no thin film (the solid curves) the concen t ra t ion penet ra tes the full agg lomera te region at low potent ia l and drops rapidly at h igher potentials . When the th in film is in t roduced, the outer concen t ra t ion (at y = 0) drops, but drops less for the larger va lue of ap be- cause the total current flow th rough the thin film is lower than for the smal ler va lue of qb. At larger pene t ra t ion into the agglomerate , the reverse is true.
Fig. 3. Steady-state concentration profile in agglomerate region for three values of reduced overpotentiol and three sets of thin-film and agglomerate parameters.
f rom a flat catalyst surface wi th no mass- t ranspor t l imita- t ions. F igure 4 plots the r educed overpoten t ia l as a func- t ion of in j for four values of a), each wi thou t and wi th thin- film diffusion. In the former case, w h e n F is zero (solid curves), the slope of the curve is un i ty at low current densi- t ies and doubles at h igher current densit ies. The t ransi t ion occurs w h e n ape ~j2 is the order of unity. In the lat ter case (dashed curve), we see current l imi t ing behav ior for low values of ~. As the agglomera te pa ramete r increases, thus r educ ing the cur ren t for a g iven overpotent ia l , the effect of the th in film on current is lessened.
The AC Diffusion Case For the t ime-dependen t solution, the double- layer ca-
paci tance, a l though physical ly d is t r ibuted th roughou t the agglomerate , can be separa ted mathemat ica l ly f rom the
r ." i -0oOO.oool "
U.I 0.00 o 0.01 t,
0 S- 0.03 0.10 o
4 -
3 -
2 I I I I I I I I 2 9 4 5 6 7 9 10 11 12
log, j
Fig. 4. Reduced overpotentiol vs . reduced current density, with and without thin-film diffusion, for four agglomerate parameter values.
J. Electrochem. Soc., Vol. 136, No. 6, June 1989 �9 The Electrochemical Society, Inc. 1597
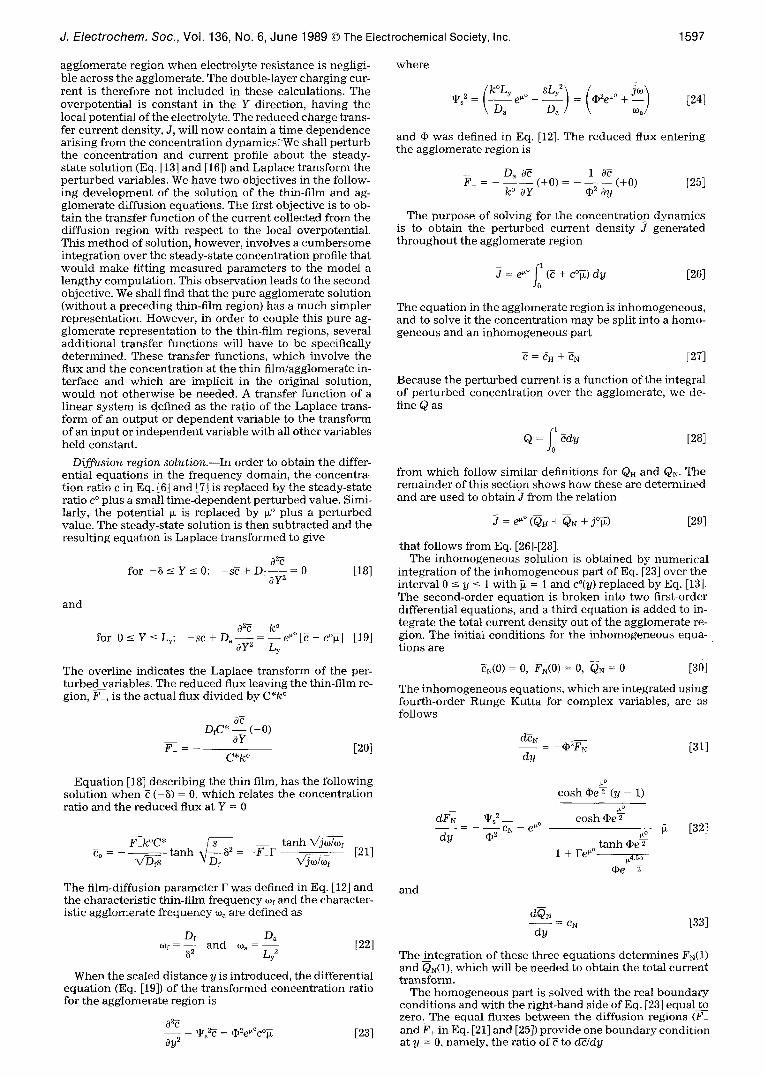
agglomerate region when electrolyte resistance is negligi- ble across the agglomerate. The double-layer charging cur- rent is therefore not included in these calculations. The overpotential is constant in the Y direction, having the local potential of the electrolyte. The reduced charge trans- fer current density, J, will now contain a time dependence arising from the concentration dynamics?We shall perturb the concentration and current profile about the steady- state solution (Eq. [13] and [16]) and Laplace transform the perturbed variables. We have two objectives in the follow- ing development of the solution of the thin-film and ag- glomerate diffusion equations. The first objective is to ob- tain the transfer function of the current collected from the diffusion region with respect to the local overpotential. This method of solution, however, involves a cumbersome integration over the steady-state concentration profile that would make fitting measured parameters to the model a lengthy computation. This observation leads to the second objective. We shall find that the pure agglomerate solution (without a preceding thin-film region) has a much simpler representation. However, in order to couple this pure ag- glomerate representation to the thin-film regions, several additional transfer functions will have to be specifically determined. These transfer functions, which involve the flux and the concentration at the thin-film/agglomerate in- terface and which are implicit in the original solution, would not otherwise be needed. A transfer function of a linear system is defined as the ratio of the Laplace trans- form of an output or dependent variable to the transform of an input or independent variable with all other variables held constant.
D i f f u s i o n reg ion s o l u t i o n . - - I n order to obtain the differ- ential equations in the frequency domain, the concentra- t ion ratio c in Eq. [6] and [7] is replaced by the steady-state ratio c ~ plus a small t ime-dependent perturbed value. Simi- larly, the potential ~ is replaced by ~o plus a perturbed value. The steady-state solution is then subtracted and the resulting equation is Laplace transformed to give
a2e for -~ -<Y-<0 : - s ~ + D f - - _ . = 0 [18] ay ~
and
a2~ k o - - = - - e " ~ 1 7 6 [19] for 0 -< Y <- Ly: --SC + D~ OY 2 Ly
The overline indicates the Laplace transform of the per- turbed variables. The reduced flux leaving the thin-film re- gion, F_, is the actual flux divided by C*k ~
a~ D~:7* ~ (-0)
F_ = [20] C*k o
where
~s2=(k~176176 Da Da ] [24]
and d# was defined in Eq. [12]. The reduced flux entering the agglomerate region is
Da be 1 3~ F+ (+0) - (+0) [25]
k ~ OY qb 2 ay
The purpose of solving for the concentration dynamics is to obtain the perturbed current density J generated throughout the agglomerate region
= e ~~ f l (c ~- c~ dy [26] J0
The equation in the agglomerate region is inhomogeneous, and to solve it the concentration may be split into a homo- geneous and an inhomogeneous part
c = cH + cN [27]
Because the perturbed current is a function of the integral of perturbed concentration over the agglomerate, we de- fine Q as
f0 1
Q = ~dy [28]
from which follow similar definitions for QH and QN. The remainder of this section shows how these are determined and are used to obtain J from the relation
J = e ~~ (QH + QN + jo~) [29]
that follows from Eq. [26]-[28]. The inhomogeneous solution is obtained by numerical
integration of the inhomogeneous part of Eq. [23] over the interval 0 -< y -< 1 with ~ = 1 and c~ replaced by Eq. [13]. The second-order equation is broken into two first-order differential equations, and a third equation is added to in- tegrate the total current density out of the agglomerate re- gion. The initial conditions for the inhomogeneous equa- tions are
~N(0) = 0, F~(0) = 0, QN = 0 [30]
The inhomogeneous equations, which are integrated using fourth-order Runge Kutta for complex variables, are as follows
den - - = --qb2FN [31] dy
Equation [18] describing the thin film, has the following solution when ~ (-8) = 0, which relates the concentration ratio and the reduced flux at Y = 0
Co - F-k~ ~ f tanh 82 = -F~_F t a n h ~ [21]
The film-diffusion parameter F was defined in Eq. [12] and the characteristic thin-film frequency of and the character- istic agglomerate frequency c% are defined as
Df Da o f = - - and o~,- [22]
8 2 Ly ~
When the scaled distance y is introduced, the differential equation (Eq. [19]) of the transformed concentration ratio for the agglomerate region is
- - - ~Y~2-d = dp2e~~176 [23] Oy 2
and
~o cosh cPe T (y - 1)
dFN Ts 2 __ cosh qbe~- - CN -- e ~~ ~ [32]
d y �9 2 ~~ tanh dpe~
1 + Fe ~~ ft4-50 dpe ~-
dQN - ~N [33]
dy
The integration of these three equations determines FN(1) and QN(1), which will be needed to obtain the total current transform.
The homogeneous part is solved with the real boundary conditions and with the right-hand side of Eq. [23] equal to zero. The equal fluxes between the diffusion regions (F_ and F+ in Eq. [21] and [25]) provide one boundary condition at y = 0, namely, the ratio of~ to d~/dy
1598 J. Electrochem. Soc., Vol. 136, No. 6, June 1989 �9 The Electrochemical Society, Inc.
Co F t a n h X/j~o/(oe O~ �9 2
- - ( + 0 ) Oy
The s e c o n d b o u n d a r y c o n d i t i o n is
[34]
dcH d ~ d ~ (1) = - ~ - (1) = ~ (1) [35]
b e c a u s e t he to ta l f lux is zero there . T he h o m o g e n e o u s solu- t ion is
CH(y) = AH e%y + B ~ e -+~y [36]
T h e u n k n o w n coeff ic ients An a n d BH m a y be d e t e r m i n e d f rom the b o u n d a r y re la t ions
AH + BH
~,(AH -- BH) - Ro ; ~ ( A n e *~ - BHe-*+) = @eFN(1) [37]
ap~ _ _ s inh ~ y + R o ~ c a s h ~ , y
CH(y) = ~ss FN(I) c a s h ~ + R o ~ s inh ~I.'+ [38]
I n a fo l lowing sect ion, we wil l n e e d t h e r e d u c e d f lux a t y = +0 in t e r m s of t he r e d u c e d c o n c e n t r a t i o n Co. I t fol lows t h a t
•[•s F§ = ~ - - t a n h 'T+ [39]
To u se Eq. [29] to o b t a i n the t r a n s f o r m e d c u r r e n t dens i ty , we n o w m u s t i n t eg ra t e t he h o m o g e n e o u s c o n c e n t r a t i o n to o b t a i n
QH = ~ d y = - - 1 ~ 2 c a s h ~+ + R o ~ s inh ~ [40]
a n d all t h e t e r m s for J in Eq. [29] are k n o w n . F i g u r e 5 s h o w s t he m a g n i t u d e a n d p h a s e of t h e Concen-
t r a t i o n profi le for four d i f fe ren t va lues of f r equency . Be- cause no th in- f i lm reg ion was u sed here , the p e r t u r b e d c o n c e n t r a t i o n is zero at t he gas interface. Fo r all f r equen- cies, t he s lope is zero at t h e e n d of t he agg lomera te . A t low f r equency , t h e p h a s e sh i f t is 180 ~ e v e r y w h e r e b e c a u s e t he c o n c e n t r a t i o n d r o p s if t he po ten t i a l rises. T he m a g n i t u d e d r o p s at h i g h f r equenc ies , even tua l ly r e a c h i n g zero.
I f t he c o m p l e x c u r r e n t dens i ty J(r is c o m p u t e d u s i n g a va lue of 1 for ~, t he r e su l t i ng t r ans f e r f u n c t i o n is t he admi t - t a n c e of the pore wal l due to t h e a g g l o m e r a t e pe r f rac t iona l
0.30 uJ t~ 0.25-
-P o.2o- Z <( o.15
o.1(
~ o , o 5 -
o.oo 18o
15o
LU 120 - (/) <
90- n , ~ 60- i o
3 0 -
I i I i + J I i I
I I I I I I I I I
~ = 0.2 - D ~ - 2 .
o ~ 5 o
= 20. ~e ~/2 = 2.
0.1 o.2 0.3 0.4 0.5 0.6 0.7 o.8 o.g
Y
Fig. 5. Magnitude and phase of concentration profiles for four fre- quencies with pure agglomerate diffusion.
I I I I I I f I ]
LOCAL FARADAIC IMPEDANCE TIMES Ioe'/b
Z re" = o
T I- +e~"=2/TM ,o-'~
i ~"i, + i[ �9 i m "ll .+ i i i 0 I I - - r - "W - t I - I I I I
1 2 3 4 5 6 7 8 g 10
REAL
Fig. 6. Example of local faradaic impedance at the pore wall with pure agglomerate reaction/diffusion. Squares indicate individual fre- quency points of the full calculation, triangles of the simple calcula- tion. Reduced frequency ~o/r176 increases from right to left with five marked points per decade on the ripe +~ = 5 curve. Fewer points per decade are marked on the other 3 curves. Some values of r are shown.
l e n g t h in t he X d i rec t ion , a t a pa r t i cu la r va lue of X. F i g u r e 6 s h o w s (as sol id l ines) i m p e d a n c e plots (J-~) for p u r e ag- g l o m e r a t e d i f fus ion for four va lues of ape +~ The d a s h e d curves , r e su l t s of a s imp le mode l , will be d i s c u s s e d in t he S impl i f i ed agg lomera t e r e p r e s e n t a t i o n sect ion. We see t h a t as ape ~~ a p p r o a c h e s zero, t he i m p e d a n c e a p p r o a c h e s b/ioe ~~ ( the i m p e d a n c e of a flat e lec t rode) a n d t h a t the imag- ina ry pa r t d i sappears . Fo r large va lues of @e +~ t he low-fre- q u e n c y r e s i s t a n c e a p p r o a c h e s twice t he h i g h - f r e q u e n c y res i s tance . F igu re 7 shows w h a t h a p p e n s w h e n th in - f i lm d i f fus ion is added . The th in - f i lm charac te r i s t i c f r equency , tar, h a s b e e n set four o rders of m a g n i t u d e smal le r t h a n t% to s epa ra t e t he two effects.
A l t e r n a t e p i e c e w i s e c o n s t a n t dc c o n c e n t r a t i o n solu- t i o n . - - A n a l t e rna te ana ly t ic so lu t ion of th i s th in - f i lm ag- g l o m e r a t e d i f fus ion m o d e l was d e v e l o p e d to c h e c k solu- t ion accuracy . The a g g l o m e r a t e l eng th , Ly, was d iv ided in to n e q u a l p ieces a n d t h e dc c o n c e n t r a t i o n in each p iece was a s s u m e d u n i f o r m a n d equa l to t h e ave rage concen t r a - t i on in t he interval . T h e r e is n o w an ana ly t ic so lu t ion in each in terval , w h i c h is
<ira2 eli = A i e *sy + Bie -%y - - - ci ~ ~ [41]
a n d t he n u m e r i c i n t e g r a t i o n of t he i n h o m o g e n e o u s equa- t i on is no t r equ i red . However , t h e r e are n o w n sets of un- k n o w n coeff ic ients Ai a n d Bi, a n d 2n - 2 add i t i ona l equa- t ions m a t c h i n g t he p e r t u r b e d c o n c e n t r a t i o n a n d p e r t u r b e d f lux b e t w e e n sect ions . B e c a u s e th i s is an a l t e rna t ive solu- t ion u s e d to ver i fy t he p r ev ious solut ion, we wil l no t dis-
< Z
<
"i"
5
4 -
3 -
2 -
1 -
I I t I I I I I L
LOCAL FARADAIC IMPEDANCE TIMES Ioe~/b
Fe ~ -- 1 ~d = 10"4
~e/~/2=1 ~ ~e/~/2ffi3
2.5 OOO0 0 1 ~ 01
2 3 4 5 6 7 8 9 10 11
REAL
Fig. 7. Example similar to that in Fig. 6 but with thin-film diffusion preceding the agglomerate process. The characteristic frequency of the thin-film process has been well separated from that of the agglomerate to show the distinct features of both processes. Reduced frequency co/e% increases from right to left with five marked points per decade on the ~e #/2 = 3 curve (five points per two decades for the other) and some values are shown.
J. Electrochem. Soc., Vol. 136, No. 6, June 1989 �9 The Electrochemical Society, Inc. 1599
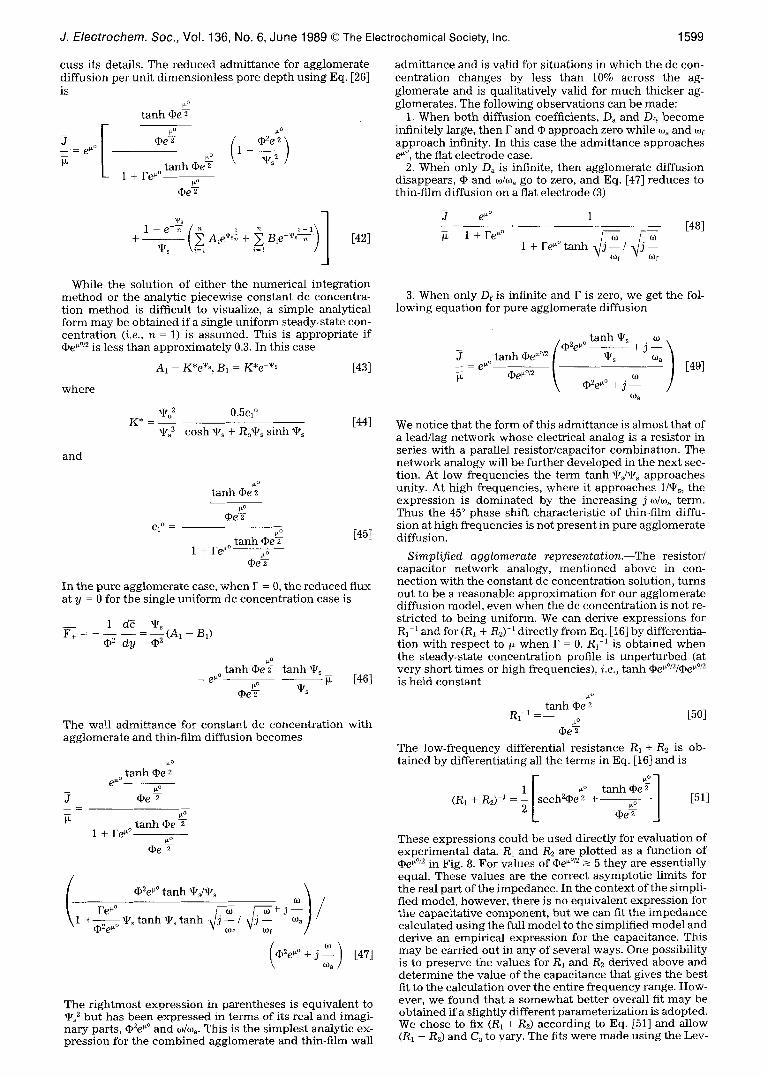
cuss its details. The reduced admi t t ance for agglomera te diffusion per uni t d imens ionless pore dep th us ing Eq. [26] is
~o
t anh Oe~
Oe 2 0 2 e ~ \ - e ~~ 1 ----= _ l
t anh Oe~~ "t, 2 /
1 + Fe ~~ tt ~
Oe 2
7 i n i - 1 \ 1
+ A~e*=n + ~ Bie-%~ - ) j [42]
~ s 1 - e ~
admi t t ance and is val id for si tuations in wh ich the dc con- cent ra t ion changes by less than 10% across the ag- g lomera te and is qual i ta t ively val id for m u c h th icker ag- g lomerates . The fol lowing observat ions can be made:
1. When bo th diffusion coefficients, D~ and Dr, b e c o m e infini tely large, then F and �9 approach zero whi le ~Oa and ~o~ approach infinity. In this case the admi t t ance approaches e ~~ the fiat e lec t rode case.
2. w h e n only D~ is infinite, t hen agglomera te diffusion disappears , �9 and ~/~0a go to zero, and Eq. [47] reduces to thin-fi lm diffusion on a fiat e lec t rode (3)
e ~~ 1 - = - - _ _ [48]
1 + Fe ~~ tanh /
While the solut ion of e i ther the numer ica l in tegra t ion m e t h o d or the analyt ic p iecewise cons tan t dc concentra- t ion m e t h o d is difficult to visualize, a s imple analyt ical form may be obta ined if a s ingle un i fo rm steady-state con- cent ra t ion (i.e., n = 1) is assumed. This is appropr ia te i f Oe ~~ is less than approx ima te ly 0.3. In this case
A1 = K'e*=, B~ = K*e -~= [43]
where
~o ~ 0.5cl ~ K* - [44]
~=2 cosh ~ + Ro~= sinh ~=
and
Ci 0
~o
t anh Oe~
OeT ~o
Fe ~~ tanh Oe~ 1 + ~o
Oe~
[45]
In the pure agglomera te case, w h e n F = 0, the r educed flux at y = 0 for the single un i fo rm dc concent ra t ion case is
1 d~ W= F+ - ( A 1 - B1)
02 dy �9 2 ~o
t anh OcT tanh ~P= _ = e ~ ~ - - i x [46]
~o ~ s Oe~
The wal l admi t t ance for cons tan t dc concen t ra t ion wi th agg lomera te and thin-fi lm diffusion becomes
~o
t anh Oe~ e .~ _ _ ~o
J Oe ~- ~o
t anh cPe Y 1 + Fe ~~ p o
Oe ~-
t O2e ~~ tanh ~=/*~ J ~o ) /
Fe ~~ r 1 +--~e~O *~ tanh *~ tanh ~ j ~ / ~ / V + %
( ") O2e ~~ + j - - 60 a
[47]
The r igh tmos t express ion in paren theses is equ iva len t to ~ 2 bu t has been expressed in te rms of its real and imagi- nary parts, O2e ~~ and r162 This is the s imples t analyt ic ex- press ion for the c o m b i n e d agglomera te and thin-fi lm wall
3. When only Df is infinite and F is zero, we get the fol- lowing equa t ion for pure agglomera te diffusion
- o tanh ~= ~o /O2e~ - - + j - - \
t anh Oe ~~ / ~= % - e ~~ , | ) [49]
0e~O/2 \ O2e ~~ + j
~O a
We not ice that the form of this admi t tance is a lmost that of a lead/lag ne twork whose electr ical analog is a resis tor in series wi th a parallel resis tor /capaci tor combinat ion . The ne twork analogy will be fur ther deve loped in the n e x t sec- tion. At low f requenc ies the t e rm tanh Ws/~= approaches unity. At h igh f requencies , where it approaches 1 /~ , the express ion is domina ted by the increas ing j ~O/r term. Thus the 45 ~ phase shift character is t ic of thin-fi lm diffu- s ion at h igh f requencies is not p resen t in pure agglomera te diffusion.
Simplified agglomerate representation.--The resistor/ capaci tor ne twork analogy, m e n t i o n e d above in con- nec t ion wi th the cons tan t dc concent ra t ion solution, tu rns out to be a reasonable approx imat ion for our agg lomera te diffusion model , even w h e n the dc concen t ra t ion is not re- s t r ic ted to being uniform. We can der ive express ions for R1 -~ and for (R1 + R2) -~ direct ly f rom Eq. [16] by differentia- t ion wi th respect to ~ w h e n F = 0. R1-1 is obta ined w h e n the steady-state concent ra t ion profile is unpe r tu rbed (at ve ry short t imes or high frequencies) , i.e., t anh Oe~~ ~~ is he ld cons tant
b~ o
tanh OcT R1-1 - ~o [50]
Oe Y
The low-f requency differential res is tance R1 + R2 is ob- ta ined by different ia t ing all the te rms in Eq. [16] and is
These express ions could be used direct ly for eva lua t ion of expe r imen ta l data. R1 and R2 are plot ted as a funct ion of Oe ~~ in Fig. 8. For values of Oe ~~ -> 5 they are essent ia l ly equal . These values are the correct asympto t ic l imits for the real part of the impedance . In the con tex t of the simpli- fied model , however , there is no equ iva len t express ion for the capaci ta t ive componen t , bu t we can fit the i m p e d a n c e ca lcula ted us ing the full mode l to the s implif ied m o d e l and der ive an empi r ica l express ion for the capaci tance. This m a y be carr ied out in any of several ways. One possibi l i ty is to p rese rve the values for R, and R2 der ived above and de t e rmine the va lue of the capac i tance that gives the best fit to the calcula t ion over the ent ire f r equency range. How- ever, we found that a somewha t be t ter overal l fit m a y be obta ined if a s l ightly different parameter iza t ion is adopted. We chose to fix (R1 + R2) according to Eq. [51] and al low (R~ - R2) and Ca to vary. The fits were m a d e us ing the Lev-
1600 J. Electrochem. Soc., Vol. 136, No. 6, June 1989 �9 The Electrochemical Society, Inc.
1 0 I I 1 I I 1 1 1 1 . ~ ~000~ I ] I I I H ' I I I l l l l i l l . ~ . I Z ~ 9 - ,| H . ~ -
, . ~ 4 . ~ _
'~-- " 0.1 1 10 ./~/
4 J R1 R2 -
2
1
0 I I 0 1 2 3 4 5 6 7 8 9 1
c e ~/2
Fig. 8. Plot of dimensionless resistances R~ (upper curves) and R~ (lower curves) used in the simplified agglomerate model equivalent cir- cuit. The solid lines correspond to the correct asymptotic limits for the full model; the dashed lines correspond to the best fits of the equivalent circuit parameters to the full calculation. The insert shows the value of Co obtolned by the same fitting procedure.
enberg-Marquart method, weighting the points according to the arc lengths in the complex impedance plane. Figure 6 shows the fits of the resistor/resistor/capacitor model to the full model, for values of dge ~~ from 1 to 5. The value of R~, R2, and C, obtained in this way for a range of values of Oe ~~ are also plotted in Fig. 8. As can be seen, the values of R, and R2 do not become equal for large values of dge ~~ as required by Eq. [50] and [51].
The resistances and capacitances were in turn expressed in terms of the following analytic expressions
1.216 C~ - [ 5 2 ]
@e ~~ %/1 + 0.56~e ~~
1 1 R~ = ~ (R~ + Ra) ; R2 = ~ (R~ - Rd) [53]
1 33 Rd 4- 0.018qb~e~ ~ [54]
%/1 + 0.150p4e 2~
and R~ (= R1 + R9 is given by Eq. [51]. By reducing the small ac solution of the pure ag-
glomerate diffusion process from the complicated mathe- matical procedure described in the diffusion region solu- tion section to that of a simple electrical network, the pro- cess of extracting parameters that characterize the diffu- sion process from ac impedance measurements is greatly simplified. It is important to realize that the expressions given above are not exact and in fact depend on the method of parameterization and the weighting scheme used i n the fitting.
We must now determine how to couple this simplified pure agglomerate model with thin-film diffusion to get the combined wall admittance. A transfer function, as men- tioned earlier, is the ratio of the Laplace transform of an output or dependent variable to the transform of an input or independent variable with all other variables held con- stant. In the case of the pure agglomerate model (no thin film), the system variables are the concentration ratio and reduced flux at Y = 0, ~o and F§ the reduced potential, 5, and the reduced current density, J. Any two of these vari- ables are independent, the other two are dependent. The admittance we reduced to the R-R-C network for pure ag- glomerate diffusion is the transfer function [J/~]~o, in which the concentration co at Y = 0 is held fixed. The admittance with thin-film diffusion included is the transfer function [J/~]~ 6, where the system extends from Y = -8 to Y = Ly. We shall consider the following functional relation for three dependent variables, the current density, and the fluxes on each side of the thin-film/agglomerate interface: J(~, ~oo), F~(~, ~o), and F~(~). Two reduced fluxes must be distinguished, for although they will be equated, the trans- fer functions on either side of the interface are different. In an exact parallel to forming differentials of functions of
several variables, we can express the following transfer function relationships
Co L~ooJ~
[1 E ~ + ~ o ~ = p- = ~ ~ [561
Upon eliminating ~, F+, and F_, the admittance with thin- film diffusion included can be expressed in terms of the five transfer functions, which we can evaluate
F_ [57]
The transfer functions in the denominator of Eq. [55] are obtained from Eq. [21] and [37]
[F~_] - @ [F-~] ~s2 tanh ~s ~o ~ - t a n l ~ ; ~-o ~ - q52 .~ [58]
When ~ is zero, the homogeneous solution for concentra- tion (Eq. [34]) is the general solution and can be combined with Eq. [26] and known boundary conditions to determine Q C/Eo]~.
I ~ ] tanh '#s = e ~ ~ [59]
~Ps
From Eq. [46] we can obtain the transfer function [F+Fr when the dc concentration profile is assumed constant. We compared the ratio of [F§ obtained from the integrated solution of the D i f f u s i o n r e g i o n s o l u t i o n section to that from Eq. [46] for many values of ape ~~ and determined that by multiplying the latter by a real scaling factor G(Oe~~ the correct transfer function could be reconstituted. The dynamics of the two transfer functions was slightly differ- ent near the characteristic frequency, but when combined with the other transfer functions of Eq. [56], the use of the simple transfer function as opposed to the exact one was undetectable.
p o
tankoe tanh = G ( @ e Y ) �9 e ~~ ~
Co dPe~ ~s [60]
4-
8 -
2 -
0 I r 1 r I } I I 1 0 1 2 3 4 5 6 7 8 9
~e ~j2
Fig. 9. Scaling factor G vs . ~e ~~ as used in Eq. [59]
10
J. Electrochem. Soc., Vol. 136, No. 6, June 1989 �9 The Electrochemical Society, Inc. 1601
The scaling factor G is plotted in Fig. 9 and was found within the accuracy of the computed values to be repre- sented by
~o [ ~4e2~ 1/4 G(~PeY) = ~1 + I [61]
16 ]
The admittance for the pure agglomerate, before being used in Eq. [56], must be corrected for the dc concentration drop caused by the film diffusion. When this is done, the final expression for the simplified admittance representa- tion becomes
e ~~ ~o
tanh r 1 + Fe ~~
~o r
I 1 1
R~ + 1
- - + jCaco/coa R2
( tanh ~ 2 tanh ~ 1
1 + re ~~ ~s~ tanh ~ tanh
dpUe ~~ x]~ s j~-~/~ f
[62]
Figures 6 and 7, seen earlier, show a comparison of the full- and simple-impedance models. The differences are at- tr ibutable to the differences in the pure agglomerate model representation of [J~]~o in Eq. [56] and not to differ- ences in the other transfer functions of that equation.
Discussion The model used in this work to describe the impedance
of a pore wall is essentially the same as that used by Iczkowski and Cutlip (7) and BjSrnbom (8) to derive the steady-state behavior of porous gas diffusion electrodes.
The principal difference is the use of Cartesian, rather than cylindrical geometry, to describe the pore geometry. For the steady-state behavior it is likely that the form of the results is changed only by a numerical factor. The ef- fect on the ac impedance may be more severe. It is clear that the high- and low-frequency response for Cartesian, cylindrical, and spherical geometry will be identical, dif- fering (in the low-frequency limit) by the numerical factor. In the intermediate frequency range, when co is compa- rable to D / L 2 (here D is a diffusion coefficient and L the characteristic length of the component), we may expect some geometric dependence. It is known, for example, that the ac solutions for diffusion into a one-dimensional finite-length slab and into a sphere of similar size differ slightly in this region (17). In view of the random nature of the geometry in a real electrode, however, there seems to be no reason to prefer one geometry over another.
The dc behavior of our model is similar to that found by the earlier workers. Thin-film diffusion and agglomerate reaction/diffusion have significantly different effects on the potential dependence of the current. As is well known, thin-film conditions lead to a true limiting current density (a positive second derivative of the overpotential with re- spect to the current). The agglomerate situation alone (with uniform catalyst loading), however, never leads to such a limiting current, because there is always catalyst present in a region of nonzero concentration. The second derivative always remains negative. There is, however, a doubling of the apparent Tafel slope in a potential range where current penetration of the agglomerate is not com- plete. In the thin-film case, of course, the apparent Tafel
104 i i i i
"' 1~ - " '" , , F= 2.10 "6 ~ - o , = 0
100
w F= 0 ..Jrr 10 -2 O= 1.4,10~3~ ~ J
Z 10"4 F=0
10-6 I I I I I 0.4 0.5 0.6 0.7 0.8 0.9 1.0
ELECTRODE POTENTIAL (V)
Fig. 10. Example of differential resistance of electrode with no moss transport, with just thin-film diffusion, and with just agglomerate diffu- sion. A Tafel parameter of 60 mV/dec and an exchange current density of 2 �9 10 -s A/cm 2 was used.
slope tends to infinity. Figure 4 showed overpotential vs . log current dependence for various diffusion parameters. The slope of the voltage-current plot is, of course, the limit- ing low-frequency differential resistance measured in an ac experiment. We therefore expect to see a distinct differ- ence in the potential dependence of this resistance that can serve as a diagnostic tool to distinguish between the presence of agglomerate and thin film diffusion. For the agglomerate case, the low-frequency resistance continu- ously decreases with increasing overpotential, whereas, for the thin-film case, the differential resistance continu- ously increases as soon as thin-film effects become impor- tant. This is illustrated graphically in Fig. 10 where the re- sistance is plotted against electrode potential for the three cases of: (i) no mass transport limitations, (ii) thin film transport alone, and ( i i i ) agglomerate diffusion/reaction alone.
Another important difference between the two situa- tions is the phas e of the current with respect to the voltage. The differential phase (angle from real axis of tangent line to Nyquist curve) for the thin-film case at high frequencies is 45 ~ , whereas for the agglomerate situation it is 90 ~ . This fact is clearly shown in Fig. 7, where the difference is evi- dent in the shape of the complex plane plots. In many situ- ations, however, because of overlap of the processes, this shape will be a less valuable distinguishing feature than the potential dependence of the impedance.
In this context, some discussion of the model of Wabner e t al. (15) and Holze and Vielstich (16) is warranted. These authors interpreted their results in terms of two series-con- nected, finite-length diffusion processes. Mathematically, the form of their diffusional components was identical to the thin-film component used in the present work. Th e po- tential dependence of their results, however, was' inconsis- tent with the model in that they observed a decrease in electrode impedance with increasing overpotential. I f fi- nite-length diffusion processes are present to the extent that they lead to a 45 ~ phase angle, as observed by the above workers, then they will always lead to an increase in electrode impedance with overpotential. An alternative explanation for the observed behavior is that of a distrib- uted network in which both charge transfer and thin-film diffusion are present (3). The form of the impedance caused by a finite-length diffusion process is indistin- guishable from that due to a finite-length RC transmission line, although the physical origin of the two processes is distinctly different. The principal distinguishing feature is their opposite potential dependence. As mentioned in the introductory remarks, a complete electrode model will be considered in a forthcoming paper. The model will include effects due to double-layer charging and local overpoten- tial variations associated with electrolyte resistance in the X direction.
Despite the algebraic complexity of the form of the im- pedance associated with an agglomerate diffusion/reaction element, we have shown that the response is approxi- mately, but adequately, represented by an equivalent cir-
1602 J. Electrochem. Soc., Vol. 136, No. 6, June 1989 �9 The Electrochemical Society, Inc.
cul t t h a t cons i s t s of a paral le l RC c o m b i n a t i o n in ser ies w i t h a n o t h e r res i s tance . We can ach ieve a qua l i t a t ive un- d e r s t a n d i n g of the d y n a m i c s of agg l om er a t e d i f fus ion b y c o n s i d e r i n g a smal l s tep inc rease in ove rpo t en t i a l f r om an e x i s t i n g c o n c e n t r a t i o n d i s t r i b u t i o n a n d potent ia l .
C o n s i d e r first t he case w h e r e t he ove rpo ten t i a I a n d ag- g l o m e r a t e p a r a m e t e r s are s u c h t h a t q)e ~~ is small , a n d h e n c e t he ini t ia l c o n c e n t r a t i o n is re la t ive ly un i fo rm. At sho r t t i m e s or h i g h f r equenc ies , t he c u r r e n t d e n s i t y r ises eve rywhere , p r o p o r t i o n a l to t he local s t eady-s t a t e concen - t r a t i o n (and c u r r e n t densi ty) . B e c a u s e mass t r a n s p o r t in t he a g g l o m e r a t e is fast, th i s c u r r e n t is m a i n t a i n e d at l o n g e r t imes . I n t he e q u i v a l e n t c i rcui t R2 = 0.
Fo r t he case w h e r e q)e ~~ is no t small , howeve r , m a s s t r a n s p o r t c a n n o t m a i n t a i n the in i t ia l i nc r ea se in c u r r e n t dens i ty . The c o n c e n t r a t i o n at t he gas in t e r face r e m a i n s un- c h a n g e d , while , a t t h e o the r s ide of t h e agg lomera te , t he c o n c e n t r a t i o n falls t he most . T he dec rea se in t he per- t u r b e d c o n c e n t r a t i o n is s u c h t h a t t he c u r r e n t p e r t u r b a t i o n falls to h a l f of i ts initial, i n s t a n t a n e o u s value. Th i s corre- s p o n d s to t he s i tua t ion w h e r e R1 = R2. T he capac i t ance o r ig ina t e s in t he r e d i s t r i b u t i o n of cha rge as t he concen t r a - t ion prof i les change .
The s a m e c o n c l u s i o n m a y be o b t a i n e d f rom Eq. [50] a n d [51]. In t he l imi t of large dpe ~~ t h e ra t io R1 + R2/R~ ap- p r o a c h e s 2, a n d h e n c e R1 = R2. In Fig. 6., i t is c lear t h a t th i s c o n d i t i o n is va l id for q)e ~~ -> 5. T h e fact t h a t t h e s i m p l e e q u i v a l e n t c i rcu i t m o d e l dev ia tes f rom t he full n u m e r i c a l e v a l u a t i o n ind ica t e s t h a t for t h i c k e r a g g l o m e r a t e s t h e r e are second-orde r , m o r e c o m p l i c a t e d dynamics . This leads to a n o t i c e a b l e d i f f e rence b e t w e e n t h e full a n d s imp le m o d e l s at i n t e r m e d i a t e f requenc ies .
We h a v e l imi ted t h e s e s tud ies to va lues of ~e ~~ less t h a n ten , a r a n g e we e x p e c t to e n c o u n t e r in real e lec t rodes . W h e n e v a l u a t i n g t he e q u a t i o n s at t h e i r a s y m p t o t i c l imi ts in f r equency , i t s h o u l d be k e p t in m i n d t h a t t he low re- d u c e d f r e q u e n c y m u s t b e m u c h lower t h a n q)2e~~ a n d con- ve r se ly t h e h i g h e s t r e d u c e d f r e q u e n c y m u s t b e m u c h h igher .
Conclusions The m o s t i m p o r t a n t a spec t s of th i s w o r k m a y be sum-
mar i zed as follows:
1. We h a v e ca lcu la ted b o t h t he dc a n d ac r e s p o n s e of a d i f fe ren t ia l e l e m e n t of a po re wal l u s i n g a n a g g l o m e r a t e m o d e l in ser ies w i t h a t h i n e lec t ro ly te film.
2. In a g r e e m e n t w i t h p r ev ious w o r k we find t h a t t he ag- g l o m e r a t e i t se l f does no t lead to a l im i t i ng c u r r e n t b e h a v - ior, b u t r a t h e r to a d o u b l i n g of the e f fec t ive Tafel s lope w h e n c u r r e n t p e n e t r a t i o n of t h e a g g l o m e r a t e reg ion is in- comple te . The t h i n e lec t ro ly te film, e i t he r b y i t se l f or in c o n j u n c t i o n w i th t h e agg lomera te , u l t ima te ly leads to a d i f fus ion- l imi ted cur ren t .
3. B e c a u s e of t h e n o n l i n e a r c o n c e n t r a t i o n profi le in t he agg lomera t e , a n u m e r i c a l i n t eg r a t i on was n e e d e d to calcu- la te t he ac r e sponse . A s impl i f ied m o d e l was deve loped , however , w h i c h is a p p r o x i m a t e l y co r rec t for m o s t exper i - m e n t a l s i tua t ions . Th i s m o d e l can be e x p r e s s e d in t e r m s of a s i m p l e e q u i v a l e n t c i rcu i t cons i s t i ng of a res i s to r in ser ies w i t h a para l le l a r r a n g e m e n t of a capac i to r a n d a s e c o n d re- s i s tance . T rans f e r f unc t i ons were de r ived t h a t a l low the s i m p l e m o d e l to b e u sed in c o n j u n c t i o n w i t h t h e t h i n fi lm d i f fus ion process .
T h e a g g l o m e r a t e does no t lead to a 45 ~ p h a s e ang le in t h e e lec t r ica l r e sponse , u n l i k e t he w e l l - k n o w n semi- f in i te a n d f in i t e - l eng th d i f fus ion p r o b l e m s m o r e c o m m o n l y con- s idered .
The p rope r t i e s of t he d i f fe ren t ia l e l e m e n t c o n s i d e r e d h e r e c an be i n c o r p o r a t e d in to a c o m p l e t e m o d e l of a po- rous gas d i f fus ion e l ec t rode w h e r e d i s t r i b u t e d r e s i s t a n c e a n d doub le - l aye r c apac i t ance are also inc luded .
M a n u s c r i p t s u b m i t t e d J u l y 22, 1988; r ev i sed m a n u s c r i p t r e ce ived Oct. 13, 1988.
Los A l a m o s N a t i o n a l L a b o r a t o r y ass is ted in mee t ing the pub l i ca t i on costs o f this article.
Av
b
Cd
Ca
C~ C(y) C*
c(y)
c~ Co ~(y) Co
D, Dr, Da
F
G
F_, F+, F1
i
iv io
J J
k '
k o
Ly n QH, Qr~, Q
r
R
Ro
R1, R2
R S t T X Y
Y
Zf
L I S T OF S Y M B O L S ca ta lys t area pe r u n i t v o l u m e - cm '
R T na tu r a l Tafel s lope - V
c~nF
doub le - l aye r c apac i t ance pe r area pe r un i t d e p t h - F /cm 3 d i m e n s i o n l e s s c apac i t ance for a g g l o m e r a t e n e t w o r k to ta l e l ec t rode doub le - l aye r c apac i t ance - F local r e a c t a n t c o n c e n t r a t i o n - m o l / c m 3 r e a c t a n t c o n c e n t r a t i o n a t b u l k gas in t e r f ace - m o l / c m 3
rat io of local r e a c t a n t c o n c e n t r a t i o n to t he c o n c e n t r a t i o n at t he gas-e lec t ro ly te in terface , C/C* s teady-s ta te r e a c t a n t c o n c e n t r a t i o n ra t io r e a c t a n t c o n c e n t r a t i o n rat io at y = 0 t r a n s f o r m of p e r t u r b e d c o n c e n t r a t i o n ra t io t r a n s f o r m of p e r t u r b e d c o n c e n t r a t i o n ra t io at Y = O d i f fus ion coefficient , th in-f i lm, a n d agg lomera t e - cm2/s F a r a d a y c o n s t a n t - C/mol
Sca l ing fac to r for ~ - Co
D a t t r a n s f o r m e d r e a c t a n t f lux + C*k ~
k ~ aY
t r a n s f o r m e d r e d u c e d r e a c t a n t f lux at y = -0 , y = +0, a n d y = 1 c u r r e n t dens i t y b e t w e e n a g g l o m e r a t e a n d e lec t ro ly te - A /cm 2 c u r r e n t pe r u n i t v o l u m e - A /cm 3 e x c h a n g e c u r r e n t pe r u n i t po re sur face area nFkOc * - A/cm 2
r e d u c e d c u r r e n t dens i t y b e t w e e n a g g l o m e r a t e and e lec t ro ly te i/io
t r a n s f o r m e d p e r t u r b e d r e d u c e d c u r r e n t dens i t y ra te c o n s t a n t on ca ta lys t a t r eve r s ib l e po ten- t ial - cm/s ef fec t ive ra te c o n s t a n t a t r eve r s ib l e p o t e n t i a l k'AvLy - - cm/s t h i c k n e s s of a g g l o m e r a t e r eg ion - c m n u m b e r o f e l ec t rons t r a n s f e r r e d h o m o g e n e o u s , i n h o m o g e n e o u s , to ta l concen - t r a t i on in teg ra l e l ec t rode area r e s i s t ance pe r u n i t d e p t h - I~-cm to ta l e lec t ro ly te r e s i s t ance - f/
c o n c e n t r a t i o n to c o n c e n t r a t i o n g r a d i e n t ra t io
Co
0~ - - ( + 0 ) oy d i m e n s i o n l e s s r e s i s t ances in agg lomera t e n e t w o r k gas c o n s t a n t - J K - ' tool -1 Lap lace t r a n s f o r m va r i ab l e - rad/s t i m e - s t e m p e r a t u r e - K d i s t ance a long pore - cm d i s t ance in to a g g l o m e r a t e - c m
d i m e n s i o n l e s s d i s t ance in to a g g l o m e r a t e Y/Ly
fa rada ic sur face area u n i t d e p t h i m p e d a n c e - f~-cm 3
G r e e k S y m b o l s t r ans f e r coeff ic ient
~/ po re (diffusion) sur face a rea to e l ec t rode area ra t io
F f i lm-di f fus ion p a r a m e t e r k~
J. Electrochem. Soc., Vol. 136, No. 6, June 1989 �9 The Electrochemical Society, Inc. 1603
i ~~
(Oa
(Of
diffusion film thickness - cm overpotential - V
reduced overpotential ~/b
steady-state overpotential
dc potential independent agglomerate diffu-
sion parameter ~/k~Y ~ Da
ae potential dependent agglomerate diffusion
parameter \/ap2e~~ + j(o
(oa
ionic resistivity - gt-cm angular frequency - rad/s
characteristic agglomerate frequency Da/Ly 2 - rad/s
characteristic thin-film frequency D#52 - rad/s
REFERENCES 1. J. R. Macdonald and L. D. Potter, Solid State Ionics, 23,
61 (1987).
2. B. A. Boukamp, ibid., 20, 31 (1986). 3. T. Springer and I. Raistrick, in "Electrode Materials
and Processes for Energy Conversion," Vol. 87-12, S. Srinivasan, S. Wagner, and H. Wroblowa, Editors, p. 152, The Electrochemical Socie tySof tbound Pro- ceedings Series, Pennington, NJ (1987).
4. R. de Levie, in "Advances in Electrochemistry and Electrochemical Engineering," Vol. 6, P. Delahay and C. W. Tobias, Editors, p. 329, Interscience, New York (1967).
5. J. Giner and C. Hunter, This Joural, 116, 1124 (1969). 6. M. B. Cutlip, Electrochim. Acta, 20, 767 (1975). 7. R. P. Iczkowski and M. B. Cutlip, This Journal, 127,
1433 (1980). 8. P. Bj6rnbom, Electrochim. Acta, 32, 115 (1987). 9. C. Cachet and R. Wiart, ibid., 29, 145 (1984).
10. C. Cachet, C. P. de Pauli, and R. Wiart, ibid., 30, 719 (1985).
11. C. Cachet and R. Wiart, J. Electroanal Chem., 195, 21 (1985).
12. J.-P. Candy and P. Fouilloux, Electrochim. Acta, 26, 1029 (1981).
13. J.-P. Candy et al. ibid., 27, 1585 (1982). 14. E.A. Grens II and C. W. Tobias, Z. Electrochem., 68, 236
(1964). 15. D. Wabner, R. Holze, and P. Schmittinger, Z. Natur-
forsch, 39b, 157 (1984). 16. R. Holze and W. Vielstich, This Journal, 131, 2298
(1984). 17. I. D. Raistrick, Unpublished work.
Effect of Cobalt on Fibrous Nickel Hydroxide Electrodes
H. H. Law* and J. Sapjeta
AT&T Bell Laboratories, Murray Hill, New Jersey 07974
ABSTRACT
The effect of cobalt on fibrous nickel hydroxide electrodes has been investigated. The incorporation of cobalt was found to change the mechanical properties of the active material. When the active material contains at least 5 mole percent cobalt, it is much less brittle and less sensitive to the stress incurred during cycling. This effect can be demonstrated by determining the influence of cobalt on the response of the electrode to a severe stress such as pressing.
As the demand for rechargeable batteries keeps increas- ing, achieving higher specific energy is clearly desirable. Known for its high cycle life and high energy density among the well-established bat tery systems, the nickel- cadmium (Ni/Cd) battery is likely to remain as the re- chargeable battery of choice for some time to come. The possibility of replacing the sintered nickel plaque in com- mon use today with a fibrous nickel mesh as the electrode substrate has been reported (1, 2). A potential 20% increase in specific energy could be achieved due to the 50% reduc- tion of the weight of the electrode substrate (2).
Because of the open physical structure of the fibrous mat, carrying out the electrochemical impregnation using the optimal conditions for making nickel electrodes from sintered nickel plaque is inappropriate. We found that by increasing the current to 3 A/in. 2, both cadmium and nickel electrodes with reproducible capacities could be prepared in 10-12 min, which is a substantial improvement over the typical 90-120 min for sintered nickel electrodes. The cad- mium electrodes had very good capacity, 0.245 Ah/in. 2. A 50% weight reduction of the substrate would be realized if the capacity remains unchanged after long term testing. When compared to the sintered electrodes, the fibrous nickel hydroxide electrodes have similar energy density by weight, though about 20-30% less energy per volume. The addition of cobalt to the nickel hydroxide active mate- rial was found to improve electrode performance signifi- cantly.
* Electrochemical Society Active Member.
The half-cell reaction occurring at the nickel hydroxide electrode is
Ni(OH)2 + OH- = NiOOH + H20 + e- [1]
During charging of the electrode, Ni(OH)2 is converted to NiOOH, which may exist in both beta and gamma forms. The ~-NiOOH is stabilized by the incorporation of. potas- sium ions from the electrolyte into the interlayer space of the lattice structure. NiOOH with this structure is more difficult to reduce to Ni(OH)2 upon discharge. It is thought that cobalt inhibits the development of such structural order. Electrodes containing cobalt additives have been found to have less ~]-phase NiOOH and lower K § contents than pure nickel hydroxide electrodes (3, 4). X-ray analysis of the active material of nickel hydroxide electrodes (5, 6) has also shown that the addition of cobalt somewhat re- tards the formation of the more stable ~-NiOOH. The parti- cles of active material in electrodes containing cobalt are smaller than those in cobalt-free electrodes, and remain smaller even after repeated charge/discharge cycles. This smaller particle size is desirable because it is necessary to maximize the surface area of the active material in contact with the current collector for most efficient utilization (7).
Cobalt has also been found to influence the electrode re- actions of nickel hydroxide. Charge/discharge curves (6-8) and cyclic voltammetry studies (9, 10) show that the addi- tion of cobalt to the electrode allows charging to occur more reversibly (smaller AEp), and at a less positive poten- tial. Typically, the charging efficiency of nickel hydroxide