Power quality disturbances analysis based on EDMRA method Haibo He a, * , Xiaoping Shen b , Janusz A. Starzyk c a Department of Electrical and Computer Engineering, Stevens Institute of Technology, Hoboken, NJ 07030, USA b Department of Mathematics, Ohio University, Athens, OH 45701, USA c School of Electrical Engineering and Computer Science, Ohio University, Athens, OH 45701, USA article info Article history: Received 11 September 2007 Received in revised form 6 March 2009 Accepted 13 March 2009 Keywords: Power quality Energy Difference of Multiresolution Analysis Wavelet transform Minimum decomposition level Noise abstract An Energy Difference of Multiresolution Analysis (EDMRA) method for power quality (PQ) disturbances analysis has been proposed in this paper. At each wavelet decomposition level, the squared value of the detail information is calculated as their energy to construct the feature vector for analysis. Following the criteria proposed in this paper, different kinds of power quality disturbances can be detected, local- ized, and classified effectively. The choice of the decomposition levels of appropriate wavelets are of the critical importance for the EDMRA method, since they will influence quality of the reconstructed signal as well as the computational cost. It is presented in this paper that the Minimum Decomposition Level (MDL) is related to the sampling frequency by the proposed function. The comparison study among dif- ferent kinds of wavelets for the EDMRA method is presented in details. The EDMRA method is scalable and has robustness characteristics in common design paradigm. It can be realized economically using wavelets with shortest length, such as Harr, Db2, Sym2 or Coif 1. Two types of noise, namely, Gaussian white noise and band limited spectrum noise are considered in this paper to show the effectiveness of the proposed method in noisy environment. Ó 2009 Elsevier Ltd. All rights reserved. 1. Introduction This paper aims to develop an effective method for power qual- ity (PQ) disturbances detection, localization and classification. With the fast expansion of power electronics and other nonlinear, time-variant loads in the power distribution network, power qual- ity has become a critical issue and attracted growing attention in power industry and academic. For example, according to the sur- vey by IEEE Transactions on Industrial Applications (IAS) for 210 large commercial and industrial customers, the average cost for a 4-h outage and a momentary outage are $74,835 and $11,027, respectively [1]. Also, according to the data investigated by Electri- cal Power Research Institute (EPRI), the US economy is losing be- tween $104 billion and $164 billion a year to outages, and another $15 billion to $24 billion for PQ phenomena [2]. For in- stance, the power outage in North America in August, 14, 2003 influenced the vast area from east of New York, north to Toronto and west to Detroit, Michigan – an area that is home to about 50 million people. It leads to losses of $4 billions to $10 billions in the USA alone [3]. Therefore, the research of power quality issues has captured ever increasing attention in the power engineering society. Recent advances in the wavelet transforms provide a powerful tool for power quality analysis. In the wavelet based PQ analysis, there are two major categories of techniques. The first one is the wavelet based data compression for power quality disturbances. For instance, Hamid and Kawasaki proposed the power quality disturbances data compression techniques via discrete wavelet transform and wavelet packet transform [4]. In [5], compression techniques using spline wavelet are performed through signal decomposition, thresholding of wavelet coefficients, and signal reconstructions. A modified wavelet transform, known as S-trans- form, has been used for such analysis. Panda et al. used the Slantlet Transform (SLT) for data compression of power quality events [6]. The SLT can design different filters for different scales unlike iter- ated filter bank approaches for conventional discrete wavelet transform (DWT). The second category is the wavelet based detec- tion, localization, and classification of the power quality problems. For instance, Poisson et al. presented a good comparison among the continuous wavelet transform, the multiresolution analysis (MRA) and the quadratic transform for power quality analysis [7]. The same authors proposed a recursive algorithm based on continuous wavelet transform to detect and analyze voltage sags and tran- sients [8]. The comparison between measured characteristics and benchmark values are used to detect the presence of disturbances in analyzed signals and characterize the type of disturbances. Santoso et al. presented the characterization analysis of distribu- tion power quality events with Fourier and Wavelet Transform 0142-0615/$ - see front matter Ó 2009 Elsevier Ltd. All rights reserved. doi:10.1016/j.ijepes.2009.03.017 * Corresponding author. Tel.: +1 201 216 8057; fax: +1 201 216 8246. E-mail addresses: [email protected], [email protected](H. He). Electrical Power and Energy Systems 31 (2009) 258–268 Contents lists available at ScienceDirect Electrical Power and Energy Systems journal homepage: www.elsevier.com/locate/ijepes
Transcript
Electrical Power and Energy Systems 31 (2009) 258–268
Contents lists available at ScienceDirect
Electrical Power and Energy Systems
journal homepage: www.elsevier .com/locate / i jepes
Power quality disturbances analysis based on EDMRA method
Haibo He a,*, Xiaoping Shen b, Janusz A. Starzyk c
a Department of Electrical and Computer Engineering, Stevens Institute of Technology, Hoboken, NJ 07030, USAb Department of Mathematics, Ohio University, Athens, OH 45701, USAc School of Electrical Engineering and Computer Science, Ohio University, Athens, OH 45701, USA
a r t i c l e i n f o a b s t r a c t
Article history:Received 11 September 2007Received in revised form 6 March 2009Accepted 13 March 2009
Keywords:Power qualityEnergy Difference of MultiresolutionAnalysisWavelet transformMinimum decomposition levelNoise
0142-0615/$ - see front matter � 2009 Elsevier Ltd. Adoi:10.1016/j.ijepes.2009.03.017
An Energy Difference of Multiresolution Analysis (EDMRA) method for power quality (PQ) disturbancesanalysis has been proposed in this paper. At each wavelet decomposition level, the squared value ofthe detail information is calculated as their energy to construct the feature vector for analysis. Followingthe criteria proposed in this paper, different kinds of power quality disturbances can be detected, local-ized, and classified effectively. The choice of the decomposition levels of appropriate wavelets are of thecritical importance for the EDMRA method, since they will influence quality of the reconstructed signal aswell as the computational cost. It is presented in this paper that the Minimum Decomposition Level(MDL) is related to the sampling frequency by the proposed function. The comparison study among dif-ferent kinds of wavelets for the EDMRA method is presented in details. The EDMRA method is scalableand has robustness characteristics in common design paradigm. It can be realized economically usingwavelets with shortest length, such as Harr, Db2, Sym2 or Coif 1. Two types of noise, namely, Gaussianwhite noise and band limited spectrum noise are considered in this paper to show the effectiveness ofthe proposed method in noisy environment.
� 2009 Elsevier Ltd. All rights reserved.
1. Introduction
This paper aims to develop an effective method for power qual-ity (PQ) disturbances detection, localization and classification.With the fast expansion of power electronics and other nonlinear,time-variant loads in the power distribution network, power qual-ity has become a critical issue and attracted growing attention inpower industry and academic. For example, according to the sur-vey by IEEE Transactions on Industrial Applications (IAS) for 210large commercial and industrial customers, the average cost for a4-h outage and a momentary outage are $74,835 and $11,027,respectively [1]. Also, according to the data investigated by Electri-cal Power Research Institute (EPRI), the US economy is losing be-tween $104 billion and $164 billion a year to outages, andanother $15 billion to $24 billion for PQ phenomena [2]. For in-stance, the power outage in North America in August, 14, 2003influenced the vast area from east of New York, north to Torontoand west to Detroit, Michigan – an area that is home to about 50million people. It leads to losses of $4 billions to $10 billions inthe USA alone [3]. Therefore, the research of power quality issueshas captured ever increasing attention in the power engineeringsociety.
ll rights reserved.
: +1 201 216 8246.il.com (H. He).
Recent advances in the wavelet transforms provide a powerfultool for power quality analysis. In the wavelet based PQ analysis,there are two major categories of techniques. The first one is thewavelet based data compression for power quality disturbances.For instance, Hamid and Kawasaki proposed the power qualitydisturbances data compression techniques via discrete wavelettransform and wavelet packet transform [4]. In [5], compressiontechniques using spline wavelet are performed through signaldecomposition, thresholding of wavelet coefficients, and signalreconstructions. A modified wavelet transform, known as S-trans-form, has been used for such analysis. Panda et al. used the SlantletTransform (SLT) for data compression of power quality events [6].The SLT can design different filters for different scales unlike iter-ated filter bank approaches for conventional discrete wavelettransform (DWT). The second category is the wavelet based detec-tion, localization, and classification of the power quality problems.For instance, Poisson et al. presented a good comparison among thecontinuous wavelet transform, the multiresolution analysis (MRA)and the quadratic transform for power quality analysis [7]. Thesame authors proposed a recursive algorithm based on continuouswavelet transform to detect and analyze voltage sags and tran-sients [8]. The comparison between measured characteristics andbenchmark values are used to detect the presence of disturbancesin analyzed signals and characterize the type of disturbances.Santoso et al. presented the characterization analysis of distribu-tion power quality events with Fourier and Wavelet Transform
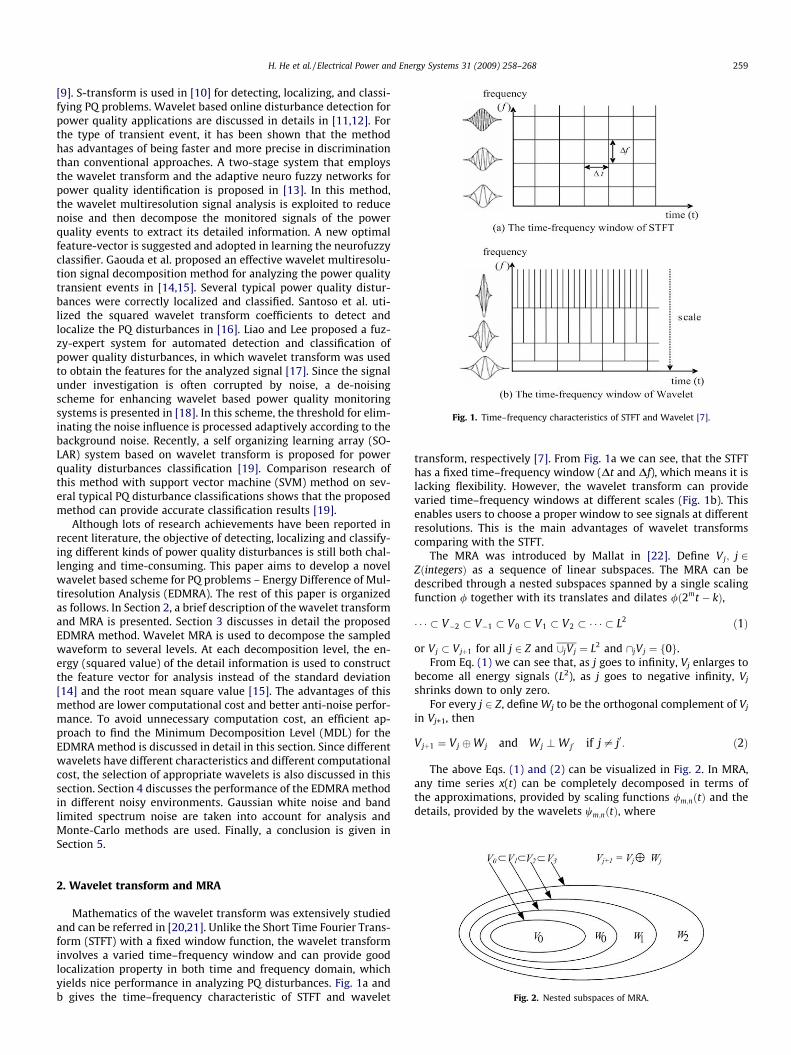
Fig. 1. Time–frequency characteristics of STFT and Wavelet [7].
H. He et al. / Electrical Power and Energy Systems 31 (2009) 258–268 259
[9]. S-transform is used in [10] for detecting, localizing, and classi-fying PQ problems. Wavelet based online disturbance detection forpower quality applications are discussed in details in [11,12]. Forthe type of transient event, it has been shown that the methodhas advantages of being faster and more precise in discriminationthan conventional approaches. A two-stage system that employsthe wavelet transform and the adaptive neuro fuzzy networks forpower quality identification is proposed in [13]. In this method,the wavelet multiresolution signal analysis is exploited to reducenoise and then decompose the monitored signals of the powerquality events to extract its detailed information. A new optimalfeature-vector is suggested and adopted in learning the neurofuzzyclassifier. Gaouda et al. proposed an effective wavelet multiresolu-tion signal decomposition method for analyzing the power qualitytransient events in [14,15]. Several typical power quality distur-bances were correctly localized and classified. Santoso et al. uti-lized the squared wavelet transform coefficients to detect andlocalize the PQ disturbances in [16]. Liao and Lee proposed a fuz-zy-expert system for automated detection and classification ofpower quality disturbances, in which wavelet transform was usedto obtain the features for the analyzed signal [17]. Since the signalunder investigation is often corrupted by noise, a de-noisingscheme for enhancing wavelet based power quality monitoringsystems is presented in [18]. In this scheme, the threshold for elim-inating the noise influence is processed adaptively according to thebackground noise. Recently, a self organizing learning array (SO-LAR) system based on wavelet transform is proposed for powerquality disturbances classification [19]. Comparison research ofthis method with support vector machine (SVM) method on sev-eral typical PQ disturbance classifications shows that the proposedmethod can provide accurate classification results [19].
Although lots of research achievements have been reported inrecent literature, the objective of detecting, localizing and classify-ing different kinds of power quality disturbances is still both chal-lenging and time-consuming. This paper aims to develop a novelwavelet based scheme for PQ problems – Energy Difference of Mul-tiresolution Analysis (EDMRA). The rest of this paper is organizedas follows. In Section 2, a brief description of the wavelet transformand MRA is presented. Section 3 discusses in detail the proposedEDMRA method. Wavelet MRA is used to decompose the sampledwaveform to several levels. At each decomposition level, the en-ergy (squared value) of the detail information is used to constructthe feature vector for analysis instead of the standard deviation[14] and the root mean square value [15]. The advantages of thismethod are lower computational cost and better anti-noise perfor-mance. To avoid unnecessary computation cost, an efficient ap-proach to find the Minimum Decomposition Level (MDL) for theEDMRA method is discussed in detail in this section. Since differentwavelets have different characteristics and different computationalcost, the selection of appropriate wavelets is also discussed in thissection. Section 4 discusses the performance of the EDMRA methodin different noisy environments. Gaussian white noise and bandlimited spectrum noise are taken into account for analysis andMonte-Carlo methods are used. Finally, a conclusion is given inSection 5.
Fig. 2. Nested subspaces of MRA.
2. Wavelet transform and MRA
Mathematics of the wavelet transform was extensively studiedand can be referred in [20,21]. Unlike the Short Time Fourier Trans-form (STFT) with a fixed window function, the wavelet transforminvolves a varied time–frequency window and can provide goodlocalization property in both time and frequency domain, whichyields nice performance in analyzing PQ disturbances. Fig. 1a andb gives the time–frequency characteristic of STFT and wavelet
transform, respectively [7]. From Fig. 1a we can see, that the STFThas a fixed time–frequency window (Dt and Df), which means it islacking flexibility. However, the wavelet transform can providevaried time–frequency windows at different scales (Fig. 1b). Thisenables users to choose a proper window to see signals at differentresolutions. This is the main advantages of wavelet transformscomparing with the STFT.
The MRA was introduced by Mallat in [22]. Define Vj; j 2ZðintegersÞ as a sequence of linear subspaces. The MRA can bedescribed through a nested subspaces spanned by a single scalingfunction / together with its translates and dilates /ð2mt � kÞ,
� � � � V�2 � V�1 � V0 � V1 � V2 � � � � � L2 ð1Þ
or Vj � Vjþ1 for all j 2 Z and [jV j ¼ L2 and \jV j ¼ f0g.From Eq. (1) we can see that, as j goes to infinity, Vj enlarges to
become all energy signals (L2), as j goes to negative infinity, Vj
shrinks down to only zero.For every j 2 Z, define Wj to be the orthogonal complement of Vj
in Vj+1, then
Vjþ1 ¼ Vj �Wj and Wj ?Wj0 if j – j0: ð2Þ
The above Eqs. (1) and (2) can be visualized in Fig. 2. In MRA,any time series x(t) can be completely decomposed in terms ofthe approximations, provided by scaling functions /m;nðtÞ and thedetails, provided by the wavelets wm;nðtÞ, where
260 H. He et al. / Electrical Power and Energy Systems 31 (2009) 258–268
The approximations are the low-frequency components of thetime series and the details are the high-frequency components.MRA leads to a hierarchical fast scheme. This can be implementedby a set of successive filter banks as described in [20]. In this way,the decomposition of signal x(t) can be expressed as
are called the approximation and detail at level m, respectively.anm ¼
R1�1 f ðtÞ/mnðtÞdt and bmn ¼
R1�1 f ðtÞwmnðtÞdt are called scaling
and wavelet coefficients, respectively.
3. The proposed EDMRA approach: method, performance andcost
3.1. Energy difference of MRA (EDMRA) method
From the above analysis we can see, the characteristics of theoriginal waveform can be reflected in different scales after theMRA decomposition. Based on this observation, we can constructthe feature vector to detect different kinds of PQ disturbances. Thisidea is shown in Fig. 3. The sampled waveform was decomposedinto different resolution levels (i) according to MRA. Then the en-ergy of the detail information at each decomposition level i is cal-culated according to the following equation:
Ei ¼XN
j¼1
jDijj2; i ¼ 1; . . . ; l ð6Þ
where Dij ¼ bij; i ¼ 1; . . . ; l is the wavelet (detail) coefficients inwavelet decomposition from level 1 to level l. N is the total numberof the coefficients at each decomposition level and Ei is the energyof the detail at decomposition level i. In order to identify differentkinds of PQ disturbances, the energy difference (ED) at each decom-position level is calculated, which is the difference of the energy Ei
with the corresponding energy of the reference (normal) waveformat this level Eref ðiÞ,
EDi ¼ Ei � Eref ðiÞ ð7Þ
By observing this EDi feature vector at different resolution levelsand following the criterion proposed later in this section, one caneffectively detect, localize and classify different kinds of PQdisturbances. This method is named as Energy Difference of MRA
Fig. 3. EDMRA syste
(EDMRA) method. The major advantages of this method includetwo aspects. The first one is that by using this method, one can sig-nificantly reduce the dimensionality of the analyzed data. As wecan see from Fig. 3, for a l levels multiresolution decomposition,only a l-dimensional feature vector need to be observed. This is asignificant reduction compared to the original sampled waveform.The second advantage is that this method keeps all the necessarycharacteristics of the original waveform for analysis. Different PQcharacteristics are represented by the energy difference at differentresolution scale, which provides an effective way for differenttypes of PQ detection.
Fig. 4 shows a normal pure sine wave (60 Hz) and its four typesof typical PQ disturbances: low frequency distortion, high fre-quency distortion, voltage sag and voltage swell. Sampling fre-quency used is 5 kHz. These PQ disturbance models are based onthe IEEE Standard 1159-1995 (IEEE Recommended Practice forMonitoring Electric Power Quality) [26], which are widely adoptedin the academic and industry community [15,19]. Specifically, forthe short duration variations, the typical duration for voltage sagis from 0.5 to 30 cycles with the voltage magnitude between 0.1and 0.9 pu, while the typical duration for voltage swell is from0.5 to 30 cycles with the voltage magnitude between 1.1 and1.8 pu. For the frequency distortions, the typical spectral contentfor low frequency distortion is less than 5 KHz with the voltagemagnitude of 0–4 pu, while for the high frequency distortions,the typical spectral content is between 0.5 and 5 MHz with thevoltage magnitude of 0–4 pu. A detailed discussion of these typicalPQ characteristics can be found in [26] and detailed mathematicalmodels can also be found in [19]. In our current study, we use theDaubechies 4 (Db4) wavelets and 12 levels decomposition for anal-ysis. Since it is well known that wavelet transform can localize thetime information for PQ disturbances, we will focus on the charac-teristics analysis and performance evaluation of the proposedEDMRA method. Interested audiences can refer to paper [14,18]for the detection of the beginning and ending time of the powerquality disturbance. Fig. 5 give the EDMRA analysis result to thesignals in Fig. 4a–d, where the horizontal axis represents thedecomposition level (scale) and the vertical axis is the energy dif-ference as defined in Eq. (7).
Based on the analysis result in Fig. 5, the following criteria areproposed for detecting and classifying different kinds of PQdisturbances.
Conjecture 1:
(1) If the peak-value of the ED is located at scale 6 (curve c andd), it is an amplitude distortion, which means either swell orsag disturbance. Otherwise, it is a frequency distortion.
(2) If the triangle (peak-value) is concave downward (curve d,negative ED), the distortion is a swell. If the triangle is con-cave upward (curve c, positive ED), the distortion is a sag.
m architecture.
Fig. 5. EDMRA analysis result for the signal in Fig 4.
Fig. 4. Original normal waveform and its distortion signal. (a) Low frequency distortion; (b) high frequency distortion; (c) voltage sag from 0.08 s to 0.196 s; (d) voltage swellfrom 0.104 s to 0.24 s.
H. He et al. / Electrical Power and Energy Systems 31 (2009) 258–268 261
(3) If the peak-value is at scale smaller than 6 (curve b), it is ahigh-frequency disturbance.
(4) If the peak-value is at scale higher than 6 (curve a), it is alow-frequency disturbance.
One thing should be noted here is that the reference scale 6 isrelated to the sample frequency fs and normal frequency of thepower signal (50 Hz or 60 Hz), this will be discussed in detail inSection 3.3.
3.2. Study of Joint impact of the frequency distortion and amplitudedistortion
In the above Section 3.1, we consider the frequency distortionand amplitude distortion separately. In practical electrical distribu-tion network, the distorted signal may contain both of these two
kinds of distortions. In this part, we study the joint impact of thesetwo distortions for the proposed EDMRA method.
Fig. 6 shows the joint impact of the frequency and amplitudedistortions. The upper part of Fig. 6 is the signal sag during 0.08–0.196 s combined with a low frequency distortion. The lower partof Fig. 6 is the signal swell during 0.104–0.24 s with a high fre-quency distortion. To illustrate the effectiveness of the wavelettransform for detection of the beginning and ending time of thesag and swell in this situation, we use the first level detail informa-tion of the wavelet decomposition to localize the time information.Fig. 7 shows the analysis results and we can see the beginning andending time of the sag and swell are effectively detected in thiscase.
Fig. 8 shows the analysis results for the proposed EDMRA meth-od with wavelet decomposition at level 12. Comparing Figs. 8 and5, we conclude that the EDMAR method still maintains all the
Fig. 6. Joint impact of the frequency distortion and amplitude distortion.
Fig. 7. First level detail information of the signal in Fig. 6.
262 H. He et al. / Electrical Power and Energy Systems 31 (2009) 258–268
characteristic points to correctly classify different kinds of PQdisturbances. Based on the justification criteria proposed in thispaper, we can say that curve 1 represents the sag in a low fre-quency distortion and curve 2 is the swell in a high frequencydistortion.
3.3. Determination of the MDL
Using the methodology presented so far, we can detect, localizeand classify different kinds of PQ disturbances based on the EDM-
Fig. 8. EDMRA analysis result for the joint
RA method. However, how many levels of decomposition are en-ough for the EDMRA method to be effective? Obviously, morelevels of decomposition will increase the computational cost. Inthis part, we aim to find the Minimum Decomposition Level(MDL) for the proposed method and modify the above evaluationcriterions to be universal.
In MRA, since both the high pass filter and the low pass filter arehalf band, the decomposition in frequency domain for a signalsampled with the sample frequency fs can be demonstrated inFig. 9. Assuming the total decomposition levels for EDMRA method
distortion of frequency and amplitude.
Fig. 9. The wavelet decomposition in the frequency domain.
Table 1Frequency range of the MRA decomposition.
Decomposition level (l) Frequency range
Approximation information (A) Detail information (D)
1 0 � fs/22 fs/22 � fs/21
2 0 � fs/23 fs/23 � fs/22
. . . . . . . . .
n 0 � fs/2n+1 fs/2n+1 � fs/2n
H. He et al. / Electrical Power and Energy Systems 31 (2009) 258–268 263
is l, Table 1 shows the frequency range at each decomposition levelbased on the frequency decomposition shown in Fig. 9.
In the proposed EDMRA method, only the detail information ateach decomposition level is needed. Assuming that the normal ref-erence frequency of the power signal is fref (50 Hz or 60 Hz) and wewant to locate the energy of this reference signal at level N. Accord-ing to Table 1, we have
fs=2Nþ16 fref 6 fs=2N ð8Þ
From Eq. (8), we get
log2ðfs=fref Þ � 1 6 N 6 log2ðfs=fref Þ ð9Þ
Since we need to locate the energy of the reference frequency atthe center of the final result (level 6 as shown in Fig. 5), the MDLfor the EDMRA methods, denoted as Nmin, is found by
Nmin ¼ 2 � N ð10Þ
For instance, in Fig. 4, sampling frequency fs = 5000 Hz,fref = 60 Hz, according to Eq. (9), we get:
Fig. 10. Classification result
5:3808 < N < 6:3808 ð11Þ
we should choose N = 6. According to Eq. (10), we getNmin ¼ 2 � N ¼ 12. This is the reason why we choose 12 levels ofdecomposition in Fig. 5 and why the evaluation reference scale is6 in the criteria proposed in Section 3.1.
For any actual sampled signal, Eqs. (9) and (10) give the mostefficient way of finding the decomposition levels for the EDMRAmethod. For example, if we sample the same waveform in Fig. 4by sampling frequency fs = 2500 Hz, we find only 10 levels ofdecomposition is necessary according to Eqs. (9) and (10). Fig. 10gives the analysis result of 10 levels decomposition for the samesignal as shown in Fig. 4. Comparing the analysis results in Figs.10 and 5, we can see that, 10 levels decomposition is enough forclassification varies type of PQ disturbances in this situation(fs = 2500 Hz). In this way, we saved about 17% of the computa-tional time compared to the 12 levels of decomposition.
Now, we can modify the evaluation criterions in Section 3.1 to auniversal form:
Conjecture 2:
(1) If the peak-value of the ED is located at scale of Nmin=2, thedisturbance is either sag or swell (negative ED means swelland positive ED means sag).
(2) If the peak-value is at a scale smaller than Nmin=2, the distur-bance is high frequency distortion; otherwise, it is a low fre-quency distortion.
The regions of this classification are shown in Fig. 10.
of the EDMRA method.
Table 2Wavelet characteristics.
Wavelet name Orthogonal Compactsupport
Supportwidth
Filterslength
Symmetry
Haar Yes Yes 1 2 YesDaubechies Yes Yes 2N-1 2N Far fromCoiflets Yes Yes 6N-1 6N Near fromSymlets Yes Yes 2N-1 2N Near from
264 H. He et al. / Electrical Power and Energy Systems 31 (2009) 258–268
3.4. Choice of a suitable wavelet
It is well known that the choice of the appropriate wavelet isvery important for all the wavelet based PQ analyses [4,16]. In thispart, we investigate the influence of different kinds of wavelets tothe proposed EDMRA method.
Fig. 11. EDMRA analysis result
Four commonly used wavelets, namely, Daubechies wavelets,Symlets and Coiflets wavelet are taken into account. Notice thatthe Haar wavelets are Daubechies wavelets with N = 1. Table 2shows their corresponding features and Fig. 11a–d is the EDMRAanalysis result to the previous distorted signal in Fig. 4(fs = 5000 Hz, MDL = 12).
From Fig. 11a–d we can see, that although different waveletshave some influence of the final analysis result, all these wave-lets keep good resolution to classify various type of PQ distur-bances. By these means, we can claim that the EDMRA methodhas good robustness characteristics. However, it is very impor-tant to evaluate corresponding computational cost of differentwavelets. This will provide useful information for actual applica-tion, considering the tradeoff between performance and timecost.
s with different wavelets.
Table 3Computational time for different wavelets.
Wavelets Number of filter coefficients Computational time (s) Dt% Wavelets Number of filter coefficients Computational time (s) Dt%
H. He et al. / Electrical Power and Energy Systems 31 (2009) 258–268 265
Assume that the input discrete signal x(t) is represented by avector of length N = 2K. The DWT using a wavelet with M filter coef-ficients, we need to compute
yA½n� ¼X1
k¼�1xðkÞc½2n� k� ¼
XM�1
k¼0
c½k�x½2n� k�; ð12Þ
yD½n� ¼X1
k¼�1xðkÞh½2n� k� ¼
XM�1
k¼0
h½k�x½2n� k�; ð13Þ
where yA is the low pass component (approximation) and yD is thehigh pass component (details) and c[k] and d[k] are the low pass(approximation) filter and high pass (detail) filter coefficients as de-fined in the dilation equations:
/ðtÞ ¼XM�1
k¼0
c½k�/ðt � kÞ and w ¼XM�1
k¼0
h½k�/ðt � kÞ; ð14Þ
where h½k� ¼ ð�1Þkc½M � k�, M is the filter length (total number offilter coefficients). Notice that when the DWT applied to discretesignal (a vector), the computation is simply the convolution oftwo vectors, the signal and the filter coefficients. After a type ofwavelets is chosen, the length of wavelet filter will be kept the sameat all levels. For this reason, the computation complexity is mainlydependent on the length of the wavelet filters. Since the motherwavelet produces all wavelet functions (via the dilation equations)used in the transformation through translation and scaling, it deter-mines the characteristics (such as smoothness, symmetry) of theresulting Wavelet Transform. Therefore, the details of a particularapplication should be taken into account and the appropriatemother wavelet should be chosen in order to use wavelet transformeffectively. For example, the Coiflets have important near symmetryproperty which is highly desired in image processing, since theycorrespond with nearly linear phased filters. Certainly, if the com-putational complexity is the only factor under consideration, the fil-ter length should be chosen as short as possible.
From Section 2, we see that, the time complexity is proportionalto the number of filter coefficients, thus wavelets with larger num-ber of coefficient take longer time to compute. To gain empiricalunderstanding of the computational complexity of different wave-let families, we conducted the experiments in Matlab 6.2 by IntelPentium 4 1.8 GHz processor using a stopwatch timer. The compu-tational time for Haar wavelet is chosen as the base for evaluationand we define the following variable Dt% for reference
Dt% ¼ twavelets � tHaar
tHaar; ð15Þ
where twavelets means the EDMRA method computational time bythe specific choosing wavelets, thaar is the reference computationtime of the EDMRA method by Haar wavelet. Dt% means how muchmore computational time should the specific choice of waveletneeded for EDMRA method compared to that of Haar wavelet. Basedon the above definition, Table 3 gives the results according to Eq.(15).
Based on the data in Table 3, although Haar wavelet has thesmallest computational cost, further investigation shows that Haar
wavelet has difficulty to localize the time information for thebeginning and ending time of the disturbance. Therefore, in the sit-uation that the classification of different kinds of PQ disturbancesis the only concerned issue, we can choose Haar wavelet for EDM-RA method to avoid unnecessary computational cost. Otherwise,based on the data in Table 3, we recommend using wavelets withshorter filter length, such as Db2, Sym2 or Coif1 wavelets for prac-tical application since they have relatively smaller computationalcost as well as more reliable analysis performance. Of course, thiskind of selection should also be based on their noise tolerance per-formance in actual applications, which will be discussed in detailin Section 4.
4. Noise tolerance analysis for EDMRA method
Since noise is omnipresent in electrical power distribution net-works, we analyze whether the proposed EDMRA method is stilleffective in a noisy environment. Two types of noise, namelyGaussian white noise and band limited spectrum noise areconsidered.
4.1. Gaussian white noise
Gaussian white noise was considered in papers [18,23,24] forpower quality disturbance analysis. In this section, we supposethat the noise riding on the sampled signal for EDMRA analysis iswhite Gaussian distribution. Here we focus on the detection andclassification of different kinds of PQ disturbances under differentsignal to noise ratio (SNR). A detailed discussion about the localiza-tion of the beginning and ending time of the disturbances in noiseenvironment can be referred in paper [18], in which an adaptivethreshold of wavelet analysis is proposed to eliminate the noiseinfluence.
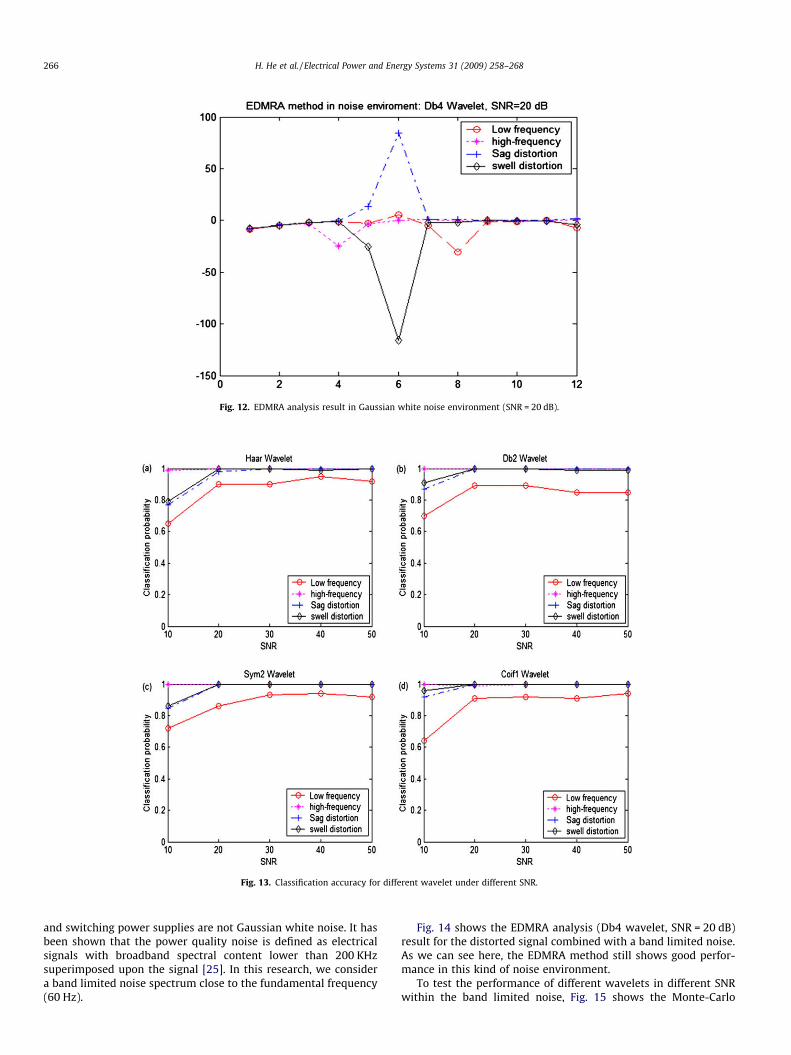
Fig. 12 shows the EDMRA analysis result for the signal in Fig. 4in the noisy environment with SNR = 20 dB. Comparing Fig. 12 withFig. 5 we can see, the EDMRA method has good anti-noise perfor-mance and allow us to correctly classify different kinds of PQ dis-turbances in the noisy environment.
To test the EDMRA method performance in different noise envi-ronments, we use Monte-Carlo method to get the average correctclassification rate when SNR varied from 20 dB to 50 dB. The valueof SNR is defined as follows
SNR ¼ 10 logðPs=PnÞdB; ð16Þ
where Ps is the power (variance) of the signal and Pn is that of thenoise. For each PQ disturbance, 100 cases with different parameterswere simulated for each choice of wavelets. The average correctclassification rate according to the evaluation criteria proposed inSection 3 is calculated for different wavelets under different SNR.The test results are shown in Fig. 13a–d.
4.2. Band limited spectrum noise
In real electrical distribution networks, noise caused by powerelectronic devices, control circuits, loads with solid-state rectifiers
Fig. 12. EDMRA analysis result in Gaussian white noise environment (SNR = 20 dB).
Fig. 13. Classification accuracy for different wavelet under different SNR.
266 H. He et al. / Electrical Power and Energy Systems 31 (2009) 258–268
and switching power supplies are not Gaussian white noise. It hasbeen shown that the power quality noise is defined as electricalsignals with broadband spectral content lower than 200 KHzsuperimposed upon the signal [25]. In this research, we considera band limited noise spectrum close to the fundamental frequency(60 Hz).
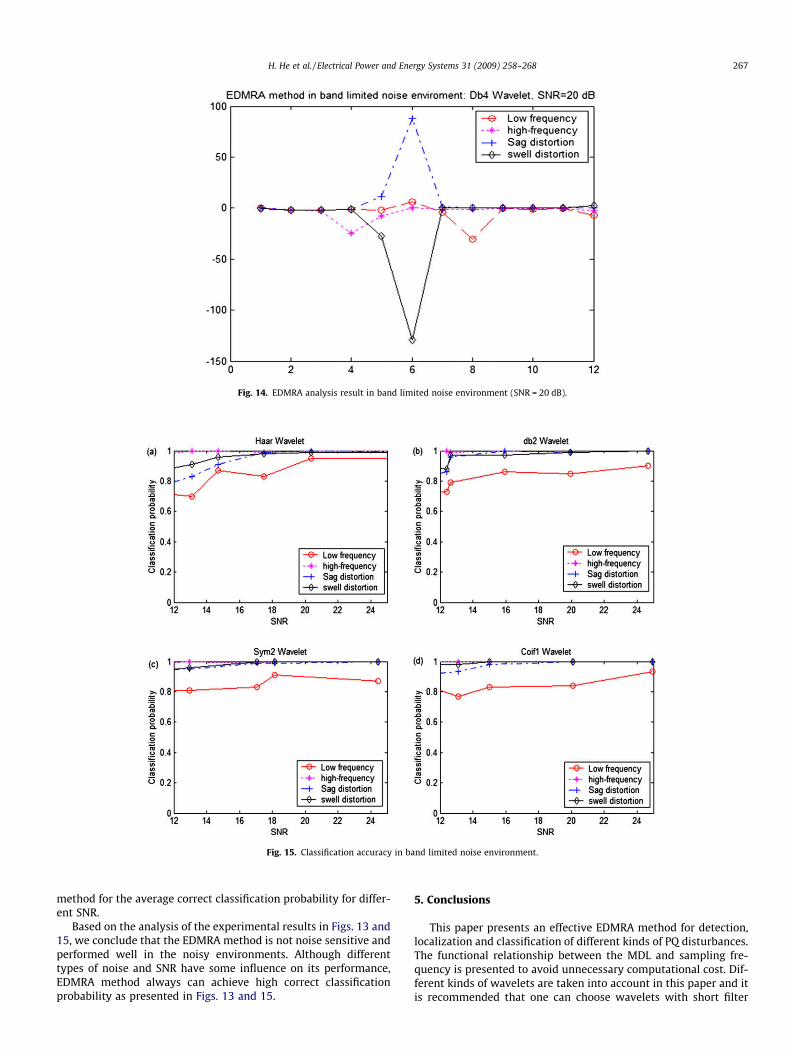
Fig. 14 shows the EDMRA analysis (Db4 wavelet, SNR = 20 dB)result for the distorted signal combined with a band limited noise.As we can see here, the EDMRA method still shows good perfor-mance in this kind of noise environment.
To test the performance of different wavelets in different SNRwithin the band limited noise, Fig. 15 shows the Monte-Carlo
Fig. 14. EDMRA analysis result in band limited noise environment (SNR = 20 dB).
Fig. 15. Classification accuracy in band limited noise environment.
H. He et al. / Electrical Power and Energy Systems 31 (2009) 258–268 267
method for the average correct classification probability for differ-ent SNR.
Based on the analysis of the experimental results in Figs. 13 and15, we conclude that the EDMRA method is not noise sensitive andperformed well in the noisy environments. Although differenttypes of noise and SNR have some influence on its performance,EDMRA method always can achieve high correct classificationprobability as presented in Figs. 13 and 15.
5. Conclusions
This paper presents an effective EDMRA method for detection,localization and classification of different kinds of PQ disturbances.The functional relationship between the MDL and sampling fre-quency is presented to avoid unnecessary computational cost. Dif-ferent kinds of wavelets are taken into account in this paper and itis recommended that one can choose wavelets with short filter
268 H. He et al. / Electrical Power and Energy Systems 31 (2009) 258–268
length, such as Db2, Sym2 or Coif 1 for practical applications basedon their satisfactory performance as well as lower computationalcost. Finally, two types of noise, named Gaussian white noise andband limited spectrum noise, are considered in the analysis.Monte-Carlo simulations are used to show the effectiveness ofthe proposed method in different noise environments empirically.
References
[1] Sullivan MJ, Vardell T, Johnson M. Power interruption costs to industrial andcommercial consumers of electricity. IEEE Trans Ind Appl 1997;33(6):1448–58.
[2] Consortium for electrical infrastructure to support a digital society, the cost ofpower disturbance to Industrial and Digital Economy Companies. An initiativeby EPRI and the Electrical Innovation Institute; June 2001.
[3] US–Canada power system outage task force. Final report on the August, 14,2003 blackout in the United States and Canada: causes and recommendations;April 2004. p. 1–4.
[4] Hamid EY, Kawasaki ZI. Wavelet-based data compression of power systemdisturbances using the minimum description length criterion. IEEE TransPower Deliv 2002;17(2):460–6.
[5] Dash PK, Panigrahi BK, Sahoo DK, Panda G. Power quality disturbance datacompression, detection, and classification using integrated spline wavelet andS-transform. IEEE Trans Power Deliv 2003;18(2):595–600.
[6] Panda G, Dash PK, Pradhan AK, Meher SK. Data compression of power qualityevents using the Slantlet transform. IEEE Trans Power Deliv 2002;17(2):662–7.
[7] Poisson O, Rioual P, Meunier M. New signal processing tools applied to powerquality analysis. IEEE Trans Power Deliv 1999;14(2):561–6.
[8] Poisson O, Rioual P, Meunier M. Detection and measurement of power qualitydisturbance using wavelet transform. IEEE Trans Power Deliv 2000;15(3).
[9] Santoso S, Grady WM, Powers EJ, Lamoree J, Bhatt SC. Characterization ofdistribution power quality events with Fourier and wavelet transform. IEEETrans Power Deliv 2000;15(1):247–54.
[10] Dash PK, Panigrahi BK, Panda G. Power quality analysis using S-transform. IEEETrans Power Deliv 2003;18(2):406–11.
[11] Karimi M, Mokhtari H, Iravani MR. Wavelet based on-line disturbancedetection for power quality application. IEEE Trans Power Deliv 2000;15(4):1212–20.
[12] Mokhtari H, Ghartemani MK, Iravani MR . Experimental performanceevaluation of a wavelet-based on-line voltage detection method for powerquality application. IEEE Trans Power Deliv 2002;17(1):161–72.
[13] Elmitwally A, Abdelkader S, Elkateb M. Universal power quality managerwith a new control scheme. IEE Proc – Gen Transm Distrib 2000;147(3):183–9.
[14] Gaouda AM, Salam MMA, Sultan MR, Chikhani AY. Power quality detection andclassification using wavelet-multiresolution signal decomposition. IEEE TransPower Deliv 1999;14(4):1469–76.
[16] Santoso S, Powers EJ, Grady WM, Hofmann P. Power quality assessment viawavelet transform analysis. IEEE Trans Power Deliv 1996;11(2):924–30.
[17] Liao Y, Lee JB. A fuzzy-expert system for classifying power qualitydisturbances. Int J Electr Power Energy Syst 2004;26:199–205.
[18] Yang HT, Liao C-C. A de-noising scheme for enhancing wavelet-based powerquality monitoring system. IEEE Trans Power Deliv 2001;16(3):353–60.
[19] He H, Starzyk JA. A self organizing learning array system for power qualityclassification based on wavelet transform. IEEE Trans Power Deliv2006;21:286–95.
[20] Daubechies I. Ten lectures on wavelets. Philadelphia, PA, USA: Society forIndustrial and Applied Mathematics; 1992.
[21] Burrus CS, Gopinath RA, Guo H. Introduction to wavelets and wavelettransforms: a primer. Prentice Hall; 1998.
[22] Mallat S. A theory for multiresolution signal decomposition: the waveletrepresentation. IEEE Trans PAM 1989;11:674–93.
[23] Zhang H, Liu P, Malik OP. Detection and classification of power qualitydisturbances in noisy conditions. IEE Proc – Gen Transm Distrib2003;150(5):567–72.
[24] O’shea P. A high-resolution spectral analysis algorithm for power-systemdisturbance monitoring. IEEE Trans Power Syst 2002;17(3):676–80.
[25] Dugan RC, Mcgranaghan MF, Santoso S, Beaty HW. Electrical power systemsquality. McGraw-Hill; 2002. p. 28–9.
[26] IEEE standards coordinating committee 22 on power quality, IEEErecommended practice for monitoring electric power quality. IEEE Std 1159-1995. The Institute of Electrical and Electronics Engineers Inc.; 1995. ISBN:1-55937-549-3.