47
Electrical upgrading of biogas EUDP 12 II

Electrical upgrading of biogas
EUDP 12 II

2
Table of Contents
1. SUMMARY 3
1.1 Project details 3
1.2 Short description of project objective and results 3
1.3 Executive summary 4
2. PROJECT OBJECTIVES 5
2.1 Objectives 5
2.2 Main timelines of the project 6
3. PROJECT RESULTS 7
3.1 Plant design 7
3.2 SOEC performance 14
3.3 Methanator performance 16
3.4 Gas quality 19
3.5 Design of full scale plant 24
3.6 Economic analysis 25
3.7 Socio-economic analysis 25
3.8 Private investor perspective 32
3.9 Dissemination of results 43
3.10 Utilization of project results 43
4. PROJECT CONCLUSION AND PERSPECTIVE 45
4.2 Appendix 47
3
1. Summary
1.1 Project details
Project title El upgraded Biogas
Project identification (pro-gram abbrev. and file)
Name of the programmewhich has funded the project
EUDP 12 II
Project managing com-pany/institution (name andaddress)
Haldor Topsøe A/SHaldor Topsøe Alle 1Dk-2800 Kgs. Lyngby
Project partnersHaldor Topsøe A/SAarhus UniversitetHMNNatureEnergyEnergiMidtDGCEa energianalysePlanenergi
CVR (central business register) 41853816
Date for submission 28.02.2018
1.2 Short description of project objective and results
Projektet skulle i en skala på 10 Nm3/h demonstrere en højeffektiv proces til opgradering afrå biogas til rørledningskvalitet ved katalytisk omsætning af CO2 i biogas til metan ved reak-tion med brint produceret med dampelektrolyse i en SOEC elektrolyse enhed.Et fuldskala anlæg skulle designes og de økonomiske aspekter evalueres.
Disse mål er nået på trods af mange problemer med især hjælpeudstyr. Produktion af gasmed mere end 97 % CH4 er blevet demonstreret. Metanatoren har fungeret som forventetog med uændret ydelse gennem projektet, hvilket bekræfter at afsvovlingsenhederne ogsåhar fungeret som planlagt.
Den høje effektivitet for SOEC enheden er blevet verificeret med mere end 2200 akkumule-rede driftstimer.
De økonomiske analyser har vist at el opgraderedet gas kan blive socio-økonomisk attraktiv ifremtidige energisystemer domineret af vedvarende energikilder og drevet af en høj CO2
pris (800 kr./ton). Privatøkonomisk er processen attraktiv, hvis den producerede ekstra me-tan kunne opnår samme støtte som traditionel opgraderet biogas.
The project should on a scale of 10 Nm3/h demonstrate highly efficient upgrading of biogasto pipeline quality by catalytic conversion of the CO2 content in the biogas to methane by re-action with hydrogen generated from steam in a Solid Oxide Electrolyzer. A full scale plantshould be designed and the economic aspects evaluated.

4
These project objectives have been met despite numerous problems related to supportingequipment. Production of pipeline quality gas with more than 97 % CH4 has been demon-strated and the performance of the methanator catalyst unchanged throughout the projectverifying that the desulfurization catalysts also have performed as planned.
More than 2200 accumulated operating hours have been demonstrated and high efficiencyfor the SOEC stacks.
System analyses indicate that el upgraded biogas can become socio economically attractivein future energy system dominated by renewable energy sources and driven by high CO2
prices (800 Dkr./tonne). If the produced methane, however, would benefit from the same in-centive as biogas upgraded by classical means the process would be attractive from a privateinvestment perspective.
1.3 Executive summary
A 10 Nm3/h biogas upgrading demonstration unit has been designed, constructed and oper-ated at Aarhus university’s biogas plant in Foulum.
A 50 kW SOEC unit using 8 stacks in two stack assembly units have generated approx. 16Nm3/h of hydrogen, which was used to convert the approx. 43 % CO2 in the desulfurized bio-gas catalytically to methane in a boiling water reactor.
Despite numerous problems with supporting equipment, notably the hydrogen compressor,more than 2000 hours of accumulated operating have been achieved with the SOEC stacks.After some initial fast degradation for the first 500 hours the performance of the stacks hasbeen rather stable. The stack degradation has successfully been mitigated by an operatingstrategy where the inlet temperature gradually has been increased. In this way the produc-tion rate can be kept constant with unchanged high efficiency. The very low stack power con-sumption of around 3.1 kWh/Nm3 hydrogen produced has been confirmed.
The methanator performance has been excellent and pipeline quality gas produced. Therehas been no change in performance as indicated by the temperature profiles. This impliesthat no degradation by thermal ageing or poisoning of the methanator has occurred con-firmings perfect operation of the desulfurization system.
It takes 10-11 hours to heat up the SOEC from cold and 6-8 hours for the methanator. Oper-ating load from hot stand-by can be changed within seconds for the SOEC units and a fewminutes for the methanator.
The unit has been remotely controlled most of the time.
A full scale commercial plant has been designed and cost estimated. The following efficien-cies has been calculated:
ConfigurationPercent effciency
ACO2 Meth.
Exergy eff gas 80.2District heating 0.8Oxygen 2.1Exergy eff Total 83.1LHV eff gas 76.3LHV DH 14.0LHV eff total 90.3
5
Based on these results the economy has been evaluated both from a socio-economic as wellas from a private investment perspective.
The overall conclusions from the socio economic study are:
· In an energy system dominated by renewable electricity production and high CO2
price (800 kr.7ton as predicted by IEA) el upgraded biogas via SOEC can outcompetenatural gas, simple upgraded biogas or SNG from thermal gasification
· The socio economic gain in Denmark would be 350 mio kr. per year or 40 kr./GJ perGJ extra methane produced
· The amount of renewable methane from biogas production is increased by approxi-mately 30 % by using el upgrading
· The SOEC unit should operate at full load for 4600 – 4800 hours per year where theaverage weighted electricity price is 109 kr./MWh
· There exists a strong synergy with biogas engines for CHP production which will op-erate in the hours with high electricity prices
· The above scenario will not be realized in the near future but could be towards 2050
The results of this private investment economic study strongly indicate that methanation ofbiogas using hydrogen from SOEC can be economical if some conditions are fulfilled:
· The electricity price to the SOEC is no higher than 250-350 DKK/MWh on an annualaverage basis (the exact value depends on the hourly price distribution and on thechoice of a back-up option for biogas consumption).
· The produced SNG can be sold at a price of 6.00 DKK/Nm3 or higher.· The steam output from the methanation is utilized as an input for the SOEC process.
2. Project objectives
2.1 Objectives
The project objectives were:
· To design and construct a demonstration unit for upgrading 10 Nm3/h of raw biogasto pipeline quality BNG (Bio natural gas) by means of SOEC electrolysis and catalyticmethanation of the CO2 in the desulphurized biogas with hydrogen from the SOECunit
The purpose of the unit is to:
· Demonstrate that the SNG product can meet the Danish natural gas pipeline gridspecification
· Demonstrate that the SOEC unit and the bio-SNG unit can operate independently dueto the hydrogen storage.
· Demonstrate the bio-SNG and SOEC technologies can operate at continued and sta-ble conditions.
· Evaluate the performance of the bulk sulfur absorbers.· Evaluate the performance of the final sulfur guards.· Evaluate the performance of the methanation reactor
Other objectives have been:
· Based on the experimental results evaluate the economics of the process both from asocio-economic and a private investors perspective

6
· Update the business plans for deploying the process
2.2 Main timelines of the project
Establishment of a consortium and supply agreements took much longer than anticipated(>9 months). Haldor Topsøe A/S then performed the detailed design of the demonstrationunit using their standard, proprietary design tool and documentation. This formed the basisfor issuing bid material for the construction of the BioSNG unit. After negotiations, Zeton inthe Netherlands was chosen to construct the unit. In parallel a prereforming SOFC test unitwas revamped by FuelCon in Germany to serve as test platform for the SOEC core. A Danishcompany, Vengcon, supplied the power supplies and control system for the SOEC Cores. Hal-dor Topsøe A/S separately purchased the biogas and hydrogen compressors from SERA inthe UK.
Factory acceptance tests were performed on the BioSNG unit and SOEC unit in Holland andat Haldor Topsøe premises in Kgs. Lyngby respectively.
The BioSNG unit and the compressors were then shipped to Aarhus University’s site in Fou-lum and assembled in a building adjacent to their biogas production plant in January-March,2016.
A complete start up and operation was performed with SOEC unit at Topsøe, before the en-tire unit was shipped to Foulum and tied in to the rest of the unit(s) in April 2016. The start-up procedures were refined and the first production of upgraded biogas occurred beginningof June, 2016. A timeline of the major events throughout 2016 and 2017 are provided asFigure 2-1 and Figure 2-2.
The complete demonstration unit is the first of its kind in the world and also the first wheretwo cores with 4 SOEC stacks each has been operated in tandem so it was to be expectedthat some integration issues had to be resolved, but numerous unexpected problems withthe balance of plant equipment had to be addressed as illustrated on Figure 2-1 and Figure2-2. Some of the less trivial and most time consuming has been:
1. Rupture on the membranes in the hydrogen compressor. The expected lifetime wasquoted to be at least 4000 hours and experience with a similar compressor at Topsøeconfirm this to be achievable. Nevertheless, operating time less than a 1000 hourshas been experienced causing prolonged downtime due to excessive delivery timesfor spare parts. The vendor has sent technical representative which went over theoperating procedures but could not identify any root cause of the problems.
2. The inter stage water separators on the compressors have also caused an unduenumber of trips.
3. Totally unexpected has been the occurrence of several total power failures on thegrid.
4. The control of the steam generator in the SOEC unit was far from optimum resultingin a number trips when too low temperatures exit the generator resulted in systemshut down to prevent liquid water ingress to the stacks
Unfortunately, some of the BOP problems have caused catastrophic stacks failures:
· Due to a malfunctioning trip system in the SOEC unit hot stacks was mechanicallyweakened by ingress of cold, liquid water from the water pumps.
· A breakdown in one of the power supply unit caused one stack group to operate as abattery during start up: the current was running in reverse making the stacks oper-ate in fuel cell mode and using the nickel in the electrodes as fuel. This operationmode of course destroyed the stacks
· A number of stacks were also weakened mechanically by being subjected to abruptpressure differential (up to 0.5 bar abs) when switching from venting the producedhydrogen to sending it through the compressor. The mechanical weakening has

7
probably induced micro cracks in the 10 µ thick electrolyte, which developed intoleaks that resulted in exotherms with stack temperatures exceeding 825 °C ulti-mately causing shutdown of the units(s).
These, and other minor problems, has caused delays to the original time planning and lim-ited the number of accumulated operating hours.
The stacks replacement has caused a substantial budget overrun, but the extra costs hasbeen covered entirely by Haldor Topsøe A/S internal funding.
Many of the issues have been addressed by improved operating procedures and software so-lutions, but others will need to be addressed by more aggressive, preventive maintenancemeasures, which will be implemented in a continuation of the project aiming at bringing theSOEC technology from TRL level 6 to 8.
The milestones agreed upon was, nevertheless, all implemented although the milestone con-cerning transient operation could have been implemented in a more systematic manner.
Figure 2-1: Timeline 2016. The gray bar indicate the total time required for each item,whereas blue indicate the actual on site tooltime (time awaiting parts and repair at 3rd partyworkshops have been subtracted in the blue bar).
Figure 2-2: Timeline 2017. The gray bar indicate the total time required for each item,whereas blue indicate the actual on site tooltime (time awaiting parts and repair at 3rd partyworkshops have been subtracted in the blue bar).
3. Project results3.1 Plant design
Haldor Topsøe A/S designed the plant using their proprietary computer software and engi-neering procedures. One objective of the project was to establish a platform so that futurescale-up to industrial scale would not require another demonstration plant. This required aminimum size to ensure correct heat transfer characteristics and linear velocities in espe-cially the methanator. On the other hand, the cost of the SOEC stacks are at present ratherhigh due to the limited production capacity and non-automated production technology. Theminimum acceptable capacity was found to be 10 Nm3/h of biogas.

8
The main process steps can be seen in the following block diagram (Figure 3-1).
Figure 3-1: Block diagram of the main processes when upgrading biogas
This el-upgraded biogas plant produces synthetic natural gas (SNG) from biogas (carbon di-oxide and methane) and hydrogen. The hydrogen is produced in a solid oxide electrolyte cell(SOEC) unit where electricity is used to produce hydrogen from water.
The el-upgraded biogas plant consists of three main units:
1. Bio-SNG unit2. H2 compressor3. SOEC unit
The bio-SNG unit consists of the following main process steps:
Bulk sulfur removalActive carbon is used for this step. The process is carried out at ambient pressure andtemperature.
CompressionThe biogas is compressed to achieve the pressure required to achieve a high methanecontent in the SNG product.
Final sulfur removalA promoted, proprietary Haldor Topsøe zinc oxide absorbent is used to remove the re-maining sulfur. This step is placed after mixing with hydrogen.
MethanationThe hydrogen and carbon dioxide is converted to methane in the methanator, which isa boiling water reactor, loaded with a high temperature tolerant nickel based catalyst.
Hydrogen storageA hydrogen storage makes it possible to operate the bio-SNG unit and the SOEC unitindependently.
Additionally, the following utilities are included in the bio-SNG unit:
Water purification unitPreparation of demineralized water (DMW) from tap water
9
Cooling water unitCirculation and temperature adjustment of cooling water to the process
Vent systemAs a safety measure a separate ATEX vent system encapsulates all process units
The SOEC unit consists of the following main process steps:
1. Evaporation of water2. Hydrogen production in the SOEC stack from water and electricity.3. Cooling of effluents and condensation out of non-converted steam
The hydrogen compressor consists of the following main process step
1. Compression2. Hydrogen export to storage vessel in the bio-SNG unit.
Hydrogen and oxygen is produced from steam in solid oxide electrolyte cells in the SOECunit. The SOEC unit consists of two cores (core A and core B). There are two parallel steamgenerators feeding the two cores.
The unit is supplied with demineralized water (DMW) and is split into two streams and thestreams are pumped to the steam generators by the DMW pumps. The steam generated issuperheated up to 200°C at 7 bar g and sent to pulsation dampers to minimize the pressurepulsations in the electrolyte cells. After the pressure has been reduced to 0.2 bar g, thesteam is mixed with small quantities of hydrogen to protect the electrolyte cells from oxida-tion of the active electrode surface.
In the cores the steam is preheated in the SOEC steam feed/effluent exchangers and thenfinally heated to the stack inlet temperature, initially 720 °C, in the SOEC steam trim heatersbefore entering the cathode side of the SOEC electrolyte cells. Each core contains 4 stackswith 75 electrolyte cells in each. The water is split into hydrogen and oxygen and the oxygenis transported in the form of oxygen ion to the anode side where they recombine to oxygen.The steam conversion is designed to be around 60 % in order to have a favorable Nernst po-tential at the exit of the stacks.
The anode side is flushed with air to reduce the oxygen concentration in the anode productstream. Idaho National Lab has identified 50 % oxygen as a safe level in the cathode off gasand this limit was adopted in the project design. Compressed air is heated in the SOEC airfeed/effluent exchangers and then subsequently heated in the SOEC air trim heaters to thesame inlet temperature as the cathode side before entering the anode side of the stacks.
The hydrogen rich stream leaving the stacks is first cooled in the SOEC steam feed/effluentexchanger and the two hydrogen rich streams from each core are combined and then furthercooled to 40 °C in the H2 water cooler. The steam condensate is removed in the steam con-densate separator and then pumped to drain by the steam condensate pump. The two hotenriched air streams from the two cores are combined and cooled in the air water cooler.
The hydrogen from the SOEC is compressed from 0 to the 43 bar g in a two stage diaphragmhydrogen compressor. As a backup to the SOEC unit, hydrogen is also available from a bat-tery of hydrogen bottles, located approximately 100 meters from bio-SNG unit. A backup hy-drogen line is feeding the bottled hydrogen to the hydrogen compressor.
The compressed hydrogen is sent from the hydrogen compressor to the hydrogen storage.Storage of hydrogen enables operation of the bio-SNG when the SOEC unit is not in opera-tion. The hydrogen storage consists of two gas cylinders with a 50 liter volume each.

10
The biogas is produced in a nearby biogas reactor at Aarhus University, Foulum and the 10Nm³/h biogas feed to the bio-SNG unit corresponds to 5-12 % of the total biogas production,depending on season. From the biogas reactor the biogas is sent to an uninsulated biogasstorage vessel, where the biogas is stored at ambient temperature. From the storage vesselthe gas is sent to the bio-SNG unit in an uninsulated underground pipeline. The water satu-ration of the biogas will depend on the ambient temperature of the air and the ground. Thebiogas enters the bio-SNG unit at 0 mbar g and 10°C. The biogas deign content is approxi-mately 56 % methane and 43 % CO2 with a balance of nitrogen.
The raw biogas design content is on average, 1000 ppmv sulfur compounds, mainly H2S, butalso organic sulfur compounds are present. Sulfur will poison and deactivate the catalyst inthe methanation reactor. Thus, any sulfur present in the feed must be removed.
The bulk part of the sulfur compounds is absorbed on active carbon in the bulk sulfur re-moval section. The active carbon has an optimal sulfur uptake at temperatures between10°C and 55°C, a water saturation between 10% and 90% and an oxygen to sulfur ratio of1.8. The active carbon bed is operating at close to ambient pressure. Condensation in the ac-tive carbon bed must be avoided by keeping the gas temperature in the section above thedew point of the gas.
The biogas feed enters the bio-SNG unit and is compressed to 0.3 bar g in the biogas blower.DMW and air is mixed and evaporated in the controlled evaporation and mixing (CEM) unitand added to the biogas.The biogas is mixed with air to a molar ratio between H2S and O2 ofabout 1.8 and is heated to 40 °C in the traced lines, to achieve a water saturation between10% and 90%. The relative humidity is measured before the inlet to the sulfur absorbers.
The biogas then passes through the sulfur absorbers with the active carbon beds. These areidentical and installed in series. The two external reactor heaters keep the sulfur absorbersat 40°C to avoid condensation in the active carbon beds.
There are two sulfur absorbers in series in order to continue operation after breakthrough ofsulfur is detected outlet the first sulfur absorber. A bypass around the first absorber enablesreplacement of the activated carbon during operation. The oxygen content of the biogas andair mixture is measured by analyzing samples taken at the inlet and the outlet of the sulfurabsorbers. The slip of sulfur from the sulfur absorbers was expected to be approximately 25ppmv.
After the bulk sulfur removal the biogas is compressed to 22 bar g in the biogas compressor.The pipes from the sulfur absorbers to the biogas compressor are insulated and traced toavoid condensation.
Small amounts of refractory sulfur are expected to pass through the active carbon sulfur ab-sorbers in the bulk sulfur removal section. This sulfur is removed in the sulfur guards, whichare loaded with promoted zinc oxide absorbent from Haldor Topsoe A/S. The absorbent canabsorb refractory sulfur best at elevated temperatures and for this reason the temperaturehas to be maintained above 250°C.
The adsorbent is composed of zinc oxide and absorbs hydrogen sulfide and COS as shownbelow
ZnO + H2S ZnS + H2O (Eq. 1)
ZnO + COS ZnS + CO2(Eq. 2)
As the process gas contains CO2, the formation of water will occur according to:
11
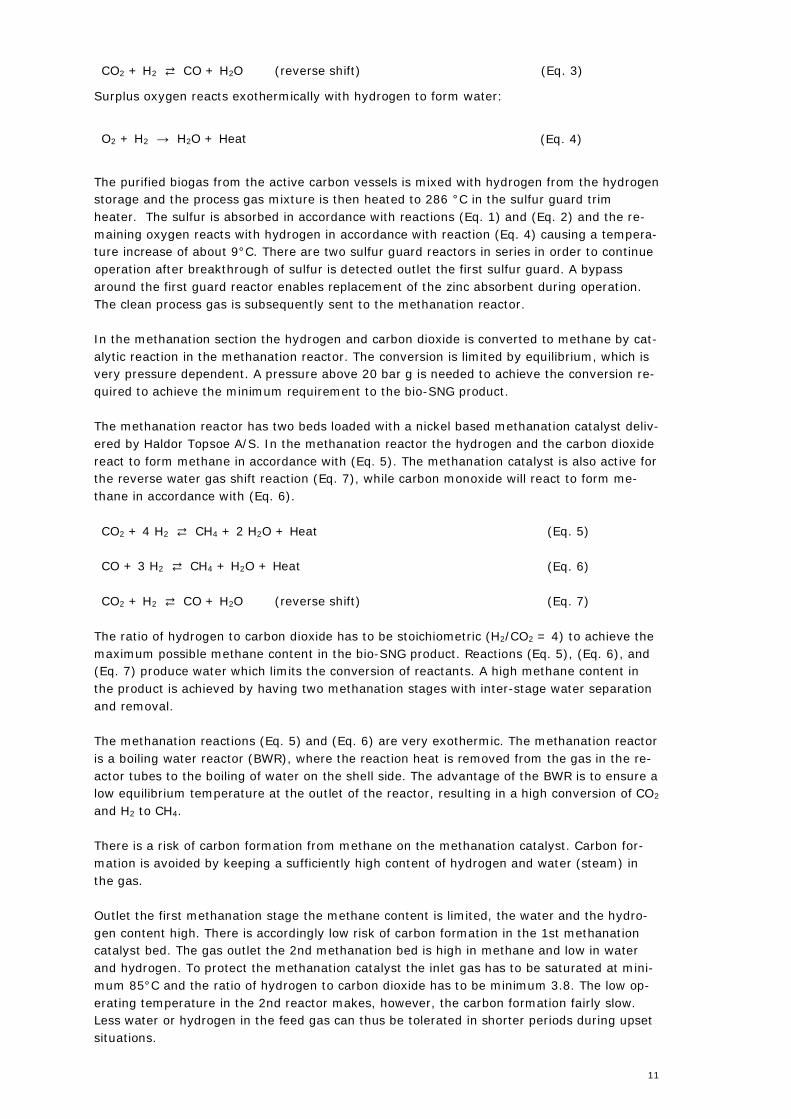
CO2 + H2 CO + H2O (reverse shift) (Eq. 3)
Surplus oxygen reacts exothermically with hydrogen to form water:
O2 + H2 → H2O + Heat (Eq. 4)
The purified biogas from the active carbon vessels is mixed with hydrogen from the hydrogenstorage and the process gas mixture is then heated to 286 °C in the sulfur guard trimheater. The sulfur is absorbed in accordance with reactions (Eq. 1) and (Eq. 2) and the re-maining oxygen reacts with hydrogen in accordance with reaction (Eq. 4) causing a tempera-ture increase of about 9°C. There are two sulfur guard reactors in series in order to continueoperation after breakthrough of sulfur is detected outlet the first sulfur guard. A bypassaround the first guard reactor enables replacement of the zinc absorbent during operation.The clean process gas is subsequently sent to the methanation reactor.
In the methanation section the hydrogen and carbon dioxide is converted to methane by cat-alytic reaction in the methanation reactor. The conversion is limited by equilibrium, which isvery pressure dependent. A pressure above 20 bar g is needed to achieve the conversion re-quired to achieve the minimum requirement to the bio-SNG product.
The methanation reactor has two beds loaded with a nickel based methanation catalyst deliv-ered by Haldor Topsoe A/S. In the methanation reactor the hydrogen and the carbon dioxidereact to form methane in accordance with (Eq. 5). The methanation catalyst is also active forthe reverse water gas shift reaction (Eq. 7), while carbon monoxide will react to form me-thane in accordance with (Eq. 6).
CO2 + 4 H2 CH4 + 2 H2O + Heat (Eq. 5)
CO + 3 H2 CH4 + H2O + Heat (Eq. 6)
CO2 + H2 CO + H2O (reverse shift) (Eq. 7)
The ratio of hydrogen to carbon dioxide has to be stoichiometric (H2/CO2 = 4) to achieve themaximum possible methane content in the bio-SNG product. Reactions (Eq. 5), (Eq. 6), and(Eq. 7) produce water which limits the conversion of reactants. A high methane content inthe product is achieved by having two methanation stages with inter-stage water separationand removal.
The methanation reactions (Eq. 5) and (Eq. 6) are very exothermic. The methanation reactoris a boiling water reactor (BWR), where the reaction heat is removed from the gas in the re-actor tubes to the boiling of water on the shell side. The advantage of the BWR is to ensure alow equilibrium temperature at the outlet of the reactor, resulting in a high conversion of CO2
and H2 to CH4.
There is a risk of carbon formation from methane on the methanation catalyst. Carbon for-mation is avoided by keeping a sufficiently high content of hydrogen and water (steam) inthe gas.
Outlet the first methanation stage the methane content is limited, the water and the hydro-gen content high. There is accordingly low risk of carbon formation in the 1st methanationcatalyst bed. The gas outlet the 2nd methanation bed is high in methane and low in waterand hydrogen. To protect the methanation catalyst the inlet gas has to be saturated at mini-mum 85°C and the ratio of hydrogen to carbon dioxide has to be minimum 3.8. The low op-erating temperature in the 2nd reactor makes, however, the carbon formation fairly slow.Less water or hydrogen in the feed gas can thus be tolerated in shorter periods during upsetsituations.

12
After the sulfur guards the process gas is fed into the methanation reactor 1st catalyst bed.There are two catalyst beds (tubes) in the methanator, one for each reaction stage. Eachtube is divided into an inert zone and a zone with methanation catalyst. The first zone actsas a heat exchanger, heating the feed gas to around 290°C. The methanation reactions (Eq.5) and (Eq. 6), and the reverse water gas shift reaction (Eq. 7) takes place in the second,catalytic zone. After the 1st methanation stage the process gas leaves the reactor at around280-290 °C and is cooled to 85°C in the 1st effluent air cooler, process condensate is re-moved in the 1st process condensate separator, and the process gas is sent to the 2ndmethanation stage. After the 2nd methanation stage the major part of the hydrogen andcarbon dioxide is converted to methane. The bio-SNG product is cooled in the 2nd effluentair cooler and process condensate is removed in the 2nd process condensate separator. Thefinal bio-SNG product is produced at 20 bar g. The pressure is reduced and the bio-SNGproduct is exported to the biogas storage outside battery limit.
The steam produced in the BWR is transported in a steam riser by natural convection to thesteam drum, which is placed minimum 1 meter above the BWR. The steam is condensed andthe boiler feed water (BFW) is recycled back to the reactor through a downcomer in a closedloop. The heat is removed in the steam condenser by air cooling. The air cooler is a U-tubeexchanger, placed inside the condenser drum.
The pressure in the condenser drum is regulated by adjusting an air flow through the steamcondenser by means of a speed control on the air blower. An electrical start-up heater isplaced on the downcomer. The capacity is 15 kW and will heat up the water, condenser andreactor in approximately 6-8 hours.
In order to simplify the process and facilitate independent operation of the SOEC unit and theBio SNG unit it was decided not to integrate the steam systems.
The condensate from the methanation process, the biogas compressor and the hydrogencompressor is sent to a common condensate collector, where dissolved gases are releasedinto the vent system. The condensate from the condensate collector is sent to the drain inthe floor of the building, which is connected to the chemical sewer.
3.1.1 Utilities and online sample pointsThe cooling water loop is a standalone unit, placed outside the process building. The coolingwater loop supplies cooling water to the compressors and water coolers.
The cooling water consist of 50% tap water and 50% glycol. The cooling water is circulatedby a cooling water pump. The cooling water return is cooled by an air cooler. The cooling wa-ter temperature is adjusted to 20°C by a mechanical control valve in the bypass. In case thecooling water out of the air cooler is above 30°C (a very warm summer for Denmark), thecooling water can be further cooled to 20°C using a backup extra heat exchanger. The cool-ing medium in the backup heat exchanger is tap water. An expansion vessel is connected tothe system.
The SOEC unit is the main consumer of DMW. The SOEC stack consists of cermet electrodescontaining nickel and are very sensitive to impurities in the DMW. For this reason the waterpurifier is based on a four step cleaning procedure:
UV source and bacteria filter
Reverse osmosisReverse osmosis removes the majority of inorganic salts, organic content and micro-organisms.
Electrodeionization unit (EDI)Removing the majority of dissolved ions still left in the water.
13
The conductivity of the DMW should be <0.5 µS/cm or >10MΩ.
DMW is mainly used as water source for the steam generation in the SOEC unit, but smallamounts are also used as water source in the CEM unit. Furthermore, the water in themethanation reactor and steam condenser is DMW supplied from the water purification unitduring commissioning of the steam system.
The vent system receives gases from the bio-SNG unit and the compressors due to:
· Releases from pressure safety valves (PSVs)· Vent of biogas from the low pressure sulfur removal section· Vent from the biogas compressor· Vent from the hydrogen compressor· Released gases from the process condensate collector· Vent of bio-SNG product
The vent system is oxygen free.
The main ventilation system replaces air in the following enclosures:
· The bio-SNG enclosure (low pressure sulfur removal, methanation)· Compressor enclosure (hydrogen compressor, biogas compressor)· SOEC enclosure
The enriched air is removed from the SOEC unit via the ventilation system. If the hydrogenproduced in the SOEC unit cannot be exported to the hydrogen compressor, the hydrogen isremoved via the ventilation system. There are no emissions from the bio-SNG and the com-pressor enclosures unless there is a leakage. The air flow is adjusted to 15 air volumechanges per hour. The air flow in the ventilation system to the SOEC enclosure is adjusted toensure a hydrogen concentration below 50% of lower explosion limit (LEL) in the ventilationsystem. The ventilator is ATEX Zone 2 approved.
Nitrogen is used is for flushing during start-up and shutdown. Nitrogen can be added at thefollowing positions in the plant:
· Inlet low pressure sulfur removal section· Inlet biogas compressor· Inlet hydrogen compressor· Inlet the SOEC unit
A bottle rack of protection gas (5% hydrogen in nitrogen) supplies the SOEC unit with gas forflushing and heating up to 650 °C.
There are 3 online sample points in the bio-SNG unit:
1. Inlet the 1st stage of the methanator2. Inlet the 2nd stage of the methanator3. Bio-SNG product
The samples are analyzed by a micro-GC, analyzing one sample at a time. The gas will con-tinuously flush through all the sample lines, and a four position valve will collect samples.
Some pictures of the unit installed at the Foulum site are shown on Figure 3-2 and Figure3-3.

14
Figure 3-2: The pilot plant at AU Foulum site. The tall reactor and steam drum makes the pi-lot plant reach the rooftop.
Figure 3-3: Main coridor and platform level of the pilot plant
3.2 SOEC performance
A start up from ambient conditions takes 10-11 hours (Figure 3-4). The stacks are firstheated up with protection gas on the cathode side and air on the anode side to 650 °C. Asthe temperatures are now above the auto-ignition temperature of hydrogen the cathode gasis switched to 10 % hydrogen in steam.

15
Figure 3-4: Heating of the SOEC unit from ambient conditions. When the unit is at 750°C theelectrolysis is engaged.
The voltage recorded until power is switched on is the open circuit voltage developed acrossthe stacks which are coupled two together, e.g. 150 cells in total.
Another start-up strategy has also been applied where a maximum of 180 V has beenapplied across 150 cells but with a maximum current limited to 3 A. This has minimised theslight delay in reaching full current=production, when applying the thermoneutral voltagearound 193 V.
This minimum current of 3 A is also appplied in “hot stand-by mode” in order to minimise theresponse time to below some few seconds when going back to full production.
The investigation of degradation of the stacks has been one of the main goals of the project.Most of the litterature on SOEC cell and stack degradtion has been carried out with mainlysmall button cells or short stacks only. Furthermore the measurements have typically beencarried out in galnavostatic mode. In other words, the current has been kept constant byvarying the applied voltage. This mode of operation would lead to an increase in specificpower consumption for hydrogen production and excessive temperature gradient in trulyadiabatic stacks.
A better strategy aims at keeping the production (e.g. current) and voltage constant bycompensating for degradation by slowly increasing the operating temperature at otherwisethermoneutral conditions at 1.29 V per cell. The extra power required for the electrical trimheater upstream the stacks is marginal due to the feed/effluent exchangers.
This strategy was applied for the first time in this project on full size stacks and the resultsare shown on Fig. 3-5

16
Figure 3-5: Operating hours on the SOEC unit. The production is kept at design production of100% (yellow). Ageing of the stacks are compensated by increasing the temperature (blue).
It can be observed that the degradation rate as expressed by the rate of inlet temperatureincrease to keep production constant was rather high during the first 500 hours ofaccumulated operating time. It was thus neceassary to increase the temperature from 715°C to 755 °C.
After this initial period the performance of the stacks, however, stabilised and it was onlynecessary to increase the inlet temperature by a modest 10 °C in the next 1500 hours ofaccumulated operation.
It has been interesting to note that the performance of the stacks improved after everyshutdown and restart of the units as indicated in a drop of around 15 °C in the needed inlettemperature. This could indicate that a certain reversible poisoning of the fuel elctrodes havebeen occuring. The poison(s) could then be removed by the treatment with protectiongas/hydrogen during the cooling down/heating up cycles. It should be pointed out that this isjust a working hypothesis, which need to be checked by installing a poison trap on the steamin the next project.
3.3 Methanator performance
The startup time from cold to operating conditions was found to be approx. 8-9 hours as il-lustrated on Figure 3-6. When the cooling water on the reactor shell side reaches operatingconditions of 265°C, the methanation reactor is ready. At this temperature (hot standby),the methanation reaction will stabilize within minutes after gas is introduced. The exothermicreaction gives rise to a hotspot just below 700°C
17
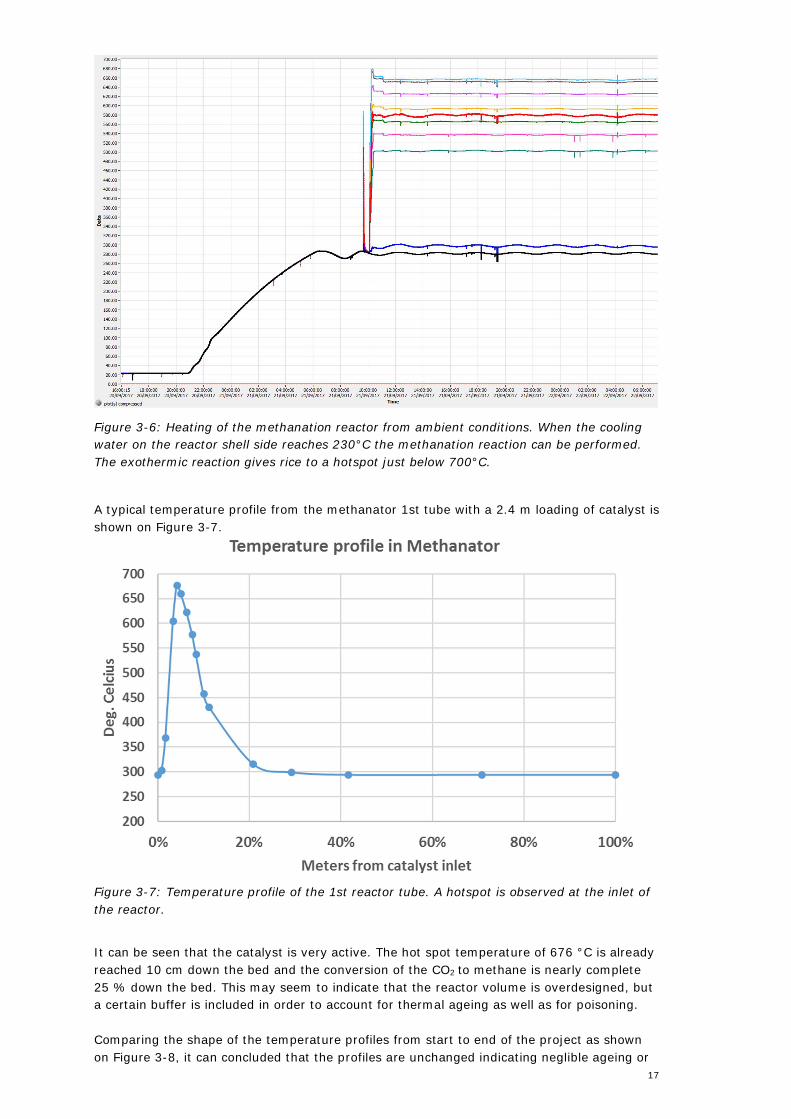
Figure 3-6: Heating of the methanation reactor from ambient conditions. When the coolingwater on the reactor shell side reaches 230°C the methanation reaction can be performed.The exothermic reaction gives rice to a hotspot just below 700°C.
A typical temperature profile from the methanator 1st tube with a 2.4 m loading of catalyst isshown on Figure 3-7.
Figure 3-7: Temperature profile of the 1st reactor tube. A hotspot is observed at the inlet ofthe reactor.
It can be seen that the catalyst is very active. The hot spot temperature of 676 °C is alreadyreached 10 cm down the bed and the conversion of the CO2 to methane is nearly complete25 % down the bed. This may seem to indicate that the reactor volume is overdesigned, buta certain buffer is included in order to account for thermal ageing as well as for poisoning.
Comparing the shape of the temperature profiles from start to end of the project as shownon Figure 3-8, it can concluded that the profiles are unchanged indicating neglible ageing or

18
poisoning has occurred throughout the accumulated 1630 hours the methanator has beenoperated. This also proves that the desulphurization has performed excellently.
Figure 3-8: Temperature profiles thru the first reactor tube from the first testruns in 2016 tillend of the project in 2017.
If the methanator is left in hot standby conditions, it only takes 7-8 minutes to reach steadystate temperatures (Figure 3-9). The very rapid increase in hot spot temperature from 280to 675 °C has not harmed the catalyst or reactor, despite more than ten such occurrences.
Figure 3-9: Introducing gas to the methanation reactor. The reaction hotspot reaches steadystate after 7-8 minutes.

19
3.4 Gas quality
The gas operators are responsible for maintaining the gas quality delivered to end-users.The technical specifications on gas quality are defined in the standards Gasreglementet C-12(Denmark), EN 16726 “Gas Quality Standard” (Europe), DVGW G260/G262 (Germany) aswell as EN 16723-1 “Specifications for Biomethane for Injection in the Natural Gas Network”(Europe) and EN 16723-2 “Automotive Fuels Specification” (Europe). The formal vote for thenew European standards EN 16723-1 and -2 closed in March 2017, and the standard is readyto become official, however there are still some issues under discussion(GasInfrastructureEurope).The upgraded biogas needs to fulfill the same standard as the natural gas currently suppliedto the network. Special requirements for national grids are still common, and some of theconcerns covered are specific to natural gas delivered to the grid in Denmark.A simplified process of upgrading biogas to natural gas can be seen in Figure 3-10.
Figure 3-10: Simplified process showing the input and output gasses
3.4.1 Biogas qualityThe term biogas covers a mixture of gasses, with the main components being methane andcarbondioxide.A number of impurities are to some extent allowed in biogas. The impurities originate mainlyfrom the digestion of molecules containing nitrogen or sulphur, but may also be introducedas organic material contamination or process disturbances (like stirring, overloading, changein feed material). Table 3-1 lists the typical impurities.
Table 3-1: Typical impurities found in raw biogas. Impurities are all components besides me-thane and carbondioxide. (Hjuler, 2017)Contaminant Typical amount in
raw biogasSpec. (DK C-12 & EN 16723)
Water vapor 5 - 10 % Not allowed, dew point <-8° CCarbon monoxide 0 - 3 % Max. 0.1 %volNitrogen 0 - 3 % No direct limit, but restricted as:
Methane spec min. 97.2 %volOxygen 0 - 1 % Max. 0.5 %volHydrogen sulfide 0 - 10’000 mg/Nm3 Max. 5 mg/Nm3Volatile organic compounds(VOCs)
0 - 4500 mg/Nm3 No direct limit
Hydrogen 20 – 600 ppm Max. 2 %volHalogenated hydrocarbons 20 - 200 mg/Nm3 Not allowedLong-chain hydrocarbons 0 - 200 mg/Nm3 Only small amounts of gaseous
alkanes allowed (prim. ethane)Ammonia 0 - 100 mg/Nm3 Max. 3 mg/Nm3Siloxanes 0 - 41 mg/Nm3 Max. 1 mg/Nm3
Many of the listed impurities are of little concern when sourcing biogas from a continuouslyoperated facility solely based on livestock manure and agricultural bio-waste. This meanscarbon monoxide, VOCs, halogenated and long chain hydrocarbons, ammonia and siloxanesare of little or no concern in this project. The impurities nitrogen and hydrogen sulfide how-ever require strict management.
Biogas &Hydrogen
Natural gasCatalyticmethanation
20
· Nitrogen acts as an inert. It passes thru the entire upgrading process and ends up inthe final product. Nitrogen results in a lower heating value/Wobbe Index of the finalgas as well as undesired NOx emissions in the flue gas. The presence of nitrogen willrequire a higher conversion to methane of the catalytic methanation process. The re-sult is a restriction in the operational window of the plant.
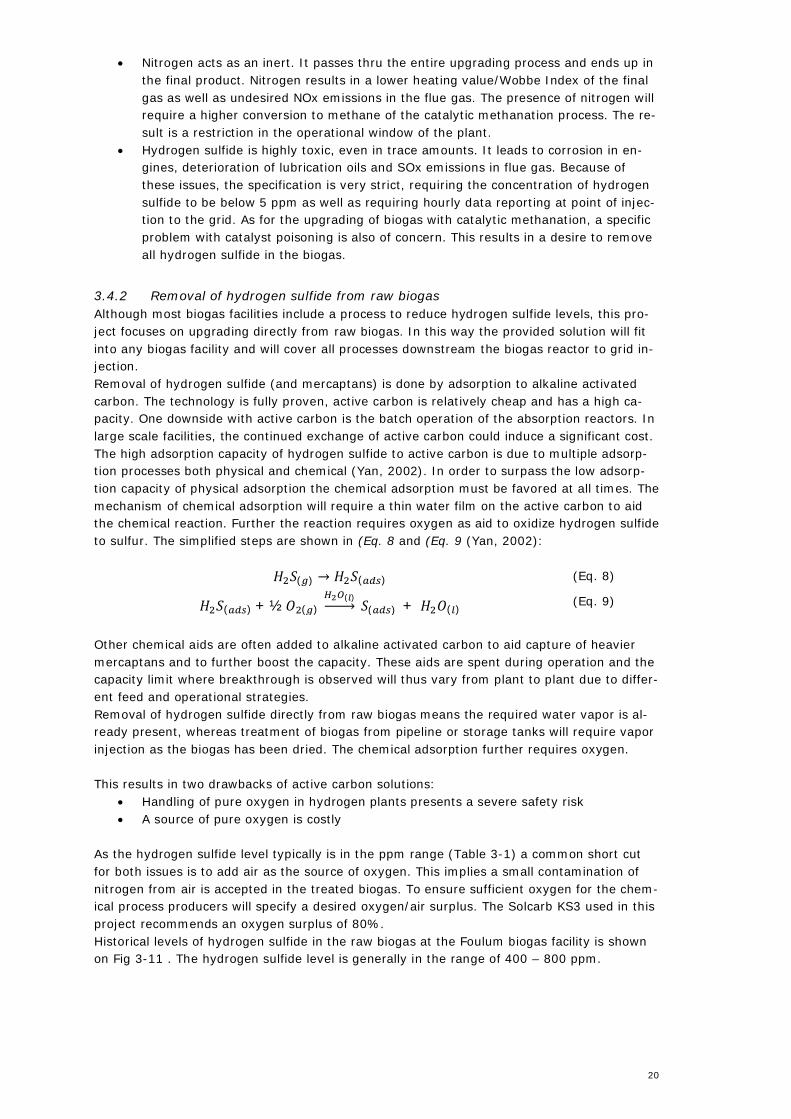
· Hydrogen sulfide is highly toxic, even in trace amounts. It leads to corrosion in en-gines, deterioration of lubrication oils and SOx emissions in flue gas. Because ofthese issues, the specification is very strict, requiring the concentration of hydrogensulfide to be below 5 ppm as well as requiring hourly data reporting at point of injec-tion to the grid. As for the upgrading of biogas with catalytic methanation, a specificproblem with catalyst poisoning is also of concern. This results in a desire to removeall hydrogen sulfide in the biogas.
3.4.2 Removal of hydrogen sulfide from raw biogasAlthough most biogas facilities include a process to reduce hydrogen sulfide levels, this pro-ject focuses on upgrading directly from raw biogas. In this way the provided solution will fitinto any biogas facility and will cover all processes downstream the biogas reactor to grid in-jection.Removal of hydrogen sulfide (and mercaptans) is done by adsorption to alkaline activatedcarbon. The technology is fully proven, active carbon is relatively cheap and has a high ca-pacity. One downside with active carbon is the batch operation of the absorption reactors. Inlarge scale facilities, the continued exchange of active carbon could induce a significant cost.The high adsorption capacity of hydrogen sulfide to active carbon is due to multiple adsorp-tion processes both physical and chemical (Yan, 2002). In order to surpass the low adsorp-tion capacity of physical adsorption the chemical adsorption must be favored at all times. Themechanism of chemical adsorption will require a thin water film on the active carbon to aidthe chemical reaction. Further the reaction requires oxygen as aid to oxidize hydrogen sulfideto sulfur. The simplified steps are shown in (Eq. 8 and (Eq. 9 (Yan, 2002):
(Eq. 8)
(Eq. 9)
Other chemical aids are often added to alkaline activated carbon to aid capture of heaviermercaptans and to further boost the capacity. These aids are spent during operation and thecapacity limit where breakthrough is observed will thus vary from plant to plant due to differ-ent feed and operational strategies.Removal of hydrogen sulfide directly from raw biogas means the required water vapor is al-ready present, whereas treatment of biogas from pipeline or storage tanks will require vaporinjection as the biogas has been dried. The chemical adsorption further requires oxygen.
This results in two drawbacks of active carbon solutions:· Handling of pure oxygen in hydrogen plants presents a severe safety risk· A source of pure oxygen is costly
As the hydrogen sulfide level typically is in the ppm range (Table 3-1) a common short cutfor both issues is to add air as the source of oxygen. This implies a small contamination ofnitrogen from air is accepted in the treated biogas. To ensure sufficient oxygen for the chem-ical process producers will specify a desired oxygen/air surplus. The Solcarb KS3 used in thisproject recommends an oxygen surplus of 80%.Historical levels of hydrogen sulfide in the raw biogas at the Foulum biogas facility is shownon Fig 3-11 . The hydrogen sulfide level is generally in the range of 400 – 800 ppm.
( ) + ½ ( )( )
⎯⎯⎯ ( ) + ( )
( ) → ( )

21
Figure 3-11: Historical levels of hydrogen sulfide at the Foulum biogas facility.Analysis is performed on the raw biogas.
During the two-year period the hydrogen sulfide level peaked at 1400 ppm. This specific highwas due to plant maintenance (change in feed and operational procedure), and during thisperiod the nitrogen contamination from air injection (air: 21 % oxygen and 79 % nitrogen)would result in:
=1400 ∙ 1.8
10 0.21 ∙ 0.79 ∙ 100% = 0.95%
(Eq. 10)
According to Table 3-1, the raw biogas may already contain up to 3 % nitrogen. Levels of ni-trogen in raw biogas directly from the reactor is typically not as high as the handling/post-processing operations increases the risk of air contamination. Analysis on the raw biogasfrom the Foulum reactor has shown a nitrogen level around 0.4% (Appendix 4.2.1).
Possible options to reduce nitrogen contamination in raw biogas:· Improved biogas reactor design, reducing the risk of air contamination.· Change in biogas feed, as some nitrogen rich feeds could be minimized· Using an oxygen rich stream as replacement for air dosing.· Pretreatment of biogas, reducing the overall level of H2S
As such an additional nitrogen contamination of up to 1 % (Eq. 10) in the treated biogas re-duces the allowed operational variance in the biogas upgrading plant, and at this level it willrequire continued monitoring to avoid quality issues.
A study of the supplier-recommended oxygen surplus (+80%) showed no need for dosing ofsurplus oxygen. Using only the stoichiometric requirement, the active carbon fully performedwith no breakthrough after processing of 10’000 Nm3 of biogas, equivalent to 45 days of op-eration at full upgrading capacity. It is possible that surplus oxygen is required as the activecarbon nears the final adsorption capacity. However, the obtained results on nitrogen con-tamination shows that the risk to gas quality by air injection can be managed.
3.4.3 Hydrogen qualityThe hydrogen needed by the catalytic methanation process should be free from any impuri-ties. Typical production pathways for bulk volumes of hydrogen involve reforming or electrol-ysis. Both processes produce a hydrogen source of high purity. In this project the source iselectrolysis of steam using solid oxide electrolysers cells (SOEC). The water used for steamproduction is purified with reverse osmosis and ion exchange resin making the only hydro-gen-impurities of concern water and oxygen. Water is easily removed by cooling of the hy-drogen gas. The hydrogen from the SOEC is confirmed dry as no water is observed in thedrain after the compression. The product from the SOEC is pure hydrogen and oxygen in twoseparate streams. The ceramic membrane in the cell is however sensitive to pressure spikes
0200400600800
1000120014001600
1/31/2016 5/10/2016 8/18/2016 11/26/2016 3/6/2017 6/14/2017 9/22/2017 12/31/2017Conc
entr
atio
nof
hydr
ogen
sulfi
te[p
pm]
Sample date
Hydrogen sulfide content in raw biogas

22
and thermocycles. Over time (and due to unplanned shutdown) microcracks will form. It ispossible that micro cracks in the cell allow a small amount of oxygen to ingress in to the hy-drogen. At the operating temperatures of the SOEC such oxygen would, however, immedi-ately react with the hydrogen on the nickel electrode to form steam.
3.4.4 Natural gas qualityIn case the stoichiometric ratio of carbon dioxide and hydrogen deviates from 1:4 (Eq. 11)noticeable amounts of either carbon dioxide or hydrogen will be present. The chemical equi-librium of the reaction can be pushed towards methane by removing the water produced bythe reaction
( ) + 4 ( ) .
⎯ ( ) + 2 ( ) (Eq. 11)
A GC is installed at the reactor inlet, at mid stage and at the reactor outlet. The quality ofthe produced gas is measured every three minutes. The results from the test-run in June2016 is shown in Figure 3-12. The results show that the produced gas is on spec. as naturalgas.
Figure 3-12: Sketch of the reactor tubes series and gas composition from simulation (left).GC analysis data of the gas composition at the reactor testrun in June 2016 (right). GC appa-ratus calibration was still ongoing at this time.
Nitrogen contamination was observed on the GC analysis data (Figure 3-12). During the test-run in June 2016, no air injection was performed (for H2S removal/biogas pretreatment), in-dicating that the nitrogen contamination originates from the biogas source. After the initialtest-run air injection was enabled to ensure H2S removal with active carbon. This increasesthe nitrogen contamination to a general level of 1.5% as seen in Figure 3-12. The requiredpurity of methane when delivering pipeline quality is 97.2 mol % (GasreglementC12; Hjuler,2017), indicating gas of pipeline quality is produced as long as other non-methane contami-nants can be kept low.
H2 CH4 CO2 N2Inlet 56,4% 22,0% 19,0% 0,5%
Midstage
4,2 94,6% 0,3% 0,9%
Exit 1,4% 97,7% 0,0% 1,0%

23
Figure 3-13: Gas quality from 670 hours of biogas upgrading operation. The quality datashows only minor drops on methane purity, but continuous periods where the specificationon hydrogen level is exceeded. After 600 hours the operational philosophy was changed toallow a small surplus of carbon dioxide and not hydrogen. This improved the overall gasquality.
The main contaminants of interest are summarized in Table 3-2. During the first 600 hoursof operation the limit of max 2 mol % hydrogen was exceeded (Figure 3-13). At the sametime the CO2 level was far from the allowed limit of 3.0 mol % (GasreglementC12). After 600hours the operational philosophy was changed to allow a small surplus of carbon dioxide andnot hydrogen. This improved the overall gas quality to be well within the quality require-ments.
From Figure 3-13 it can be observed how surplus of hydrogen is closely related to a low CO2
level.
Table 3-2: Selected parameters from the pipeline specification on natural gas in Denmark
Analysis Unit SpecificationMethane mol % Min 97.2Carbon dioxide mol % Max 3.0Hydrogen mol % Max 2Odorant (THT) mg/Nm3 10.5
The total level on non-methane contaminants allowed is 2.8 mol %. With a stable nitrogenlevel of 1.5 mol %, the operational window of all other non-methane components is re-stricted to a narrow window of 1.3 mol % (hydrogen and CO2 combined). During all produc-tion hours shown above the air injection was set at the recommended oxygen surplus of+80%. The results on gas quality led to the study showing no change in the performance ofthe active carbon when air injection was reduced to a level with no surplus of oxygen, thusreducing the nitrogen content.
3.4.5 Hydrogen in the natural gasThe permissible content of hydrogen in the pipeline quality natural gas is discussed in severalwork groups under the European Committee for Standardization. In most grids 10% hydro-
24
gen would not be a problem, but the limit value of gas turbines might be as low as 1 % hy-drogen and of steel tanks and gas engines a limit value of 2 % hydrogen may apply. (Hjuler,2017) In Denmark the current level is set at max 2%.
3.5 Design of full scale plant
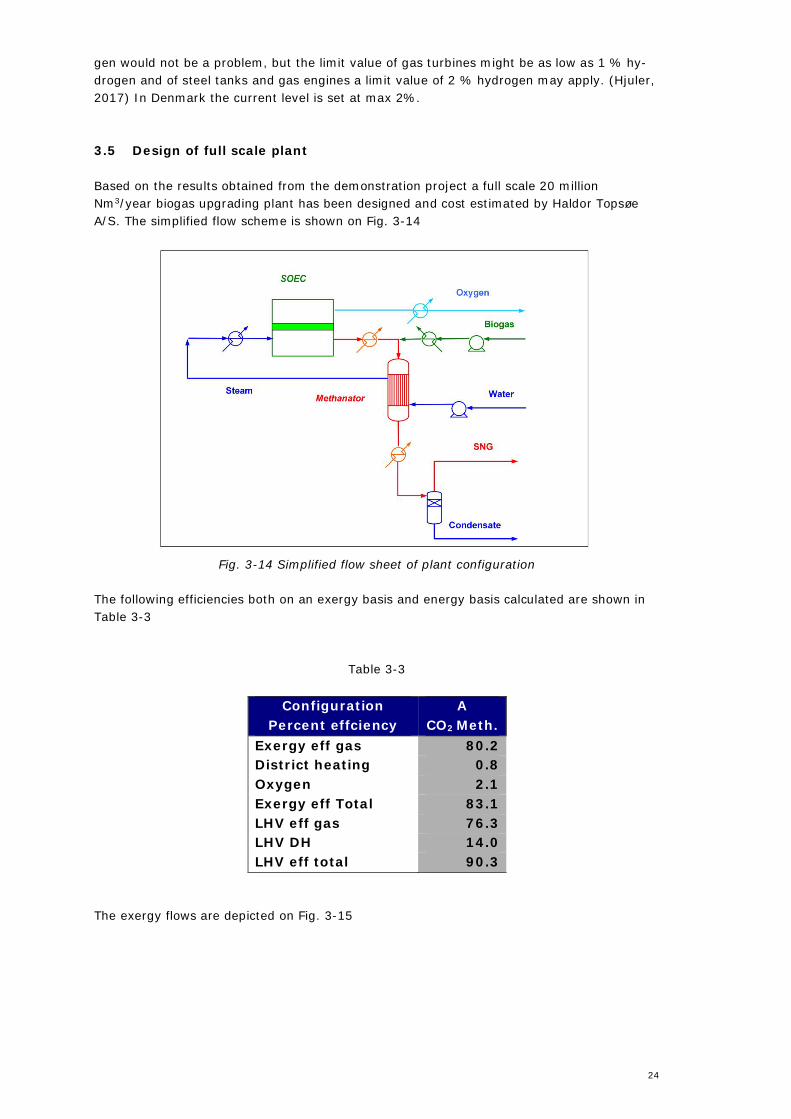
Based on the results obtained from the demonstration project a full scale 20 millionNm3/year biogas upgrading plant has been designed and cost estimated by Haldor TopsøeA/S. The simplified flow scheme is shown on Fig. 3-14
Fig. 3-14 Simplified flow sheet of plant configuration
The following efficiencies both on an exergy basis and energy basis calculated are shown inTable 3-3
Table 3-3
ConfigurationPercent effciency
ACO2 Meth.
Exergy eff gas 80.2District heating 0.8Oxygen 2.1Exergy eff Total 83.1LHV eff gas 76.3LHV DH 14.0LHV eff total 90.3
The exergy flows are depicted on Fig. 3-15

25
Fig. 3-15 Exergy flows in full scale plant
It should be noted that the design assumes that pressurized stacks will become available andthe hydrogen compressor can thus be avoided. Operating the SOEC stacks at ambient pres-sure would decrease the exergetic efficiency by approximately 4 %.
The results from the design study have formed the basis for the economic analyses of theconcept.
3.6 Economic analysis
In work package 5.2 the economics of deploying el upgraded biogas technology by SOEC hasbeen investigated from two different perspectives:
· A socio-economic perspective evaluating the benefit to society· A private, plant owner perspective
3.7 Socio-economic analysisEa Energianalyse carried out the socio-economic analyses using the Balmorel model. Thismodel designs an energy system satisfying the demand for electricity, heat and transportservices at the lowest possible cost to society given a set of assumption concerning fuelprices, energy technology investment costs and efficiency as well as externalities exemplifiedby a cost of CO2 using specified production and consumption profiles. The model considersthe central and Northern European energy system with respect to the electricity sector con-strained by the capacity of the interconnectors. A further constraint is that Denmark pro-duces at least enough electricity to cover domestic consumption on a yearly basis. The anal-yses have been carried out for 2030 and 2050 using the following assumptions:
For fuel prices the projections from IEA’s 450 ppm scenario in world Energy Outlook 2016has been used as shown on Figure 3-6.

26
Figure 3-16: Fuel prices at Central plants (incl. transport costs).
Coal and oil prices are projected to decline due to the low demand caused by a large share ofrenewables. The biomass prices are based on studies by Ea Energianalyse. It is assumedthat the natural gas grid will be fully depreciated in 2030.
It can be argued that flexible operation of SOEC plants will help to balance production andconsumption in the electricity grid thus reducing the cost of operation and investment in thegrid. This would imply a negative socio economic electricity tariff but in this study a tariff of 0DKK/MWh is assumed in the base case scenario.
With respect to CO2 prices 216 DKK/MT in 2030 and 800 DKK/MT in 2050 are used based onIEA’s projection in WEO 2016.
It is assumed that no new investments in coal- or oil-fired power plants will be done in goodagreement with present developments.
The price of electricity will not surprisingly have a major impact on the economy for el up-graded biogas plants. In the base case scenario, the ordered prices realized in Denmark in2015 as well as the projected prices for 2030 and 2050 are shown on Figure 3-147.
Figure 3-147: Electricity Prices in West Denmark
0
20
40
60
80
100
120
140
kr./
GJ
Kul
Fuelolie
Letolie
Naturgas
Halm
Træflis
Træpiller
-400
-200
-
200
400
600
800
1,000
132
564
997
312
9716
2119
4522
6925
9329
1732
4135
6538
8942
1345
3748
6151
8555
0958
3361
5764
8168
0571
2974
5377
7781
0184
25
kr./
MW
h
Statistik, 2016 Grundscenarie, 2030 Grundscenarie, 2050
27
Due to the foreseen large share of fluctuating wind and solar power there will be a significantnumber of hours with low el prices: approx. 40 % of the time the prices will be below 100kr./kWh. On the other hand, there will also very high prices caused by the coal and naturalgas fired plant setting the price and the high CO2 price.
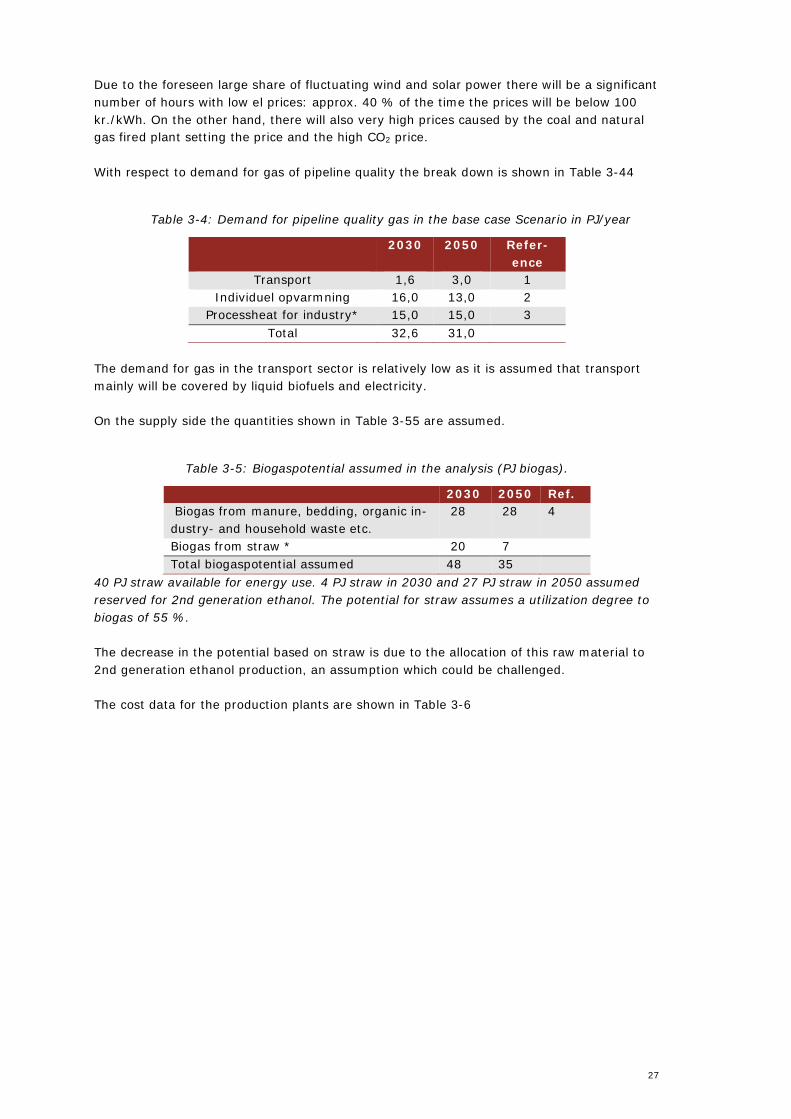
With respect to demand for gas of pipeline quality the break down is shown in Table 3-44
Table 3-4: Demand for pipeline quality gas in the base case Scenario in PJ/year
2030 2050 Refer-ence
Transport 1,6 3,0 1Individuel opvarmning 16,0 13,0 2
Processheat for industry* 15,0 15,0 3Total 32,6 31,0
The demand for gas in the transport sector is relatively low as it is assumed that transportmainly will be covered by liquid biofuels and electricity.
On the supply side the quantities shown in Table 3-55 are assumed.
Table 3-5: Biogaspotential assumed in the analysis (PJ biogas).
2030 2050 Ref. Biogas from manure, bedding, organic in-dustry- and household waste etc.
28 28 4
Biogas from straw * 20 7Total biogaspotential assumed 48 35
40 PJ straw available for energy use. 4 PJ straw in 2030 and 27 PJ straw in 2050 assumedreserved for 2nd generation ethanol. The potential for straw assumes a utilization degree tobiogas of 55 %.
The decrease in the potential based on straw is due to the allocation of this raw material to2nd generation ethanol production, an assumption which could be challenged.
The cost data for the production plants are shown in Table 3-6

28
Table 3-6: Costdata assumed for the SOEC electrolysis, methanation and simple upgradingplants (in kr. 2016).
2030 2050
SOEC-plant* Investment 3,59 2,76 Mkr./MWe
Fixed O&M 96.000 71.700 Kr./MWe/år
CO2-metanation* Investment 5,52 5,52 Mkr./MW H2
Fixed O&M 165.600 165.600 Kr./MW H2/yr
Simple bio-gasupgrading** Investment 2,87 2,59 Mkr./MW gas
Fixed O&M 71.600 64.900 Kr./MW gas/yr
Variable O&M 24 28 Kr./MWh gas
* Data from Haldor Topsøe, 2017. Connection cost 0,37 Mkr./MW-e added.** Energistyrelsen, January, 2017: Teknologikataloget, kapitler om opgraderet biogas ().
The analyzed, integrated el upgrading biogas plant is shown on Figure 3-158.
Figure 3-15: Overview of the plant for electrical upgrading of biogas.
In addition to the unit shown on Figure 3-158 the model can invest in a biogas engine forCHP production as well as a simple biogas upgrading unit which discards the separated CO2.
These units will now have to compete with natural gas, thermal gasification plants, heatpumps, biomss fired boilers, solar heating etc.
As the overall energy system is highly complex and the optimum depends on manyparameter a scenario analyses have also been carried based on the scenarios shown in Table3-7.

29
Table 3-7: Scenarios analyzed.
Scenarioname DescriptionElopgradOmk +30 30 % higher investment costs for el upgrading plantElopgradOmk +50 50 % higher investment cost for el upgrading plant
Fossile_hoejeFossil fuel prices according to New Policies scenario inIEA’s WEO 2015.Natural gasprice: 85 kr./GJ (instead of 69 kr./GJ)
CO2_400krCO2-price of 400 kr. /ton in 2050 and 108 kr./ton i2030 (e.g. 50 % lower than Base case)
Eltarif_30kr Socioeconomic el-tariff 30 kr./MWh
VE-tilskudsdrevet
Renewables favored by feed in tariffs instead oftax/quota driven. General RE-subsidy of 150 kr./MWh-e and a low CO2-price of 150 kr./ton. Results in lowerel prices.
Natur-gas_ude_2050
Natural gas phased out in Denmark in2030.
Based on the assumptions above, the model selects the optimum outcome based on a 4 %discount rate (the recommended for socio-economic analyses).
The overall electricity production in Central and Northern Europe is predicted to be as shownon Figure 3-169 depending on the scenario.
Figure 3-169: Electricity production from different feedstocks
It can be noted that renewables amount to 82-89 % of the electricity production in 2050 andwind- and solar power delivers 62-69 % due to their increased economic competitiveness.The high share of wind and solar power results in the large price fluctuations for electricity asshown on f.inst. Figure 3-16.
For Denmark the consumption of pipeline quality gas from the different sources: Bio-SNGfrom thermal gasification, el-upgraded biogas, simple upgraded biogas and natural gas areshown on Figure 3-20 in the different scenarios in 2050.
-
500
1,000
1,500
2,000
2,500
3,000
2030 2050
TWh
Olie
Naturgas
Kul
Kernekraft
Biogas
Biomasse og affald
Sol
Vind
Vandkraft

30
Figure 3-20: Different scenarios on how NG is sourced in 2050.
The dotted line in Figure 3-20 shows the combined (31 PJ) demand from transport, house-hold heating and process heat. The rest is used for power and heat in general.
The highest gas consumption is in the two scenarios with low CO2 prices where the gas usedis almost exclusively natural gas. With the assumed natural gas prices in 2050 it is calculatedthat the CO2 price should be at least 500 kr./ton for upgraded biogas to be competitive com-pared to natural gas. Biogas is not competitive in any of the scenarios in 2030 due to the as-sumed low CO2 price of 216 kr./ton.
El-upgraded biogas outcompetes natural gas, simple upgraded biogas and gasification SNGin the base case scenario as well in the scenario with 30 % higher investment cost. If the in-vestment cost is 50 % higher the simple upgraded biogas becomes cheaper.
In the scenario with higher fossil fuel prices and in the scenario with no natural gas there is asignificant contribution from SNG generated via thermal gasification of biomass.
The production of biogas, simple upgraded biogas and el upgraded biogas in the differentscenarios are shown on Figure 3-.
0
10
20
30
40
50
60
70
0
10
20
30
40
50
60
70
PJ
Naturgas
Simpelt opgraderet biogas
El-opgraderet biogas
Bio-SNG fra termiskforgasning
Gasbehov til indiv.opvarmning, procesvarme ogtransport

31
Figure 3-21: Production of different biogases in 2050
It is seen that the full biogas potential is used in all scenarios and the use of el upgrading in-creases the potential for renewable methane. The combined output of el upgraded biogascorresponds to approx. 1,6 GW and the needed SOEC capacity for the hydrogen production is640-650 MW.
The fraction of the biogas which is not upgraded is used in engines for CHP production. Theoptimum amount of operating hours for the SOEC units are 4600-4800 hours per year whichhas a weighted electricity price of 109 kr./MWh which is considerably lower than the averageelectricity price of 388 kr./MWh.
As a check on above modelling results the levelized cost of energy (LCOE) has been calcu-lated in the base case scenario. The ranking found is with LCOE in kr/GJ in parentheses:
El-upgraded biogas (91) < simple upgraded biogas (99) < natural gas (111) < thermal gasi-fication of straw (115) < thermal gasification of wood chips (129)
The result is found to be sensitive to variations in the cost of electricity used in the SOECunit. If the consumption weighted electricity price increases to around 140 kr./MWh thensimple upgraded biogas is cheaper than el upgraded.
The socio economic benefit of upgrading the biogas with electricity via SOEC technology iscalculated to be 353 mio. Kr per year or 40 kr./GJ for the extra gas produced.
In above base scenario there is a significant import of woody biomass to Denmark for pro-duction of el, heat and transport. If the biomass demand should be covered by national re-sources and natural gas was not available, the economic potential for upgrading of biogas aswell as production of biofuels from thermal gasification would increase considerably.
The overall conclusions from the socio economic study are:
· In an energy system dominated by renewable electricity production and high CO2
price el upgraded biogas via SOEC can outcompete natural gas, simple upgraded bio-gas or SNG from thermal gasification
· The socio economic gain in Denmark would be 350 mio kr. per year or 40 kr./GJ perGJ extra methane produced
-50
-40
-30
-20
-10
-
10
20
30
40
50
PJBr
ænd
selsf
orbr
ug(-)
ogGa
spro
dukt
ion
(+)
Simpelt opgraderetbiogas
Brint
Gylle og våd bio/affald(den omsættelige del)
El-opgraderet biogas
Biogas
32
· The amount of renewable methane from biogas production is increased by approxi-mately 30 % by using el upgrading
· The SOEC unit should operate at full load for 4600 – 4800 hours per year where theaverage weighted electricity price is 109 kr./MWh
· There exists a strong synergy with biogas engines for CHP production which will op-erate in the hours with high electricity prices
· The above scenario will not be realized in the near future but could be towards 2050
In order to arrive to this scenario, it is necessary, that the investment cost for the technol-ogy can be decreased to the foreseen level, the SOEC unit can be operated in a flexible man-ner with rapid start and stops (from a minimum hot load < 4 %) and a socio-economic tariffof 0 kr./MWh or lower can be obtained. Moreover if battery storage costs become very low orother countries than Denmark invest heavily in power-to-gas technology it is doubtful thatthe duration curve with low electricity prices for a significant part of the year will become re-ality.
3.8 Private investor perspectivePlanenergi has analyzed the economic aspects of the technology as seen from a private in-vestor perspective.
They have modelled the system shown on Figure 3-172. In addition to the SOEC electrolysisand methanation unit they have included both an option for biogas storage as well as hydro-gen storage. When the electricity prices are high the raw biogas can be sent to either a A)biogas engine or B) a SOFC generating power and heat or C) a simple amine upgrading unitproducing pipeline gas quality by discarding the CO2. Finally, there is also an option D) justto flare the gas. It is assumed that there is a constant flow of biogas year round at a con-stant biogas price.
Three operating strategies have been investigated:
a) The SOEC and the methanation are both operated constantly.· This leads to high hydrogen and SNG production costs in hours with a very
high electricity price.· No storages are required in this operation strategy.
b) The SOEC and the methanation are only operated when electricity prices are suffi-ciently low.
· Here, a biogas storage can be used for storing the constant biogas in-flowduring those hours when the methanation is not operating.
· Alternatively, the biogas can be flared or utilized for a different purpose dur-ing those hours when the methanation is not operating.
c) The SOEC is only operated when electricity prices are sufficiently low, but themethanation is operated constantly.
· This requires the SOEC to be scaled such that it can produce more hydrogenthan the methanation process can use during each hour.
· The excess hydrogen is injected to a hydrogen storage for usage duringhours where the SOEC is not operating.
A combination of strategy b) and c) could also be envisaged.

33
Figure 3-17: A schematic representation of the layout of the model system. The model as-sumes a constant in-flow of biogas, regardless if the methanation process is running or not.The energy conversion units with the dotted lines (biogas motor, SOFC, amine upgrading,flaring) serve as back-up options for consuming the biogas in case the methanation is notrunning. Only one of the back-up options is active during each model run.
The techno-economical model used is simulated in the software TRNSYS, which simulates thetechnical (e.g. energy flows, efficiencies) and economic (e.g. gas production cost, profit) op-eration of the SOEC, Sabatier methanation unit and gas storages throughout a whole year ina 1-hour resolution.
The four back-up types A-D therefore make up four different variations of the TRNSYSmodel. In case A), the biogas must be purchased from the source (at 3.25 DKK/Nm3), but issimply flared off. In case B), the upgraded SNG is assumed to be sold at the same price atthe methanised SNG, i.e. 6.00 DKK/Nm3. In cases C) and D), the produced electricity is as-sumed to be sold to the grid at the same variable price as electricity for the SOEC is pur-chased, and the produced heat is assumed to be sold at a fixed price of 200 DKK/MWh = 56kr./GJ.
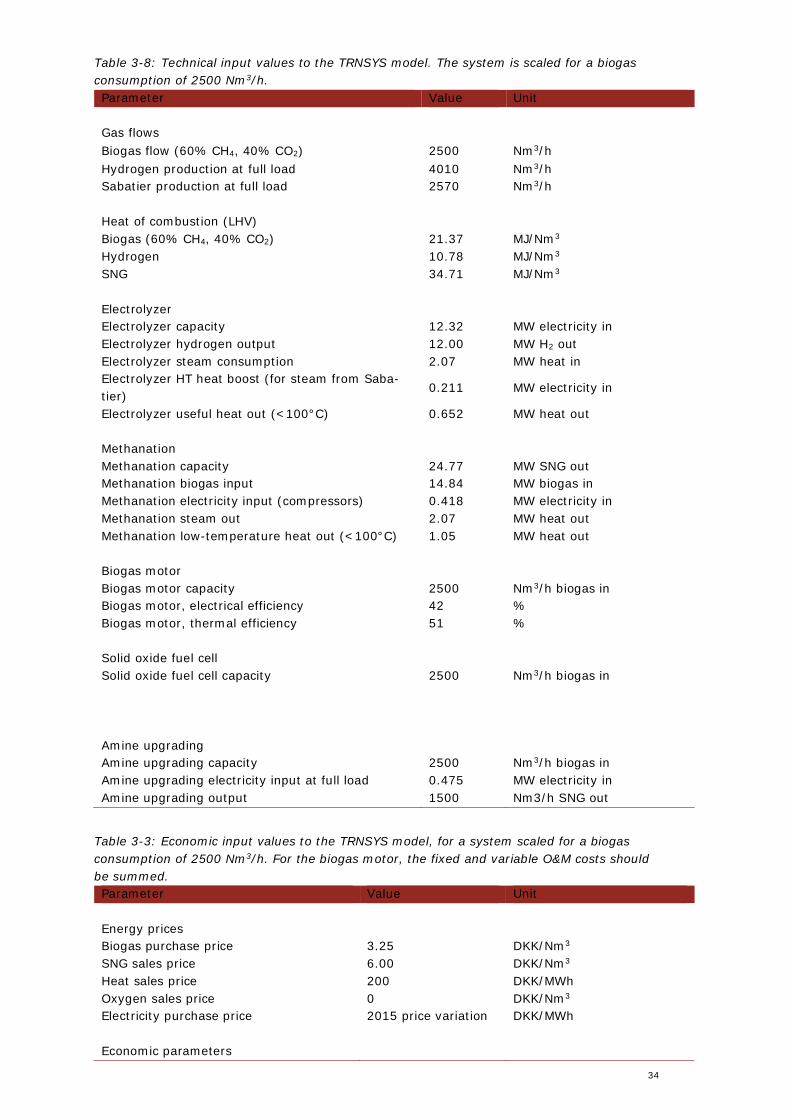
All numerical inputs to the TRNSYS model, are listed in this chapter. All assumptions for thetechnical input values (e.g. installed capacities, gas flows, efficiencies) to the TRNSYS modelare shown in Table 3-. All assumptions for the economic input values (e.g. investment costs,O&M costs, energy prices) are shown in Table 3-3. Flow charts for the energy inputs and out-puts of the system are shown in Figure 3-183 and Figure 3-194.
34
Table 3-8: Technical input values to the TRNSYS model. The system is scaled for a biogasconsumption of 2500 Nm3/h.Parameter Value Unit
Gas flowsBiogas flow (60% CH4, 40% CO2) 2500 Nm3/hHydrogen production at full load 4010 Nm3/hSabatier production at full load 2570 Nm3/h
Heat of combustion (LHV)Biogas (60% CH4, 40% CO2) 21.37 MJ/Nm3
Hydrogen 10.78 MJ/Nm3
SNG 34.71 MJ/Nm3
ElectrolyzerElectrolyzer capacity 12.32 MW electricity inElectrolyzer hydrogen output 12.00 MW H2 outElectrolyzer steam consumption 2.07 MW heat inElectrolyzer HT heat boost (for steam from Saba-tier)
0.211 MW electricity in
Electrolyzer useful heat out (<100°C) 0.652 MW heat out
MethanationMethanation capacity 24.77 MW SNG outMethanation biogas input 14.84 MW biogas inMethanation electricity input (compressors) 0.418 MW electricity inMethanation steam out 2.07 MW heat outMethanation low-temperature heat out (<100°C) 1.05 MW heat out
Biogas motorBiogas motor capacity 2500 Nm3/h biogas inBiogas motor, electrical efficiency 42 %Biogas motor, thermal efficiency 51 %
Solid oxide fuel cellSolid oxide fuel cell capacity 2500 Nm3/h biogas in
Amine upgradingAmine upgrading capacity 2500 Nm3/h biogas inAmine upgrading electricity input at full load 0.475 MW electricity inAmine upgrading output 1500 Nm3/h SNG out
Table 3-3: Economic input values to the TRNSYS model, for a system scaled for a biogasconsumption of 2500 Nm3/h. For the biogas motor, the fixed and variable O&M costs shouldbe summed.Parameter Value Unit
Energy pricesBiogas purchase price 3.25 DKK/Nm3
SNG sales price 6.00 DKK/Nm3
Heat sales price 200 DKK/MWhOxygen sales price 0 DKK/Nm3
Electricity purchase price 2015 price variation DKK/MWh
Economic parameters

35
Price level Fixed 2017 pricesReal interest rate 4 %Investment lifetime, amine upgrading 15 YearsInvestment lifetime, all other compo-nents
10 Years
Investment subsidy 0 % of investmentMax. no. of operation hours per year 8000 hours€ to DKK conversion rate 7.45 DKK/€
InvestmentsSolid oxide electrolyzer 3.22 Million DKK/MWSabatier (incl. biogas & SNG compres-sors)
5.52 Million DKK/MW
Amine upgrade 4.26 Million DKK/MWBiogas motor 1.00 Million DKK/MWSolid oxide fuel cell 11.20 Million DKK/MWFlaring 0.00 Million DKK/MWBiogas storage 19255 DKK/MWhHydrogen storage 48470 DKK/MWh
Operation & maintenance costsSolid oxide electrolyzer 3.00 % of investmentSabatier 3.00 % of investmentAmine upgrade 1.92 % of investmentBiogas motor, fixed O&M 1.00 % of investmentBiogas motor, variable O&M 59.60 DKK/MWhSolid oxide fuel cell 3.00 % of investmentFlaring 0.00 % of investmentBiogas storage 8.00 % of investmentHydrogen storage 2.00 % of investment
The model excludes all taxes and tariffs regarding electricity purchase and sales, CO2 emis-sions and the plant operation. The annualized capital expenses are calculated using the an-nuity payment formula:
=∙
1 − (1 + )(Eq. 12)
Here CAPEX denotes the total investment cost, r is the interest rate and n is the investmentlifetime in years.

36
Figu
re3-
183:
The
tota
lene
rgy
flow
sin
the
mod
elle
dsy
stem
,sh
own
inte
rms
ofga
sflo
ws
(Nm
3/h)
and
pow
er(M
W).
The
valu
eshe
reas
sum
ea
100%
scal
ing
ofth
eSO
ECan
dm
etha
natio
nun
its.
Figu
re3-
19Th
eto
tale
nerg
yflo
ws
inth
em
odel
led
syst
em,sh
own
inre
lativ
eun
itsw
here
the
elec
tric
ityin
put
for
the
elec
trol
yzer
has
been
set
to10
0un
its.
37
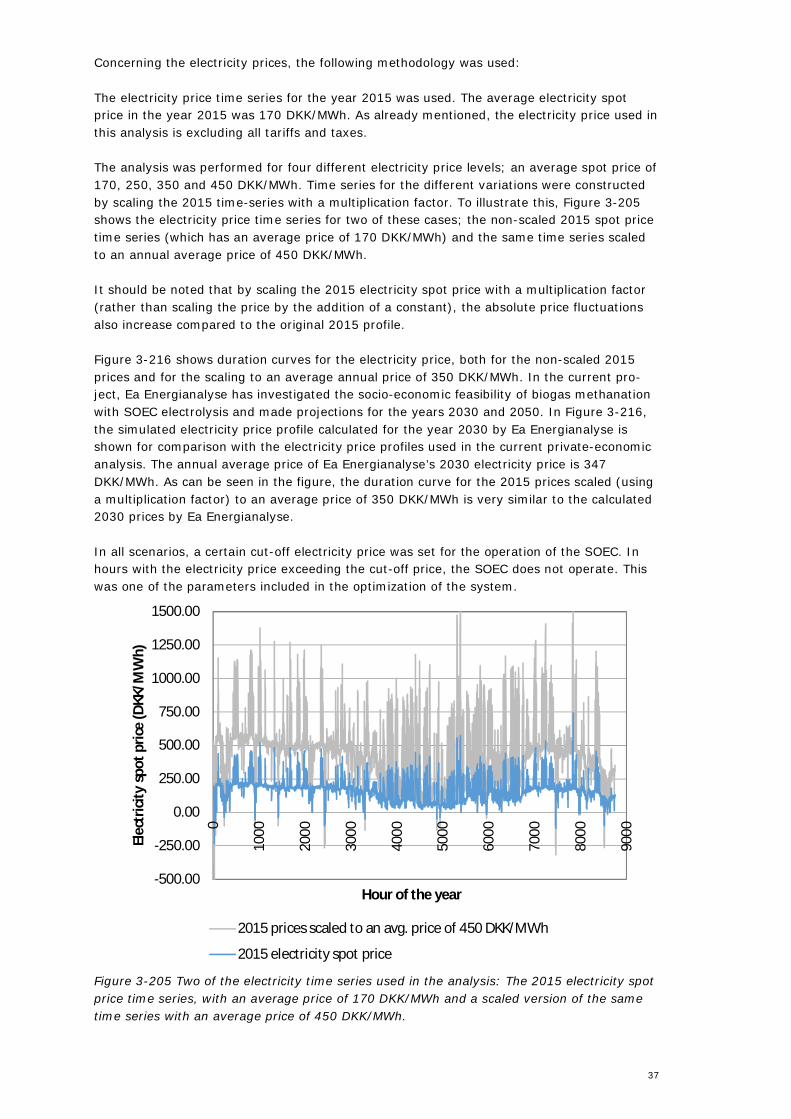
Concerning the electricity prices, the following methodology was used:
The electricity price time series for the year 2015 was used. The average electricity spotprice in the year 2015 was 170 DKK/MWh. As already mentioned, the electricity price used inthis analysis is excluding all tariffs and taxes.
The analysis was performed for four different electricity price levels; an average spot price of170, 250, 350 and 450 DKK/MWh. Time series for the different variations were constructedby scaling the 2015 time-series with a multiplication factor. To illustrate this, Figure 3-205shows the electricity price time series for two of these cases; the non-scaled 2015 spot pricetime series (which has an average price of 170 DKK/MWh) and the same time series scaledto an annual average price of 450 DKK/MWh.
It should be noted that by scaling the 2015 electricity spot price with a multiplication factor(rather than scaling the price by the addition of a constant), the absolute price fluctuationsalso increase compared to the original 2015 profile.
Figure 3-216 shows duration curves for the electricity price, both for the non-scaled 2015prices and for the scaling to an average annual price of 350 DKK/MWh. In the current pro-ject, Ea Energianalyse has investigated the socio-economic feasibility of biogas methanationwith SOEC electrolysis and made projections for the years 2030 and 2050. In Figure 3-216,the simulated electricity price profile calculated for the year 2030 by Ea Energianalyse isshown for comparison with the electricity price profiles used in the current private-economicanalysis. The annual average price of Ea Energianalyse’s 2030 electricity price is 347DKK/MWh. As can be seen in the figure, the duration curve for the 2015 prices scaled (usinga multiplication factor) to an average price of 350 DKK/MWh is very similar to the calculated2030 prices by Ea Energianalyse.
In all scenarios, a certain cut-off electricity price was set for the operation of the SOEC. Inhours with the electricity price exceeding the cut-off price, the SOEC does not operate. Thiswas one of the parameters included in the optimization of the system.
Figure 3-205 Two of the electricity time series used in the analysis: The 2015 electricity spotprice time series, with an average price of 170 DKK/MWh and a scaled version of the sametime series with an average price of 450 DKK/MWh.
-500.00
-250.00
0.00
250.00
500.00
750.00
1000.00
1250.00
1500.00
0
1000
2000
3000
4000
5000
6000
7000
8000
9000Elec
tric
itysp
otpr
ice
(DKK
/MW
h)
Hour of the year
2015 prices scaled to an avg. price of 450 DKK/MWh
2015 electricity spot price

38
Figure 3-216: Duration curves for the electricity spot price in 2015, the scaling to an averageannual price of 350 DKK/MWh and the 2030 price projection calculated by Ea Energianalyse.The duration curves with an average price of 350 DKK/MWh is very similar to the 2030 pro-jection.
The TRNSYS model was optimized using the optimization software GenOpt. The objective ofthe optimization algorithm was in all cases to maximize the annual profit from the system’soperation.
The optimization was performed for the following model variations:· Four different choices of back-up option for biogas consumption (options A-D)· Four different average electricity price level (170, 250, 350 and 450 DKK/MWh),
Furthermore, for each model variation, the optimization was performed with two differentsettings for the scaling of the electrolyzer and methanation capacity:
· A fixed 100% capacity of the electrolyzer and the methanator.· A variable capacity of the electrolyzer and the methanator. The scaling of the electro-
lyzer and the methanator were included as optimization parameters.
These variations lead to a total of 32 scenarios. In 16 of these scenarios, the electrolyzer andmethanator scaling were included as optimization parameters, while in the remaining 16 sce-narios the electrolyzer and methanator scaling was fixed at 100%.
The results of the optimization re shown on Figure 3-227.
The optimal electrolysis scaling was found to equal 100% in all scenarios with an averageelectricity price of 170 DKK/MWh. The optimal hydrogen storage capacity was found to equalzero for this electricity price level. For scenarios with an average electricity price of 250DKK/MWh or higher, the optimal electrolyzer scaling was found to be between 110% and127%, and the hydrogen storage capacity was found to be between 5.8 and 10.5 hours offull production. The optimal biogas storage capacity was found to equal zero in all analyses.
-500
-250
0
250
500
750
1000
1250
1500
138
276
311
4415
2519
0622
8726
6830
4934
3038
1141
9245
7349
5453
3557
1660
9764
7868
5972
4076
2180
0283
83
Elec
tric
itysp
otpr
ice
(DKK
/MW
h)
Hour
2015 electricity spot price2030 electricity price prognosis from Ea Energinalayse)2015 prices scaled to an avg. price of 350 DKK/MWh

39
a) Flaring
b) Amine upgrading
c) Biogas motor
d) Solid oxide fuel cell
Figure 3-227 The results of plant size optimization. The scaling of the electrolyzer and themethanator were optimized, as well as the storage capacity for hydrogen and biogas. Theoptimization of the biogas storage size yielded zero in all cases.
The electricity cut-off price for the SOEC, i.e. the price above which the electrolysis does notoperate, was one of the optimization parameters. The results for the cut-off price are shownon Fig. 3-28. For the scenarios with the lowest electricity price, no hydrogen storage is uti-lized and the cut-off level is rather high. For the scenarios with average electricity prices of250 DKK/MWh or higher, the electrolysis is slightly overdimensioned and small hydrogen
100118 117
127
100 100 100 100
0.09.1 9.6 10.5
0
5
10
15
20
25
0
25
50
75
100
125
170 250 350 450
Stor
age
Capa
city
(h)
Plan
tsiz
e(%
)
100112
121 124
100 100 100 100
0.0 5.8 7.3 6.60
5
10
15
20
25
0
25
50
75
100
125
170 250 350 450
Stor
age
Capa
city
(h)
Plan
tsiz
e(%
)
100110 118
127
100 100 100 100
0.08.1 8.4 9.4
0
5
10
15
20
25
0
25
50
75
100
125
170 250 350 450St
orag
eCa
paci
ty(h
)
Plan
tsiz
e(%
)
100113
127 122
100 100 100 100
0.07.7
9.66.6
0
5
10
15
20
25
0
25
50
75
100
125
170 250 350 450
Stor
age
Capa
city
(h)
Plan
tsiz
e(%
)
Average annual electricity price based on 2015 fluctuations (DKK/MWh)
SOEC Methanator H2 storage
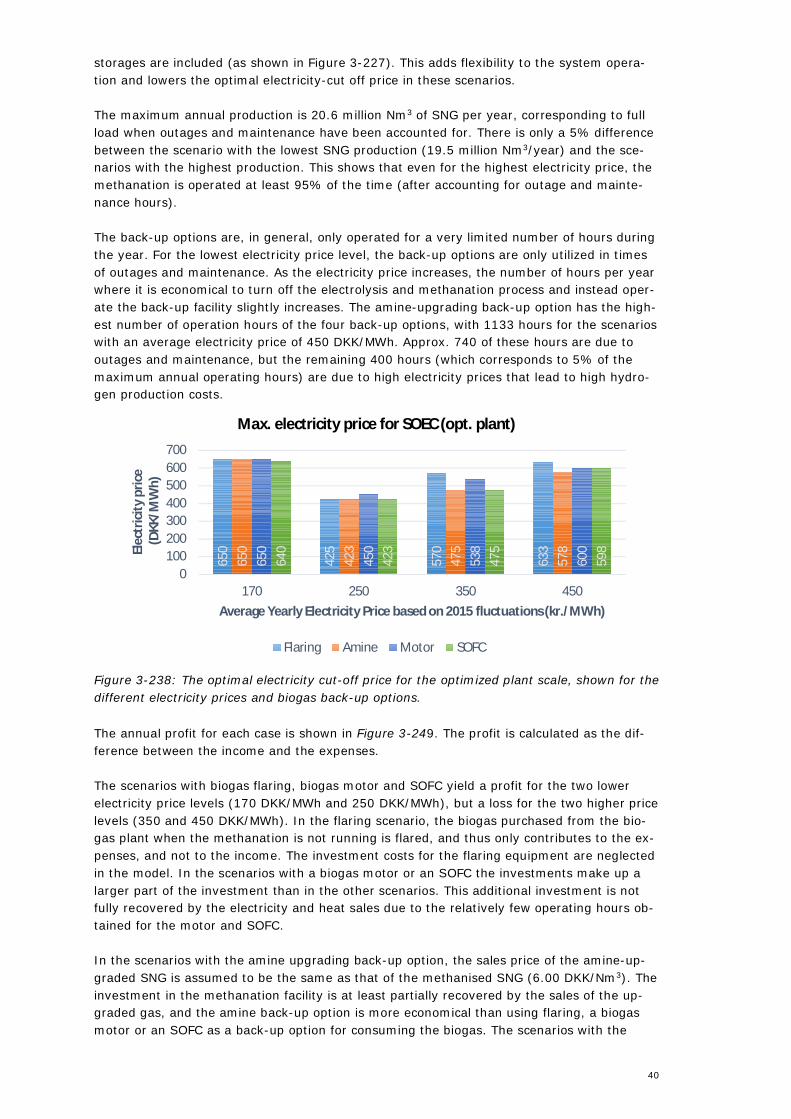
40
storages are included (as shown in Figure 3-227). This adds flexibility to the system opera-tion and lowers the optimal electricity-cut off price in these scenarios.
The maximum annual production is 20.6 million Nm3 of SNG per year, corresponding to fullload when outages and maintenance have been accounted for. There is only a 5% differencebetween the scenario with the lowest SNG production (19.5 million Nm3/year) and the sce-narios with the highest production. This shows that even for the highest electricity price, themethanation is operated at least 95% of the time (after accounting for outage and mainte-nance hours).
The back-up options are, in general, only operated for a very limited number of hours duringthe year. For the lowest electricity price level, the back-up options are only utilized in timesof outages and maintenance. As the electricity price increases, the number of hours per yearwhere it is economical to turn off the electrolysis and methanation process and instead oper-ate the back-up facility slightly increases. The amine-upgrading back-up option has the high-est number of operation hours of the four back-up options, with 1133 hours for the scenarioswith an average electricity price of 450 DKK/MWh. Approx. 740 of these hours are due tooutages and maintenance, but the remaining 400 hours (which corresponds to 5% of themaximum annual operating hours) are due to high electricity prices that lead to high hydro-gen production costs.
Figure 3-238: The optimal electricity cut-off price for the optimized plant scale, shown for thedifferent electricity prices and biogas back-up options.
The annual profit for each case is shown in Figure 3-249. The profit is calculated as the dif-ference between the income and the expenses.
The scenarios with biogas flaring, biogas motor and SOFC yield a profit for the two lowerelectricity price levels (170 DKK/MWh and 250 DKK/MWh), but a loss for the two higher pricelevels (350 and 450 DKK/MWh). In the flaring scenario, the biogas purchased from the bio-gas plant when the methanation is not running is flared, and thus only contributes to the ex-penses, and not to the income. The investment costs for the flaring equipment are neglectedin the model. In the scenarios with a biogas motor or an SOFC the investments make up alarger part of the investment than in the other scenarios. This additional investment is notfully recovered by the electricity and heat sales due to the relatively few operating hours ob-tained for the motor and SOFC.
In the scenarios with the amine upgrading back-up option, the sales price of the amine-up-graded SNG is assumed to be the same as that of the methanised SNG (6.00 DKK/Nm3). Theinvestment in the methanation facility is at least partially recovered by the sales of the up-graded gas, and the amine back-up option is more economical than using flaring, a biogasmotor or an SOFC as a back-up option for consuming the biogas. The scenarios with the
650
425
570
633
650
423
475
578
650
450
538
600
640
423
475
598
0100200300400500600700
170 250 350 450
Elec
tric
itypr
ice
(DKK
/MW
h)
Average Yearly Electricity Price based on 2015 fluctuations (kr./MWh)
Max. electricity price for SOEC (opt. plant)
Flaring Amine Motor SOFC

41
amine upgrading back-up option yield the highest profits out of all the back-up options, andyields a profit for an average electricity price of 350 DKK/MWh or lower.
Figure 3-249: The annual profit (or loss, in case of negative values) from the operation ofthe system.
The average production cost per cubic meter of SNG in the model is shown in Figure 3-3030.In the case of flaring, the production cost includes the purchase cost of the flared biogas. Inthe case of amine upgrading, the production cost is the weighted average of the productioncosts from the methanation and from the amine upgrading. In the case of the motor andSOFC, the calculation of the production cost includes the income from the sales of heat andelectricity.
Figure 3-30: The average production costs for the SNG in the model. The gray horizontal linedenotes the purchase price of biogas in the model and the yellow horizontal line denotes theselling price of the SNG in the model. The production costs must be lower than the SNG sell-ing price (6.00 DKK/Nm3) for the production to be profitable.
A 100% electrolyzer scaling and no hydrogen storage were found to yield the highest profitfor the lowest electricity price level (170 DKK/MWh), regardless of the back-up option. Forthis electricity price, the optimal electrolysis cut-off price was found to be 650 DKK/MWh.The unscaled 2015 electricity spot price profile only exceeds this price once throughout the
13.0
5.9
-2.0
-9.4
17.8
11.3
3.6
-3.5
11.5
4.9
-2.3
-9.1
7.2
0.8
-6.1
-12.
4-15
-10
-5
0
5
10
15
20
170 250 350 450
Annu
alpr
ofit
(mill
ion
DKK/
year
)
Average annual electricity price based on 2015 fluctuations (DKK/MWh)
Annual profit (optimized plant, excl. taxes)
Flaring Amine Motor SOFC
5.37
5.71
6.10
6.46
5.18
5.48
5.83
6.17
5.44
5.76
6.11
6.65
5.65
5.96
6.30
6.63
01234567
170 250 350 450
SNG
prod
uctio
nco
st(D
KK/N
m3)
Average annual electricity price based on 2015 fluctuations (DKK/MWh)
SNG Production cost (optimized plant)
Flaring Amine Motor SOFC Biogas price SNG price

42
year. This means that in these scenarios the back-up options almost only operate when theelectrolysis and methanation plant has outages or is under maintenance. For the higher elec-tricity price levels (250-450 DKK/MWh), some over-dimensioning of the electrolysis (110-127% scaling relative to the methanation) and the introduction of small hydrogen storages(approx. 6-11 hours’ production) is found to yield a higher profit than a 100% scaling withno storage. The optimal biogas storage capacity was in all cases found to equal zero.
In the cases with over-dimensioned electrolysis and where hydrogen storages are present,the system has greater flexibility and can produce SNG even when the electricity price isabove the cut-off price, as long as hydrogen can be extracted from the storage. As a conse-quence of this flexibility, the methanation process runs most of the time (7600 hours/year ormore in all scenarios), meaning that the back-up facilities obtain rather few operating hours(1160 or less operating hours/year). In all scenarios, operation and maintenance accountsfor 735 hours/year where the electrolysis and methanation are not running, and where theback-up facilities must consume the biogas (regardless if the back-up operation during thesehours is economical or not). The back-up facilities therefore only obtain 400 hours/year orless during hours in which the model is actually free to choose between the methanation pro-cess or the back-up process. This corresponds to only 5% of the full annual operating hoursof the plant (8000 hours/year, when outage and maintenance hours have been subtracted).
The main reason for the few operating hours obtained by the back-up units for consumptionof biogas is that it is economically difficult to compete with the SNG sales price of 6.00DKK/Nm3. To put the SNG price into perspective with the electricity prices, 6.00 DKK/Nm3
SNG equals 594 DKK/MWh SNG. The electricity produced by the motor or the SOFC can onlyvery rarely be sold at a price above 594 DKK/MWh, and the heat produced by the motor orthe SOFC is assumed to have a sales price of 200 DKK/MWh at all times. The efficiency ofthe motor and the SOFC is furthermore lower than that of the methanation reactor, meaningthat they yield less useful energy output for each unit of purchased biogas.
The amine upgrading back-up facility has the best economy of the four back-up options forbiogas consumption. Despite the few annual operating hours of the back-up facilities, it isstill more profitable to invest in an amine upgrading facility than to simply flare off the gas.This is because in the model, the biogas must be purchased at 3.25 DKK/Nm3 during allhours of the year. The flaring is therefore not free of cost, and in the model flaring the gas isless economical than investing in an amine upgrading facility that runs 700-1100 hours/yearand sells the upgraded gas at 6.00 DKK/Nm3.
The results of this study strongly indicate that methanation of biogas using hydrogen fromSOEC can be economical if some conditions are fulfilled:
· The electricity price to the SOEC is no higher than 250-350 DKK/MWh on an annualaverage basis (the exact value depends on the hourly price distribution and on thechoice of a back-up option for biogas consumption).
· The produced SNG can be sold at a price of 6.00 DKK/Nm3 or higher.· The steam output from the methanation is utilized as an input for the SOEC process.
The investment costs, O&M costs and durability of the SOEC follow the anticipated develop-ment (reflected in the assumptions used in this analysis) in the next 5-10 years.

43
3.9 Dissemination of results
The national as well as international interest in the project concept is considerable resultingin many requests for presentations. A number of lecturers have accordingly been given:
Ø IEA Working Group on Small Hydrogen Plants and Electrolyzers, Hartford, Connecticut,September 26-27, 2013Ø Electrochemical Society, SOFC XIII Conference, Okinawa, Japan, October 10, 2013Ø Key Note lecture at ECS Fall Meeting, San Francisco, October 30, 2013Ø DTU/DI Energilagrings Konference, Lyngby, November 14, 2013Ø Invited Key Lecture, Dutch Sustainable Hydrogen Society, Holland, November 27, 2013
including interview for Dutch chemistry trade journalØ Invited Lecture at Research Coordination Network Carbon Capture and Utilization, Co-
lumbia University, New York, April 2, 2014Ø Invited Presentation: “2nd Workshop Methanation and 2nd generation Fuels”, Nürnberg,
June 12, 2014Ø Invited Presentation at ASME Turbo Conference, Düsseldorf, June 16, 2014Ø Faraday Discussions, York, July 12-15, 201Ø IEA Biomass Conversion Conference, Berlin, October 27-30, 2015Ø IEA Annex 33, Hydrogen Implementing Agreement, Paris, March 9-11, 2016Ø 3rd Nürnberg Methanation Symposium, Nürnberg, April 8-9, 2016Ø EUDP Board Meeting Presentation, Foulum, August, 2016Ø Gordon Conference on Green Chemistry, Stoweflake, VT, August 1-5, 2016Ø World Green Energy Forum, Gyeongju, S. Korea, November 8-10, 2016Ø Biogasbranchens Temadag, København, March 7, 2017Ø International Methanol Conference, Taastrup, May 10, 2017Ø ECS Springs Meeting, New Orleans, LA, May 30, 2017
In connection with the Scandinavian Biogasconference: Biogas2020 the complete project re-sults were presented at an afternoon session on November 9, 2017.
The following articles and papers have been published:
· “Elopgradering af biogas startet med success”, Gasenergi nr. 5, 2016· ”SOEC Enabled Biogas Upgrading”, Proceedings of the 12th European SOFC & SOE Fo-
rum, Luzern, Switzerland, 20163· ““Vindmøllemetan” kan konkurrere med biometan”, FIB nr. 59, Marts 2013· “Operating experiences with a 50 kW SOEC unit integrated with a catalytic methana-
tion unit for biogas upgrading”, Proceedings of EFC2017, December 12-15, 2017,Naples, Italy
and are attached as Annex 1-4
In addition an invited visit has been paid to the Audi biogas + alkaline electrolysis +methanation plant in Wertle, Germany, April 2, 2014
3.10 Utilization of project results
The results obtained in the project is already being used by Haldor Topsøe A/S to offer com-plete desulfurization and methanation plants for biogas upgrading on normal commercialterms including guarantees. This has been made possible by the demonstration of the feasi-bility as well as durability of the developed design.

44
At the start of the project the SOEC technology from Haldor Topsøe A/S had only been testedat a single stack level for hydrogen production in laboratory settings so the experiencegained in the project has provided essential data to increase the confidence in the technol-ogy. Nevertheless, the SOEC stacks and cores need some further developments and demon-strations are deemed necessary in order to bring the technology readiness level from thepresent level 6 to TRL 8. The results obtained in this project have been used to refine operat-ing and preventive maintenance procedures, which will be implemented in a new EUDP pro-ject.
The results from the present project have, however, confirmed the assumptions for the de-sign of full scale, complete plants with respect to consumption and investment parameters.The experience has also further underlined the benefits which could be obtained if pressur-ized SOEC were developed.
The economic analyses have demonstrated that political initiatives are needed with respectto incentive schemes in order to make the business case attractive for private investors.
The business model of Haldor Topsøe A/S for the roll out of SOEC based technology havebeen adjusted accordingly so that market implementation is foreseen to start in 2025 andlarge scale implementation from 2035. The SOEC based eCOS plants for carbon monoxideion demand production has, however, already been commercialized.
The present and coming demonstration projects are obviously a very important part of themarket preparation, not only for biogas upgrading but also for hydrogen, methanol/DME,ammonia and other SOEC based technologies. This should lead to a market uptake from2020 – 2025 provided the changes in political regulatory measures are implemented.
Clear environmental and energy supply security benefits have, however been identified andthe technology could be a key enabler for realizing the ambitious Danish energy policy objec-tives.

45
4. Project conclusion and perspective
From above results it can be concluded that:
1. SOEC electrolysis can produce hydrogen from steam electrolysis at very high effi-ciency approaching 98 %
2. The stability of the stacks is promising, but longer tests are needed to confirm multi-year stability
3. Stack degradation can be countered by a gradual increase in operating temperaturewith neglible impact on efficiency
4. Desulfurization and CO2 methanation technology is ready for commercial deployment5. Both the SOEC and methanation units can cope with rapid transients6. Methanation of biogas using hydrogen from SOEC can be economical if some condi-
tions are fulfilled:a. The electricity price to the SOEC is no higher than 250-350 DKK/MWh on an
annual average basis (the exact value depends on the hourly price distribu-tion and on the choice of a back-up option for biogas consumption).
b. The produced SNG can be sold at a price of 6.00 DKK/Nm3 or higher.7. In an energy system dominated by renewable electricity production and high CO2
price el upgraded biogas via SOEC can outcompete natural gas, simple upgraded bio-gas or SNG from thermal gasification
8. The socio economic gain in Denmark would be 350 mio kr. per year or 40 kr./GJ perGJ extra methane produced
9. The amount of renewable methane from biogas production is increased by approxi-mately 30 % by using el upgrading
10. The SOEC unit should operate at full load for 4600 – 4800 hours per year where theaverage weighted electricity price is 109 kr./MWh
The above scenarios will not be realized in the near future but could be in future sustainableenergy scenarios.
The clear environmental and energy supply security benefits have, however been identifiedand the technology could be a key enabler for realizing the ambitious Danish energy policyobjectives.
46
4.1.1.1 References(EN16723)European biomethane standards for grid injection and vehicle fuel use, no. April, 2017.
(GasreglementC12)Krav til gaskvalitet i det danske naturgasnet, avaliable online:https://www.sik.dk/Virksomhed/Gas-kloak-vand-og-afloeb-for-fagfolk/Love-og-regler-om-gas-og-vvs/Gasreglementet
(GasInfrastructureEurope)BIOSURF Biomethane Workshop, Brussels, 5 Aprilhttp://www.gie.eu/index.php/publications/cat_view/13-gie-workshops/20576-2017-work-shops/20577-gie-ergar-cedec-biosurf-biomethane-workshop-brussels-5-april
(Hjuler, 2017)Hjuler, K., Electrically upgraded biogas - task report on gas quality, Dansk Gasteknisk Cen-ter, 2017
(Yan, 2002)Yan, R., Liang, D. T., Tsen, L., Tay, J. H., Kinetics and Mechanisms of H2S Adsorption by Al-kaline Activated Carbon, Environ. Sci. Technol. 2002, 36, 4460-4466.
Ea Energianalyse, 2016: Biogas og andre VE-brændsler til tung transport. *Data for det Fly-dende brændstof-scenarie.
Energinet.dk, 2015: ”Udviklingsforløb for omstilling af individuelle opvarmningsteknologierfrem mod 2035”. Gasforbruget er antaget uændret fra 2035 til 2050.
Ea Energianalyse, 2014: ”Biogas til proces: ”Analyse af potentiale og rammebetingelser”.*Brændselsforbrug hvor brændslet er integreret i processen under høj temperatur.
*Kilde: Agrotech (2013), ”Biomasse til biogasanlæg i Danmark - på kort og langt sigt”
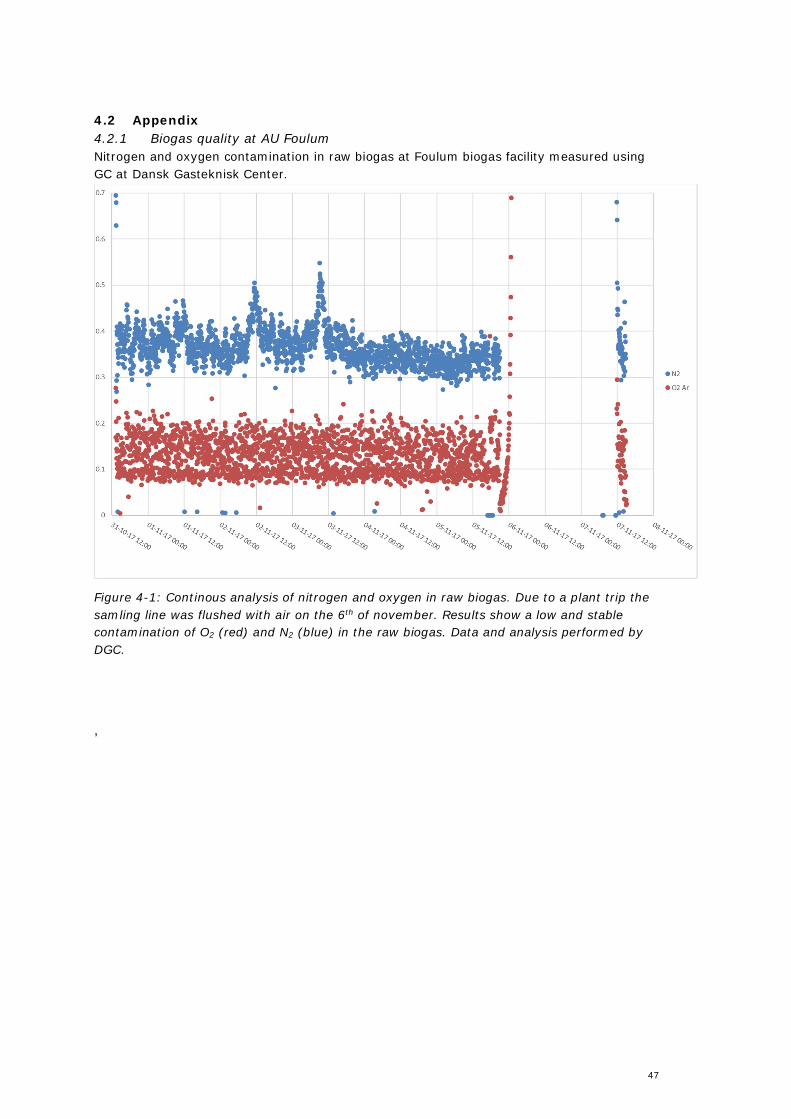
47
4.2 Appendix4.2.1 Biogas quality at AU FoulumNitrogen and oxygen contamination in raw biogas at Foulum biogas facility measured usingGC at Dansk Gasteknisk Center.
Figure 4-1: Continous analysis of nitrogen and oxygen in raw biogas. Due to a plant trip thesamling line was flushed with air on the 6th of november. Results show a low and stablecontamination of O2 (red) and N2 (blue) in the raw biogas. Data and analysis performed byDGC.
,


