BOSTON DALLAS DENVER LOS ANGELES MENLO PARK MONTREAL NEW YORK SAN FRANCISCO WASHINGTON Electricity and Gas – Two Unique Energy Commodities: How They Work Susan Tierney – Managing Principal, Analysis Group Introduction to Electricity & Natural Gas Regulation – A Primer Law Seminars International March 15, 2007 – Washington, DC
Transcript
BOSTON DALLAS DENVER LOS ANGELES MENLO PARK MONTREAL NEW YORK SAN FRANCISCO WASHINGTON
Electricity and Gas –Two Unique Energy Commodities:How They Work
Susan Tierney –Managing Principal, Analysis Group
Introduction to Electricity &Natural Gas Regulation – A PrimerLaw Seminars InternationalMarch 15, 2007 – Washington, DC
22
““Industrial Organization 101Industrial Organization 101””::The Electric and Gas IndustriesThe Electric and Gas Industries
The mechanics of gas and electric supply chains The structure of the gas and electric industries:
Defining features that led to a combination of regulatedmonopoly and competitive forms
Institutions and organizations Inputs, outputs, prices
Establishing some of the building blocks(technical/economic/institutional) for understandingsubsequent topics in the workshop:
Utility regulation: economic and legal foundations The regulatory framework – past, present and future Legislative and administrative processes Infrastructure development, technologies Special topics: reliability; trading
33
The Electric Industry The Electric Industry ––The Supply ChainThe Supply Chain
44
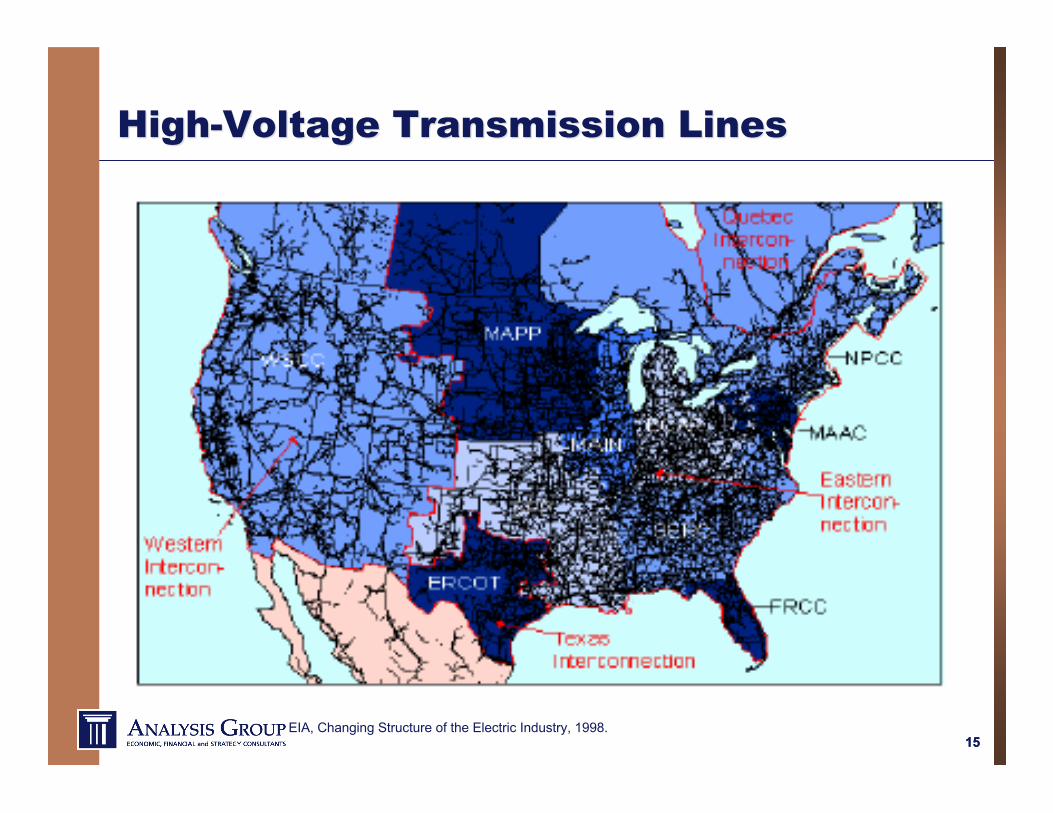
The U.S. Electric SystemThe U.S. Electric System
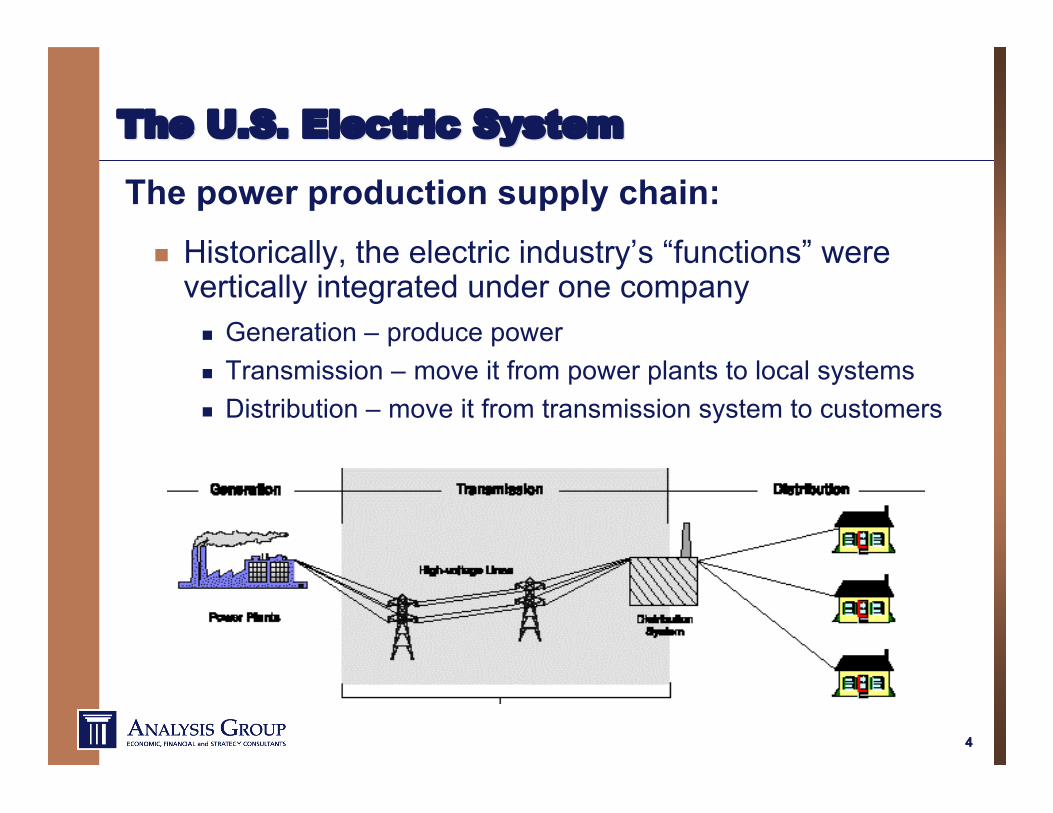
The power production supply chain: Historically, the electric industry’s “functions” were
vertically integrated under one company Generation – produce power Transmission – move it from power plants to local systems Distribution – move it from transmission system to customers
55
Supplying Power to CustomersSupplying Power to Customers
Mechanics of power supply: Power supply must meet power demand at all times System control function needed to dispatch plants up
and down to meet constantly changing load Resources to supply power:
“capacity” (kw, mW) – hardware capable of producing power “energy” (kwh, mwh) – output from a plant over time ancillary services (e.g., balancing, reserves) “avoided power” – demand-side resources
Plants dispatched and operated according to certainprotocols designed to meet load reliability andeconomically
66
The Supply Chain: Power ProductionThe Supply Chain: Power Production
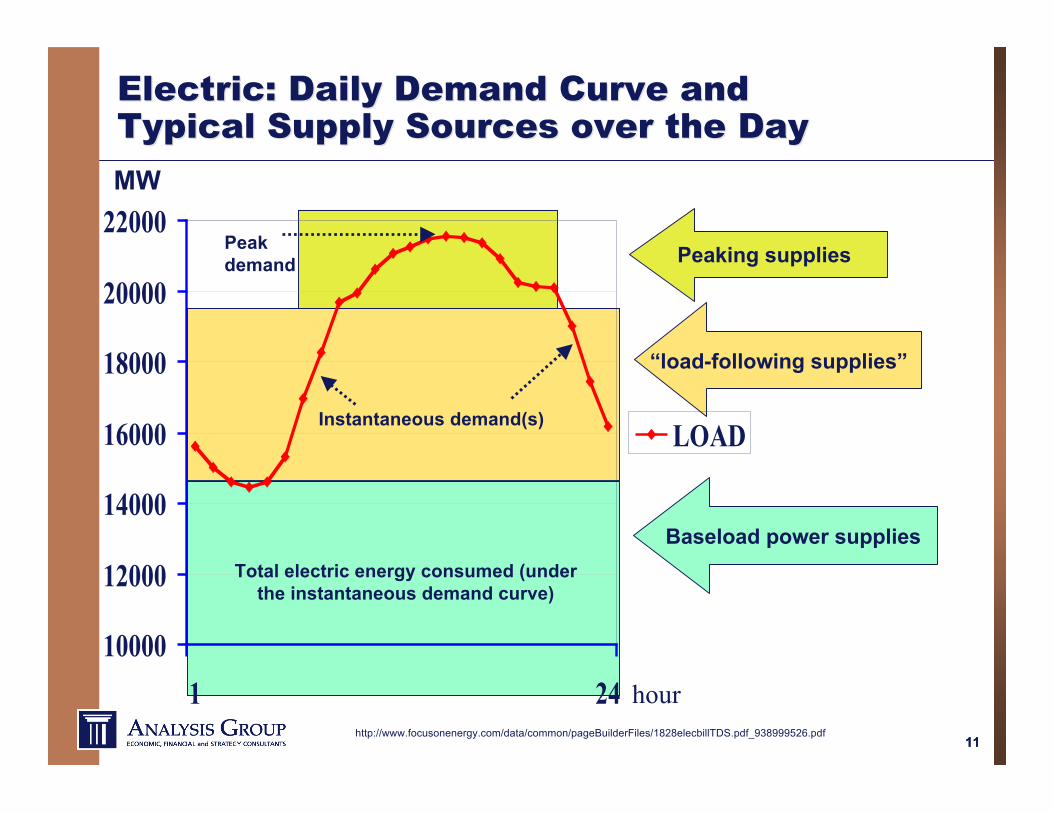
Several sources of power production – differenttechnologies, different functions:
Baseload plants– Burn fuel to create steam which turns turbines– Typically relatively expensive and time-consuming to
build– Typically slow to start up from “cold” start– Designed to run around the clock (to make the capital
investment worthwhile, and to avoid slow-start up)– Typically designed to run on a single fuel (e.g.,
nuclear, coal), although some can “fuel switch” (e.g.,oil, natural gas)
77
““ThermalThermal”” power production power production
88
The Supply Chain: Power ProductionThe Supply Chain: Power Production
Several sources of power production – differenttechnologies, different functions:
Load-following plants: combined-cycle plants– Lower capital costs– Ability to more easily “ramp up and down”
Peaking plants: gas turbines, other quick-startmachines– Relatively cheap to build; expensive to operate– Designed to start up quickly and operate for short periods
Specialty power production facilities:– Cogeneration– wind turbines– hydro– Distributed generation
99
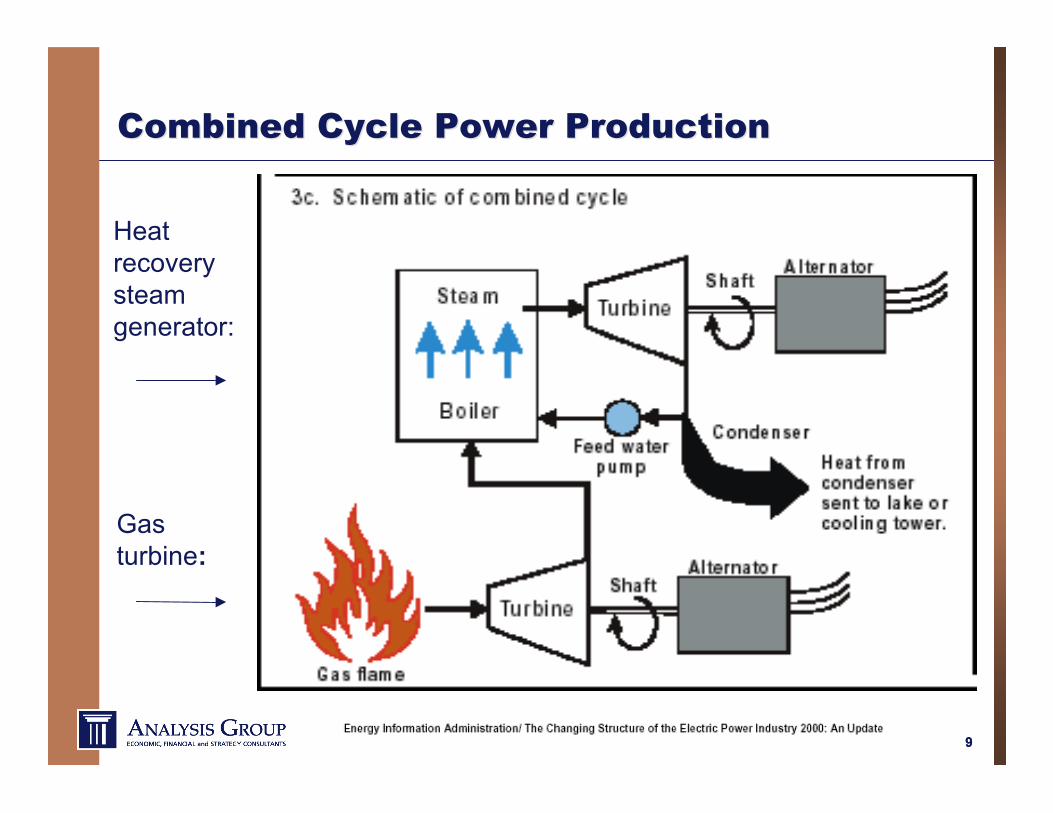
Combined Cycle Power ProductionCombined Cycle Power Production
Gasturbine:
Heatrecoverysteamgenerator:
1010
The Supply Chain: Power ProductionThe Supply Chain: Power Production
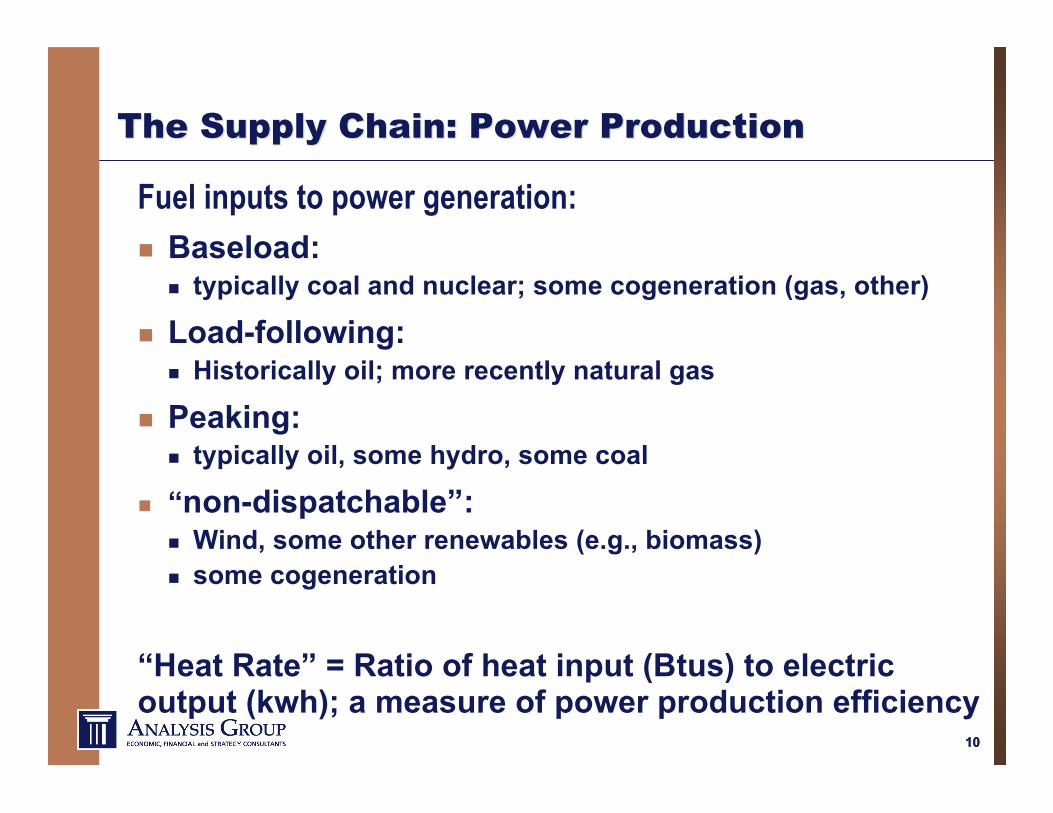
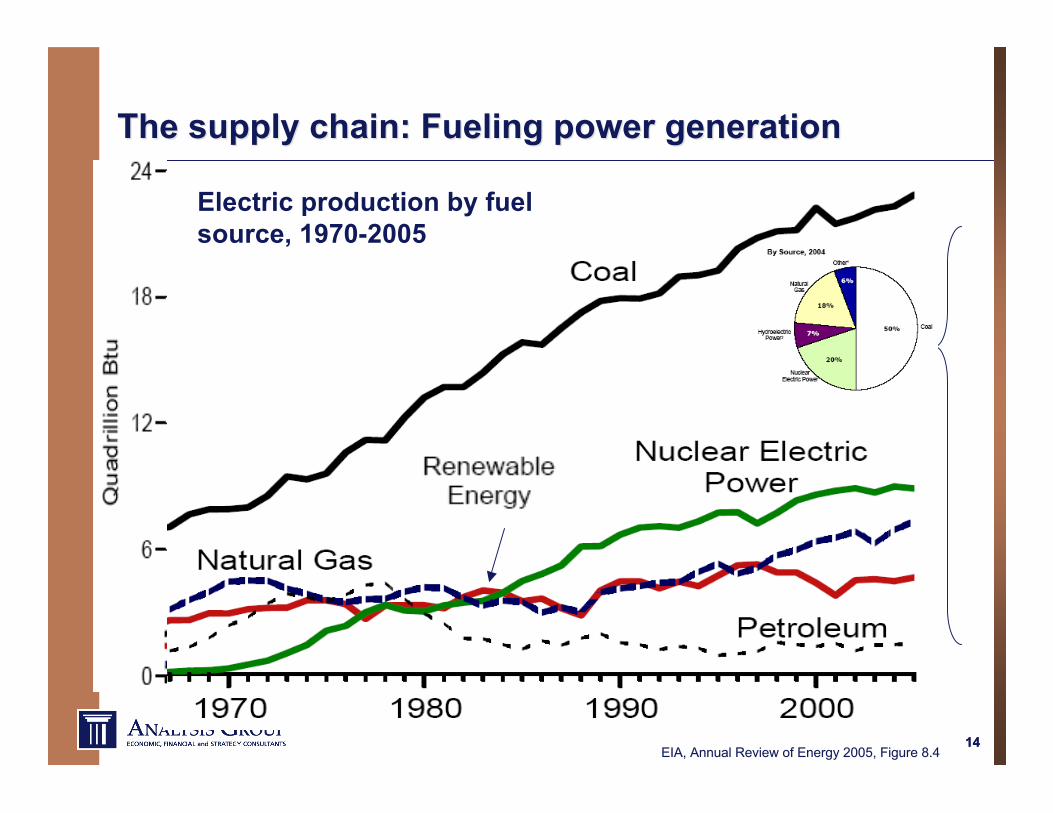
Fuel inputs to power generation:
Baseload: typically coal and nuclear; some cogeneration (gas, other)
Load-following: Historically oil; more recently natural gas
Peaking: typically oil, some hydro, some coal
“non-dispatchable”: Wind, some other renewables (e.g., biomass) some cogeneration
“Heat Rate” = Ratio of heat input (Btus) to electricoutput (kwh); a measure of power production efficiency
1111
Electric: Daily Demand Curve andElectric: Daily Demand Curve andTypical Supply Sources over the DayTypical Supply Sources over the Day
EIA, Changing Structure of the Electric Industry, 1998.
1616
The Supply Chain: Power deliveryThe Supply Chain: Power delivery
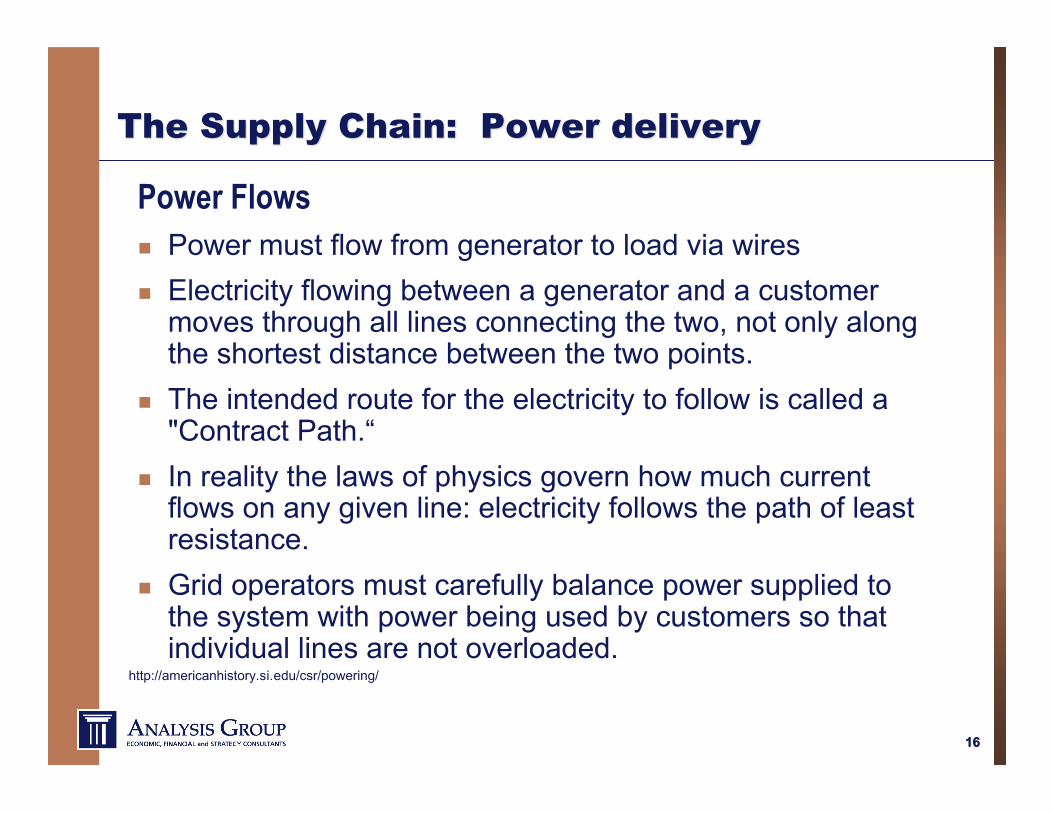
Power Flows Power must flow from generator to load via wires Electricity flowing between a generator and a customer
moves through all lines connecting the two, not only alongthe shortest distance between the two points.
The intended route for the electricity to follow is called a"Contract Path.“
In reality the laws of physics govern how much currentflows on any given line: electricity follows the path of leastresistance.
Grid operators must carefully balance power supplied tothe system with power being used by customers so thatindividual lines are not overloaded.
http://americanhistory.si.edu/csr/powering/
1717
The Supply Chain: Power deliveryThe Supply Chain: Power delivery
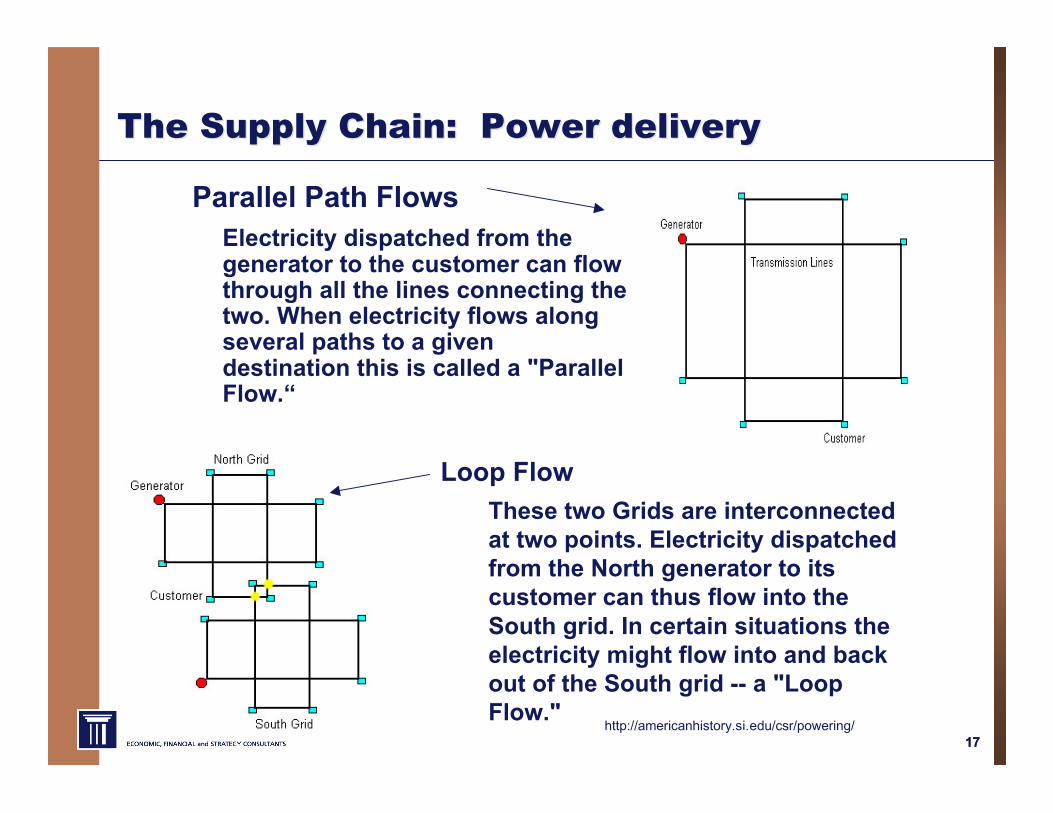
Parallel Path FlowsElectricity dispatched from thegenerator to the customer can flowthrough all the lines connecting thetwo. When electricity flows alongseveral paths to a givendestination this is called a "ParallelFlow.“
http://americanhistory.si.edu/csr/powering/
Loop FlowThese two Grids are interconnectedat two points. Electricity dispatchedfrom the North generator to itscustomer can thus flow into theSouth grid. In certain situations theelectricity might flow into and backout of the South grid -- a "LoopFlow."
1818
Retail Sales of Electricity (1970-2005)Retail Sales of Electricity (1970-2005)
EIA, Annual Review of Energy 2005, Figure 8.9. EIA, Annual Review of Energy 2005, Figure 8.9.
Overall growth rates recently = 2.5%/year in past decade.
Generation investment has kept apace.
Transmission investment has lagged recently.
1919
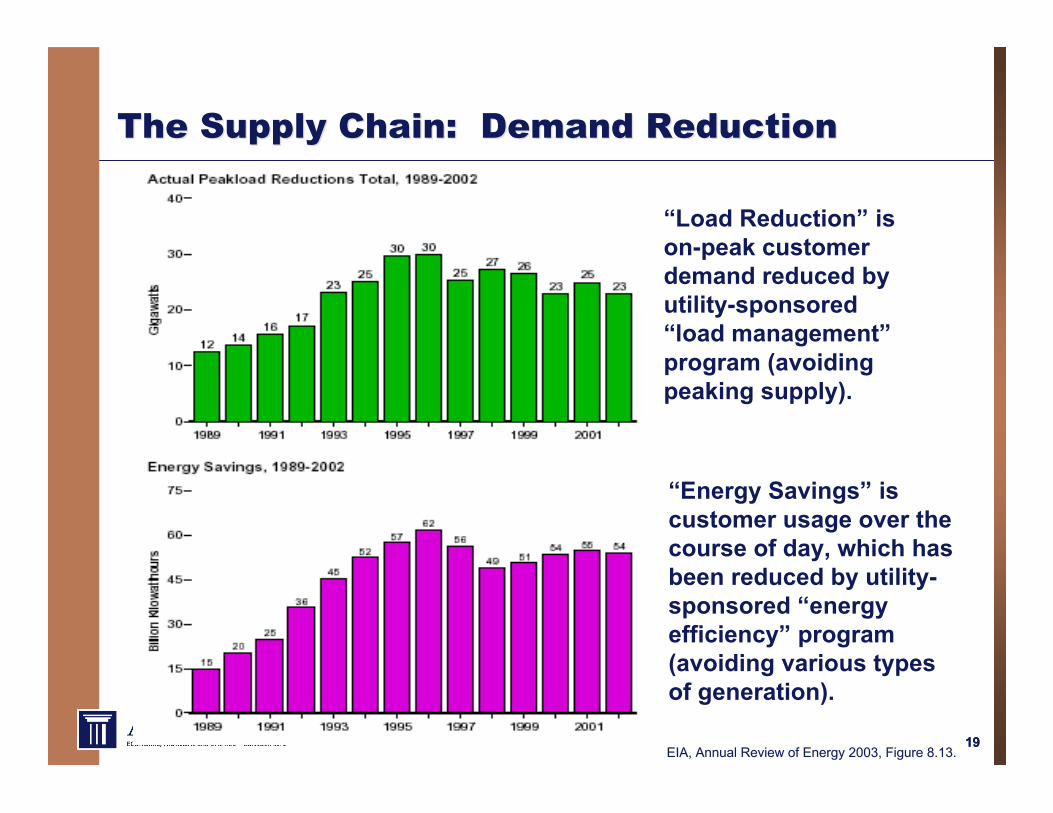
The Supply Chain: Demand ReductionThe Supply Chain: Demand Reduction
EIA, Annual Review of Energy 2003, Figure 8.13. EIA, Annual Review of Energy 2003, Figure 8.13.
“Energy Savings” iscustomer usage over thecourse of day, which hasbeen reduced by utility-sponsored “energyefficiency” program(avoiding various typesof generation).
2020
The U.S. Electric SystemThe U.S. Electric System
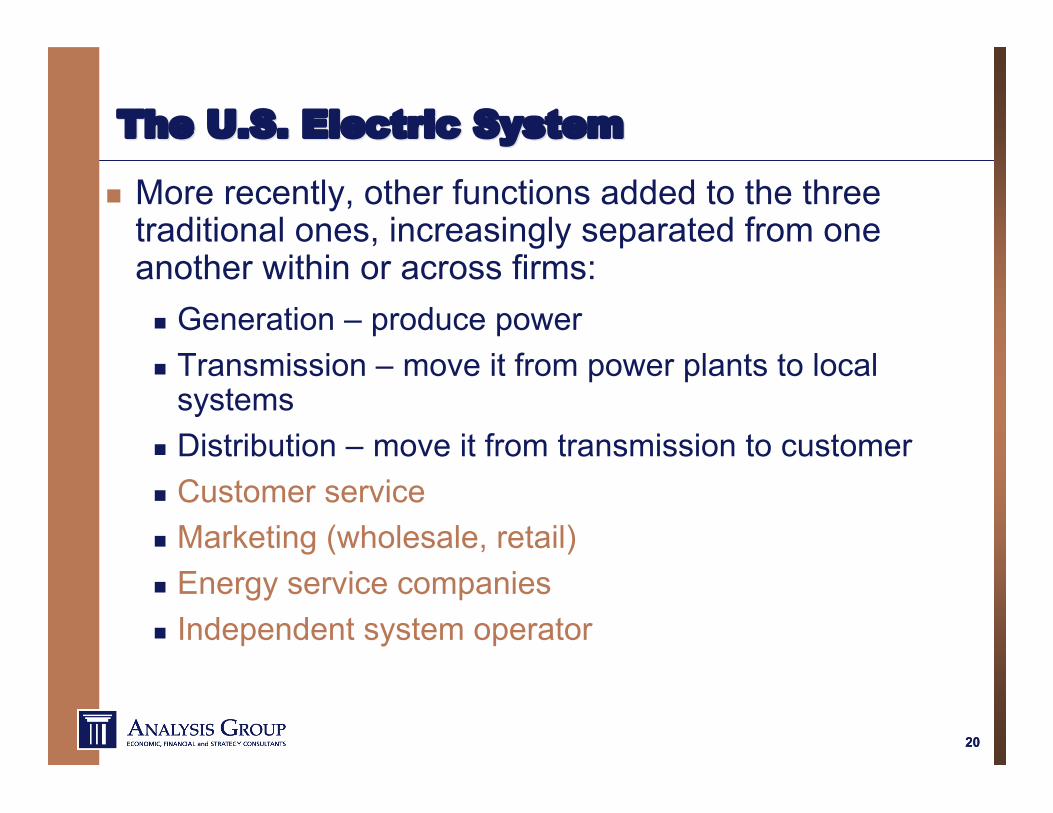
More recently, other functions added to the threetraditional ones, increasingly separated from oneanother within or across firms: Generation – produce power Transmission – move it from power plants to local
systems Distribution – move it from transmission to customer Customer service Marketing (wholesale, retail) Energy service companies Independent system operator
2121
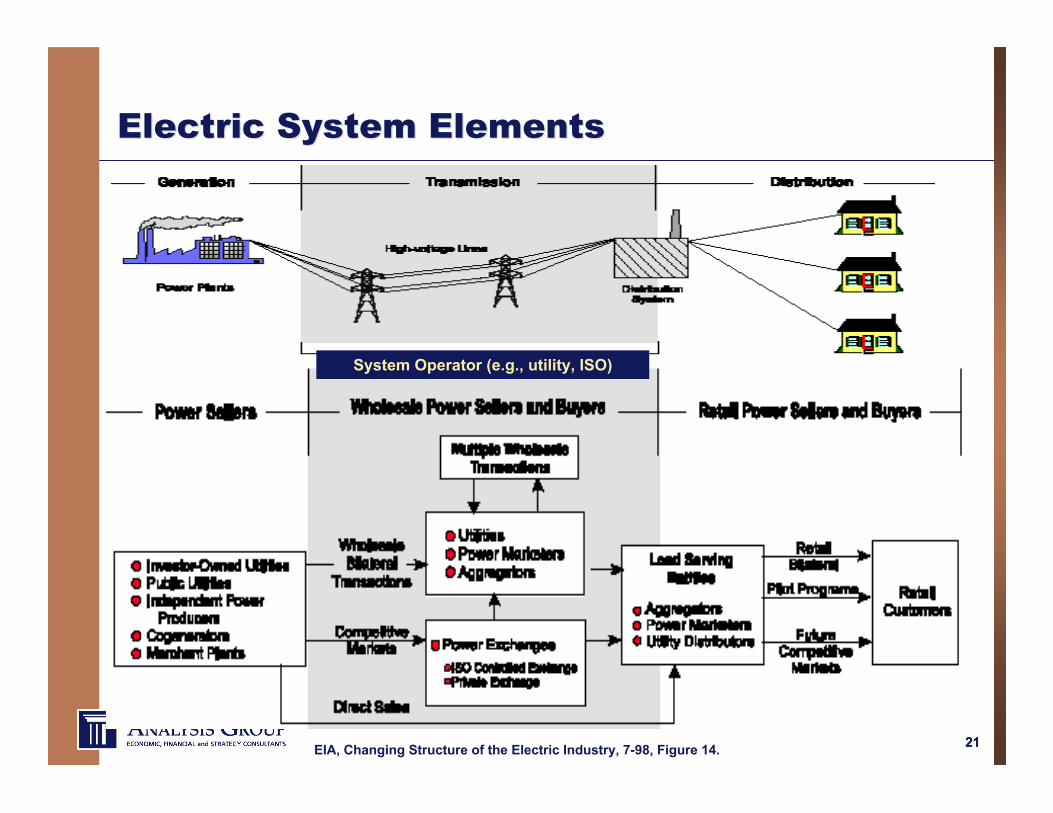
Electric System ElementsElectric System Elements
EIA, Changing Structure of the Electric Industry, 7-98, Figure 14.
System Operator (e.g., utility, ISO)
2222
Defining Features of theDefining Features of theElectric IndustryElectric Industry
2323
Defining features of the electric industry:Defining features of the electric industry:Physical and technical featuresPhysical and technical features
Electricity cannot be stored. Need to physically balance supply and demand at all times
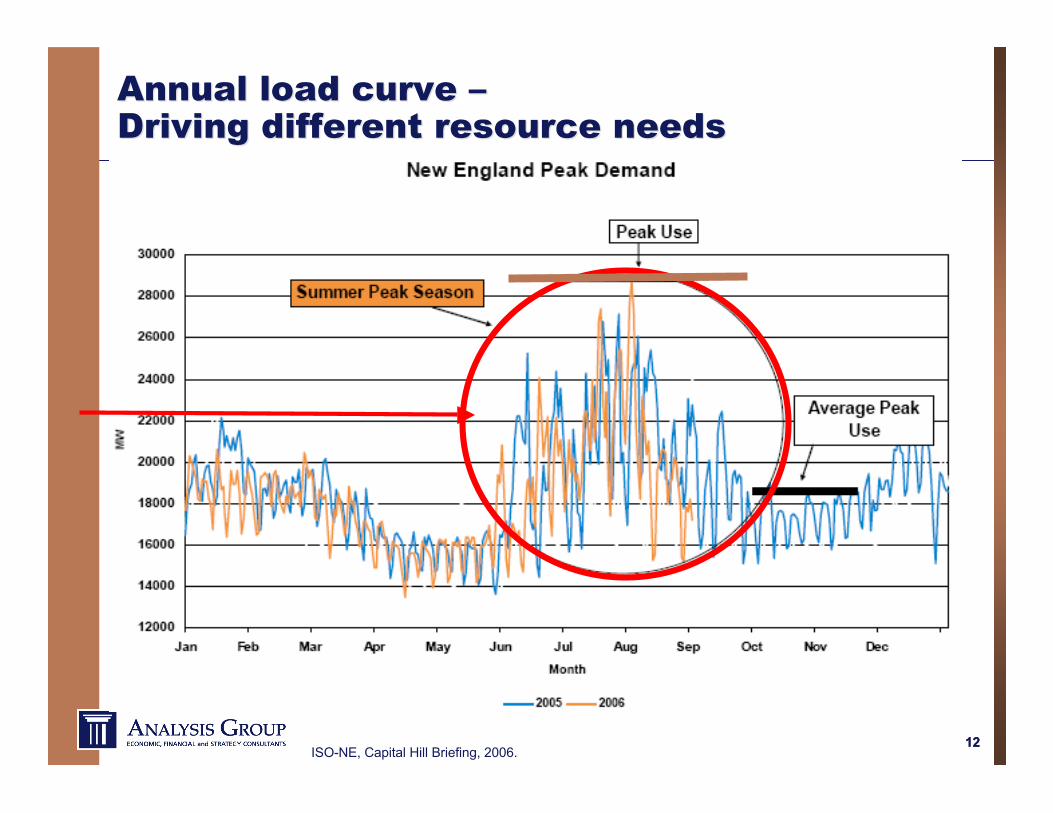
and points on the system. Demand (customer load) fluctuates over the day, across
seasons. Cost to produce power varies over course of day. “Reserves” needed: more capacity in place, to assure supply to
load even when there are planned and unplanned outages. Large amount of capacity operates small % of year, is
sensitive to peak prices. Consumers’ demand is relatively inelastic – in part because
most customers do not see “real-time” power costs. Meeting demand (at all times and places) is subject to
capacity constraints.
2424
Defining features of the electric industry:Defining features of the electric industry:Physical and technical featuresPhysical and technical features
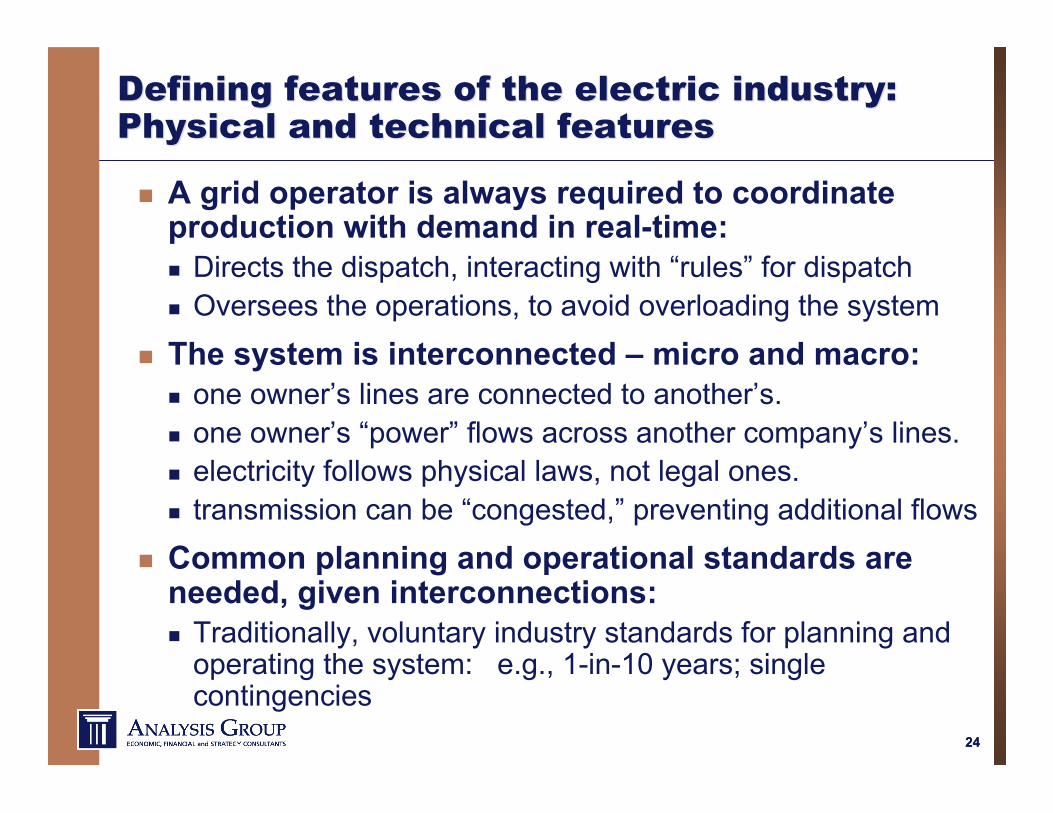
A grid operator is always required to coordinateproduction with demand in real-time: Directs the dispatch, interacting with “rules” for dispatch Oversees the operations, to avoid overloading the system
The system is interconnected – micro and macro: one owner’s lines are connected to another’s. one owner’s “power” flows across another company’s lines. electricity follows physical laws, not legal ones. transmission can be “congested,” preventing additional flows
Common planning and operational standards areneeded, given interconnections: Traditionally, voluntary industry standards for planning and
operating the system: e.g., 1-in-10 years; singlecontingencies
2525
Defining features of the electric industry:Defining features of the electric industry:Economic and industrial organizationEconomic and industrial organization
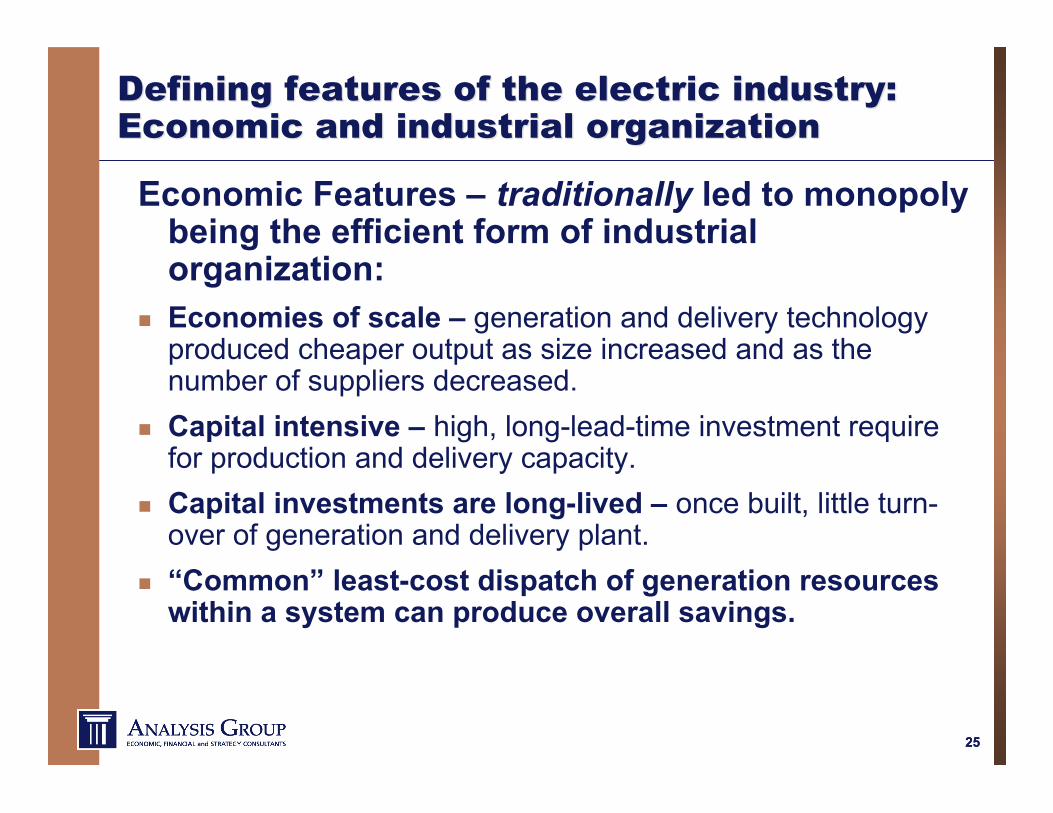
Economic Features – traditionally led to monopolybeing the efficient form of industrialorganization:
Economies of scale – generation and delivery technologyproduced cheaper output as size increased and as thenumber of suppliers decreased.
Capital intensive – high, long-lead-time investment requirefor production and delivery capacity.
Capital investments are long-lived – once built, little turn-over of generation and delivery plant.
“Common” least-cost dispatch of generation resourceswithin a system can produce overall savings.
2626
Defining features of the electric industry:Defining features of the electric industry:Economic and industrial organizationEconomic and industrial organization
Traditionally, economic structure led to a number offeatures of the industry:
Utility’s exclusive franchise (lawful monopolies) Utility obligation to serve (assuring customer access to
service) Common vertical integration of elements of supply
chain Rate regulation (to protect consumers from exercise of
market power, abusive prices, and to service problems) Interconnection of utility systems (reserve sharing,
economical supplies – often across state lines)
2727
Defining features of the electric industry:Defining features of the electric industry:Economic and industrial organizationEconomic and industrial organization
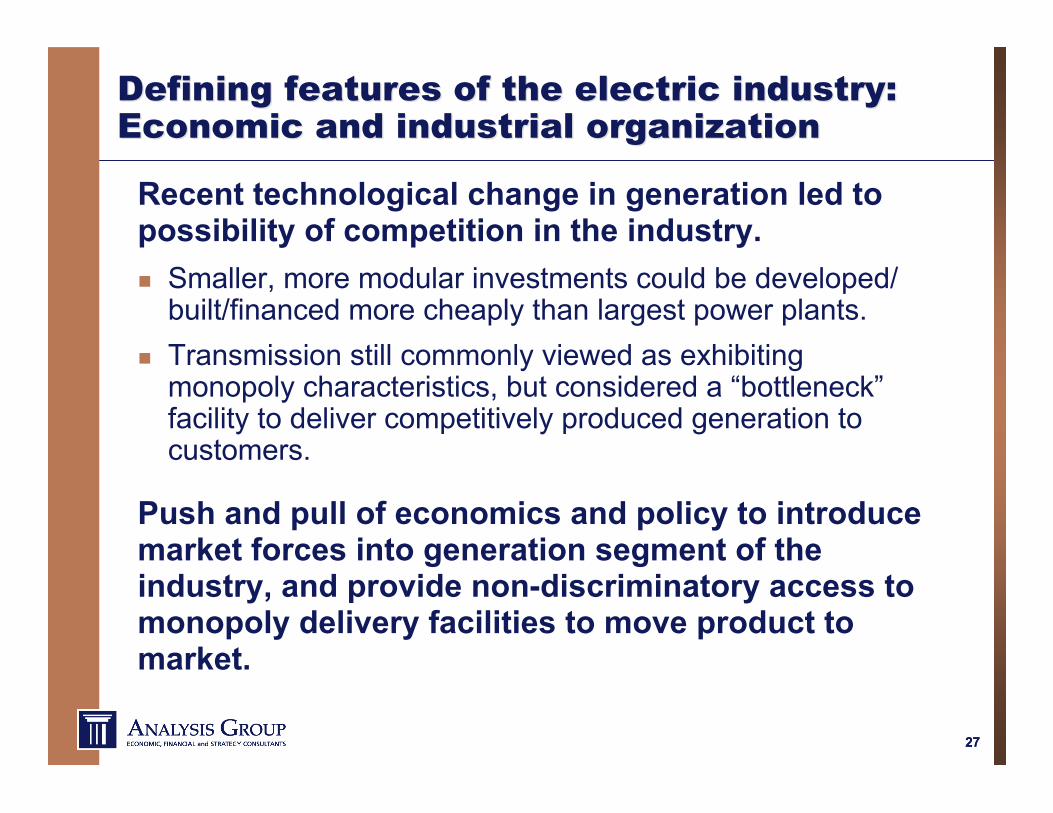
Recent technological change in generation led topossibility of competition in the industry. Smaller, more modular investments could be developed/
built/financed more cheaply than largest power plants. Transmission still commonly viewed as exhibiting
monopoly characteristics, but considered a “bottleneck”facility to deliver competitively produced generation tocustomers.
Push and pull of economics and policy to introducemarket forces into generation segment of theindustry, and provide non-discriminatory access tomonopoly delivery facilities to move product tomarket.
2828
Defining features of the electric industry:Defining features of the electric industry:Policy and Policy and ““public interestpublic interest”” elements elements
Traditionally, one-to-one relationship of electricitydemand to GNP (although recently dislodged)
Electricity often used as a tool of economicdevelopment in many regions for much of the lastcentury
Entitlement attitude of consumers re: ‘low costpower’
Few product substitutes (in the short run, at least) Large environmental footprint of power facilities:
air, water, land impacts – mainly from fossil fuelcombustion.
2929
Traditional and Evolving Service ModelTraditional and Evolving Service Modelss
Two archetypes exist side-by-side in different states & regions: Traditional model:
Utility: vertically integrated, exclusive franchise withobligation to serve
Bundled retail service with no retail choice allowed Traditional state regulation over bundled service Wholesale purchases and sales, under federal regulation
Market-based service model: Wholesale markets and Reg’l Transmission Organizations State-regulated utility: less vertical integration (post
divestitures & RTO formation); typically focused on delivery Retail choice – allowed for, but little in practice for small
customers; utility is supplier of last resort (via supplycontracts)
Direct federal regulation over unbundled Gen and Trans
3030
Many Many ISOs ISOs and RTOs (and RTOs (““organized marketsorganized markets””))
FERC STATE OF THE MARKET REPORT, January 2004.FERC STATE OF THE MARKET REPORT, January 2004.
(1-02 – 6-03)
3131
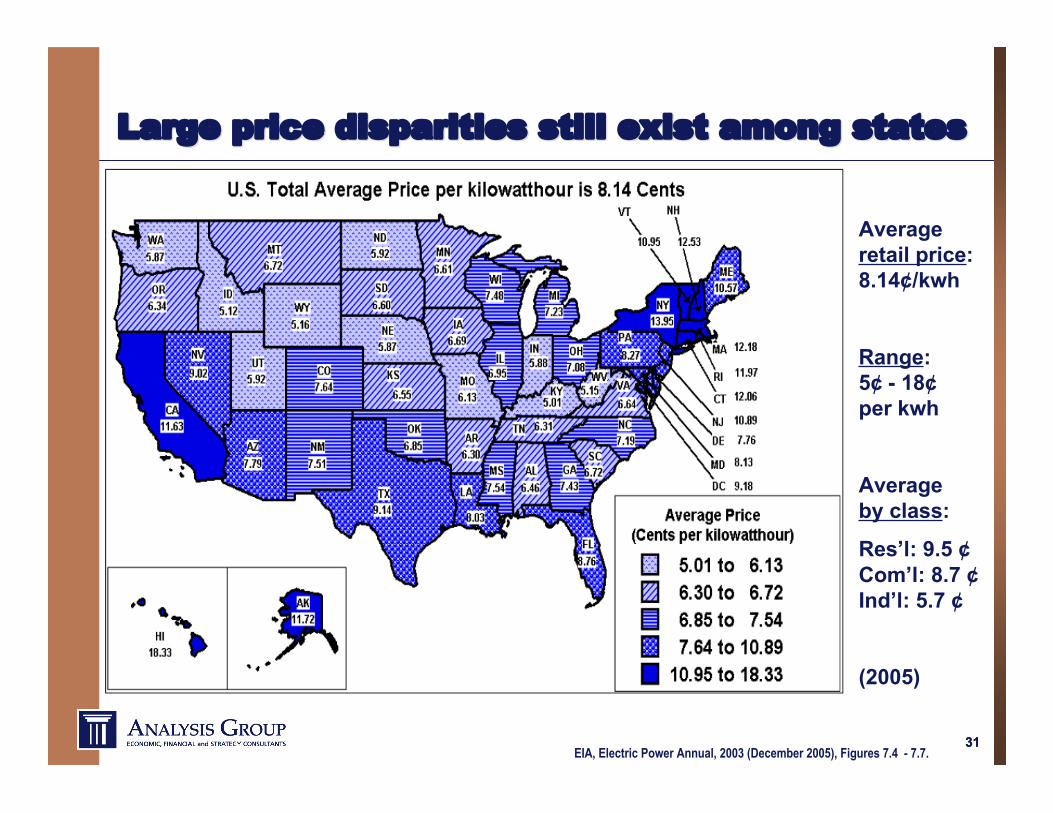
Large price disparities still exist among statesLarge price disparities still exist among states
EIA, Electric Power Annual, 2003 (December 2005), Figures 7.4 - 7.7.
Averageretail price:8.14¢/kwh
Range:5¢ - 18¢per kwh
Averageby class:
Res’l: 9.5 ¢Com’l: 8.7 ¢Ind’l: 5.7 ¢
(2005)
3232
Even Even subregional subregional price differences exist:price differences exist:NY Market NY Market –– example: example:
David Lawrence, NYISO, New York, New England and PJM Electricity Markets Overview, New York, New England and PJM Electricity Markets Overview, presentation to RegionalGreenhouse Gas Initiative Markets Workshop, 11-04, p. 26.
3333
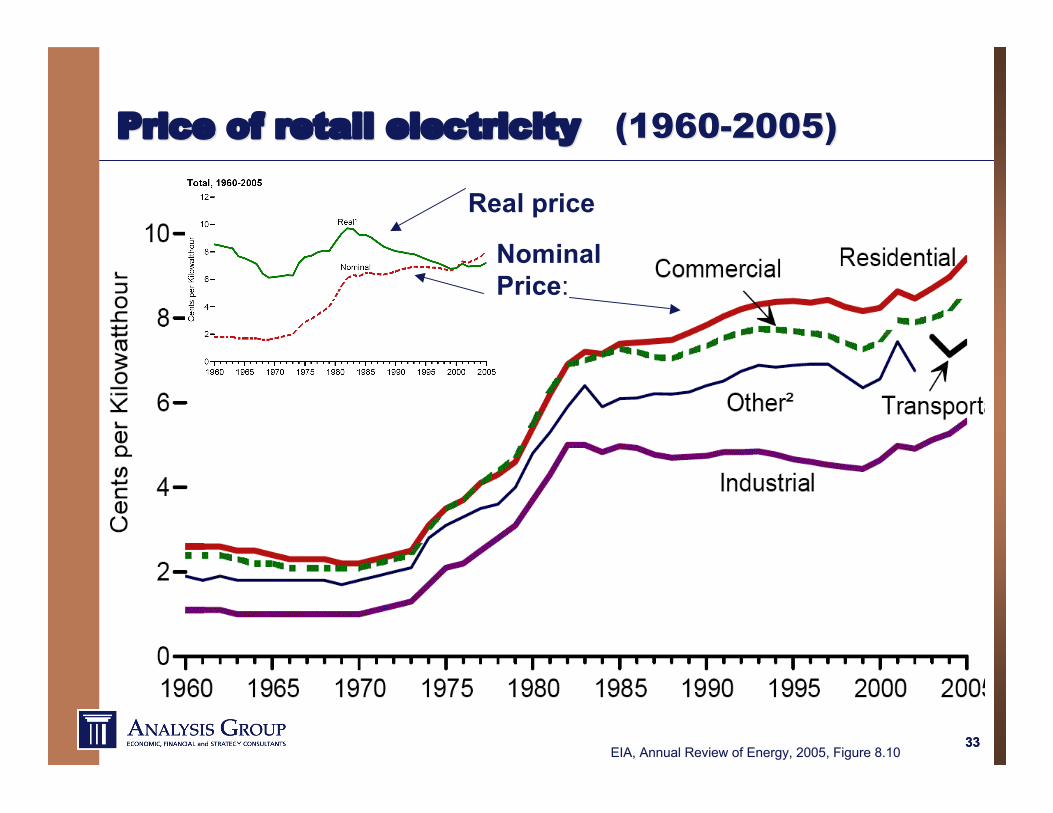
Price of retail electricityPrice of retail electricity (1960-2005) (1960-2005)
EIA, Annual Review of Energy, 2005, Figure 8.10EIA, Annual Review of Energy, 2005, Figure 8.10
Real price
NominalPrice:
3434
Wholesale Electric Prices v. OthersWholesale Electric Prices v. Others
Volatility of Pow er Prices
0
50
100
150
200
250
300
350
400
450
7/24/98 7/24/99 7/23/00 7/23/01 7/23/02 7/23/03
Date
Ind
ex
Va
lue
, U
S D
oll
ars
SPX Index /10
Gold Index
JPY Curncy
Cotton Index
PJM On-Peak
Day Ahead
GT10 Govt * 10
High Volatility of Power Prices
Laura Brooks (PSEG), “Risk Management and Price Volatility” – AGA’s Introduction to the Energy Industry, March 15, 2004 http://www.aga.org/Template.cfm?Section=Presentations&template=/ContentManagement/ContentDisplay.cfm&ContentID=13035
3535
The Natural Gas Industry The Natural Gas Industry ––The Supply ChainThe Supply Chain
3636
The Natural Gas Supply ChainThe Natural Gas Supply Chain
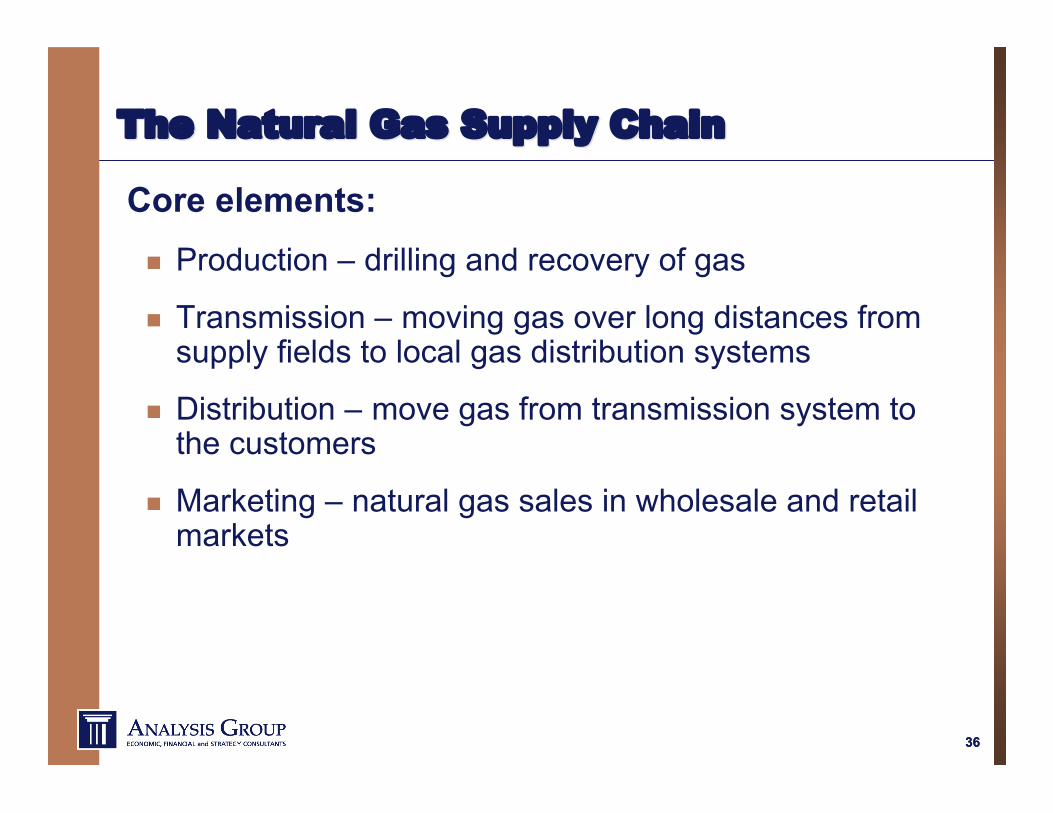
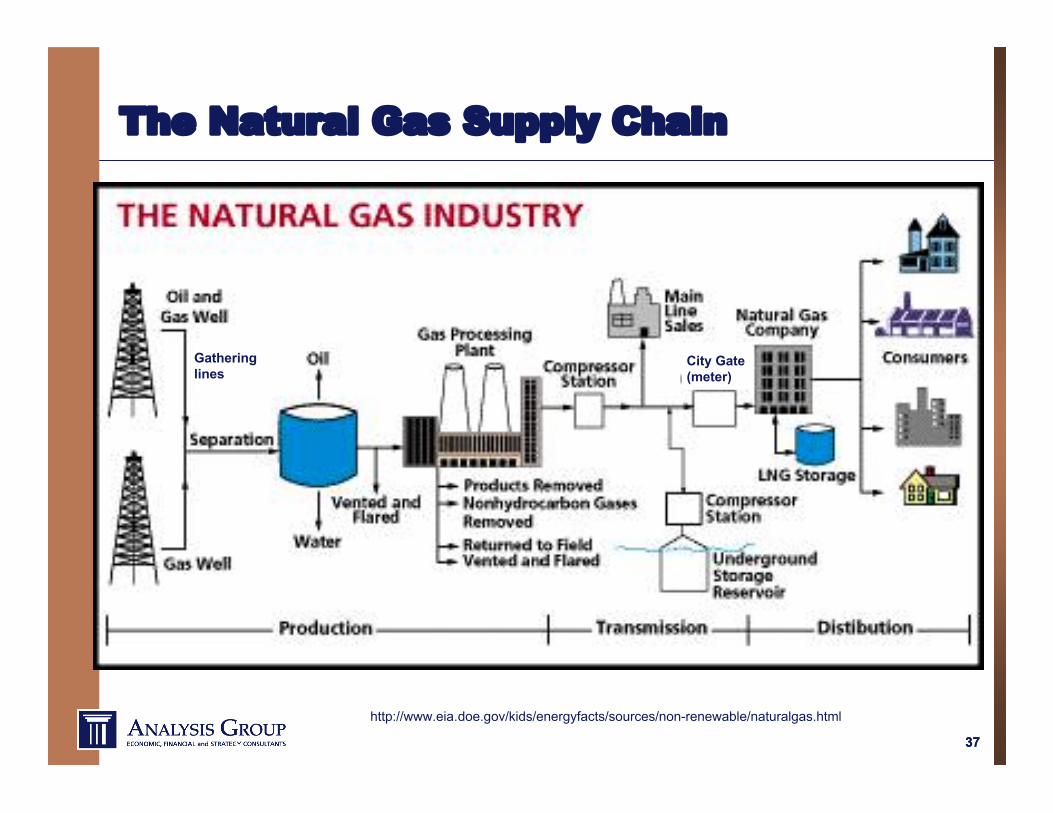
Core elements: Production – drilling and recovery of gas
Transmission – moving gas over long distances fromsupply fields to local gas distribution systems
Distribution – move gas from transmission system tothe customers
Marketing – natural gas sales in wholesale and retailmarkets
The Natural Gas Supply ChainThe Natural Gas Supply Chain
Mechanics of natural gas supply: Supply is sent out to meet demand Customers’ demand varies seasonally and across the
day Pressure is regulated on the system to move gas to
loads Gas is measured various ways:– “cubic feet” (e.g., “mcf”, “bcf”) – volume of gas– “Btu’s” (e.g., “mmBtu”) – heat content of fuel– “therm” (e.g., “decatherm”) – gas usage based on heating
value– 1 Decatherm ~ 1 million Btu’s ~ 1 Mcf
3939
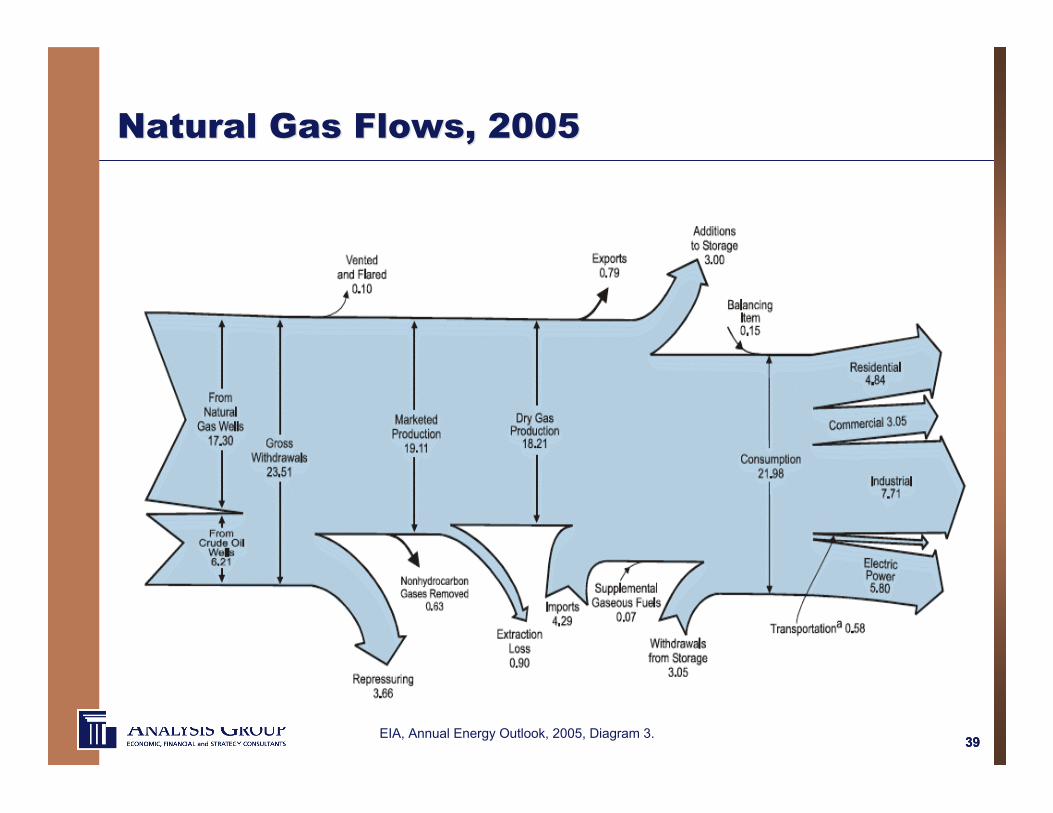
Natural Gas Flows, 2005Natural Gas Flows, 2005
EIA, Annual Energy Outlook, 2005, Diagram 3.
4040
Natural gas flowsNatural gas flows
EIA, Natural Gas Annual, 2005
GulfCoast
Alberta
Rockies –San Juan
CanadianMaritimes
4141
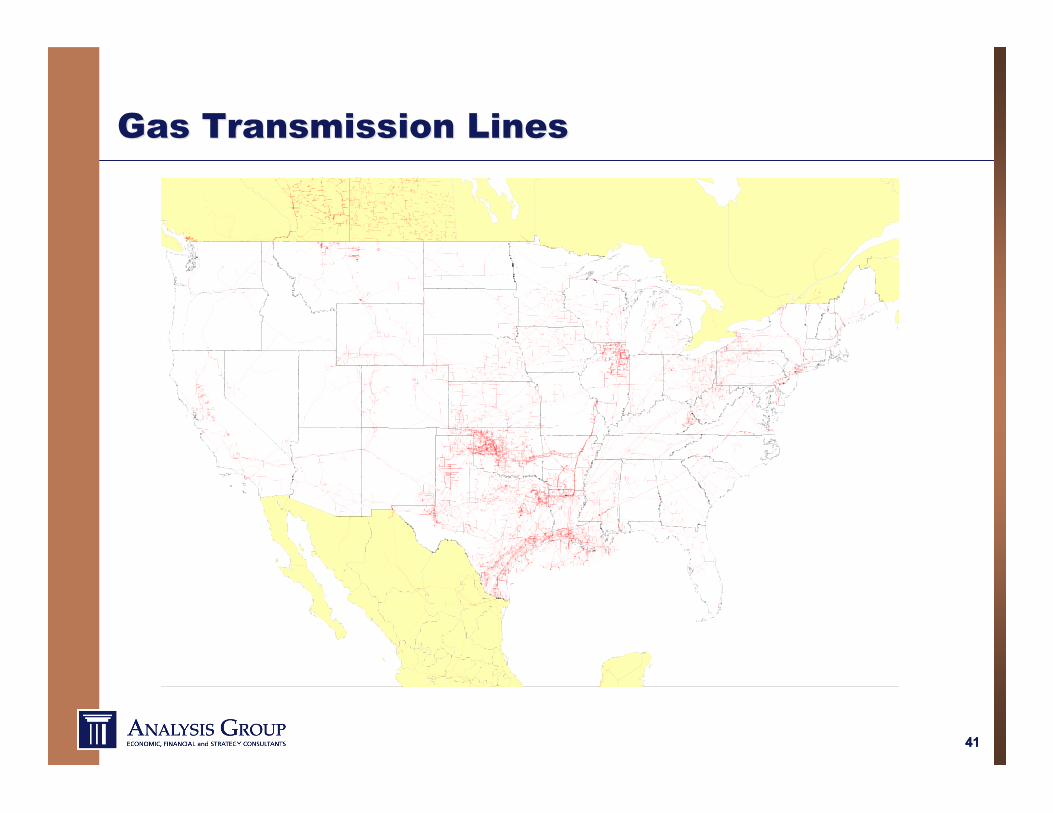
Gas Transmission LinesGas Transmission Lines
4242
The Supply Chain: Transportation/DeliveryThe Supply Chain: Transportation/Delivery
Elements of the delivery system:
Complex network of pipelines, designed to transportnatural gas from production areas to customers
Three major types of pipelines: gathering system – low-pressure pipelines transporting raw
natural gas from wellhead to processing plant. interstate pipeline – carry natural gas long distances, to
large customers and to local distribution systems– Mainline pipes, the principle pipeline in a given system– Lateral pipelines, which deliver natural gas to or from the mainline– Compression facilities (e.g., engine, motor, turbine), to boost
pressure along the system distribution systems – to move gas to smaller consumers.
4343
The Supply Chain: StorageThe Supply Chain: Storage
Gas injected into storage facilities, typically locatednear demand centers distant from supply fields: Underground (salt caverns, aquifers) Above ground (LNG facilities)
Provides flexibility and reliability: Helps balance delivered supplies with loads Helps meet seasonal peaks in demand with locally
stored gas. Serves as insurance against disruptions affecting the
production or delivery of natural gas. Helps with economic objectives, e.g.: storing gas when
prices are low, and withdrawing and selling it whenprices are high.
4444
Underground Natural Gas Storage FacilitiesIn the Lower 48 States
The Supply Chain: Local DistributionThe Supply Chain: Local Distribution
Local Gas Distribution (LDC) systems: transport gas within a specific local area Connect to interstate pipelines at a “city gate” – often
a pricing hub Deliver gas to local consumers using smaller pipes
under lower gas pressures than interstate system. Often take ownership of gas at the city gate
4747
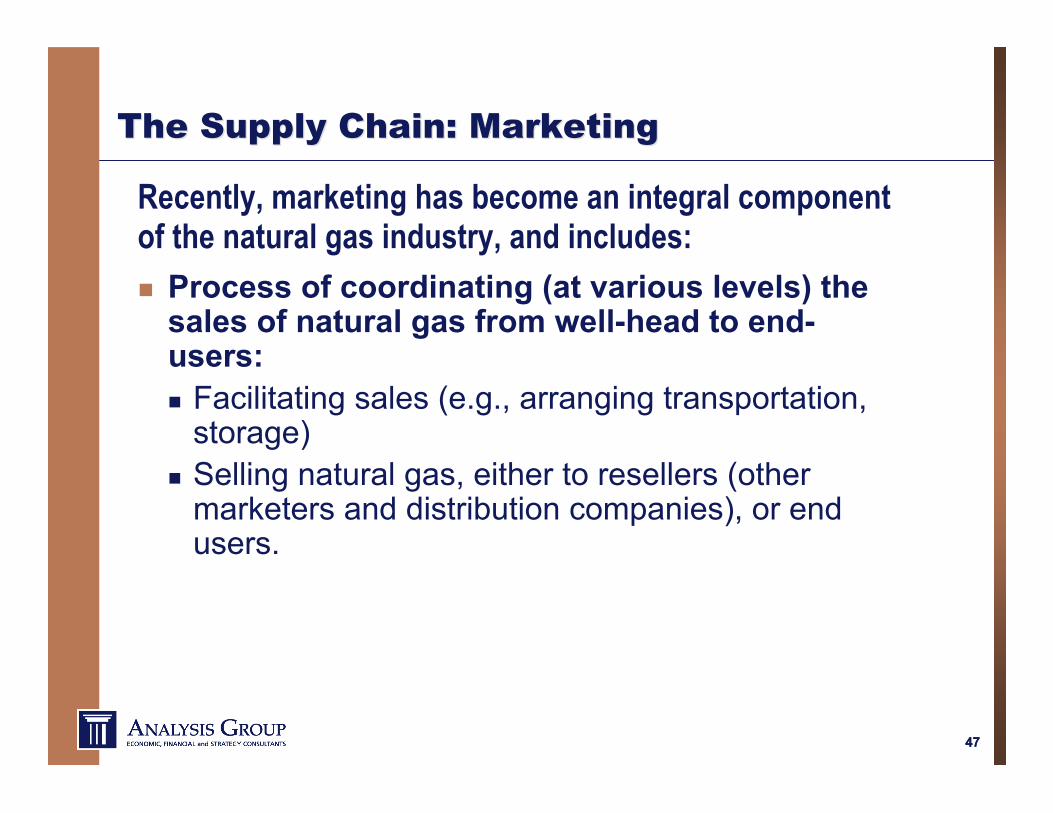
The Supply Chain: MarketingThe Supply Chain: Marketing
Recently, marketing has become an integral componentof the natural gas industry, and includes:
Process of coordinating (at various levels) thesales of natural gas from well-head to end-users: Facilitating sales (e.g., arranging transportation,
storage) Selling natural gas, either to resellers (other
marketers and distribution companies), or endusers.
4848
Defining Features of theDefining Features of theNatural Gas IndustryNatural Gas Industry
4949
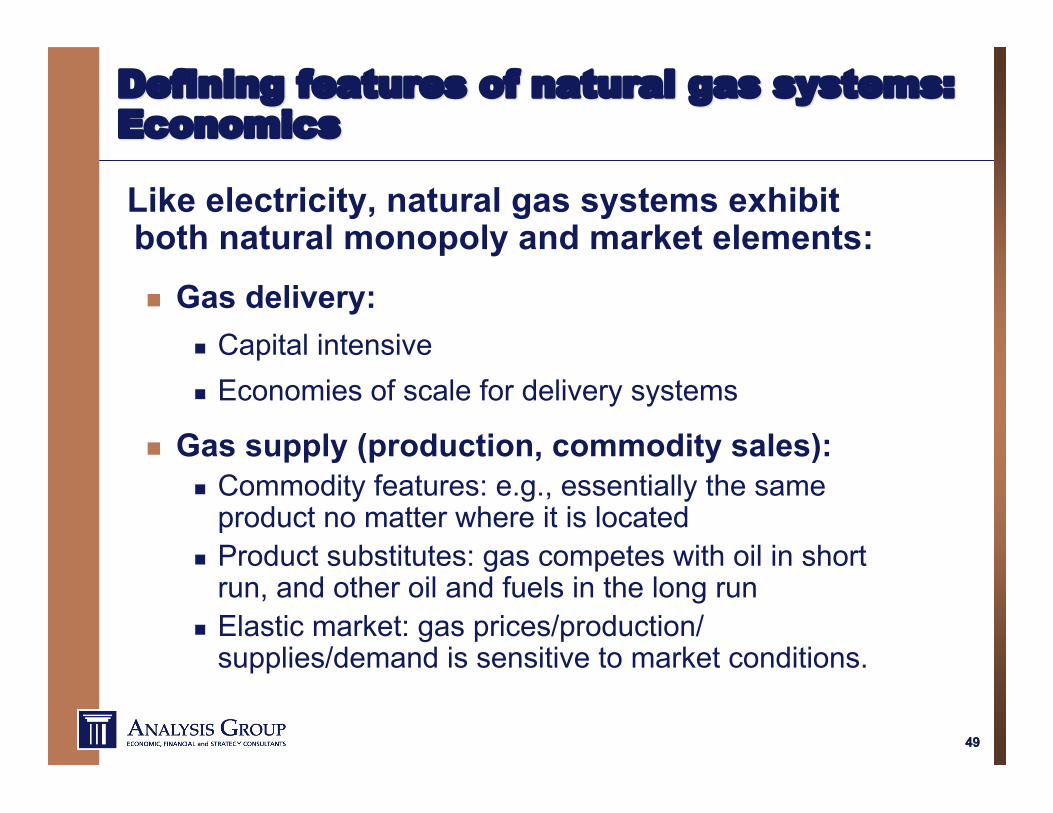
Defining features of natural gas systems:Defining features of natural gas systems:EconomicsEconomics
Like electricity, natural gas systems exhibitboth natural monopoly and market elements: Gas delivery:
Capital intensive Economies of scale for delivery systems
Gas supply (production, commodity sales): Commodity features: e.g., essentially the same
product no matter where it is located Product substitutes: gas competes with oil in short
run, and other oil and fuels in the long run Elastic market: gas prices/production/
supplies/demand is sensitive to market conditions.
5050
Defining features of the gas industry:Defining features of the gas industry:Traditional and newer business modelsTraditional and newer business models
Traditionally – separate segments of the industry: Producers explored for and produced natural gas and sold it
to pipeline companies. Pipeline companies transported the gas across the country
and sold it to local natural gas utilities. Local distribution companies then marketed and sold gas to
their customers (commodity gas bundled with delivery)
More recently, competitive changes have allowed forseparation of supply from delivery
Large consumers may buy market-based supplies andtransport them directly on the pipeline systems.
Small customers still typically buy bundled service from LDC.
5151
Defining features of the gas industry:Defining features of the gas industry:LDC obligationsLDC obligations
Traditionally, local gas distribution companieshave franchise to sell in a geographic area.
New gas connections can be made when supplyand delivery capacity are available; disconnectionsbarred during certain conditions.
Once a traditional gas customer is connected, theLDC is required to serve its needs.
LDCs may also serve customers under“interruptible” contracts.
5252
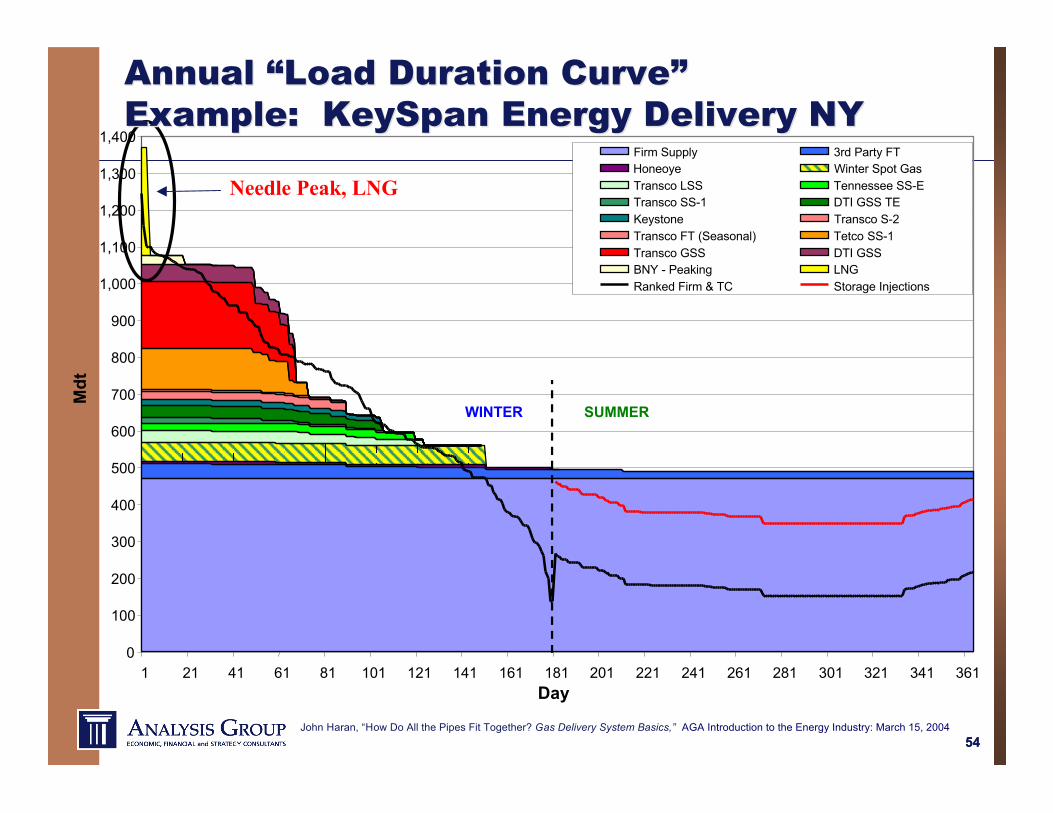
Defining features of the gas industry:Defining features of the gas industry:Supplying DemandSupplying Demand
Gas supplies must match the “seasonality” of gas demand Much gas is used for heating (or cooling) loads Peak season use is often double non-peak-season use It would be uneconomical to build delivery capacity to
match the peak season use Systems are planned to combine pipeline supplies with
stored gas Supplies are arranged to be:
Year-round Seasonal
Customers are served by: Firm supplies Interruptible supplies (typically off-peak)
5353
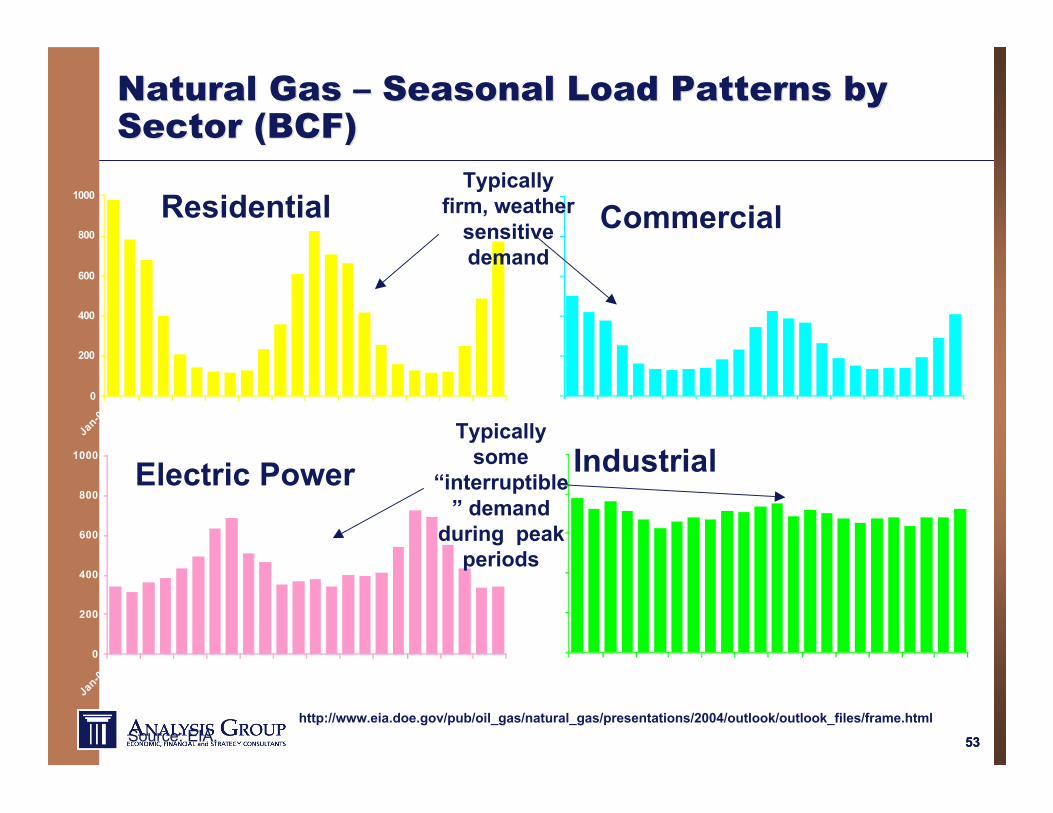
Natural Gas Natural Gas –– Seasonal Load Patterns by Seasonal Load Patterns bySector (BCF)Sector (BCF)
John Haran, “How Do All the Pipes Fit Together? Gas Delivery System Basics,” AGA Introduction to the Energy Industry: March 15, 2004
Annual Annual ““Load Duration CurveLoad Duration Curve””Example: Example: KeySpanKeySpan Energy Delivery NY Energy Delivery NY
5555
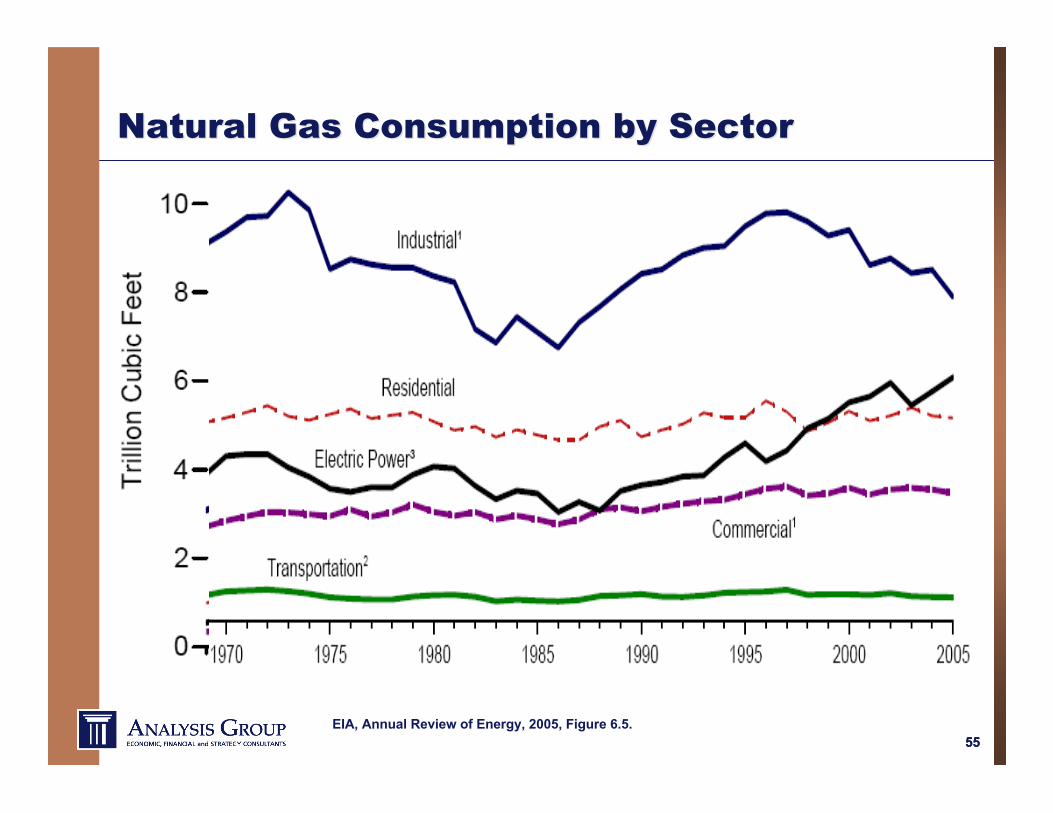
Natural Gas Consumption by SectorNatural Gas Consumption by Sector
EIA, Annual Review of Energy, 2005, Figure 6.5.
5656
Defining Features of the Gas Industry:Defining Features of the Gas Industry:Recent changes in the past decadeRecent changes in the past decade
Physical changes: Technological advances (production, construction) Significant new investment in delivery systems Penetration of gas into new geographic markets
Structural changes: Separation of merchant from delivery functions Introduction of market forces in production, marketing Open access to regulated transportation systems Development of market centers, futures markets Emergence of secondary market for transportation service
5757
Defining features of the gas industry:Defining features of the gas industry:Sales and Marketing of GasSales and Marketing of Gas
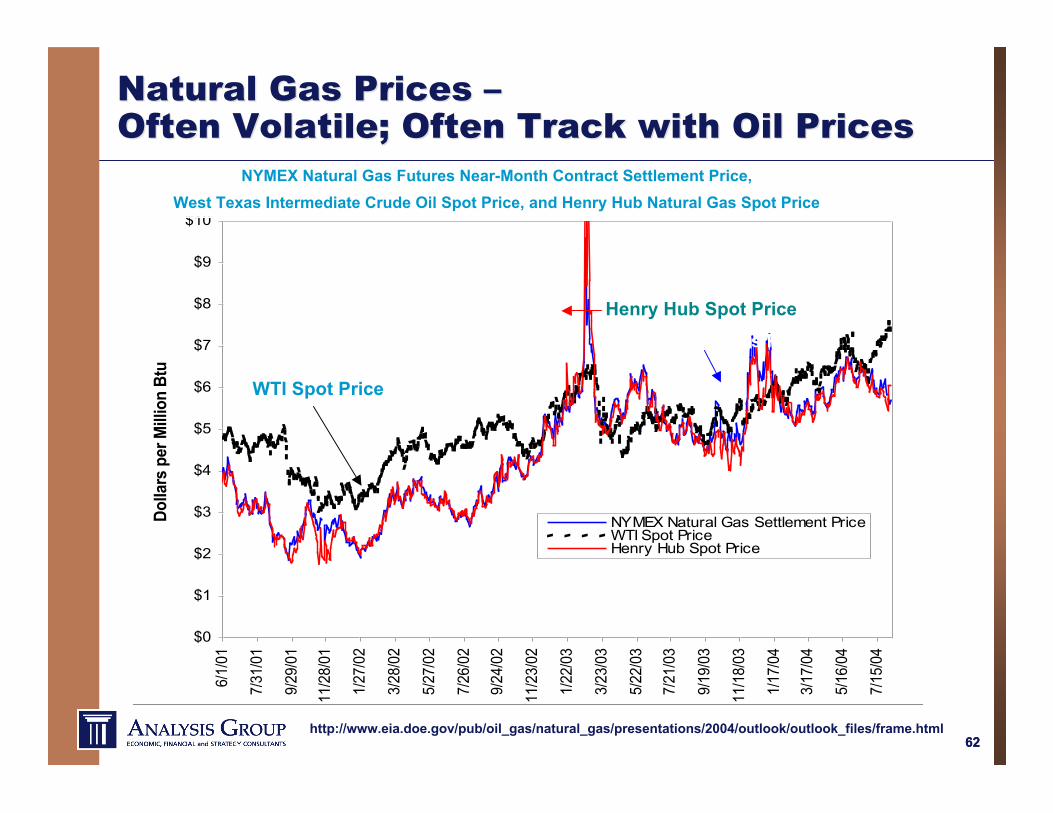
The price of natural gas is set by market forces,typically in two markets, each traded at pricestied to deliveries at different “market hubs”: A spot market (natural gas is bought and sold that day), A futures market (contracting for natural gas at least one
month, and up to 36 months, in advance).
Different forms of sales contracts: Physical contracts (interruptible, versus firm sales – of
commodity and/or transportation service) Financial contracts (financial instruments often used for
hedging risks and speculating about price movements orrelated events in the future)
5858
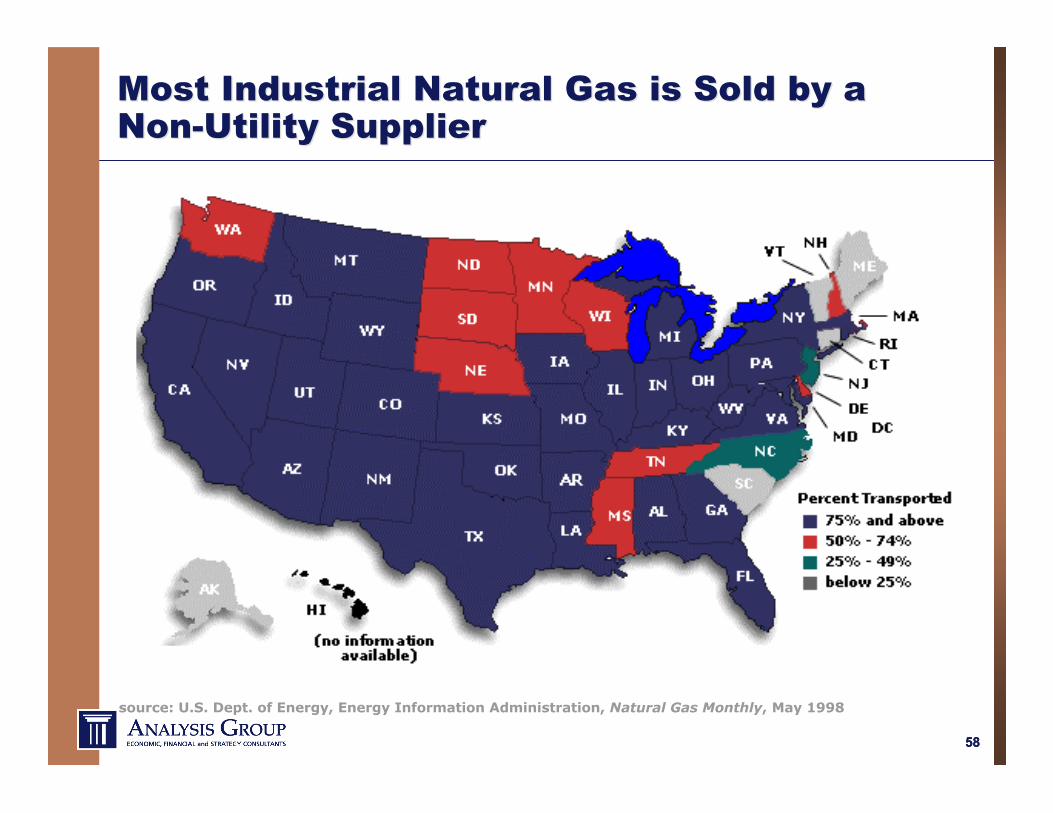
Most Industrial Natural Gas is Sold by aMost Industrial Natural Gas is Sold by aNon-Utility SupplierNon-Utility Supplier
source: U.S. Dept. of Energy, Energy Information Administration, Natural Gas Monthly, May 1998
5959
Natural Gas Natural Gas –– Retail Restructuring ( Retail Restructuring (ResRes’’ll))
Conclusion: Electric and Gas IndustriesConclusion: Electric and Gas Industries
Traditionally regulated industries with recentinfusion of market forces in supply segment ofindustry
Strong monopoly characteristics persist in deliveryelement of each industry
More depth to follow on other topics in theworkshop:
Utility regulation: economic and legal foundations The regulatory framework – past, present and future Legislative and administrative processes Infrastructure development, technologies Special topics: reliability; trading
6464
Susan F. Tierney, Ph.D.Susan F. Tierney, Ph.D.Managing PrincipalManaging Principal