65
Electricity Distribution Annual Tariff Proposal 2020 1 January 2020
Electricity Distribution
Annual Tariff Proposal 2020
1 January 2020
Annual Tariff Proposal 2020
ISSUE 19 PAGE 2 OF 65 UNCONTROLLED WHEN PRINTED
Issue/Amendment Status
Issue Number Date Description Author Approved By
19 01/10/2019 Updated for 2020 tariffs Edwin Chan Charlotte Eddy
18 01/10/2018 Updated for 2019 tariffs Edwin Chan Charlotte Eddy
17 28/09/2017 Updated for 2018 tariffs Kate Jdanova Charlotte Eddy
16 06/10/2016 Updated for 2017 tariffs Eric Howie Anh Mai
15 19/11/2015 Updated for 2016 tariffs Eric Howie Anh Mai
14 31/10/2014 Updated for 2015 tariffs Eric Howie Tom Hallam
13 31/10/2013 Updated for 2014 tariffs Eric Howie Tom Hallam
12 31/10/2012 Updated for 2013 tariffs Eric Howie Tom Hallam
Disclaimer
This template is for generating internal and external document belonging to AusNet Services and may or may not contain all available information on the subject matter this document purports to address. The information contained in this document is subject to review AusNet Services may amend this document at any time. Amendments will be indicated in the Amendment Table, but AusNet Services does not undertake to keep this document up to date.
To the maximum extent permitted by law, AusNet Services makes no representation or warranty (express or implied) as to the accuracy, reliability, or completeness of the information contained in this document, or its suitability for any intended purpose. AusNet Services (which, for the purposes of this disclaimer, includes all of its related bodies corporate, its officers, employees, contractors, agents and consultants, and those of its related bodies corporate) shall have no liability for any loss or damage (be it direct or indirect, including liability by reason of negligence or negligent misstatement) for any statements, opinions, information or matter (expressed or implied) arising out of, contained in, or derived from, or for any omissions from, the information in this document.
Contact
This document is the responsibility of Regulation and Network Strategy, AusNet Services. Please contact the indicated owner of the document below with any inquiries.
Edwin Chan AusNet Services Level 31, 2 Southbank Boulevard Melbourne Victoria 3006 Ph: (03) 9695 6000
Annual Tariff Proposal 2020
ISSUE 19 PAGE 3 OF 65 UNCONTROLLED WHEN PRINTED
Table of Contents
1 Introduction 5
1.1 About AusNet Services 5
1.2 Network charges and other charges 6
1.3 Structure of this document 6
1.4 Compliance checklist 6
2 Regulatory environment 9
2.1 The Tariff Structure Statement 9
2.2 Electricity distribution price review requirements 10
2.2.1 Revenue cap formulae 10
2.2.2 Total annual revenue 11
2.2.3 Side constraint formula 13
2.2.4 Compliance with side constraint formula 14
2.3 Long run marginal cost 16
2.4 Stand alone and avoidable costs 16
2.5 Designated pricing proposal charges 16
2.6 Jurisdictional pricing proposal charges 18
3 Network tariff classes 19
4 Proposed network tariffs 21
4.1 Background to tariff access 21
4.1.1 Legacy tariffs 21
4.1.2 Flexible tariffs 22
4.1.3 Cost reflective tariffs 22
4.1.4 Tariff mergers 23
4.2 Tariff reassignments for 40 MWh - 160 MWh customers 23
4.3 Opting in to cost reflective tariffs 24
4.4 Solar tariff assignment 24
4.5 Backdating tariffs 24
4.6 Closed to new entrants tariffs 25
4.7 Critical peak demand tariffs 25
4.8 Power factor correction 27
4.9 Indicative tariffs 28
5 Variations to tariffs 32
5.1 Small residential 32
5.2 Small Industrial & Commercial 33
5.3 Medium Industrial & Commercial 35
5.4 Large LV Industrial & Commercial 36
5.5 Large HV Industrial & Commercial 37
5.6 Large ST Industrial & Commercial 38
6 Ancillary network services 39
Annual Tariff Proposal 2020
ISSUE 19 PAGE 4 OF 65 UNCONTROLLED WHEN PRINTED
6.1 Ancillary network services price changes 39
7 Prescribed metering charges 40
7.1 Electricity distribution price review annual metering charges requirements 40
7.2 Metering revenue 41
7.3 Metering unders and overs 42
8 Public lighting 43
8.1 Public lighting tariffs 43
9 Glossary 45
10 Attachments 48
10.1 Network tariff schedule 49
10.2 Distribution tariff schedule 51
10.3 Transmission tariff schedule 53
10.4 Jurisdictional scheme tariff schedule 55
10.5 Tariff structure and charging parameter 57
10.6 Minimum metering requirements 59
10.7 Prescribed metering schedule 60
10.8 Ancillary services schedule 62
10.9 Public lighting schedule 64
Annual Tariff Proposal 2020
ISSUE 19 PAGE 5 OF 65 UNCONTROLLED WHEN PRINTED
1 Introduction
This document, its appendices and attachments comprise of AusNet Services’ 2020 Pricing Proposal. It covers our direct control (standard control and alternative control) services for 2020 in accordance with clause 6.18.2 of the National Electricity Rules and the Australian Energy Regulator (AER) Final Distribution Determination for the 2016 to 2020 regulatory control period.
Clause 6.18 of the Rules sets out the requirements for distribution pricing. These requirements include the pricing principles which guide this Pricing Proposal, and the matters the Pricing Proposal must address includes:
classification of services;
the pricing control mechanism;
assigning and reassigning customers to tariff classes;
recovery of transmission costs; and
recovery of jurisdictional scheme amounts.
1.1 About AusNet Services
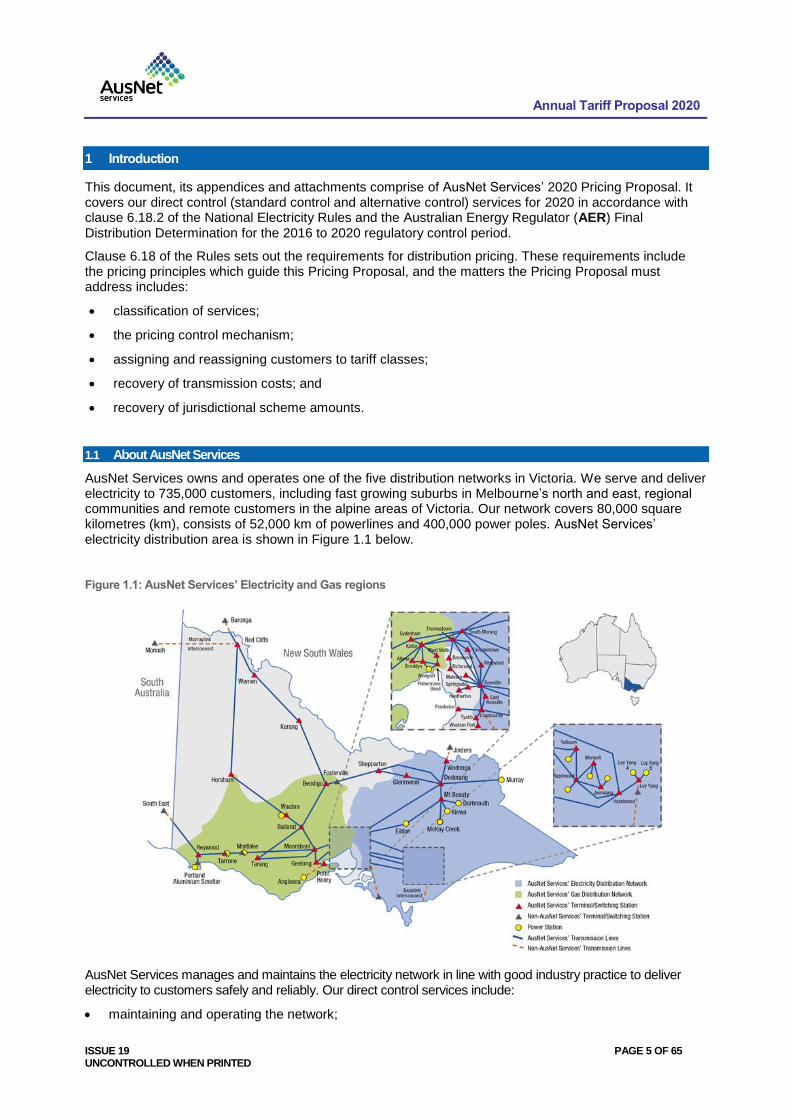
AusNet Services owns and operates one of the five distribution networks in Victoria. We serve and deliver electricity to 735,000 customers, including fast growing suburbs in Melbourne’s north and east, regional communities and remote customers in the alpine areas of Victoria. Our network covers 80,000 square kilometres (km), consists of 52,000 km of powerlines and 400,000 power poles. AusNet Services’ electricity distribution area is shown in Figure 1.1 below.
Figure 1.1: AusNet Services’ Electricity and Gas regions
AusNet Services manages and maintains the electricity network in line with good industry practice to deliver electricity to customers safely and reliably. Our direct control services include:
maintaining and operating the network;

Annual Tariff Proposal 2020
ISSUE 19 PAGE 6 OF 65 UNCONTROLLED WHEN PRINTED
investing in network extensions and upgrades for future customer needs;
connecting new customers to our network;
providing and maintaining public lighting in our network area; and
providing meter data to retailers.
The revenue obtained from tariffs and charges in this Pricing Proposal funds the above services.
1.2 Network charges and other charges
Network tariffs (for standard control services) cover the cost of transporting electricity from the generator through the transmission and distribution networks to our customers’ homes or businesses. Network tariffs also recovers the costs from jurisdictional schemes, which currently comprise of the Victorian Premium Feed-in Tariff (PFiT) scheme.
Charges for a variety of other services (referred to in the rules as Alternative Control Services) are also addressed in this Pricing Proposal. This includes:
Metering fees which cover the costs of the meter and meter data services;
Public lighting charges which relate to the provision and maintenance of public lighting services; and
Other distribution services that are provided in response to the request or specific needs of our customers. Examples of these services include field officer visits, truck visits and connection services for new customers.
1.3 Structure of this document
The structure of this document is outlined in the table below and has been structured to address the requirements of Clause 6.18.2 of the Rules.
Chapter 1 – Introduction
Chapter 2 – Regulatory environment
Chapter 3 – Network tariff classes
Chapter 4 – Proposed network tariffs
Chapter 5 – Variation to tariffs
Chapter 6 – Ancillary network services
Chapter 7 – Prescribed metering charges
Chapter 8 – Public lighting
Chapter 9 – Glossary
Chapter 10 - Attachments
1.4 Compliance checklist
Table 1.1 sets out the relevant Rule requirements and where AusNet Services has demonstrated compliance within this document.
Table 1.1 – Rule compliance
Rule Requirement Relevant section
6.18.2 Pricing proposal
Annual Tariff Proposal 2020
ISSUE 19 PAGE 7 OF 65 UNCONTROLLED WHEN PRINTED
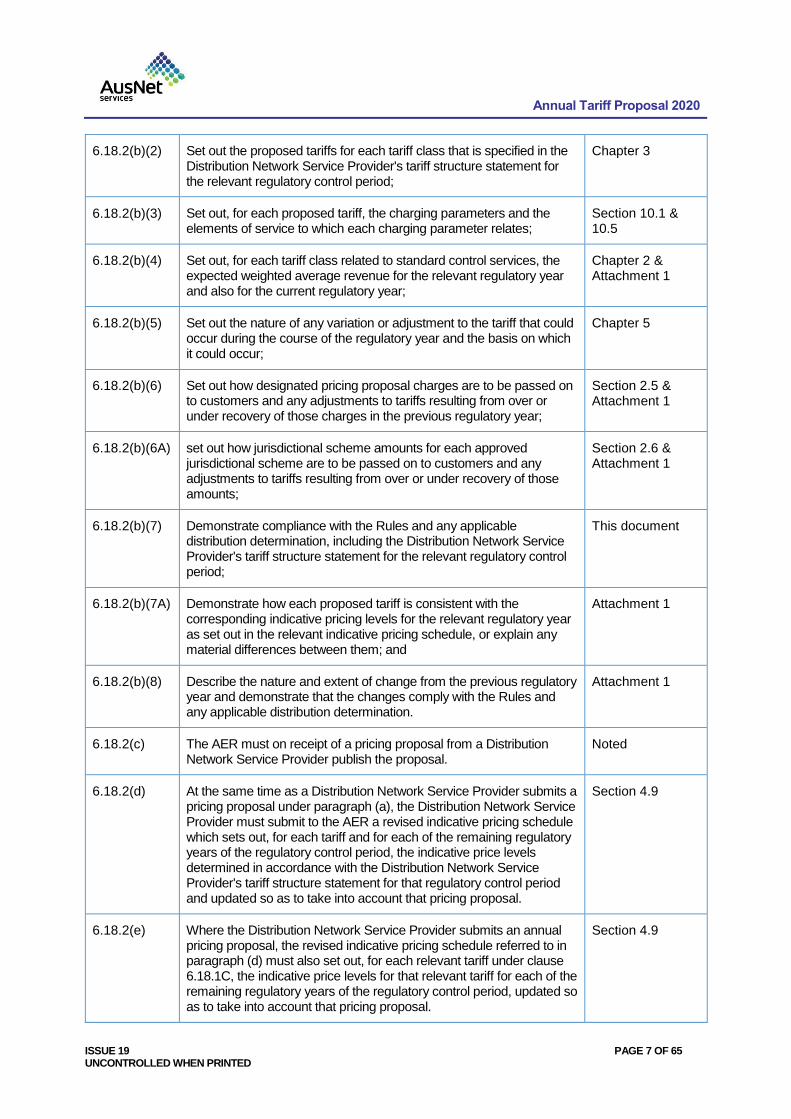
6.18.2(b)(2) Set out the proposed tariffs for each tariff class that is specified in the Distribution Network Service Provider's tariff structure statement for the relevant regulatory control period;
Chapter 3
6.18.2(b)(3) Set out, for each proposed tariff, the charging parameters and the elements of service to which each charging parameter relates;
Section 10.1 & 10.5
6.18.2(b)(4) Set out, for each tariff class related to standard control services, the expected weighted average revenue for the relevant regulatory year and also for the current regulatory year;
Chapter 2 & Attachment 1
6.18.2(b)(5) Set out the nature of any variation or adjustment to the tariff that could occur during the course of the regulatory year and the basis on which it could occur;
Chapter 5
6.18.2(b)(6) Set out how designated pricing proposal charges are to be passed on to customers and any adjustments to tariffs resulting from over or under recovery of those charges in the previous regulatory year;
Section 2.5 & Attachment 1
6.18.2(b)(6A) set out how jurisdictional scheme amounts for each approved jurisdictional scheme are to be passed on to customers and any adjustments to tariffs resulting from over or under recovery of those amounts;
Section 2.6 & Attachment 1
6.18.2(b)(7) Demonstrate compliance with the Rules and any applicable distribution determination, including the Distribution Network Service Provider's tariff structure statement for the relevant regulatory control period;
This document
6.18.2(b)(7A) Demonstrate how each proposed tariff is consistent with the corresponding indicative pricing levels for the relevant regulatory year as set out in the relevant indicative pricing schedule, or explain any material differences between them; and
Attachment 1
6.18.2(b)(8) Describe the nature and extent of change from the previous regulatory year and demonstrate that the changes comply with the Rules and any applicable distribution determination.
Attachment 1
6.18.2(c) The AER must on receipt of a pricing proposal from a Distribution Network Service Provider publish the proposal.
Noted
6.18.2(d) At the same time as a Distribution Network Service Provider submits a pricing proposal under paragraph (a), the Distribution Network Service Provider must submit to the AER a revised indicative pricing schedule which sets out, for each tariff and for each of the remaining regulatory years of the regulatory control period, the indicative price levels determined in accordance with the Distribution Network Service Provider's tariff structure statement for that regulatory control period and updated so as to take into account that pricing proposal.
Section 4.9
6.18.2(e) Where the Distribution Network Service Provider submits an annual pricing proposal, the revised indicative pricing schedule referred to in paragraph (d) must also set out, for each relevant tariff under clause 6.18.1C, the indicative price levels for that relevant tariff for each of the remaining regulatory years of the regulatory control period, updated so as to take into account that pricing proposal.
Section 4.9
Annual Tariff Proposal 2020
ISSUE 19 PAGE 8 OF 65 UNCONTROLLED WHEN PRINTED
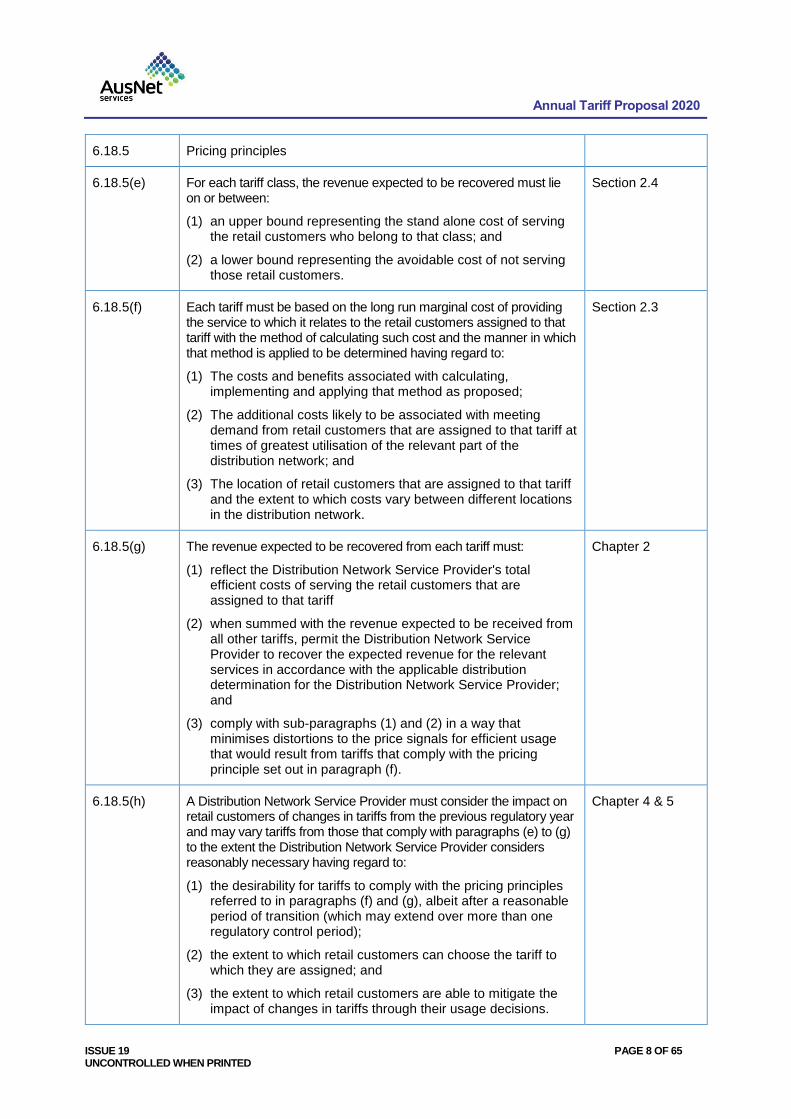
6.18.5 Pricing principles
6.18.5(e) For each tariff class, the revenue expected to be recovered must lie on or between:
(1) an upper bound representing the stand alone cost of serving the retail customers who belong to that class; and
(2) a lower bound representing the avoidable cost of not serving those retail customers.
Section 2.4
6.18.5(f) Each tariff must be based on the long run marginal cost of providing the service to which it relates to the retail customers assigned to that tariff with the method of calculating such cost and the manner in which that method is applied to be determined having regard to:
(1) The costs and benefits associated with calculating, implementing and applying that method as proposed;
(2) The additional costs likely to be associated with meeting demand from retail customers that are assigned to that tariff at times of greatest utilisation of the relevant part of the distribution network; and
(3) The location of retail customers that are assigned to that tariff and the extent to which costs vary between different locations in the distribution network.
Section 2.3
6.18.5(g) The revenue expected to be recovered from each tariff must:
(1) reflect the Distribution Network Service Provider's total efficient costs of serving the retail customers that are assigned to that tariff
(2) when summed with the revenue expected to be received from all other tariffs, permit the Distribution Network Service Provider to recover the expected revenue for the relevant services in accordance with the applicable distribution determination for the Distribution Network Service Provider; and
(3) comply with sub-paragraphs (1) and (2) in a way that minimises distortions to the price signals for efficient usage that would result from tariffs that comply with the pricing principle set out in paragraph (f).
Chapter 2
6.18.5(h) A Distribution Network Service Provider must consider the impact on retail customers of changes in tariffs from the previous regulatory year and may vary tariffs from those that comply with paragraphs (e) to (g) to the extent the Distribution Network Service Provider considers reasonably necessary having regard to:
(1) the desirability for tariffs to comply with the pricing principles referred to in paragraphs (f) and (g), albeit after a reasonable period of transition (which may extend over more than one regulatory control period);
(2) the extent to which retail customers can choose the tariff to which they are assigned; and
(3) the extent to which retail customers are able to mitigate the impact of changes in tariffs through their usage decisions.
Chapter 4 & 5
Annual Tariff Proposal 2020
ISSUE 19 PAGE 9 OF 65 UNCONTROLLED WHEN PRINTED
2 Regulatory environment
The AER regulates AusNet Services’ electricity distribution revenues and tariffs in accordance with the National Electricity Rules. The primary instruments of its regulation are:
the relevant Electricity Distribution Revenue Determination for AusNet Services;
the relevant Tariff Structure Statement; and
the annual Pricing Proposal decision.
In developing this Pricing Proposal, AusNet Services has therefore had regard for and ensured consistency with:
the AER’s Final Distribution Revenue Determination for the period 2016 to 2020 made on 26 May 2016;
our Tariff Structure Statement (TSS) for the period 2017-2020 which was approved by the AER on 24 August 2016; and
an addendum to the TSS approved by the AER on 20 September 2017.
2.1 The Tariff Structure Statement
If any conflict exists between this document and the approved TSS (and its September 2017 addendum), the TSS will prevail unless the contrary is explicitly stated.
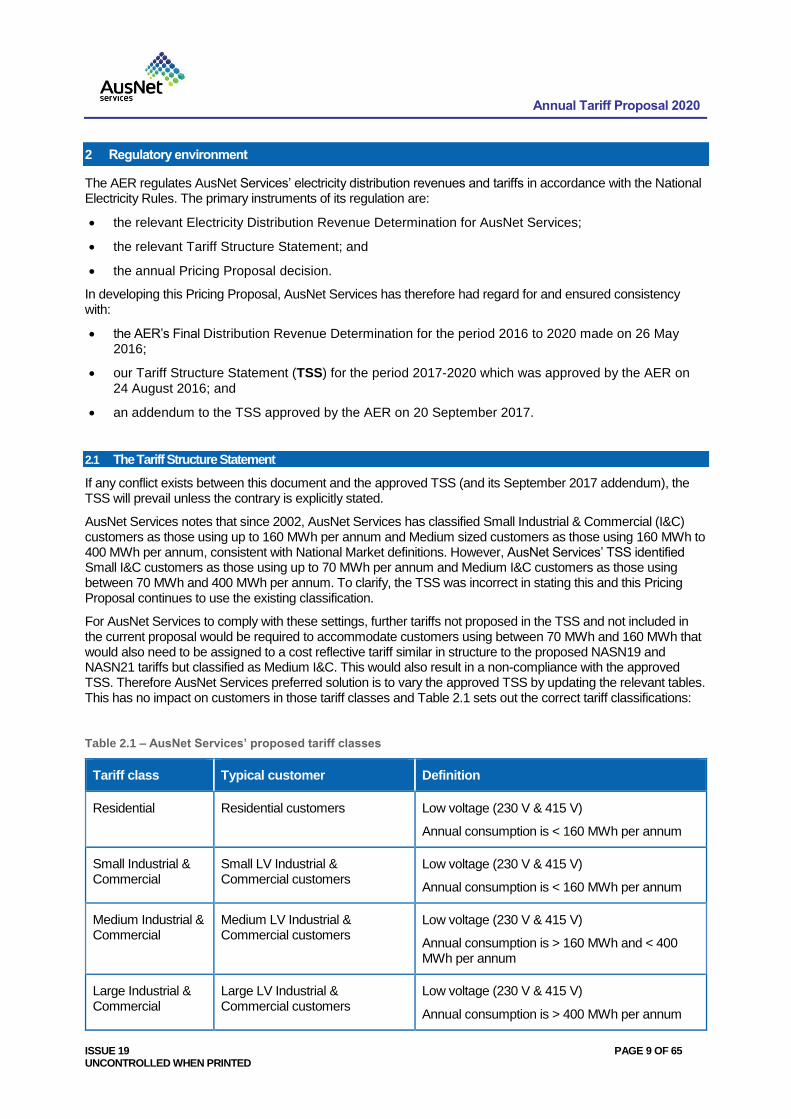
AusNet Services notes that since 2002, AusNet Services has classified Small Industrial & Commercial (I&C) customers as those using up to 160 MWh per annum and Medium sized customers as those using 160 MWh to 400 MWh per annum, consistent with National Market definitions. However, AusNet Services’ TSS identified Small I&C customers as those using up to 70 MWh per annum and Medium I&C customers as those using between 70 MWh and 400 MWh per annum. To clarify, the TSS was incorrect in stating this and this Pricing Proposal continues to use the existing classification.
For AusNet Services to comply with these settings, further tariffs not proposed in the TSS and not included in the current proposal would be required to accommodate customers using between 70 MWh and 160 MWh that would also need to be assigned to a cost reflective tariff similar in structure to the proposed NASN19 and NASN21 tariffs but classified as Medium I&C. This would also result in a non-compliance with the approved TSS. Therefore AusNet Services preferred solution is to vary the approved TSS by updating the relevant tables. This has no impact on customers in those tariff classes and Table 2.1 sets out the correct tariff classifications:
Table 2.1 – AusNet Services’ proposed tariff classes
Tariff class Typical customer Definition
Residential Residential customers Low voltage (230 V & 415 V)
Annual consumption is < 160 MWh per annum
Small Industrial & Commercial
Small LV Industrial & Commercial customers
Low voltage (230 V & 415 V)
Annual consumption is < 160 MWh per annum
Medium Industrial & Commercial
Medium LV Industrial & Commercial customers
Low voltage (230 V & 415 V)
Annual consumption is > 160 MWh and < 400 MWh per annum
Large Industrial & Commercial
Large LV Industrial & Commercial customers
Low voltage (230 V & 415 V)
Annual consumption is > 400 MWh per annum
Annual Tariff Proposal 2020
ISSUE 19 PAGE 10 OF 65 UNCONTROLLED WHEN PRINTED
High Voltage Large HV Industrial & Commercial customers
High voltage (6.6 kV, 11 kV & 22kV)
Sub Transmission Large Extra HV Industrial & Commercial customers
Sub transmission (66 kV)
The TSS provides for the introduction of opt-in cost-reflective demand tariffs for residential and small commercial customers (<40 MWh consumption per annum) commencing in 2018. These tariffs are accordingly included in tariff schedules in this Tariff Proposal. We note that energy based seasonal time of use tariffs continue to be available as an alternative cost reflective tariff structure.
An amendment to the 2016 TSS was necessary to comply with Victorian government policy amendment which is given effect via orders in council gazetted on 14 September 2017. The policy requires that medium business customers, i.e. customers consuming between 40 MWh and 160 MWh per annum, have the option to opt-out of the network tariff with a demand charge to which they have been assigned. The opt-out arrangement applied from 1 January 2018.
2.2 Electricity distribution price review requirements
AusNet Services’ revenue and pricing must comply with its 2016-2020 electricity distribution price determination. Total revenues recovered through distribution prices and the relevant price formulae are explained below.
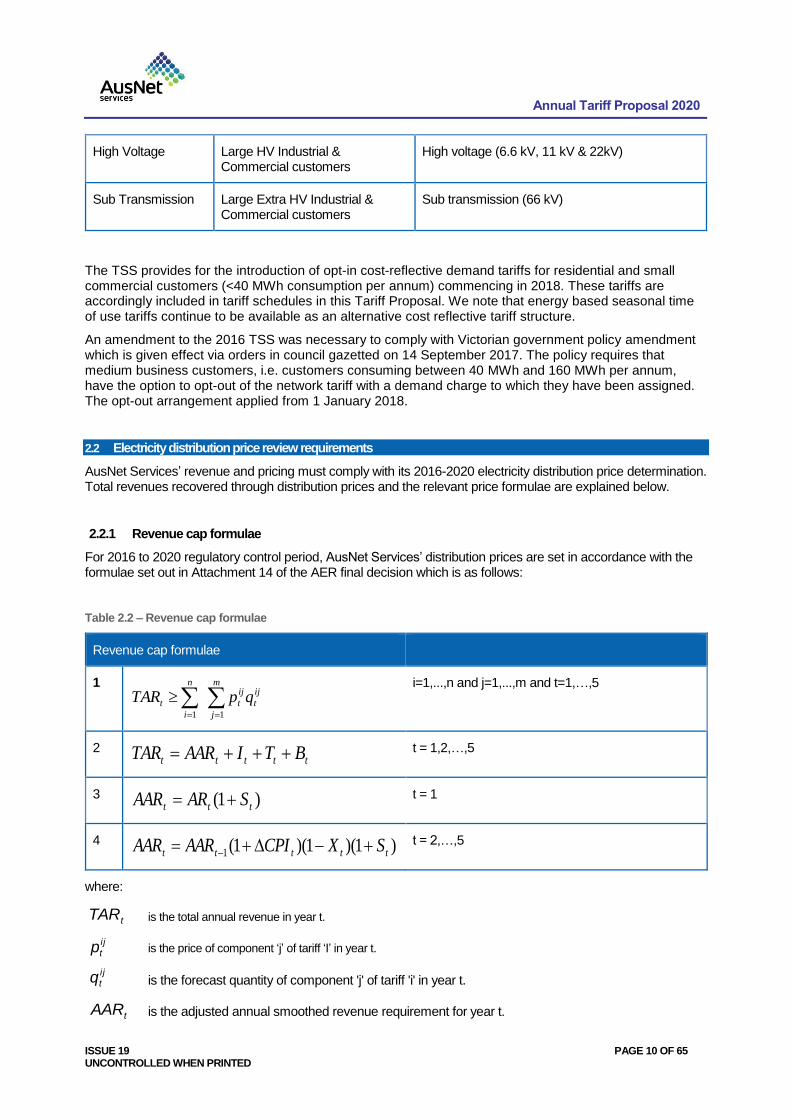
2.2.1 Revenue cap formulae
For 2016 to 2020 regulatory control period, AusNet Services’ distribution prices are set in accordance with the formulae set out in Attachment 14 of the AER final decision which is as follows:
Table 2.2 – Revenue cap formulae
Revenue cap formulae
1 ij
t
m
j
ij
t
n
i
t qpTAR
11
i=1,...,n and j=1,...,m and t=1,…,5
2 ttttt BTIAARTAR
t = 1,2,…,5
3 )1( ttt SARAAR
t = 1
4 )1)(1)(1(1 ttttt SXCPIAARAAR
t = 2,…,5
where:
is the total annual revenue in year t.
is the price of component ‘j’ of tariff ‘I’ in year t.
is the forecast quantity of component 'j' of tariff 'i' in year t.
is the adjusted annual smoothed revenue requirement for year t.
tTAR
i j
tp
i j
tq
tAAR
Annual Tariff Proposal 2020
ISSUE 19 PAGE 11 OF 65 UNCONTROLLED WHEN PRINTED
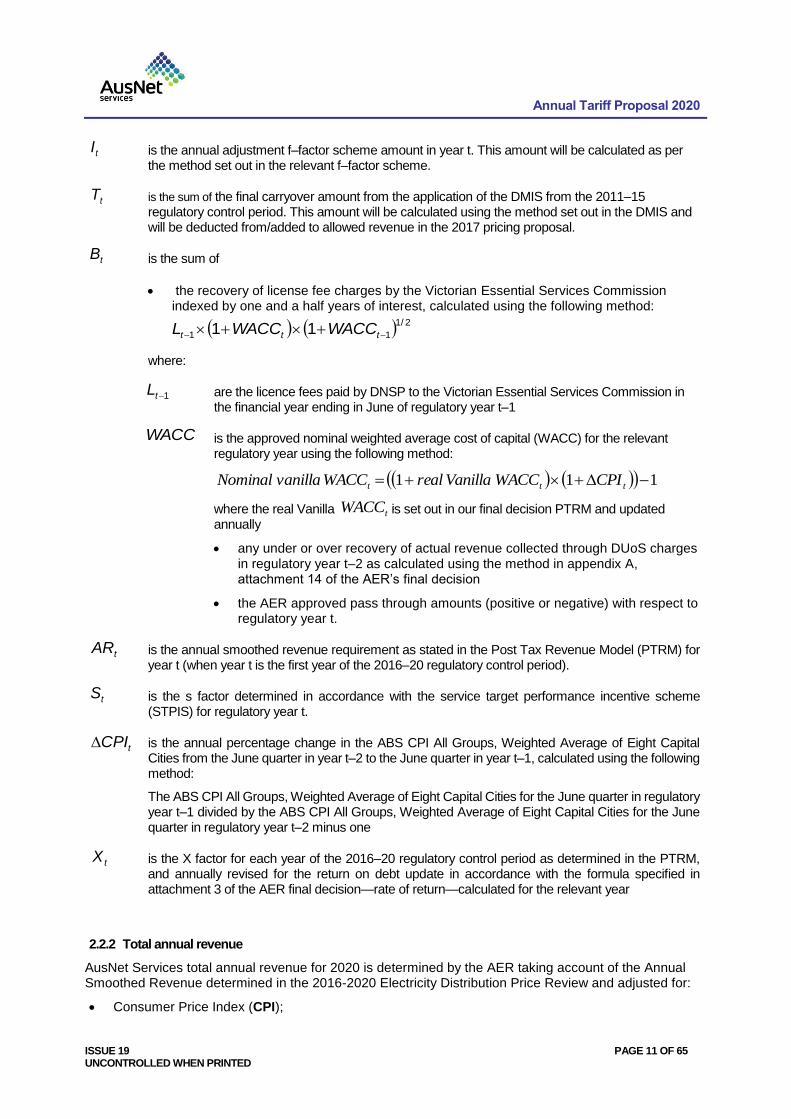
is the annual adjustment f–factor scheme amount in year t. This amount will be calculated as per the method set out in the relevant f–factor scheme.
is the sum of the final carryover amount from the application of the DMIS from the 2011–15 regulatory control period. This amount will be calculated using the method set out in the DMIS and will be deducted from/added to allowed revenue in the 2017 pricing proposal.
is the sum of
the recovery of license fee charges by the Victorian Essential Services Commission indexed by one and a half years of interest, calculated using the following method:
where:
are the licence fees paid by DNSP to the Victorian Essential Services Commission in the financial year ending in June of regulatory year t–1
is the approved nominal weighted average cost of capital (WACC) for the relevant regulatory year using the following method:
where the real Vanilla is set out in our final decision PTRM and updated annually
any under or over recovery of actual revenue collected through DUoS charges in regulatory year t–2 as calculated using the method in appendix A, attachment 14 of the AER’s final decision
the AER approved pass through amounts (positive or negative) with respect to regulatory year t.
is the annual smoothed revenue requirement as stated in the Post Tax Revenue Model (PTRM) for year t (when year t is the first year of the 2016–20 regulatory control period).
is the s factor determined in accordance with the service target performance incentive scheme (STPIS) for regulatory year t.
is the annual percentage change in the ABS CPI All Groups, Weighted Average of Eight Capital Cities from the June quarter in year t–2 to the June quarter in year t–1, calculated using the following method:
The ABS CPI All Groups, Weighted Average of Eight Capital Cities for the June quarter in regulatory year t–1 divided by the ABS CPI All Groups, Weighted Average of Eight Capital Cities for the June quarter in regulatory year t–2 minus one
is the X factor for each year of the 2016–20 regulatory control period as determined in the PTRM, and annually revised for the return on debt update in accordance with the formula specified in attachment 3 of the AER final decision—rate of return—calculated for the relevant year
2.2.2 Total annual revenue
AusNet Services total annual revenue for 2020 is determined by the AER taking account of the Annual Smoothed Revenue determined in the 2016-2020 Electricity Distribution Price Review and adjusted for:
Consumer Price Index (CPI);
11 1 ttt CPIWACC Vanilla realWACC vanilla Nominal
tI
tT
tB
2/1
11 11 ttt WACCWACCL
1tL
WACC
11 1 ttt CPIWACC Vanilla realWACC vanilla Nominal
tX
tCPI
tS
tAR
Annual Tariff Proposal 2020
ISSUE 19 PAGE 12 OF 65 UNCONTROLLED WHEN PRINTED
service target performance incentive scheme results1;
f–factor scheme;
approved revenue2 to continue to deliver a legislated bushfire safety program (known as REFCLs);
the recovery of Victorian Government license fee charges;
the under or over recovery of revenue collected through DUoS charges in previous years;
any AER approved pass through amounts; and
the X-factor revised for the return on debt.
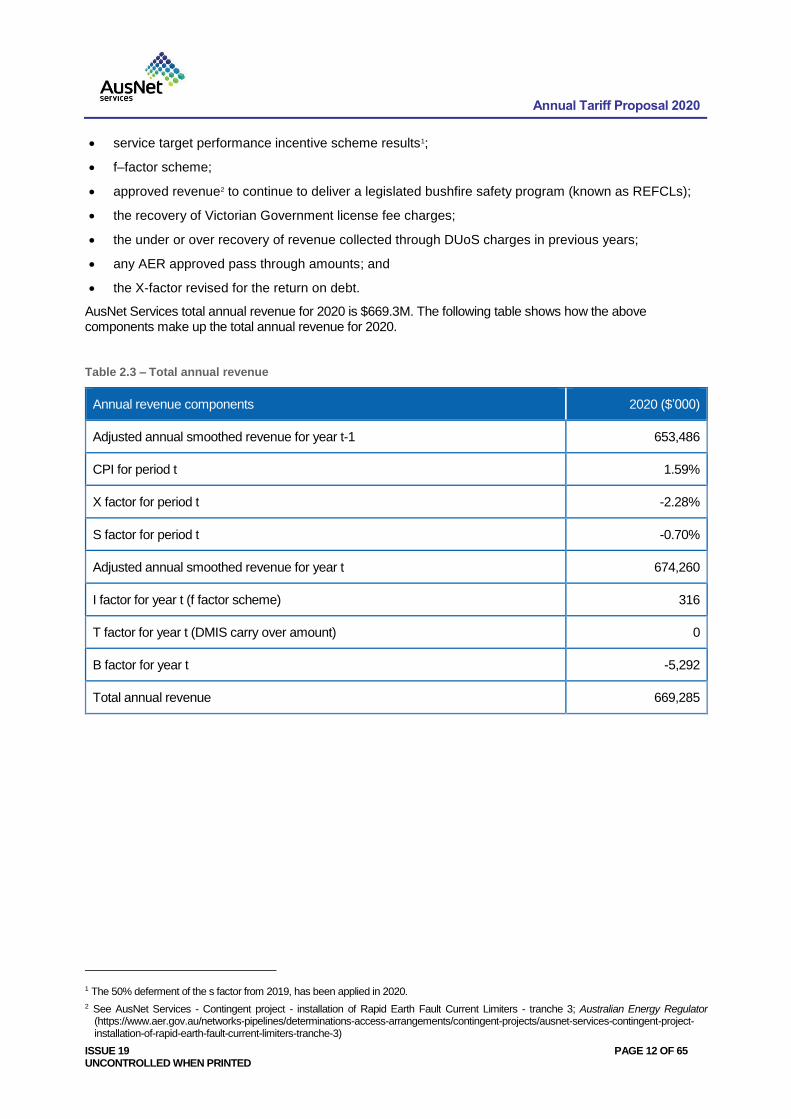
AusNet Services total annual revenue for 2020 is $669.3M. The following table shows how the above components make up the total annual revenue for 2020.
Table 2.3 – Total annual revenue
Annual revenue components 2020 ($’000)
Adjusted annual smoothed revenue for year t-1 653,486
CPI for period t 1.59%
X factor for period t -2.28%
S factor for period t -0.70%
Adjusted annual smoothed revenue for year t 674,260
I factor for year t (f factor scheme) 316
T factor for year t (DMIS carry over amount) 0
B factor for year t -5,292
Total annual revenue 669,285
1 The 50% deferment of the s factor from 2019, has been applied in 2020.
2 See AusNet Services - Contingent project - installation of Rapid Earth Fault Current Limiters - tranche 3; Australian Energy Regulator (https://www.aer.gov.au/networks-pipelines/determinations-access-arrangements/contingent-projects/ausnet-services-contingent-project-installation-of-rapid-earth-fault-current-limiters-tranche-3)
Annual Tariff Proposal 2020
ISSUE 19 PAGE 13 OF 65 UNCONTROLLED WHEN PRINTED
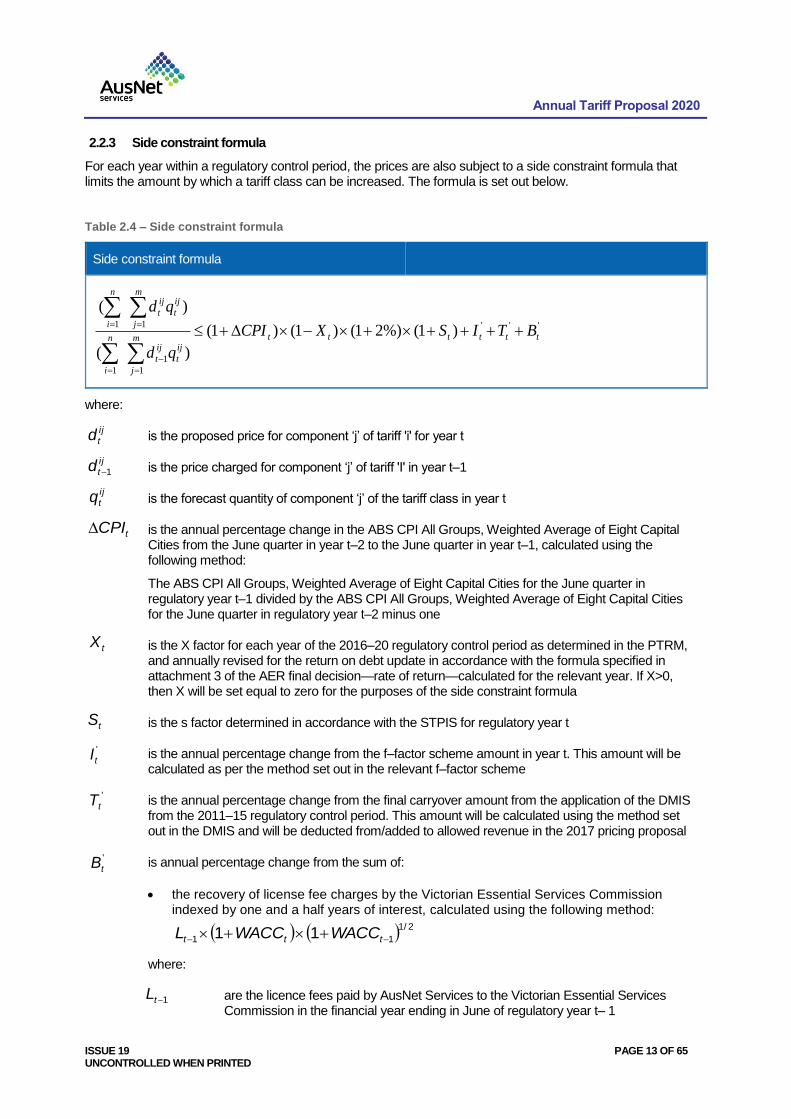
2.2.3 Side constraint formula
For each year within a regulatory control period, the prices are also subject to a side constraint formula that limits the amount by which a tariff class can be increased. The formula is set out below.
Table 2.4 – Side constraint formula
Side constraint formula
'''
1
1
1
11)1(%)21()1()1(
)(
)(
ttttttm
j
ij
t
ij
t
n
i
m
j
ij
t
ij
t
n
iBTISXCPI
qd
qd
where:
is the proposed price for component ‘j’ of tariff 'i' for year t
is the price charged for component ‘j’ of tariff 'I' in year t–1
is the forecast quantity of component ‘j’ of the tariff class in year t
is the annual percentage change in the ABS CPI All Groups, Weighted Average of Eight Capital Cities from the June quarter in year t–2 to the June quarter in year t–1, calculated using the following method:
The ABS CPI All Groups, Weighted Average of Eight Capital Cities for the June quarter in regulatory year t–1 divided by the ABS CPI All Groups, Weighted Average of Eight Capital Cities for the June quarter in regulatory year t–2 minus one
is the X factor for each year of the 2016–20 regulatory control period as determined in the PTRM, and annually revised for the return on debt update in accordance with the formula specified in attachment 3 of the AER final decision—rate of return—calculated for the relevant year. If X>0, then X will be set equal to zero for the purposes of the side constraint formula
is the s factor determined in accordance with the STPIS for regulatory year t
is the annual percentage change from the f–factor scheme amount in year t. This amount will be calculated as per the method set out in the relevant f–factor scheme
is the annual percentage change from the final carryover amount from the application of the DMIS from the 2011–15 regulatory control period. This amount will be calculated using the method set out in the DMIS and will be deducted from/added to allowed revenue in the 2017 pricing proposal
is annual percentage change from the sum of:
the recovery of license fee charges by the Victorian Essential Services Commission indexed by one and a half years of interest, calculated using the following method:
where:
are the licence fees paid by AusNet Services to the Victorian Essential Services Commission in the financial year ending in June of regulatory year t– 1
ij
td
ij
td 1
i j
tq
tCPI
tX
tS
'
tI
'
tT
'
tB
2/1
11 11 ttt WACCWACCL
1tL
Annual Tariff Proposal 2020
ISSUE 19 PAGE 14 OF 65 UNCONTROLLED WHEN PRINTED
is the approved nominal weighted average cost of capital (WACC) for the relevant regulatory year, using the following method:
where the real Vanilla is set out in our final decision PTRM and updated annually
any under or over recovery of actual revenue collected through DUoS charges in regulatory year t–2 as calculated using the method in appendix A, attachment 14 of the AER’s final decision
the AER approved pass through amounts (positive or negative) with respect to regulatory year t.
With the exception of the CPI, X factor and S factor, the percentage for each of the other factors above can be calculated by dividing the incremental revenues (as used in the total annual revenue formula) for each factor by the expected revenues for regulatory year t–1 (based on the prices in year t–1 multiplied by the forecast quantities for year t).
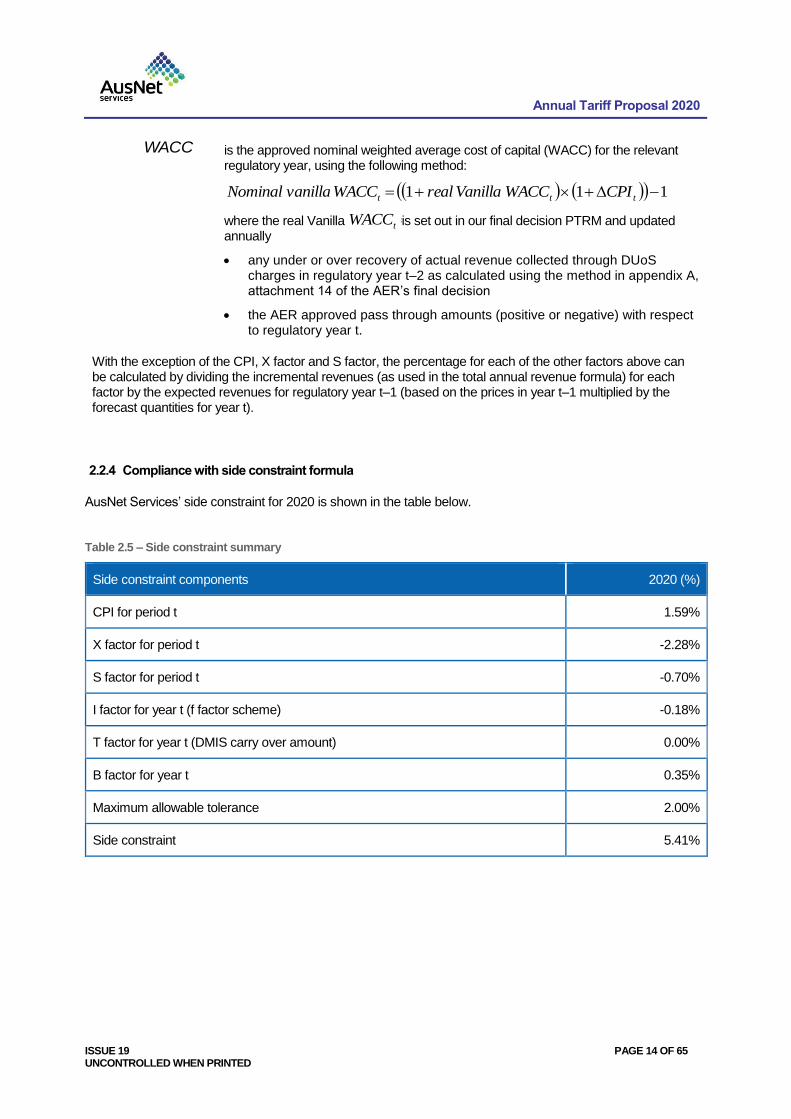
2.2.4 Compliance with side constraint formula
AusNet Services’ side constraint for 2020 is shown in the table below.
Table 2.5 – Side constraint summary
Side constraint components 2020 (%)
CPI for period t 1.59%
X factor for period t -2.28%
S factor for period t -0.70%
I factor for year t (f factor scheme) -0.18%
T factor for year t (DMIS carry over amount) 0.00%
B factor for year t 0.35%
Maximum allowable tolerance 2.00%
Side constraint 5.41%
11 1 ttt CPIWACC Vanilla realWACC vanilla Nominal
11 1 ttt CPIWACC Vanilla realWACC vanilla Nominal
WACC
Annual Tariff Proposal 2020
ISSUE 19 PAGE 15 OF 65 UNCONTROLLED WHEN PRINTED
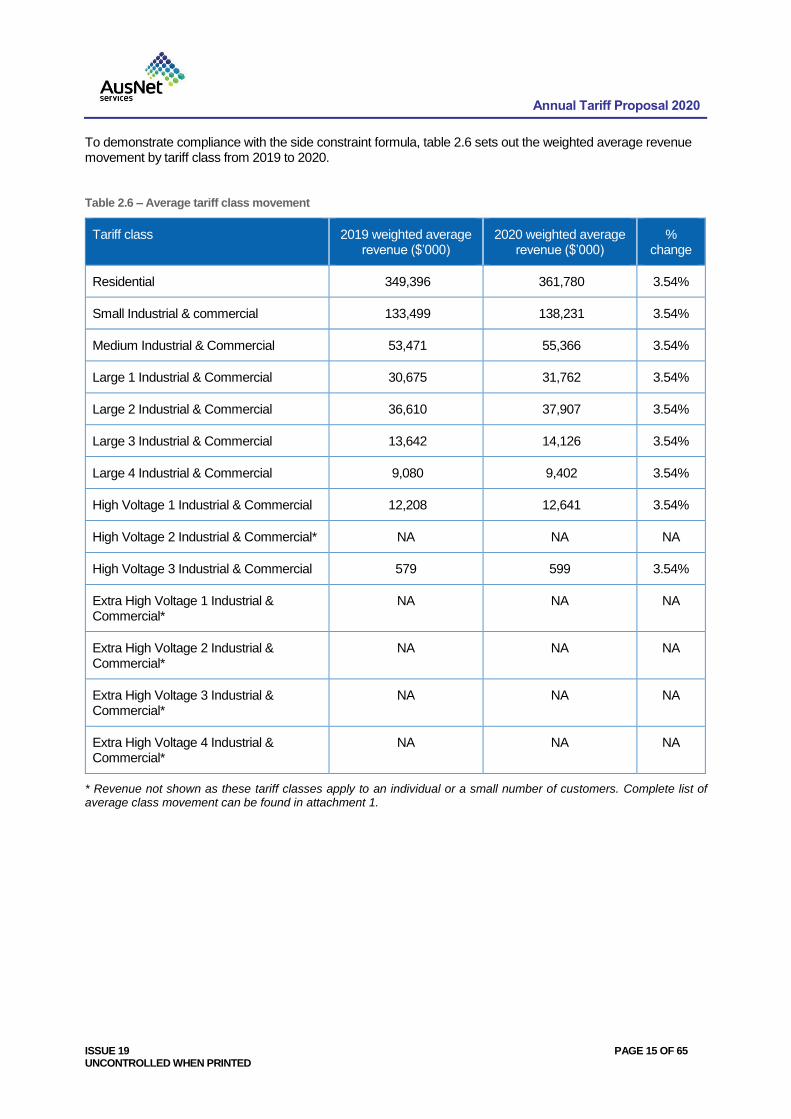
To demonstrate compliance with the side constraint formula, table 2.6 sets out the weighted average revenue movement by tariff class from 2019 to 2020.
Table 2.6 – Average tariff class movement
Tariff class 2019 weighted average revenue ($’000)
2020 weighted average revenue ($’000)
% change
Residential 349,396 361,780 3.54%
Small Industrial & commercial 133,499 138,231 3.54%
Medium Industrial & Commercial 53,471 55,366 3.54%
Large 1 Industrial & Commercial 30,675 31,762 3.54%
Large 2 Industrial & Commercial 36,610 37,907 3.54%
Large 3 Industrial & Commercial 13,642 14,126 3.54%
Large 4 Industrial & Commercial 9,080 9,402 3.54%
High Voltage 1 Industrial & Commercial 12,208 12,641 3.54%
High Voltage 2 Industrial & Commercial* NA NA NA
High Voltage 3 Industrial & Commercial 579 599 3.54%
Extra High Voltage 1 Industrial & Commercial*
NA NA NA
Extra High Voltage 2 Industrial & Commercial*
NA NA NA
Extra High Voltage 3 Industrial & Commercial*
NA NA NA
Extra High Voltage 4 Industrial & Commercial*
NA NA NA
* Revenue not shown as these tariff classes apply to an individual or a small number of customers. Complete list of average class movement can be found in attachment 1.
Annual Tariff Proposal 2020
ISSUE 19 PAGE 16 OF 65 UNCONTROLLED WHEN PRINTED
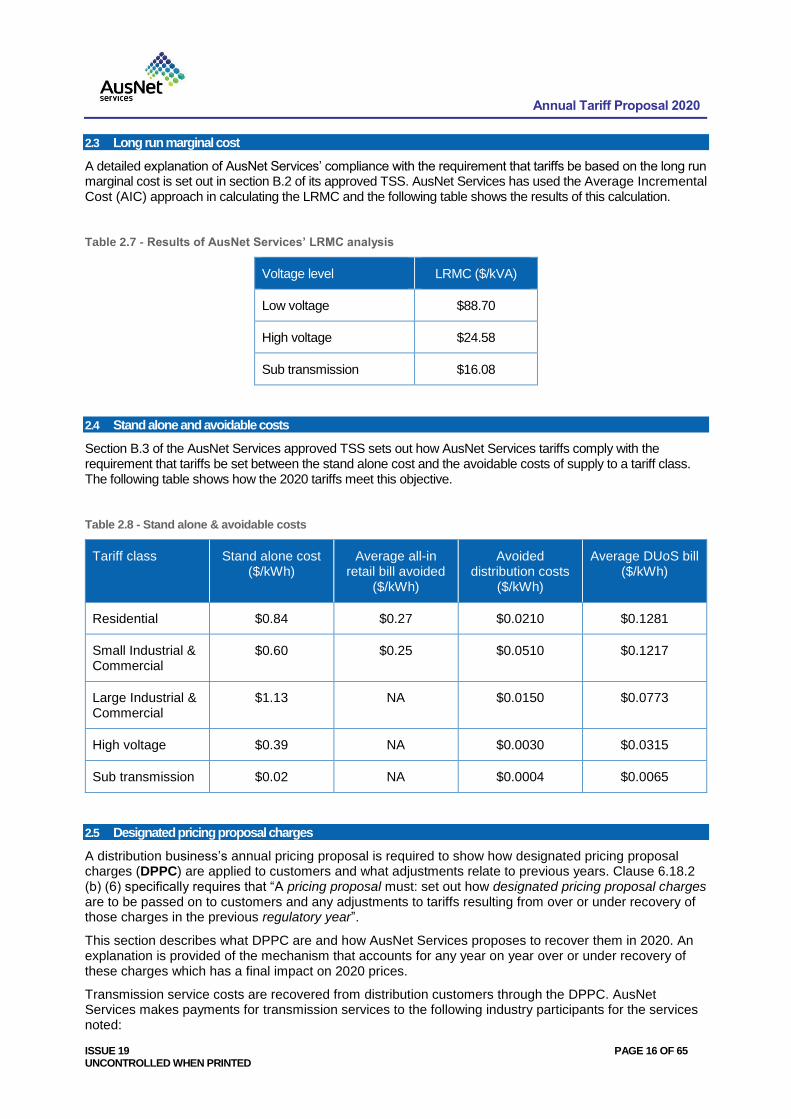
2.3 Long run marginal cost
A detailed explanation of AusNet Services’ compliance with the requirement that tariffs be based on the long run marginal cost is set out in section B.2 of its approved TSS. AusNet Services has used the Average Incremental Cost (AIC) approach in calculating the LRMC and the following table shows the results of this calculation.
Table 2.7 - Results of AusNet Services’ LRMC analysis
Voltage level LRMC ($/kVA)
Low voltage $88.70
High voltage $24.58
Sub transmission $16.08
2.4 Stand alone and avoidable costs
Section B.3 of the AusNet Services approved TSS sets out how AusNet Services tariffs comply with the requirement that tariffs be set between the stand alone cost and the avoidable costs of supply to a tariff class. The following table shows how the 2020 tariffs meet this objective.
Table 2.8 - Stand alone & avoidable costs
Tariff class Stand alone cost ($/kWh)
Average all-in retail bill avoided
($/kWh)
Avoided distribution costs
($/kWh)
Average DUoS bill ($/kWh)
Residential $0.84 $0.27 $0.0210 $0.1281
Small Industrial & Commercial
$0.60 $0.25 $0.0510 $0.1217
Large Industrial & Commercial
$1.13 NA $0.0150 $0.0773
High voltage $0.39 NA $0.0030 $0.0315
Sub transmission $0.02 NA $0.0004 $0.0065
2.5 Designated pricing proposal charges
A distribution business’s annual pricing proposal is required to show how designated pricing proposal charges (DPPC) are applied to customers and what adjustments relate to previous years. Clause 6.18.2 (b) (6) specifically requires that “A pricing proposal must: set out how designated pricing proposal charges are to be passed on to customers and any adjustments to tariffs resulting from over or under recovery of those charges in the previous regulatory year”.
This section describes what DPPC are and how AusNet Services proposes to recover them in 2020. An explanation is provided of the mechanism that accounts for any year on year over or under recovery of these charges which has a final impact on 2020 prices.
Transmission service costs are recovered from distribution customers through the DPPC. AusNet Services makes payments for transmission services to the following industry participants for the services noted:
Annual Tariff Proposal 2020
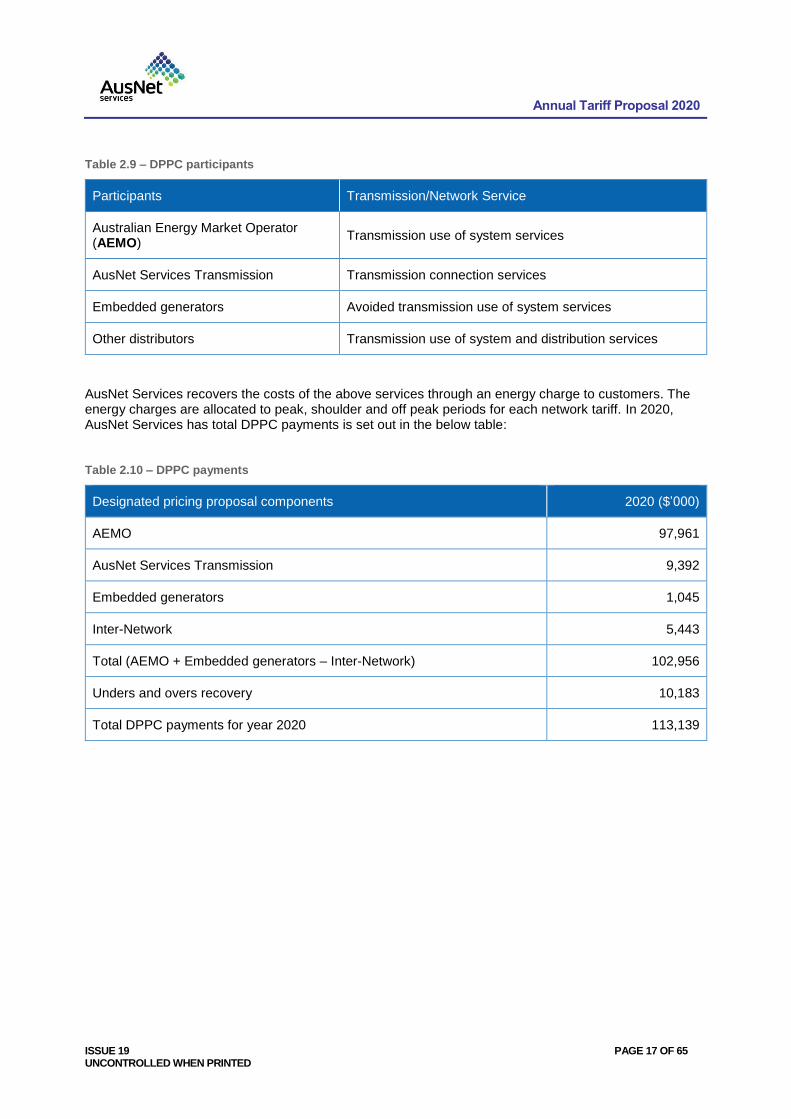
ISSUE 19 PAGE 17 OF 65 UNCONTROLLED WHEN PRINTED
Table 2.9 – DPPC participants
Participants Transmission/Network Service
Australian Energy Market Operator (AEMO)
Transmission use of system services
AusNet Services Transmission Transmission connection services
Embedded generators Avoided transmission use of system services
Other distributors Transmission use of system and distribution services
AusNet Services recovers the costs of the above services through an energy charge to customers. The energy charges are allocated to peak, shoulder and off peak periods for each network tariff. In 2020, AusNet Services has total DPPC payments is set out in the below table:
Table 2.10 – DPPC payments
Designated pricing proposal components 2020 ($’000)
AEMO 97,961
AusNet Services Transmission 9,392
Embedded generators 1,045
Inter-Network 5,443
Total (AEMO + Embedded generators – Inter-Network) 102,956
Unders and overs recovery 10,183
Total DPPC payments for year 2020 113,139
Annual Tariff Proposal 2020
ISSUE 19 PAGE 18 OF 65 UNCONTROLLED WHEN PRINTED
2.6 Jurisdictional pricing proposal charges
Under Victorian legislation, AusNet Services is required to make payments to certain customers with small generation systems, mainly solar panel installations, for the energy that they feed into the network. The PFiT scheme is the only scheme that is in place and will continue to operate until 2024.
A distribution business’s annual pricing proposal is required to show how Jurisdictional pricing proposal charges are applied to customers and what adjustments relate to previous years. Clause 6.18.2 (b) (6A) specifically requires that “A pricing proposal must: set out how jurisdictional scheme amounts for each approved jurisdictional scheme are to be passed on to customers and any adjustments to tariffs resulting from over or under recovery of those amounts;”
Amounts paid out for jurisdictional schemes are recovered from distribution customers through the Jurisdictional pricing proposal charges. AusNet Services makes payments to retailers with qualifying customers on tariffs that have a PFiT component through network invoices on a monthly basis.
Jurisdictional charges for 2020 are made up of the residual unders and overs recovery from 2018 and 2019, and the forecast PFiT payments for 2020. The following table sets out the amounts to be recovered in 2020.
Table 2.11 - JSA recovery arrangements
Jurisdictional recovery amounts 2020 ($’000)
Premium feed-in charges 24,705
Unders and overs recovery -211
Total recovered by tariffs 24,493
Annual Tariff Proposal 2020
ISSUE 19 PAGE 19 OF 65 UNCONTROLLED WHEN PRINTED
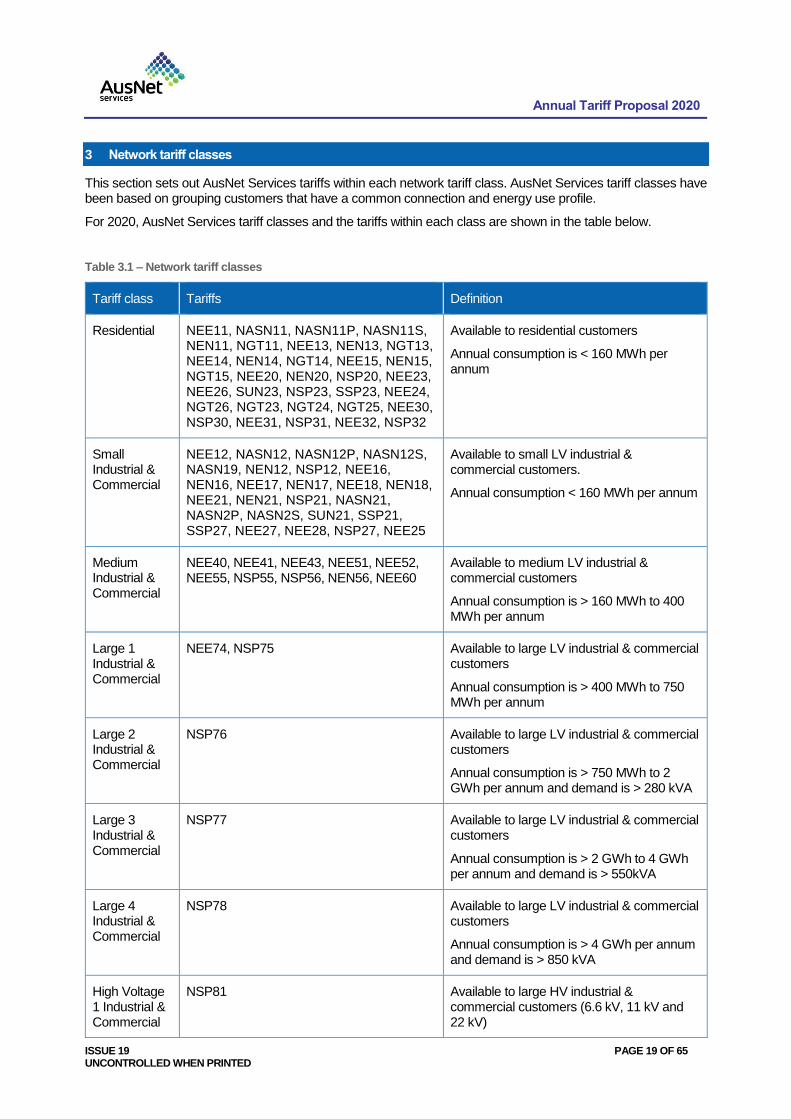
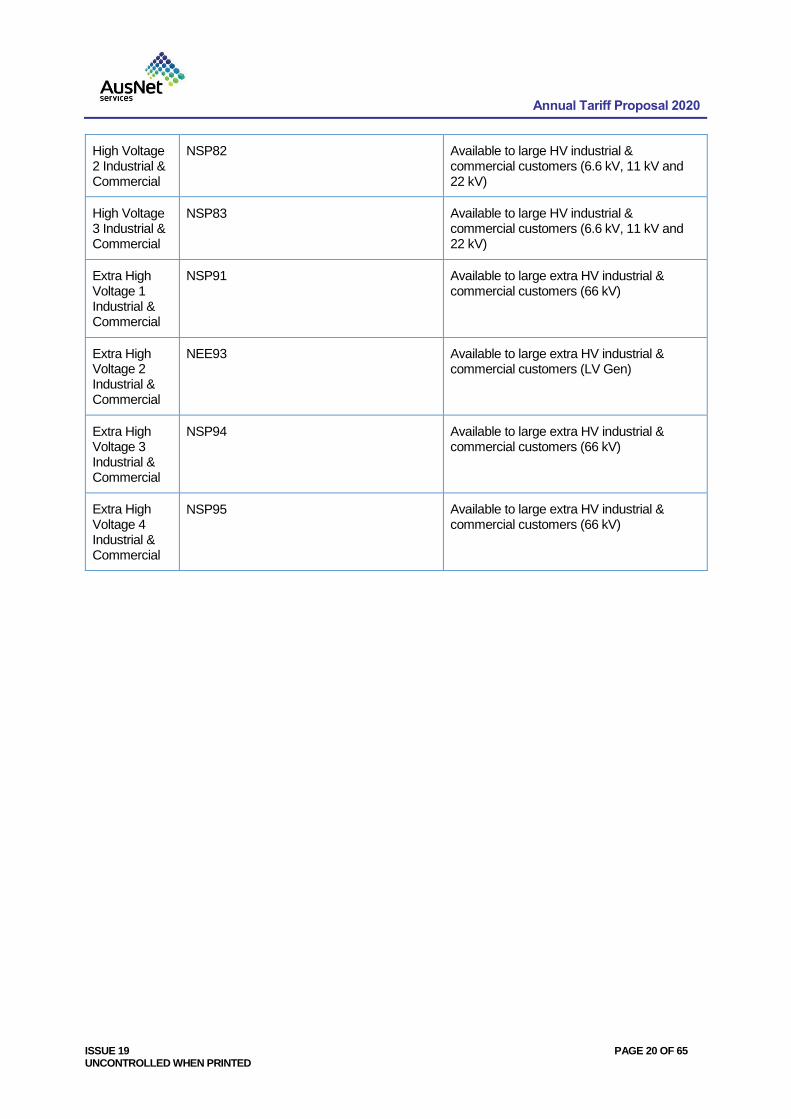
3 Network tariff classes
This section sets out AusNet Services tariffs within each network tariff class. AusNet Services tariff classes have been based on grouping customers that have a common connection and energy use profile.
For 2020, AusNet Services tariff classes and the tariffs within each class are shown in the table below.
Table 3.1 – Network tariff classes
Tariff class Tariffs Definition
Residential NEE11, NASN11, NASN11P, NASN11S, NEN11, NGT11, NEE13, NEN13, NGT13, NEE14, NEN14, NGT14, NEE15, NEN15, NGT15, NEE20, NEN20, NSP20, NEE23, NEE26, SUN23, NSP23, SSP23, NEE24, NGT26, NGT23, NGT24, NGT25, NEE30, NSP30, NEE31, NSP31, NEE32, NSP32
Available to residential customers
Annual consumption is < 160 MWh per annum
Small Industrial & Commercial
NEE12, NASN12, NASN12P, NASN12S, NASN19, NEN12, NSP12, NEE16, NEN16, NEE17, NEN17, NEE18, NEN18, NEE21, NEN21, NSP21, NASN21, NASN2P, NASN2S, SUN21, SSP21, SSP27, NEE27, NEE28, NSP27, NEE25
Available to small LV industrial & commercial customers.
Annual consumption < 160 MWh per annum
Medium Industrial & Commercial
NEE40, NEE41, NEE43, NEE51, NEE52, NEE55, NSP55, NSP56, NEN56, NEE60
Available to medium LV industrial & commercial customers
Annual consumption is > 160 MWh to 400 MWh per annum
Large 1 Industrial & Commercial
NEE74, NSP75 Available to large LV industrial & commercial customers
Annual consumption is > 400 MWh to 750 MWh per annum
Large 2 Industrial & Commercial
NSP76 Available to large LV industrial & commercial customers
Annual consumption is > 750 MWh to 2 GWh per annum and demand is > 280 kVA
Large 3 Industrial & Commercial
NSP77 Available to large LV industrial & commercial customers
Annual consumption is > 2 GWh to 4 GWh per annum and demand is > 550kVA
Large 4 Industrial & Commercial
NSP78 Available to large LV industrial & commercial customers
Annual consumption is > 4 GWh per annum and demand is > 850 kVA
High Voltage 1 Industrial & Commercial
NSP81 Available to large HV industrial & commercial customers (6.6 kV, 11 kV and 22 kV)
Annual Tariff Proposal 2020
ISSUE 19 PAGE 20 OF 65 UNCONTROLLED WHEN PRINTED
High Voltage 2 Industrial & Commercial
NSP82 Available to large HV industrial & commercial customers (6.6 kV, 11 kV and 22 kV)
High Voltage 3 Industrial & Commercial
NSP83 Available to large HV industrial & commercial customers (6.6 kV, 11 kV and 22 kV)
Extra High Voltage 1 Industrial & Commercial
NSP91 Available to large extra HV industrial & commercial customers (66 kV)
Extra High Voltage 2 Industrial & Commercial
NEE93 Available to large extra HV industrial & commercial customers (LV Gen)
Extra High Voltage 3 Industrial & Commercial
NSP94 Available to large extra HV industrial & commercial customers (66 kV)
Extra High Voltage 4 Industrial & Commercial
NSP95 Available to large extra HV industrial & commercial customers (66 kV)
Annual Tariff Proposal 2020
ISSUE 19 PAGE 21 OF 65 UNCONTROLLED WHEN PRINTED
4 Proposed network tariffs
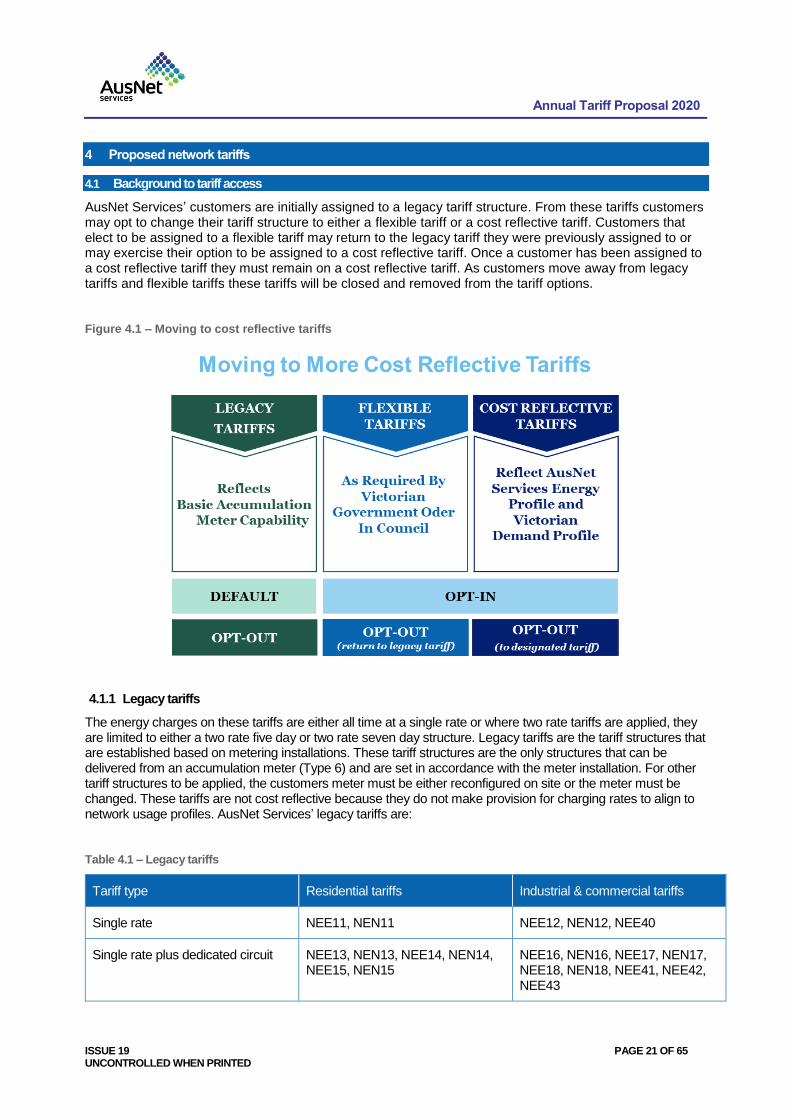
4.1 Background to tariff access
AusNet Services’ customers are initially assigned to a legacy tariff structure. From these tariffs customers may opt to change their tariff structure to either a flexible tariff or a cost reflective tariff. Customers that elect to be assigned to a flexible tariff may return to the legacy tariff they were previously assigned to or may exercise their option to be assigned to a cost reflective tariff. Once a customer has been assigned to a cost reflective tariff they must remain on a cost reflective tariff. As customers move away from legacy tariffs and flexible tariffs these tariffs will be closed and removed from the tariff options.
Figure 4.1 – Moving to cost reflective tariffs
4.1.1 Legacy tariffs
The energy charges on these tariffs are either all time at a single rate or where two rate tariffs are applied, they are limited to either a two rate five day or two rate seven day structure. Legacy tariffs are the tariff structures that are established based on metering installations. These tariff structures are the only structures that can be delivered from an accumulation meter (Type 6) and are set in accordance with the meter installation. For other tariff structures to be applied, the customers meter must be either reconfigured on site or the meter must be changed. These tariffs are not cost reflective because they do not make provision for charging rates to align to network usage profiles. AusNet Services’ legacy tariffs are:
Table 4.1 – Legacy tariffs
Tariff type Residential tariffs Industrial & commercial tariffs
Single rate NEE11, NEN11 NEE12, NEN12, NEE40
Single rate plus dedicated circuit NEE13, NEN13, NEE14, NEN14, NEE15, NEN15
NEE16, NEN16, NEE17, NEN17, NEE18, NEN18, NEE41, NEE42, NEE43
Annual Tariff Proposal 2020
ISSUE 19 PAGE 22 OF 65 UNCONTROLLED WHEN PRINTED
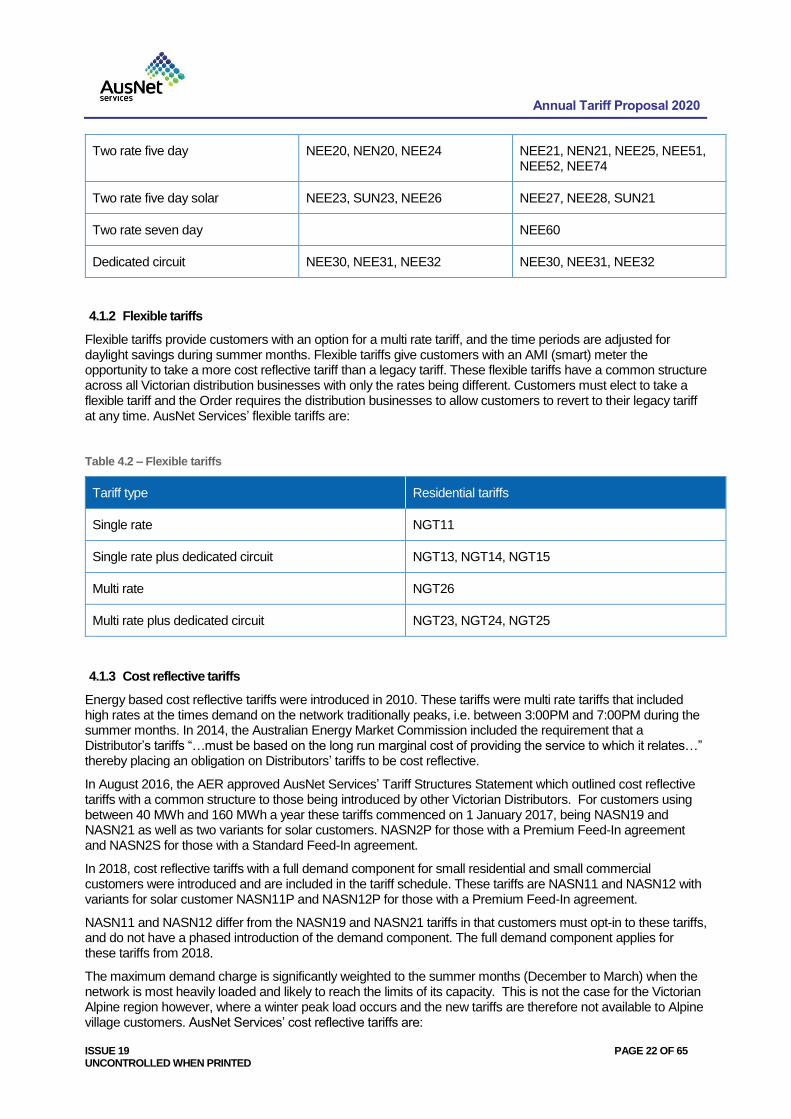
Two rate five day NEE20, NEN20, NEE24 NEE21, NEN21, NEE25, NEE51, NEE52, NEE74
Two rate five day solar NEE23, SUN23, NEE26 NEE27, NEE28, SUN21
Two rate seven day NEE60
Dedicated circuit NEE30, NEE31, NEE32 NEE30, NEE31, NEE32
4.1.2 Flexible tariffs
Flexible tariffs provide customers with an option for a multi rate tariff, and the time periods are adjusted for daylight savings during summer months. Flexible tariffs give customers with an AMI (smart) meter the opportunity to take a more cost reflective tariff than a legacy tariff. These flexible tariffs have a common structure across all Victorian distribution businesses with only the rates being different. Customers must elect to take a flexible tariff and the Order requires the distribution businesses to allow customers to revert to their legacy tariff at any time. AusNet Services’ flexible tariffs are:
Table 4.2 – Flexible tariffs
Tariff type Residential tariffs
Single rate NGT11
Single rate plus dedicated circuit NGT13, NGT14, NGT15
Multi rate NGT26
Multi rate plus dedicated circuit NGT23, NGT24, NGT25
4.1.3 Cost reflective tariffs
Energy based cost reflective tariffs were introduced in 2010. These tariffs were multi rate tariffs that included high rates at the times demand on the network traditionally peaks, i.e. between 3:00PM and 7:00PM during the summer months. In 2014, the Australian Energy Market Commission included the requirement that a Distributor’s tariffs “…must be based on the long run marginal cost of providing the service to which it relates…” thereby placing an obligation on Distributors’ tariffs to be cost reflective.
In August 2016, the AER approved AusNet Services’ Tariff Structures Statement which outlined cost reflective tariffs with a common structure to those being introduced by other Victorian Distributors. For customers using between 40 MWh and 160 MWh a year these tariffs commenced on 1 January 2017, being NASN19 and NASN21 as well as two variants for solar customers. NASN2P for those with a Premium Feed-In agreement and NASN2S for those with a Standard Feed-In agreement.
In 2018, cost reflective tariffs with a full demand component for small residential and small commercial customers were introduced and are included in the tariff schedule. These tariffs are NASN11 and NASN12 with variants for solar customer NASN11P and NASN12P for those with a Premium Feed-In agreement.
NASN11 and NASN12 differ from the NASN19 and NASN21 tariffs in that customers must opt-in to these tariffs, and do not have a phased introduction of the demand component. The full demand component applies for these tariffs from 2018.
The maximum demand charge is significantly weighted to the summer months (December to March) when the network is most heavily loaded and likely to reach the limits of its capacity. This is not the case for the Victorian Alpine region however, where a winter peak load occurs and the new tariffs are therefore not available to Alpine village customers. AusNet Services’ cost reflective tariffs are:
Annual Tariff Proposal 2020
ISSUE 19 PAGE 23 OF 65 UNCONTROLLED WHEN PRINTED
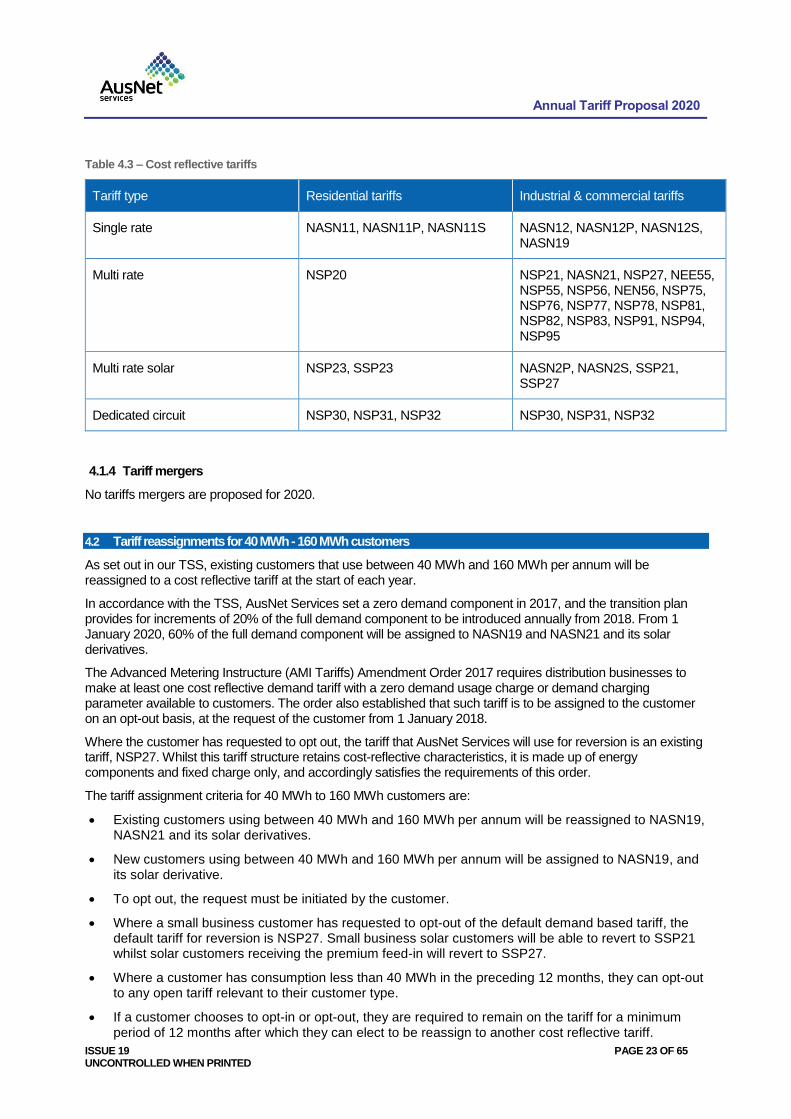
Table 4.3 – Cost reflective tariffs
Tariff type Residential tariffs Industrial & commercial tariffs
Single rate NASN11, NASN11P, NASN11S NASN12, NASN12P, NASN12S, NASN19
Multi rate NSP20 NSP21, NASN21, NSP27, NEE55, NSP55, NSP56, NEN56, NSP75, NSP76, NSP77, NSP78, NSP81, NSP82, NSP83, NSP91, NSP94, NSP95
Multi rate solar NSP23, SSP23 NASN2P, NASN2S, SSP21, SSP27
Dedicated circuit NSP30, NSP31, NSP32 NSP30, NSP31, NSP32
4.1.4 Tariff mergers
No tariffs mergers are proposed for 2020.
4.2 Tariff reassignments for 40 MWh - 160 MWh customers
As set out in our TSS, existing customers that use between 40 MWh and 160 MWh per annum will be reassigned to a cost reflective tariff at the start of each year.
In accordance with the TSS, AusNet Services set a zero demand component in 2017, and the transition plan provides for increments of 20% of the full demand component to be introduced annually from 2018. From 1 January 2020, 60% of the full demand component will be assigned to NASN19 and NASN21 and its solar derivatives.
The Advanced Metering Instructure (AMI Tariffs) Amendment Order 2017 requires distribution businesses to make at least one cost reflective demand tariff with a zero demand usage charge or demand charging parameter available to customers. The order also established that such tariff is to be assigned to the customer on an opt-out basis, at the request of the customer from 1 January 2018.
Where the customer has requested to opt out, the tariff that AusNet Services will use for reversion is an existing tariff, NSP27. Whilst this tariff structure retains cost-reflective characteristics, it is made up of energy components and fixed charge only, and accordingly satisfies the requirements of this order.
The tariff assignment criteria for 40 MWh to 160 MWh customers are:
Existing customers using between 40 MWh and 160 MWh per annum will be reassigned to NASN19, NASN21 and its solar derivatives.
New customers using between 40 MWh and 160 MWh per annum will be assigned to NASN19, and its solar derivative.
To opt out, the request must be initiated by the customer.
Where a small business customer has requested to opt-out of the default demand based tariff, the default tariff for reversion is NSP27. Small business solar customers will be able to revert to SSP21 whilst solar customers receiving the premium feed-in will revert to SSP27.
Where a customer has consumption less than 40 MWh in the preceding 12 months, they can opt-out to any open tariff relevant to their customer type.
If a customer chooses to opt-in or opt-out, they are required to remain on the tariff for a minimum period of 12 months after which they can elect to be reassign to another cost reflective tariff.
Annual Tariff Proposal 2020
ISSUE 19 PAGE 24 OF 65 UNCONTROLLED WHEN PRINTED
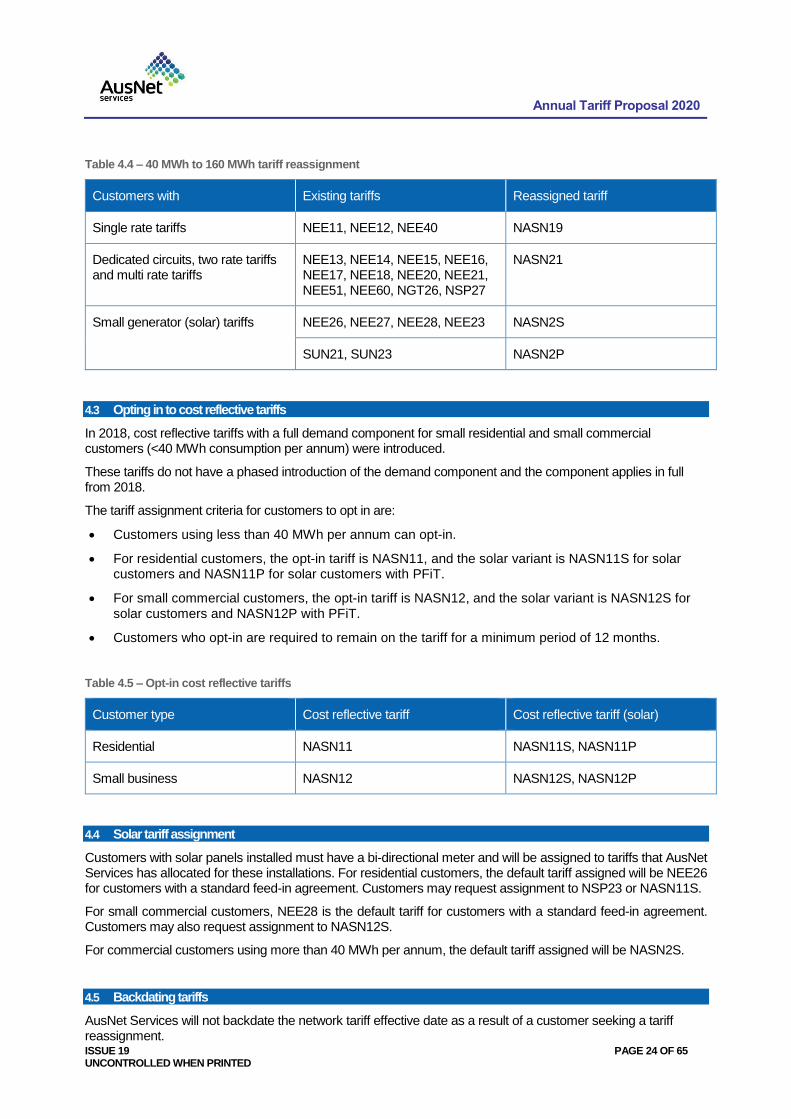
Table 4.4 – 40 MWh to 160 MWh tariff reassignment
Customers with Existing tariffs Reassigned tariff
Single rate tariffs NEE11, NEE12, NEE40 NASN19
Dedicated circuits, two rate tariffs and multi rate tariffs
NEE13, NEE14, NEE15, NEE16, NEE17, NEE18, NEE20, NEE21, NEE51, NEE60, NGT26, NSP27
NASN21
Small generator (solar) tariffs NEE26, NEE27, NEE28, NEE23 NASN2S
SUN21, SUN23 NASN2P
4.3 Opting in to cost reflective tariffs
In 2018, cost reflective tariffs with a full demand component for small residential and small commercial customers (<40 MWh consumption per annum) were introduced.
These tariffs do not have a phased introduction of the demand component and the component applies in full from 2018.
The tariff assignment criteria for customers to opt in are:
Customers using less than 40 MWh per annum can opt-in.
For residential customers, the opt-in tariff is NASN11, and the solar variant is NASN11S for solar customers and NASN11P for solar customers with PFiT.
For small commercial customers, the opt-in tariff is NASN12, and the solar variant is NASN12S for solar customers and NASN12P with PFiT.
Customers who opt-in are required to remain on the tariff for a minimum period of 12 months.
Table 4.5 – Opt-in cost reflective tariffs
Customer type Cost reflective tariff Cost reflective tariff (solar)
Residential NASN11 NASN11S, NASN11P
Small business NASN12 NASN12S, NASN12P
4.4 Solar tariff assignment
Customers with solar panels installed must have a bi-directional meter and will be assigned to tariffs that AusNet Services has allocated for these installations. For residential customers, the default tariff assigned will be NEE26 for customers with a standard feed-in agreement. Customers may request assignment to NSP23 or NASN11S.
For small commercial customers, NEE28 is the default tariff for customers with a standard feed-in agreement. Customers may also request assignment to NASN12S.
For commercial customers using more than 40 MWh per annum, the default tariff assigned will be NASN2S.
4.5 Backdating tariffs
AusNet Services will not backdate the network tariff effective date as a result of a customer seeking a tariff reassignment.
Annual Tariff Proposal 2020
ISSUE 19 PAGE 25 OF 65 UNCONTROLLED WHEN PRINTED
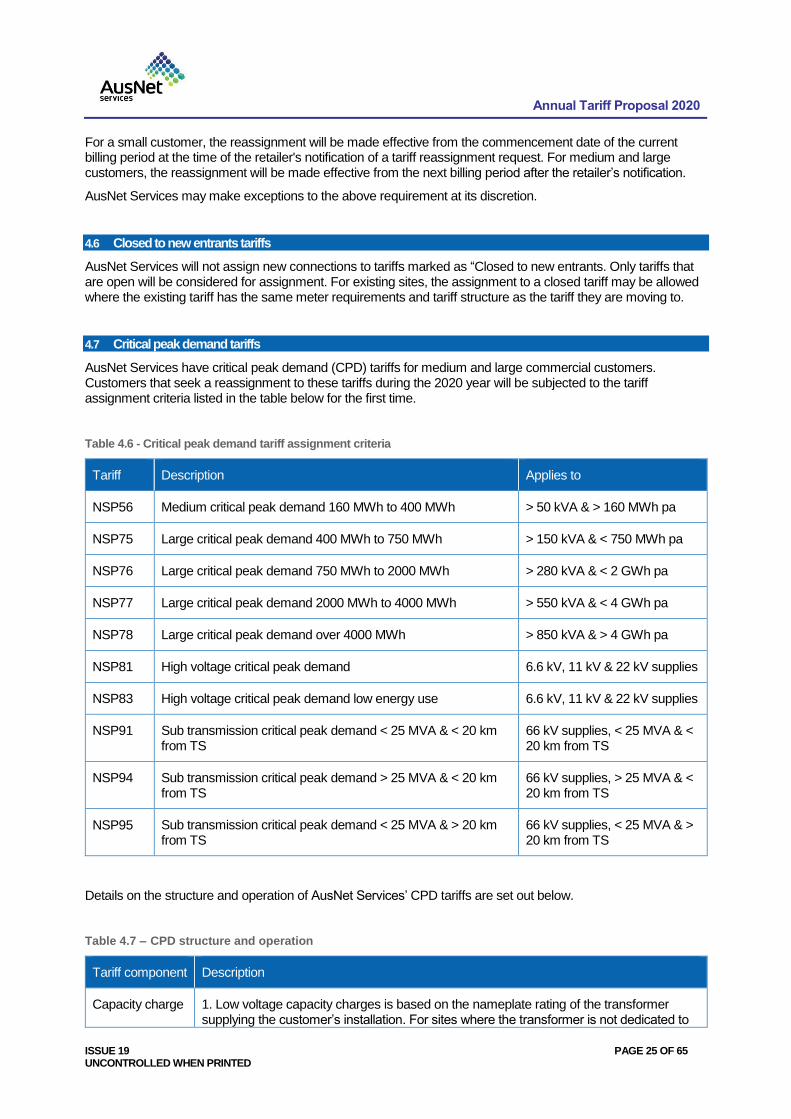
For a small customer, the reassignment will be made effective from the commencement date of the current billing period at the time of the retailer's notification of a tariff reassignment request. For medium and large customers, the reassignment will be made effective from the next billing period after the retailer’s notification.
AusNet Services may make exceptions to the above requirement at its discretion.
4.6 Closed to new entrants tariffs
AusNet Services will not assign new connections to tariffs marked as “Closed to new entrants. Only tariffs that are open will be considered for assignment. For existing sites, the assignment to a closed tariff may be allowed where the existing tariff has the same meter requirements and tariff structure as the tariff they are moving to.
4.7 Critical peak demand tariffs
AusNet Services have critical peak demand (CPD) tariffs for medium and large commercial customers. Customers that seek a reassignment to these tariffs during the 2020 year will be subjected to the tariff assignment criteria listed in the table below for the first time.
Table 4.6 - Critical peak demand tariff assignment criteria
Tariff Description Applies to
NSP56 Medium critical peak demand 160 MWh to 400 MWh > 50 kVA & > 160 MWh pa
NSP75 Large critical peak demand 400 MWh to 750 MWh > 150 kVA & < 750 MWh pa
NSP76 Large critical peak demand 750 MWh to 2000 MWh > 280 kVA & < 2 GWh pa
NSP77 Large critical peak demand 2000 MWh to 4000 MWh > 550 kVA & < 4 GWh pa
NSP78 Large critical peak demand over 4000 MWh > 850 kVA & > 4 GWh pa
NSP81 High voltage critical peak demand 6.6 kV, 11 kV & 22 kV supplies
NSP83 High voltage critical peak demand low energy use 6.6 kV, 11 kV & 22 kV supplies
NSP91 Sub transmission critical peak demand < 25 MVA & < 20 km from TS
66 kV supplies, < 25 MVA & < 20 km from TS
NSP94 Sub transmission critical peak demand > 25 MVA & < 20 km from TS
66 kV supplies, > 25 MVA & < 20 km from TS
NSP95 Sub transmission critical peak demand < 25 MVA & > 20 km from TS
66 kV supplies, < 25 MVA & > 20 km from TS
Details on the structure and operation of AusNet Services’ CPD tariffs are set out below.
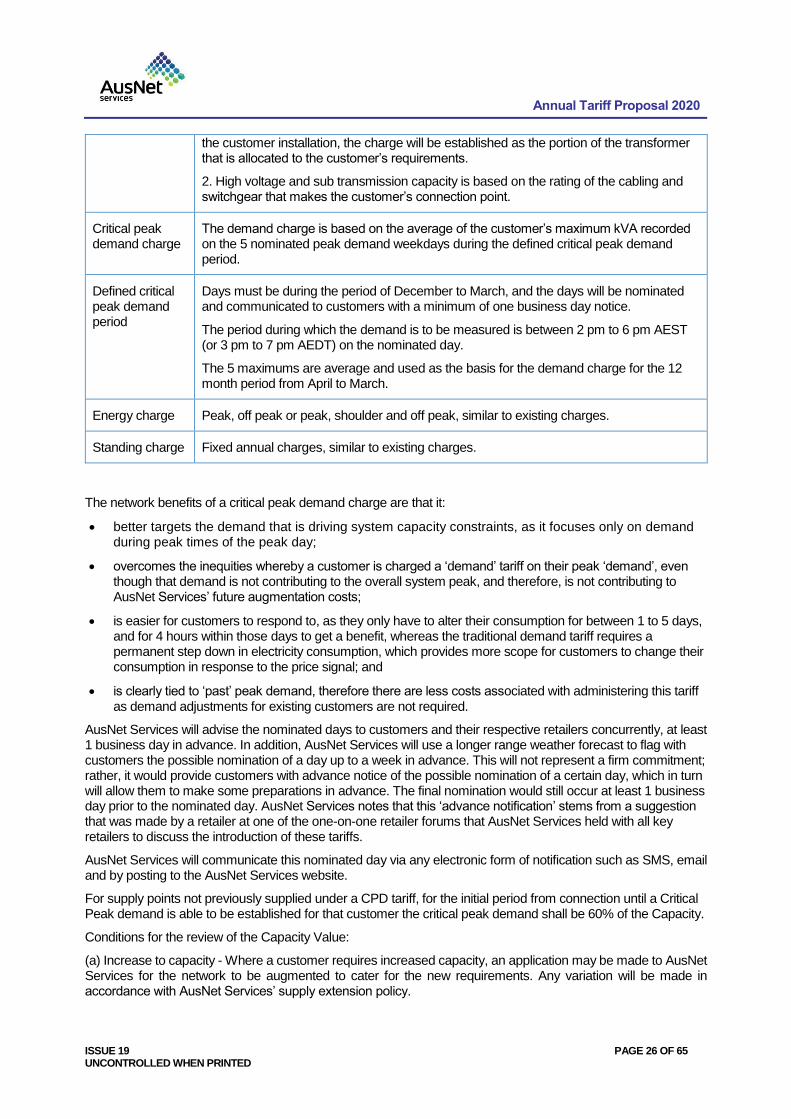
Table 4.7 – CPD structure and operation
Tariff component Description
Capacity charge 1. Low voltage capacity charges is based on the nameplate rating of the transformer supplying the customer’s installation. For sites where the transformer is not dedicated to
Annual Tariff Proposal 2020
ISSUE 19 PAGE 26 OF 65 UNCONTROLLED WHEN PRINTED
the customer installation, the charge will be established as the portion of the transformer that is allocated to the customer’s requirements.
2. High voltage and sub transmission capacity is based on the rating of the cabling and switchgear that makes the customer’s connection point.
Critical peak demand charge
The demand charge is based on the average of the customer’s maximum kVA recorded on the 5 nominated peak demand weekdays during the defined critical peak demand period.
Defined critical peak demand period
Days must be during the period of December to March, and the days will be nominated and communicated to customers with a minimum of one business day notice.
The period during which the demand is to be measured is between 2 pm to 6 pm AEST (or 3 pm to 7 pm AEDT) on the nominated day.
The 5 maximums are average and used as the basis for the demand charge for the 12 month period from April to March.
Energy charge Peak, off peak or peak, shoulder and off peak, similar to existing charges.
Standing charge Fixed annual charges, similar to existing charges.
The network benefits of a critical peak demand charge are that it:
better targets the demand that is driving system capacity constraints, as it focuses only on demand during peak times of the peak day;
overcomes the inequities whereby a customer is charged a ‘demand’ tariff on their peak ‘demand’, even though that demand is not contributing to the overall system peak, and therefore, is not contributing to AusNet Services’ future augmentation costs;
is easier for customers to respond to, as they only have to alter their consumption for between 1 to 5 days, and for 4 hours within those days to get a benefit, whereas the traditional demand tariff requires a permanent step down in electricity consumption, which provides more scope for customers to change their consumption in response to the price signal; and
is clearly tied to ‘past’ peak demand, therefore there are less costs associated with administering this tariff as demand adjustments for existing customers are not required.
AusNet Services will advise the nominated days to customers and their respective retailers concurrently, at least 1 business day in advance. In addition, AusNet Services will use a longer range weather forecast to flag with customers the possible nomination of a day up to a week in advance. This will not represent a firm commitment; rather, it would provide customers with advance notice of the possible nomination of a certain day, which in turn will allow them to make some preparations in advance. The final nomination would still occur at least 1 business day prior to the nominated day. AusNet Services notes that this ‘advance notification’ stems from a suggestion that was made by a retailer at one of the one-on-one retailer forums that AusNet Services held with all key retailers to discuss the introduction of these tariffs.
AusNet Services will communicate this nominated day via any electronic form of notification such as SMS, email and by posting to the AusNet Services website.
For supply points not previously supplied under a CPD tariff, for the initial period from connection until a Critical Peak demand is able to be established for that customer the critical peak demand shall be 60% of the Capacity.
Conditions for the review of the Capacity Value:
(a) Increase to capacity - Where a customer requires increased capacity, an application may be made to AusNet Services for the network to be augmented to cater for the new requirements. Any variation will be made in accordance with AusNet Services’ supply extension policy.

Annual Tariff Proposal 2020
ISSUE 19 PAGE 27 OF 65 UNCONTROLLED WHEN PRINTED
(b) Reduction to capacity - Capacity values are not reviewable except in circumstances where a customer’s requirement has changed significantly and the current level of capacity will no longer be required. In these circumstances the following conditions for a review will apply.
Low Voltage
1. All obligations under any previous supply extension contract have been met.
2. Agree to install load limiting devices on the customer’s main switch board in accordance with Victorian Service & Installation Rules to limit the load on the substation.
3. Allow AusNet Services to exchange the transformer with a smaller unit.
4. Allow AusNet Services to replace the transformer with a smaller unit if the existing unit is still in place at the end of its physical life.
5. If the transformer is on the customer’s premise, allow AusNet Services to take “street” circuits from the substation to supply other customers.
6. Acknowledge that if they ever require a supply upgrade to the site a customer contribution may be required (even if the transformer has not been changed).
High Voltage
1. All obligations under previous supply extension contract have been met.
2. The customer installs a Capacity control device in accordance with Victorian Service & Installation Rules Supply Protection & Supply Capacity Limitation – Guidelines Section 1.1 as follows:
a. The customers 22 kV main switch protection relay providing the following settings to trip the main switch circuit breaker:
i. MVA setting 102% of the Demand Capacity (if amps are used for the setting then the max setting in amps needs to accommodate the voltage conditions at the connection point);
ii. Time delay 10 seconds.
b. The relay settings are to be locked by the provision of a sealing facility to secure the adjustable settings by the use of distributor seals or equivalent means;
3. If the Demand Capacity is exceeded and the relay setting results in any loss of supply to the installation AusNet Services accepts no liability.
4. Any site attendance by AusNet Services will incur an appropriate approved charge.
5. Restoration to the site following an operation will depend upon the security provided at 2b above and can be undertaken by the customer or by the attendance of AusNet Services personnel.
A copy of the Victorian Service & Installation Rules can be downloaded from the following site http://www.victoriansir.org.au/.
4.8 Power factor correction
When a customer takes action in order to correct their power factor the benefits will occur in a lower CPD the following summer. This will result in lower CPD charges in following years with no need for AusNet Services to reduce demand charges in the current year.
In some circumstances where the customer is able to release the capacity for AusNet Services to supply other customers, AusNet Services may be able to give consideration to a reduction in the capacity to what is expected with the new power factor correction. This allows AusNet Services to more efficiently use the network. In these circumstances, a capacity control device might be required to be installed.
Annual Tariff Proposal 2020
ISSUE 19 PAGE 28 OF 65 UNCONTROLLED WHEN PRINTED
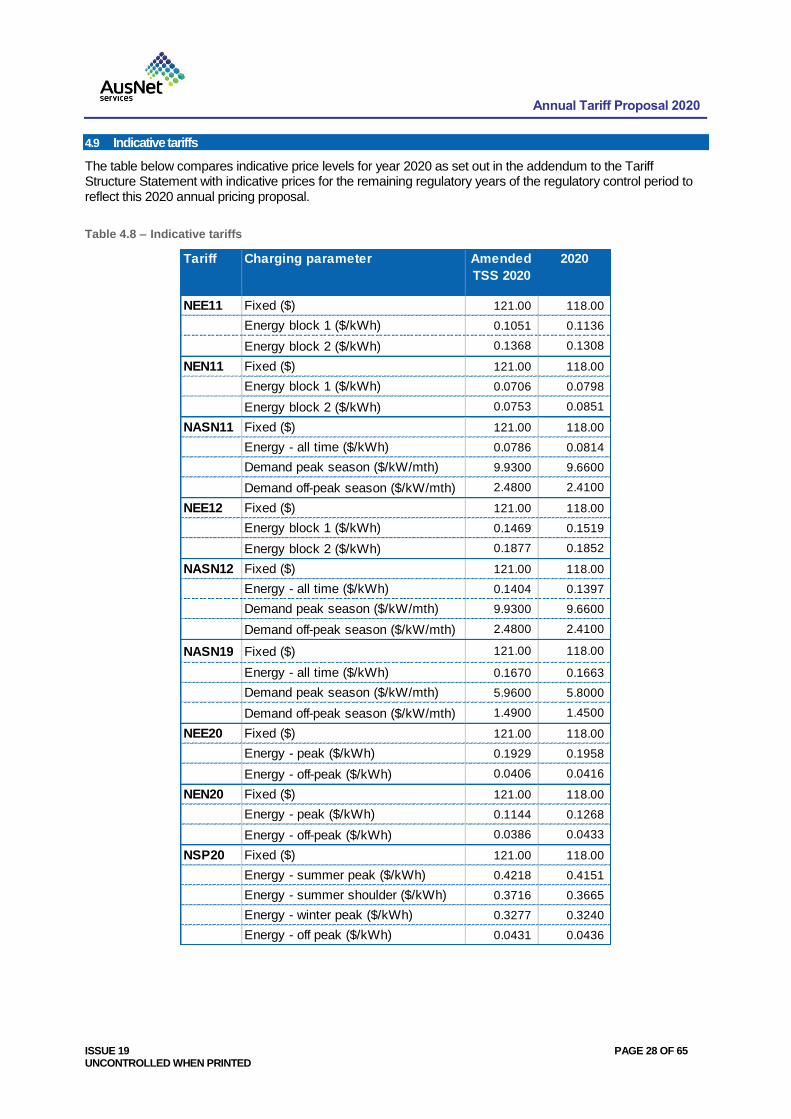
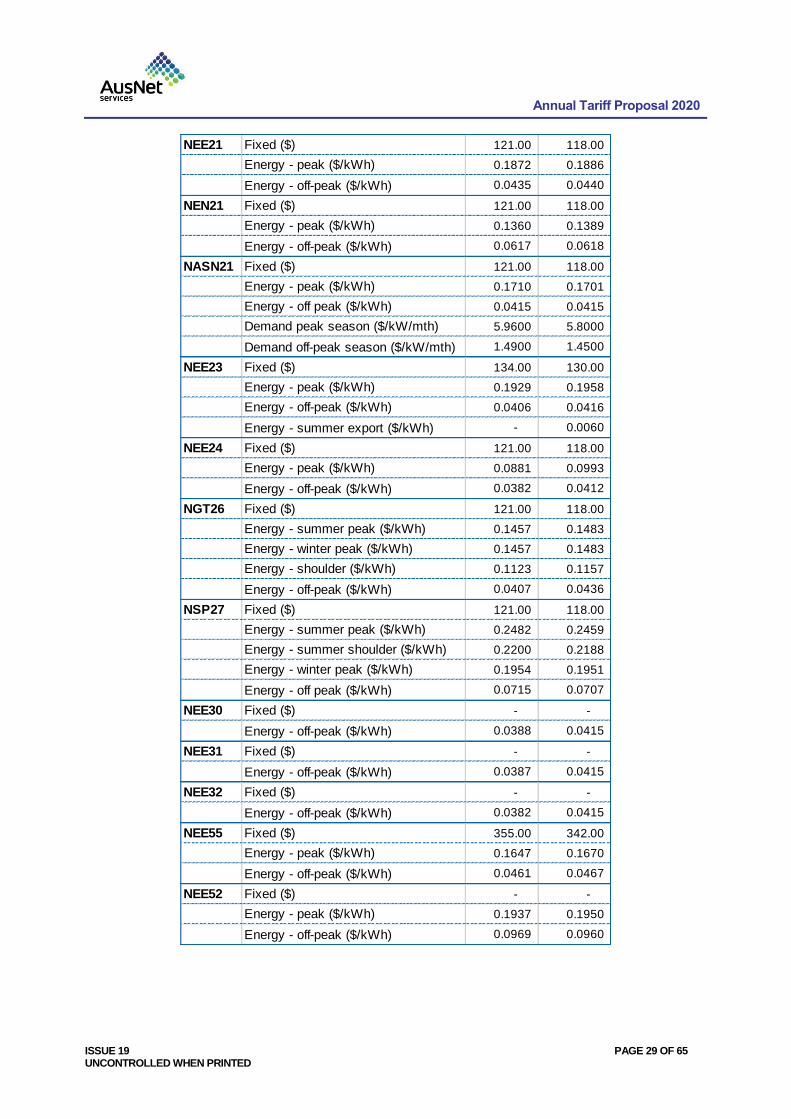
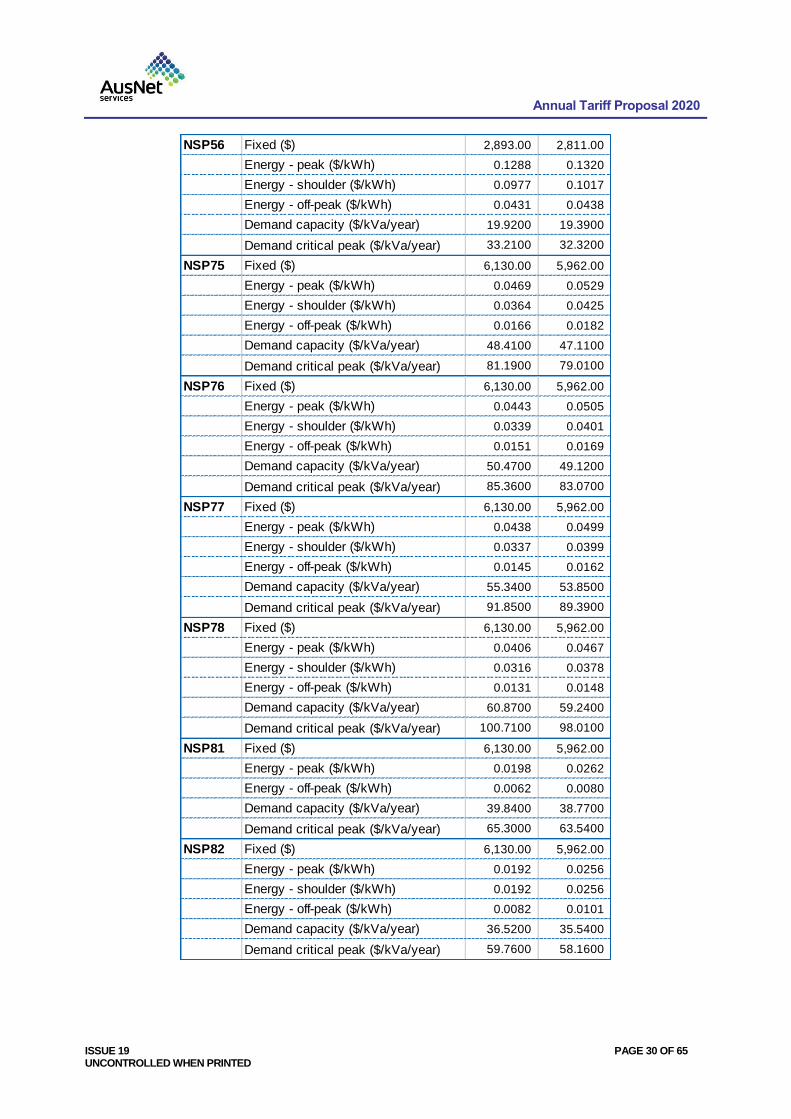
4.9 Indicative tariffs
The table below compares indicative price levels for year 2020 as set out in the addendum to the Tariff Structure Statement with indicative prices for the remaining regulatory years of the regulatory control period to reflect this 2020 annual pricing proposal.
Table 4.8 – Indicative tariffs
Tariff Charging parameter Amended
TSS 2020
2020
NEE11 Fixed ($) 121.00 118.00
Energy block 1 ($/kWh) 0.1051 0.1136
Energy block 2 ($/kWh) 0.1368 0.1308
NEN11 Fixed ($) 121.00 118.00
Energy block 1 ($/kWh) 0.0706 0.0798
Energy block 2 ($/kWh) 0.0753 0.0851
NASN11 Fixed ($) 121.00 118.00
Energy - all time ($/kWh) 0.0786 0.0814
Demand peak season ($/kW/mth) 9.9300 9.6600
Demand off-peak season ($/kW/mth) 2.4800 2.4100
NEE12 Fixed ($) 121.00 118.00
Energy block 1 ($/kWh) 0.1469 0.1519
Energy block 2 ($/kWh) 0.1877 0.1852
NASN12 Fixed ($) 121.00 118.00
Energy - all time ($/kWh) 0.1404 0.1397
Demand peak season ($/kW/mth) 9.9300 9.6600
Demand off-peak season ($/kW/mth) 2.4800 2.4100
NASN19 Fixed ($) 121.00 118.00
Energy - all time ($/kWh) 0.1670 0.1663
Demand peak season ($/kW/mth) 5.9600 5.8000
Demand off-peak season ($/kW/mth) 1.4900 1.4500
NEE20 Fixed ($) 121.00 118.00
Energy - peak ($/kWh) 0.1929 0.1958
Energy - off-peak ($/kWh) 0.0406 0.0416
NEN20 Fixed ($) 121.00 118.00
Energy - peak ($/kWh) 0.1144 0.1268
Energy - off-peak ($/kWh) 0.0386 0.0433
NSP20 Fixed ($) 121.00 118.00
Energy - summer peak ($/kWh) 0.4218 0.4151
Energy - summer shoulder ($/kWh) 0.3716 0.3665
Energy - winter peak ($/kWh) 0.3277 0.3240
Energy - off peak ($/kWh) 0.0431 0.0436
Annual Tariff Proposal 2020
ISSUE 19 PAGE 29 OF 65 UNCONTROLLED WHEN PRINTED
NEE21 Fixed ($) 121.00 118.00
Energy - peak ($/kWh) 0.1872 0.1886
Energy - off-peak ($/kWh) 0.0435 0.0440
NEN21 Fixed ($) 121.00 118.00
Energy - peak ($/kWh) 0.1360 0.1389
Energy - off-peak ($/kWh) 0.0617 0.0618
NASN21 Fixed ($) 121.00 118.00
Energy - peak ($/kWh) 0.1710 0.1701
Energy - off peak ($/kWh) 0.0415 0.0415
Demand peak season ($/kW/mth) 5.9600 5.8000
Demand off-peak season ($/kW/mth) 1.4900 1.4500
NEE23 Fixed ($) 134.00 130.00
Energy - peak ($/kWh) 0.1929 0.1958
Energy - off-peak ($/kWh) 0.0406 0.0416
Energy - summer export ($/kWh) - 0.0060
NEE24 Fixed ($) 121.00 118.00
Energy - peak ($/kWh) 0.0881 0.0993
Energy - off-peak ($/kWh) 0.0382 0.0412
NGT26 Fixed ($) 121.00 118.00
Energy - summer peak ($/kWh) 0.1457 0.1483
Energy - winter peak ($/kWh) 0.1457 0.1483
Energy - shoulder ($/kWh) 0.1123 0.1157
Energy - off-peak ($/kWh) 0.0407 0.0436
NSP27 Fixed ($) 121.00 118.00
Energy - summer peak ($/kWh) 0.2482 0.2459
Energy - summer shoulder ($/kWh) 0.2200 0.2188
Energy - winter peak ($/kWh) 0.1954 0.1951
Energy - off peak ($/kWh) 0.0715 0.0707
NEE30 Fixed ($) - -
Energy - off-peak ($/kWh) 0.0388 0.0415
NEE31 Fixed ($) - -
Energy - off-peak ($/kWh) 0.0387 0.0415
NEE32 Fixed ($) - -
Energy - off-peak ($/kWh) 0.0382 0.0415
NEE55 Fixed ($) 355.00 342.00
Energy - peak ($/kWh) 0.1647 0.1670
Energy - off-peak ($/kWh) 0.0461 0.0467
NEE52 Fixed ($) - -
Energy - peak ($/kWh) 0.1937 0.1950
Energy - off-peak ($/kWh) 0.0969 0.0960
Annual Tariff Proposal 2020
ISSUE 19 PAGE 30 OF 65 UNCONTROLLED WHEN PRINTED
NSP56 Fixed ($) 2,893.00 2,811.00
Energy - peak ($/kWh) 0.1288 0.1320
Energy - shoulder ($/kWh) 0.0977 0.1017
Energy - off-peak ($/kWh) 0.0431 0.0438
Demand capacity ($/kVa/year) 19.9200 19.3900
Demand critical peak ($/kVa/year) 33.2100 32.3200
NSP75 Fixed ($) 6,130.00 5,962.00
Energy - peak ($/kWh) 0.0469 0.0529
Energy - shoulder ($/kWh) 0.0364 0.0425
Energy - off-peak ($/kWh) 0.0166 0.0182
Demand capacity ($/kVa/year) 48.4100 47.1100
Demand critical peak ($/kVa/year) 81.1900 79.0100
NSP76 Fixed ($) 6,130.00 5,962.00
Energy - peak ($/kWh) 0.0443 0.0505
Energy - shoulder ($/kWh) 0.0339 0.0401
Energy - off-peak ($/kWh) 0.0151 0.0169
Demand capacity ($/kVa/year) 50.4700 49.1200
Demand critical peak ($/kVa/year) 85.3600 83.0700
NSP77 Fixed ($) 6,130.00 5,962.00
Energy - peak ($/kWh) 0.0438 0.0499
Energy - shoulder ($/kWh) 0.0337 0.0399
Energy - off-peak ($/kWh) 0.0145 0.0162
Demand capacity ($/kVa/year) 55.3400 53.8500
Demand critical peak ($/kVa/year) 91.8500 89.3900
NSP78 Fixed ($) 6,130.00 5,962.00
Energy - peak ($/kWh) 0.0406 0.0467
Energy - shoulder ($/kWh) 0.0316 0.0378
Energy - off-peak ($/kWh) 0.0131 0.0148
Demand capacity ($/kVa/year) 60.8700 59.2400
Demand critical peak ($/kVa/year) 100.7100 98.0100
NSP81 Fixed ($) 6,130.00 5,962.00
Energy - peak ($/kWh) 0.0198 0.0262
Energy - off-peak ($/kWh) 0.0062 0.0080
Demand capacity ($/kVa/year) 39.8400 38.7700
Demand critical peak ($/kVa/year) 65.3000 63.5400
NSP82 Fixed ($) 6,130.00 5,962.00
Energy - peak ($/kWh) 0.0192 0.0256
Energy - shoulder ($/kWh) 0.0192 0.0256
Energy - off-peak ($/kWh) 0.0082 0.0101
Demand capacity ($/kVa/year) 36.5200 35.5400
Demand critical peak ($/kVa/year) 59.7600 58.1600
Annual Tariff Proposal 2020
ISSUE 19 PAGE 31 OF 65 UNCONTROLLED WHEN PRINTED
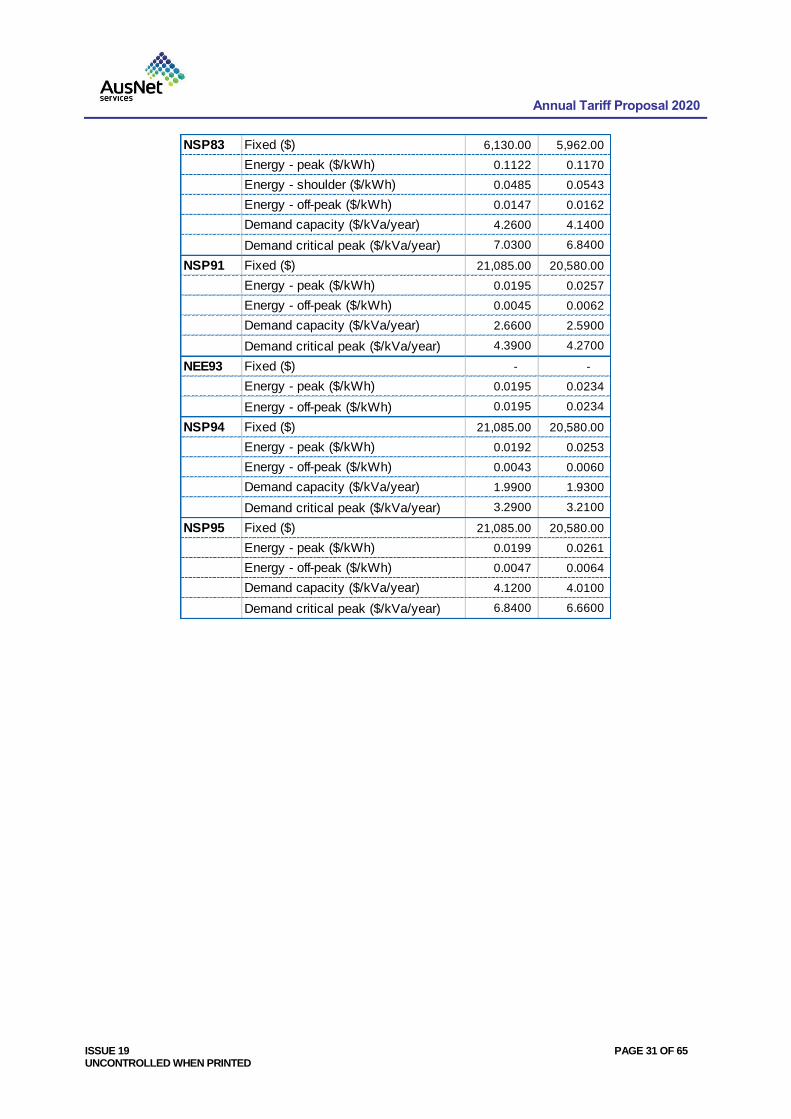
NSP83 Fixed ($) 6,130.00 5,962.00
Energy - peak ($/kWh) 0.1122 0.1170
Energy - shoulder ($/kWh) 0.0485 0.0543
Energy - off-peak ($/kWh) 0.0147 0.0162
Demand capacity ($/kVa/year) 4.2600 4.1400
Demand critical peak ($/kVa/year) 7.0300 6.8400
NSP91 Fixed ($) 21,085.00 20,580.00
Energy - peak ($/kWh) 0.0195 0.0257
Energy - off-peak ($/kWh) 0.0045 0.0062
Demand capacity ($/kVa/year) 2.6600 2.5900
Demand critical peak ($/kVa/year) 4.3900 4.2700
NEE93 Fixed ($) - -
Energy - peak ($/kWh) 0.0195 0.0234
Energy - off-peak ($/kWh) 0.0195 0.0234
NSP94 Fixed ($) 21,085.00 20,580.00
Energy - peak ($/kWh) 0.0192 0.0253
Energy - off-peak ($/kWh) 0.0043 0.0060
Demand capacity ($/kVa/year) 1.9900 1.9300
Demand critical peak ($/kVa/year) 3.2900 3.2100
NSP95 Fixed ($) 21,085.00 20,580.00
Energy - peak ($/kWh) 0.0199 0.0261
Energy - off-peak ($/kWh) 0.0047 0.0064
Demand capacity ($/kVa/year) 4.1200 4.0100
Demand critical peak ($/kVa/year) 6.8400 6.6600
Annual Tariff Proposal 2020
ISSUE 19 PAGE 32 OF 65 UNCONTROLLED WHEN PRINTED
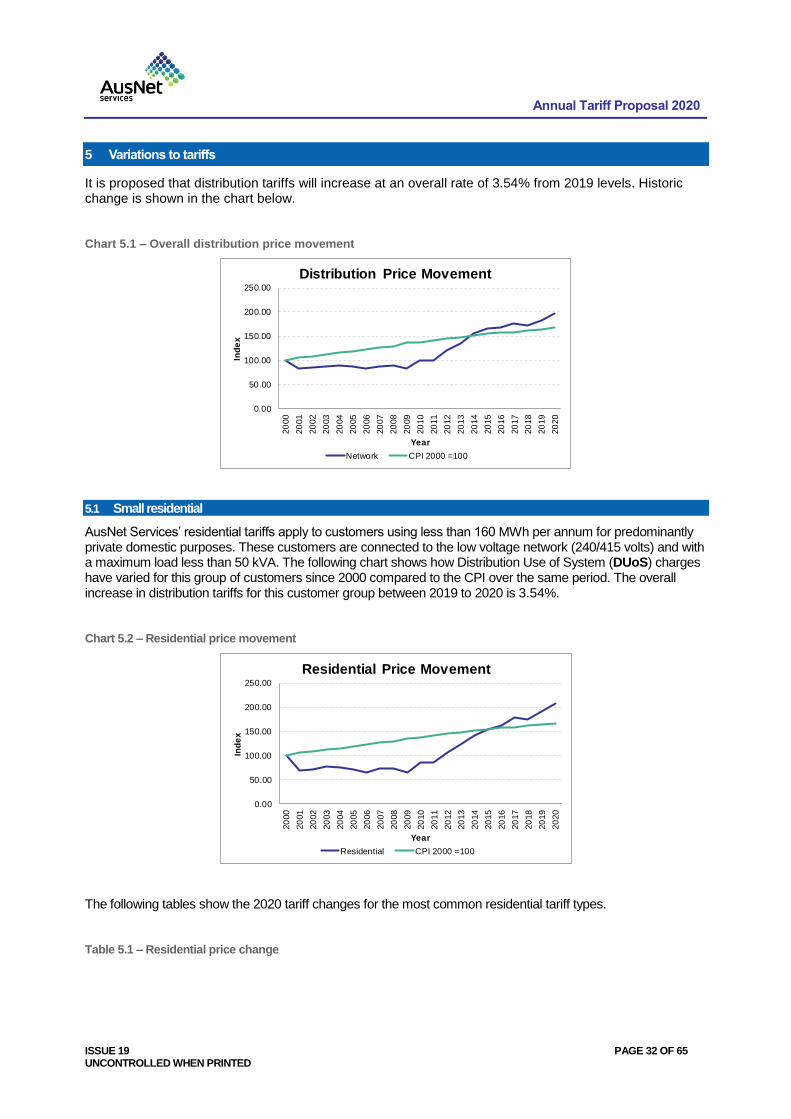
5 Variations to tariffs
It is proposed that distribution tariffs will increase at an overall rate of 3.54% from 2019 levels. Historic change is shown in the chart below.
Chart 5.1 – Overall distribution price movement
5.1 Small residential
AusNet Services’ residential tariffs apply to customers using less than 160 MWh per annum for predominantly private domestic purposes. These customers are connected to the low voltage network (240/415 volts) and with a maximum load less than 50 kVA. The following chart shows how Distribution Use of System (DUoS) charges have varied for this group of customers since 2000 compared to the CPI over the same period. The overall increase in distribution tariffs for this customer group between 2019 to 2020 is 3.54%.
Chart 5.2 – Residential price movement
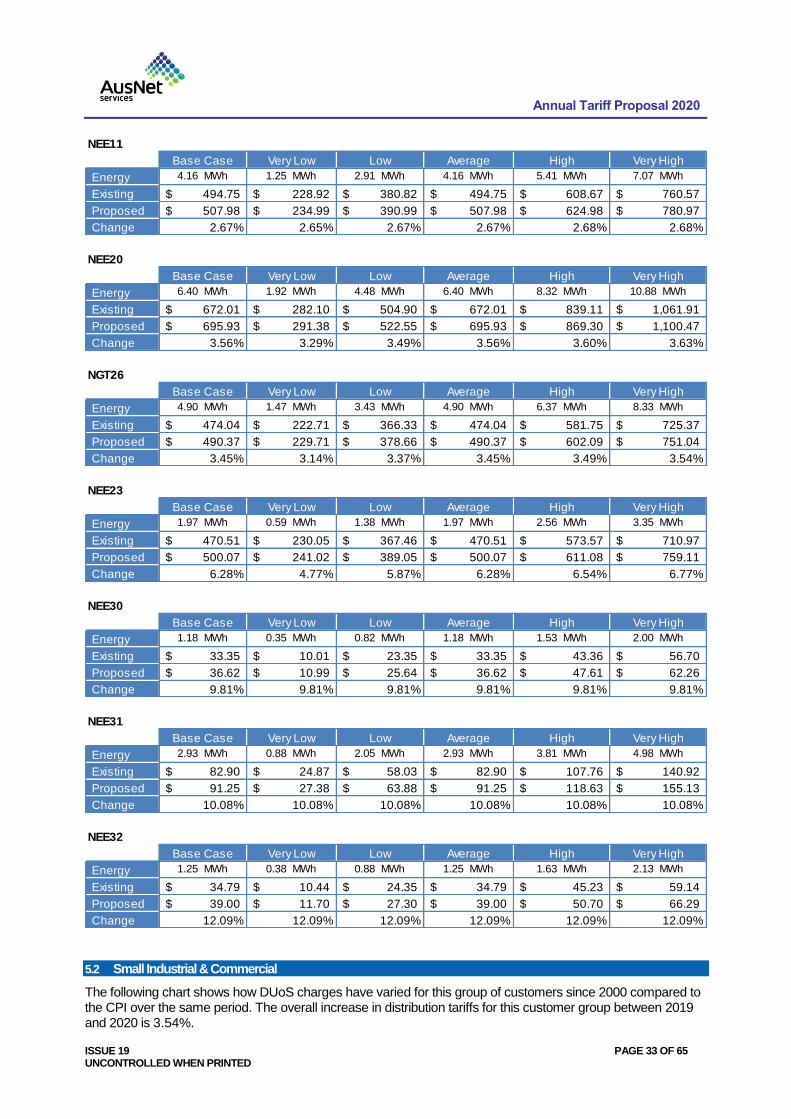
The following tables show the 2020 tariff changes for the most common residential tariff types.
Table 5.1 – Residential price change
0.00
50.00
100.00
150.00
200.00
250.0020
00
20
01
20
02
20
03
20
04
20
05
20
06
20
07
20
08
20
09
20
10
20
11
20
12
20
13
20
14
20
15
20
16
20
17
20
18
20
19
20
20
Ind
ex
Year
Distribution Price Movement
Network CPI 2000 =100
0.00
50.00
100.00
150.00
200.00
250.00
20
00
20
01
20
02
20
03
20
04
20
05
20
06
20
07
20
08
20
09
20
10
20
11
20
12
20
13
20
14
20
15
20
16
20
17
20
18
20
19
20
20
Ind
ex
Year
Residential Price Movement
Residential CPI 2000 =100
Annual Tariff Proposal 2020
ISSUE 19 PAGE 33 OF 65 UNCONTROLLED WHEN PRINTED
5.2 Small Industrial & Commercial
The following chart shows how DUoS charges have varied for this group of customers since 2000 compared to the CPI over the same period. The overall increase in distribution tariffs for this customer group between 2019 and 2020 is 3.54%.
NEE11
Base Case Very Low Low Average High Very High
Energy 4.16 MWh 1.25 MWh 2.91 MWh 4.16 MWh 5.41 MWh 7.07 MWh
Existing 494.75$ 228.92$ 380.82$ 494.75$ 608.67$ 760.57$
Proposed 507.98$ 234.99$ 390.99$ 507.98$ 624.98$ 780.97$
Change 2.67% 2.65% 2.67% 2.67% 2.68% 2.68%
NEE20
Base Case Very Low Low Average High Very High
Energy 6.40 MWh 1.92 MWh 4.48 MWh 6.40 MWh 8.32 MWh 10.88 MWh
Existing 672.01$ 282.10$ 504.90$ 672.01$ 839.11$ 1,061.91$
Proposed 695.93$ 291.38$ 522.55$ 695.93$ 869.30$ 1,100.47$
Change 3.56% 3.29% 3.49% 3.56% 3.60% 3.63%
NGT26
Base Case Very Low Low Average High Very High
Energy 4.90 MWh 1.47 MWh 3.43 MWh 4.90 MWh 6.37 MWh 8.33 MWh
Existing 474.04$ 222.71$ 366.33$ 474.04$ 581.75$ 725.37$
Proposed 490.37$ 229.71$ 378.66$ 490.37$ 602.09$ 751.04$
Change 3.45% 3.14% 3.37% 3.45% 3.49% 3.54%
NEE23
Base Case Very Low Low Average High Very High
Energy 1.97 MWh 0.59 MWh 1.38 MWh 1.97 MWh 2.56 MWh 3.35 MWh
Existing 470.51$ 230.05$ 367.46$ 470.51$ 573.57$ 710.97$
Proposed 500.07$ 241.02$ 389.05$ 500.07$ 611.08$ 759.11$
Change 6.28% 4.77% 5.87% 6.28% 6.54% 6.77%
NEE30
Base Case Very Low Low Average High Very High
Energy 1.18 MWh 0.35 MWh 0.82 MWh 1.18 MWh 1.53 MWh 2.00 MWh
Existing 33.35$ 10.01$ 23.35$ 33.35$ 43.36$ 56.70$
Proposed 36.62$ 10.99$ 25.64$ 36.62$ 47.61$ 62.26$
Change 9.81% 9.81% 9.81% 9.81% 9.81% 9.81%
NEE31
Base Case Very Low Low Average High Very High
Energy 2.93 MWh 0.88 MWh 2.05 MWh 2.93 MWh 3.81 MWh 4.98 MWh
Existing 82.90$ 24.87$ 58.03$ 82.90$ 107.76$ 140.92$
Proposed 91.25$ 27.38$ 63.88$ 91.25$ 118.63$ 155.13$
Change 10.08% 10.08% 10.08% 10.08% 10.08% 10.08%
NEE32
Base Case Very Low Low Average High Very High
Energy 1.25 MWh 0.38 MWh 0.88 MWh 1.25 MWh 1.63 MWh 2.13 MWh
Existing 34.79$ 10.44$ 24.35$ 34.79$ 45.23$ 59.14$
Proposed 39.00$ 11.70$ 27.30$ 39.00$ 50.70$ 66.29$
Change 12.09% 12.09% 12.09% 12.09% 12.09% 12.09%
Annual Tariff Proposal 2020
ISSUE 19 PAGE 34 OF 65 UNCONTROLLED WHEN PRINTED
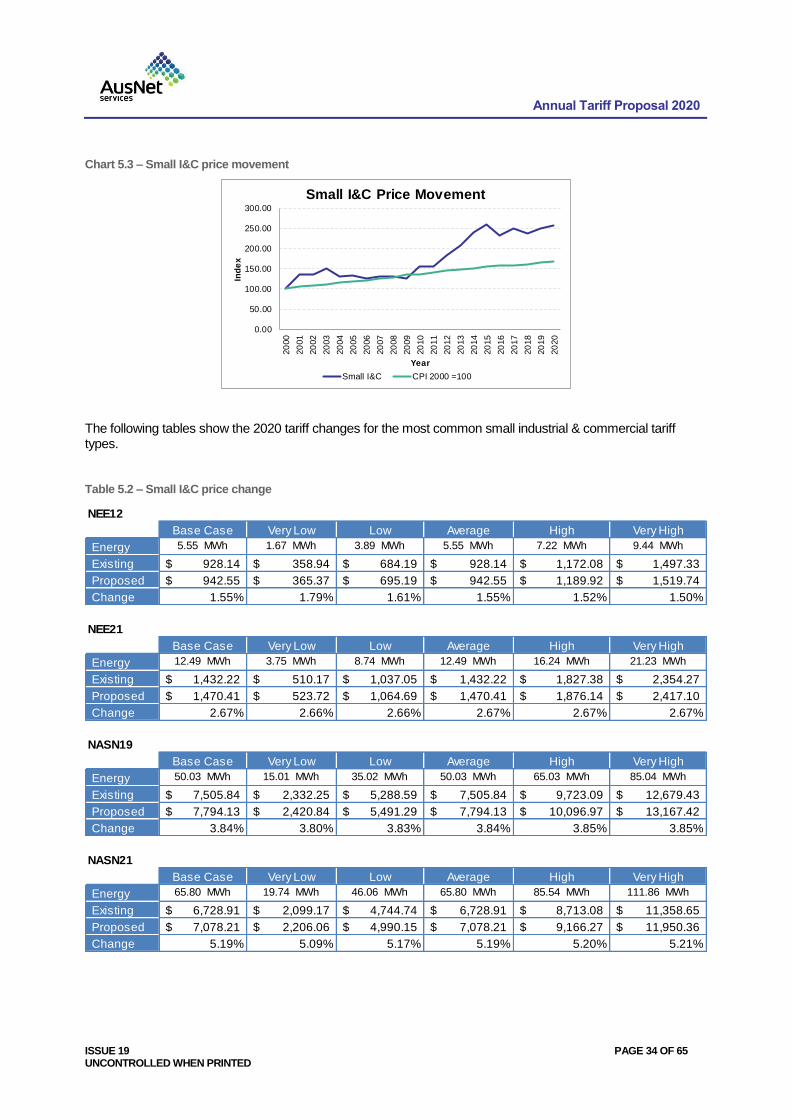
Chart 5.3 – Small I&C price movement
The following tables show the 2020 tariff changes for the most common small industrial & commercial tariff types.
Table 5.2 – Small I&C price change
0.00
50.00
100.00
150.00
200.00
250.00
300.00
20
00
20
01
20
02
20
03
20
04
20
05
20
06
20
07
20
08
20
09
20
10
20
11
20
12
20
13
20
14
20
15
20
16
20
17
20
18
20
19
20
20
Ind
ex
Year
Small I&C Price Movement
Small I&C CPI 2000 =100
NEE12
Base Case Very Low Low Average High Very High
Energy 5.55 MWh 1.67 MWh 3.89 MWh 5.55 MWh 7.22 MWh 9.44 MWh
Existing 928.14$ 358.94$ 684.19$ 928.14$ 1,172.08$ 1,497.33$
Proposed 942.55$ 365.37$ 695.19$ 942.55$ 1,189.92$ 1,519.74$
Change 1.55% 1.79% 1.61% 1.55% 1.52% 1.50%
NEE21
Base Case Very Low Low Average High Very High
Energy 12.49 MWh 3.75 MWh 8.74 MWh 12.49 MWh 16.24 MWh 21.23 MWh
Existing 1,432.22$ 510.17$ 1,037.05$ 1,432.22$ 1,827.38$ 2,354.27$
Proposed 1,470.41$ 523.72$ 1,064.69$ 1,470.41$ 1,876.14$ 2,417.10$
Change 2.67% 2.66% 2.66% 2.67% 2.67% 2.67%
NASN19
Base Case Very Low Low Average High Very High
Energy 50.03 MWh 15.01 MWh 35.02 MWh 50.03 MWh 65.03 MWh 85.04 MWh
Existing 7,505.84$ 2,332.25$ 5,288.59$ 7,505.84$ 9,723.09$ 12,679.43$
Proposed 7,794.13$ 2,420.84$ 5,491.29$ 7,794.13$ 10,096.97$ 13,167.42$
Change 3.84% 3.80% 3.83% 3.84% 3.85% 3.85%
NASN21
Base Case Very Low Low Average High Very High
Energy 65.80 MWh 19.74 MWh 46.06 MWh 65.80 MWh 85.54 MWh 111.86 MWh
Existing 6,728.91$ 2,099.17$ 4,744.74$ 6,728.91$ 8,713.08$ 11,358.65$
Proposed 7,078.21$ 2,206.06$ 4,990.15$ 7,078.21$ 9,166.27$ 11,950.36$
Change 5.19% 5.09% 5.17% 5.19% 5.20% 5.21%
Annual Tariff Proposal 2020
ISSUE 19 PAGE 35 OF 65 UNCONTROLLED WHEN PRINTED
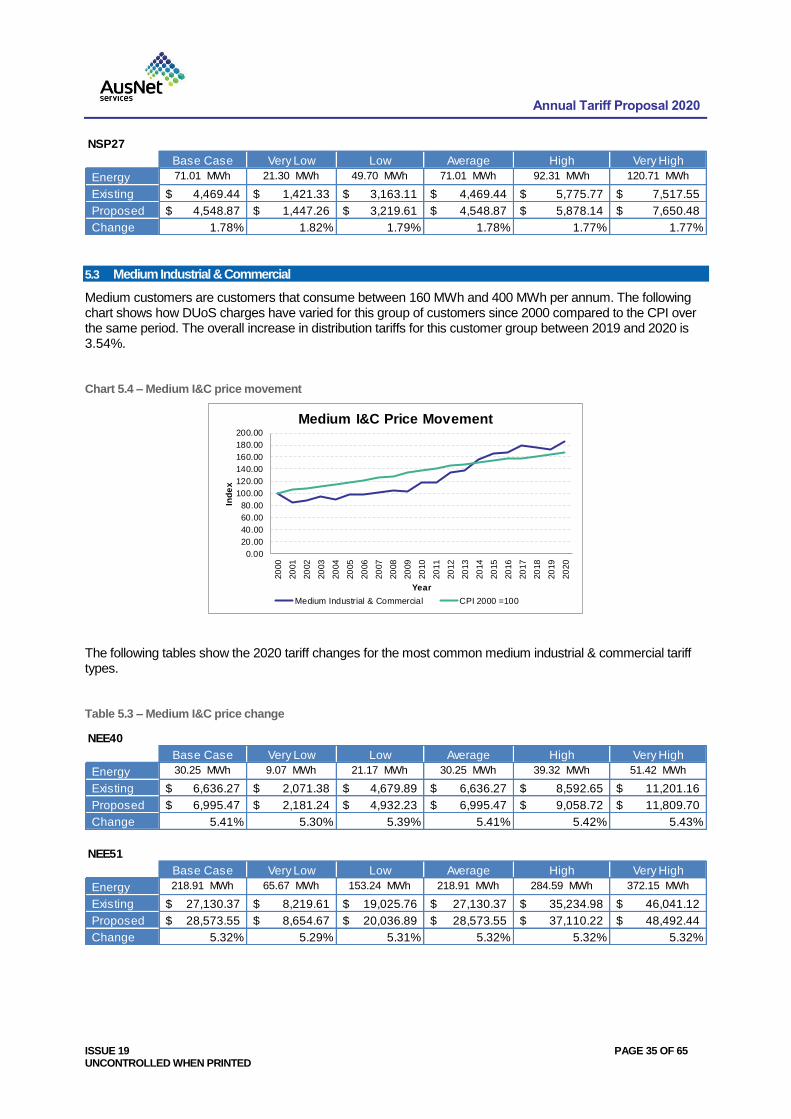
5.3 Medium Industrial & Commercial
Medium customers are customers that consume between 160 MWh and 400 MWh per annum. The following chart shows how DUoS charges have varied for this group of customers since 2000 compared to the CPI over the same period. The overall increase in distribution tariffs for this customer group between 2019 and 2020 is 3.54%.
Chart 5.4 – Medium I&C price movement
The following tables show the 2020 tariff changes for the most common medium industrial & commercial tariff types.
Table 5.3 – Medium I&C price change
NSP27
Base Case Very Low Low Average High Very High
Energy 71.01 MWh 21.30 MWh 49.70 MWh 71.01 MWh 92.31 MWh 120.71 MWh
Existing 4,469.44$ 1,421.33$ 3,163.11$ 4,469.44$ 5,775.77$ 7,517.55$
Proposed 4,548.87$ 1,447.26$ 3,219.61$ 4,548.87$ 5,878.14$ 7,650.48$
Change 1.78% 1.82% 1.79% 1.78% 1.77% 1.77%
0.00
20.00
40.00
60.00
80.00
100.00
120.00
140.00
160.00
180.00
200.00
20
00
20
01
20
02
20
03
20
04
20
05
20
06
20
07
20
08
20
09
20
10
20
11
20
12
20
13
20
14
20
15
20
16
20
17
20
18
20
19
20
20
Ind
ex
Year
Medium I&C Price Movement
Medium Industrial & Commercial CPI 2000 =100
NEE40
Base Case Very Low Low Average High Very High
Energy 30.25 MWh 9.07 MWh 21.17 MWh 30.25 MWh 39.32 MWh 51.42 MWh
Existing 6,636.27$ 2,071.38$ 4,679.89$ 6,636.27$ 8,592.65$ 11,201.16$
Proposed 6,995.47$ 2,181.24$ 4,932.23$ 6,995.47$ 9,058.72$ 11,809.70$
Change 5.41% 5.30% 5.39% 5.41% 5.42% 5.43%
NEE51
Base Case Very Low Low Average High Very High
Energy 218.91 MWh 65.67 MWh 153.24 MWh 218.91 MWh 284.59 MWh 372.15 MWh
Existing 27,130.37$ 8,219.61$ 19,025.76$ 27,130.37$ 35,234.98$ 46,041.12$
Proposed 28,573.55$ 8,654.67$ 20,036.89$ 28,573.55$ 37,110.22$ 48,492.44$
Change 5.32% 5.29% 5.31% 5.32% 5.32% 5.32%
Annual Tariff Proposal 2020
ISSUE 19 PAGE 36 OF 65 UNCONTROLLED WHEN PRINTED
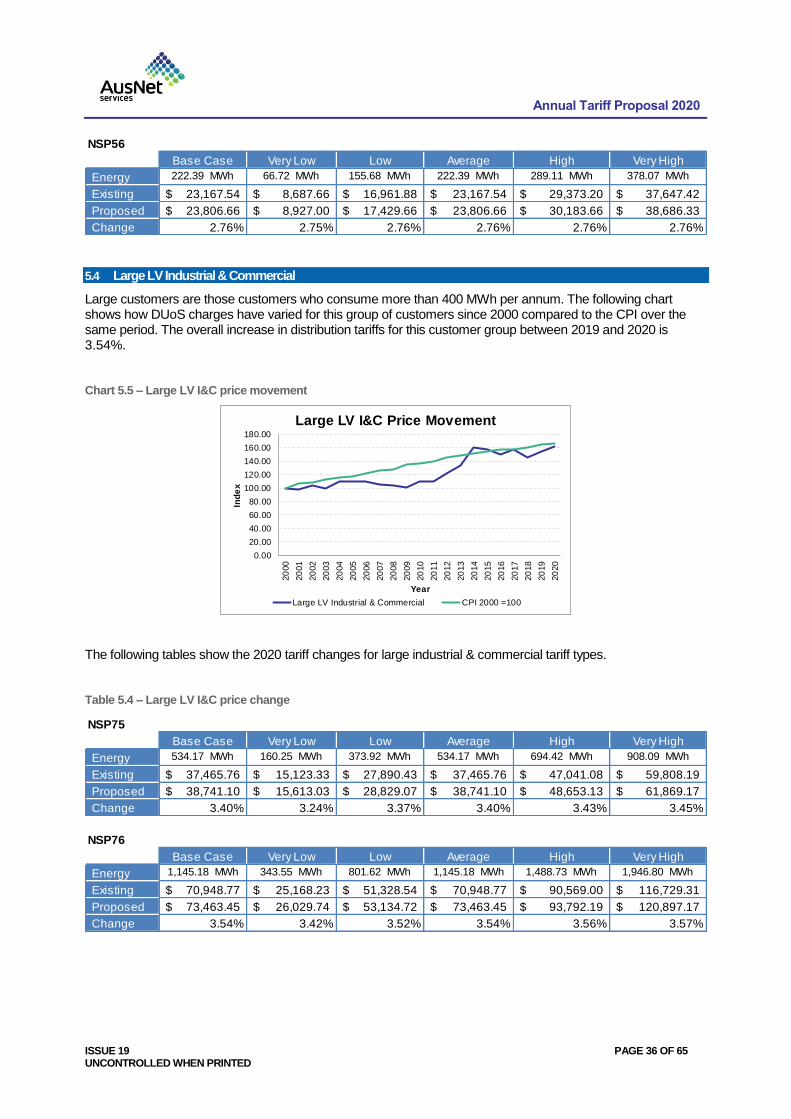
5.4 Large LV Industrial & Commercial
Large customers are those customers who consume more than 400 MWh per annum. The following chart shows how DUoS charges have varied for this group of customers since 2000 compared to the CPI over the same period. The overall increase in distribution tariffs for this customer group between 2019 and 2020 is 3.54%.
Chart 5.5 – Large LV I&C price movement
The following tables show the 2020 tariff changes for large industrial & commercial tariff types.
Table 5.4 – Large LV I&C price change
NSP56
Base Case Very Low Low Average High Very High
Energy 222.39 MWh 66.72 MWh 155.68 MWh 222.39 MWh 289.11 MWh 378.07 MWh
Existing 23,167.54$ 8,687.66$ 16,961.88$ 23,167.54$ 29,373.20$ 37,647.42$
Proposed 23,806.66$ 8,927.00$ 17,429.66$ 23,806.66$ 30,183.66$ 38,686.33$
Change 2.76% 2.75% 2.76% 2.76% 2.76% 2.76%
0.00
20.00
40.00
60.00
80.00
100.00
120.00
140.00
160.00
180.00
20
00
20
01
20
02
20
03
20
04
20
05
20
06
20
07
20
08
20
09
20
10
20
11
20
12
20
13
20
14
20
15
20
16
20
17
20
18
20
19
20
20
Ind
ex
Year
Large LV I&C Price Movement
Large LV Industrial & Commercial CPI 2000 =100
NSP75
Base Case Very Low Low Average High Very High
Energy 534.17 MWh 160.25 MWh 373.92 MWh 534.17 MWh 694.42 MWh 908.09 MWh
Existing 37,465.76$ 15,123.33$ 27,890.43$ 37,465.76$ 47,041.08$ 59,808.19$
Proposed 38,741.10$ 15,613.03$ 28,829.07$ 38,741.10$ 48,653.13$ 61,869.17$
Change 3.40% 3.24% 3.37% 3.40% 3.43% 3.45%
NSP76
Base Case Very Low Low Average High Very High
Energy 1,145.18 MWh 343.55 MWh 801.62 MWh 1,145.18 MWh 1,488.73 MWh 1,946.80 MWh
Existing 70,948.77$ 25,168.23$ 51,328.54$ 70,948.77$ 90,569.00$ 116,729.31$
Proposed 73,463.45$ 26,029.74$ 53,134.72$ 73,463.45$ 93,792.19$ 120,897.17$
Change 3.54% 3.42% 3.52% 3.54% 3.56% 3.57%
Annual Tariff Proposal 2020
ISSUE 19 PAGE 37 OF 65 UNCONTROLLED WHEN PRINTED
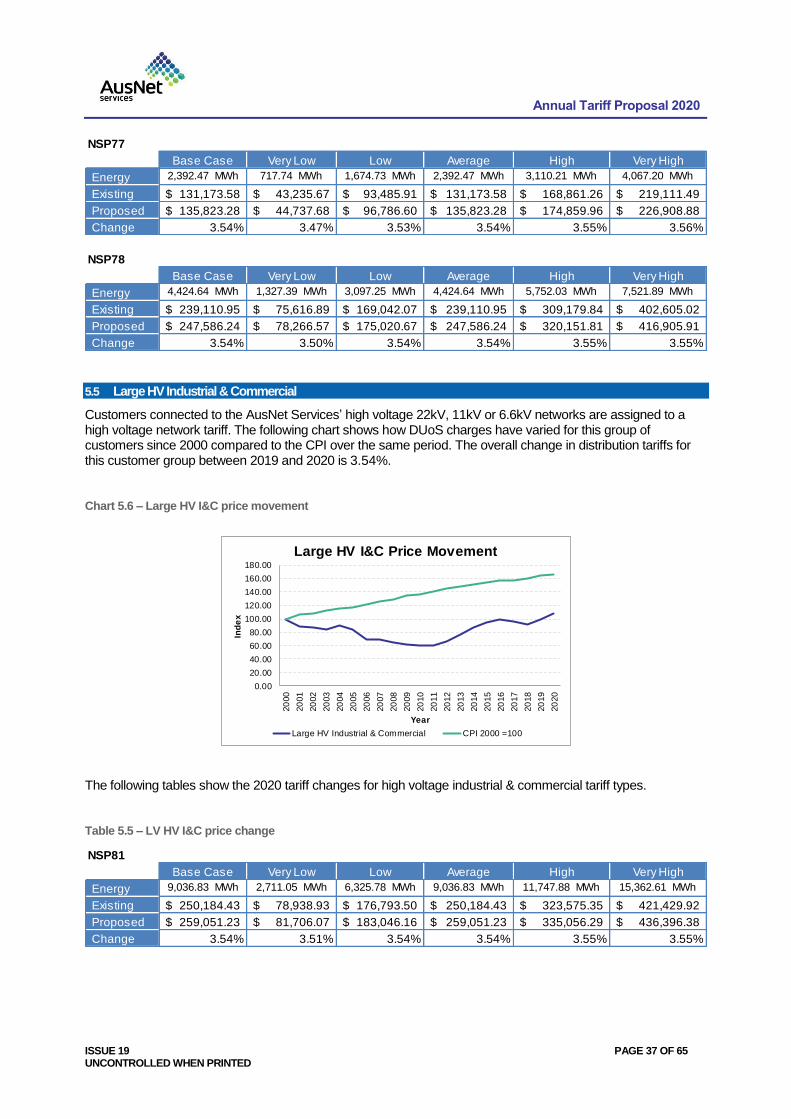
5.5 Large HV Industrial & Commercial
Customers connected to the AusNet Services’ high voltage 22kV, 11kV or 6.6kV networks are assigned to a high voltage network tariff. The following chart shows how DUoS charges have varied for this group of customers since 2000 compared to the CPI over the same period. The overall change in distribution tariffs for this customer group between 2019 and 2020 is 3.54%.
Chart 5.6 – Large HV I&C price movement
The following tables show the 2020 tariff changes for high voltage industrial & commercial tariff types.
Table 5.5 – LV HV I&C price change
NSP77
Base Case Very Low Low Average High Very High
Energy 2,392.47 MWh 717.74 MWh 1,674.73 MWh 2,392.47 MWh 3,110.21 MWh 4,067.20 MWh
Existing 131,173.58$ 43,235.67$ 93,485.91$ 131,173.58$ 168,861.26$ 219,111.49$
Proposed 135,823.28$ 44,737.68$ 96,786.60$ 135,823.28$ 174,859.96$ 226,908.88$
Change 3.54% 3.47% 3.53% 3.54% 3.55% 3.56%
NSP78
Base Case Very Low Low Average High Very High
Energy 4,424.64 MWh 1,327.39 MWh 3,097.25 MWh 4,424.64 MWh 5,752.03 MWh 7,521.89 MWh
Existing 239,110.95$ 75,616.89$ 169,042.07$ 239,110.95$ 309,179.84$ 402,605.02$
Proposed 247,586.24$ 78,266.57$ 175,020.67$ 247,586.24$ 320,151.81$ 416,905.91$
Change 3.54% 3.50% 3.54% 3.54% 3.55% 3.55%
0.00
20.00
40.00
60.00
80.00
100.00
120.00
140.00
160.00
180.00
20
00
20
01
20
02
20
03
20
04
20
05
20
06
20
07
20
08
20
09
20
10
20
11
20
12
20
13
20
14
20
15
20
16
20
17
20
18
20
19
20
20
Ind
ex
Year
Large HV I&C Price Movement
Large HV Industrial & Commercial CPI 2000 =100
NSP81
Base Case Very Low Low Average High Very High
Energy 9,036.83 MWh 2,711.05 MWh 6,325.78 MWh 9,036.83 MWh 11,747.88 MWh 15,362.61 MWh
Existing 250,184.43$ 78,938.93$ 176,793.50$ 250,184.43$ 323,575.35$ 421,429.92$
Proposed 259,051.23$ 81,706.07$ 183,046.16$ 259,051.23$ 335,056.29$ 436,396.38$
Change 3.54% 3.51% 3.54% 3.54% 3.55% 3.55%
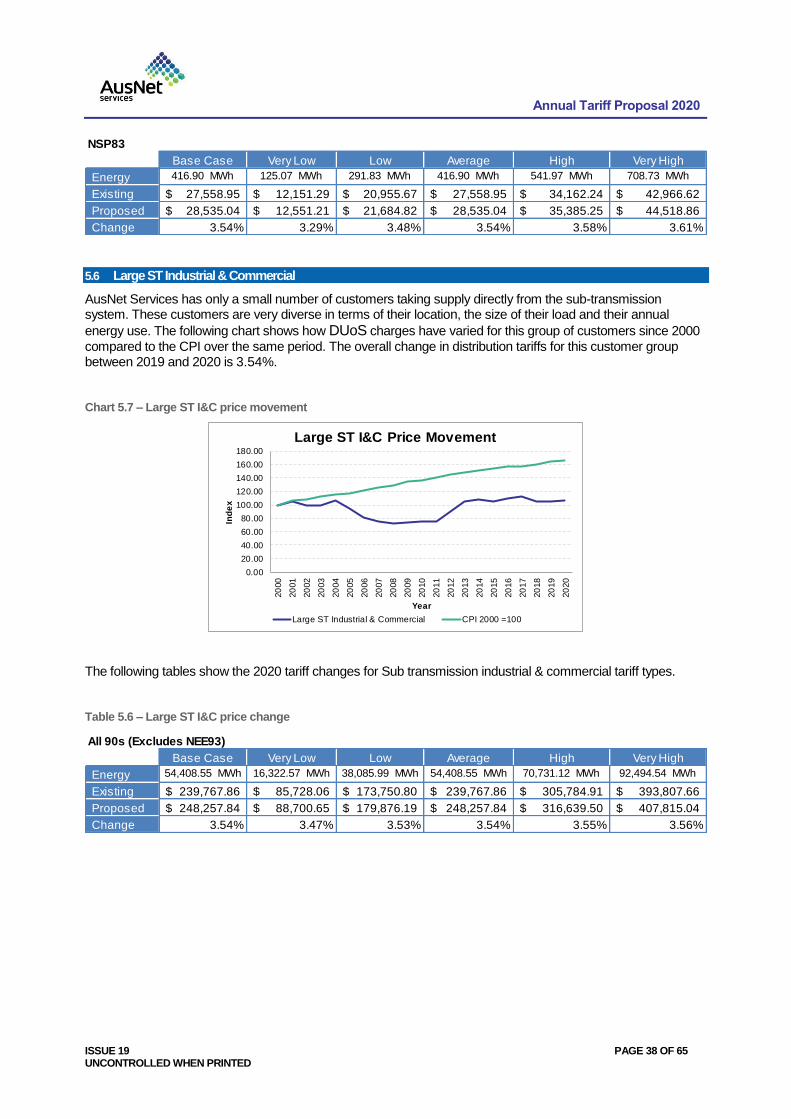
Annual Tariff Proposal 2020
ISSUE 19 PAGE 38 OF 65 UNCONTROLLED WHEN PRINTED
5.6 Large ST Industrial & Commercial
AusNet Services has only a small number of customers taking supply directly from the sub-transmission system. These customers are very diverse in terms of their location, the size of their load and their annual
energy use. The following chart shows how DUoS charges have varied for this group of customers since 2000
compared to the CPI over the same period. The overall change in distribution tariffs for this customer group between 2019 and 2020 is 3.54%.
Chart 5.7 – Large ST I&C price movement
The following tables show the 2020 tariff changes for Sub transmission industrial & commercial tariff types.
Table 5.6 – Large ST I&C price change
NSP83
Base Case Very Low Low Average High Very High
Energy 416.90 MWh 125.07 MWh 291.83 MWh 416.90 MWh 541.97 MWh 708.73 MWh
Existing 27,558.95$ 12,151.29$ 20,955.67$ 27,558.95$ 34,162.24$ 42,966.62$
Proposed 28,535.04$ 12,551.21$ 21,684.82$ 28,535.04$ 35,385.25$ 44,518.86$
Change 3.54% 3.29% 3.48% 3.54% 3.58% 3.61%
0.00
20.00
40.00
60.00
80.00
100.00
120.00
140.00
160.00
180.00
20
00
20
01
20
02
20
03
20
04
20
05
20
06
20
07
20
08
20
09
20
10
20
11
20
12
20
13
20
14
20
15
20
16
20
17
20
18
20
19
20
20
Ind
ex
Year
Large ST I&C Price Movement
Large ST Industrial & Commercial CPI 2000 =100
All 90s (Excludes NEE93)
Base Case Very Low Low Average High Very High
Energy 54,408.55 MWh 16,322.57 MWh 38,085.99 MWh 54,408.55 MWh 70,731.12 MWh 92,494.54 MWh
Existing 239,767.86$ 85,728.06$ 173,750.80$ 239,767.86$ 305,784.91$ 393,807.66$
Proposed 248,257.84$ 88,700.65$ 179,876.19$ 248,257.84$ 316,639.50$ 407,815.04$
Change 3.54% 3.47% 3.53% 3.54% 3.55% 3.56%
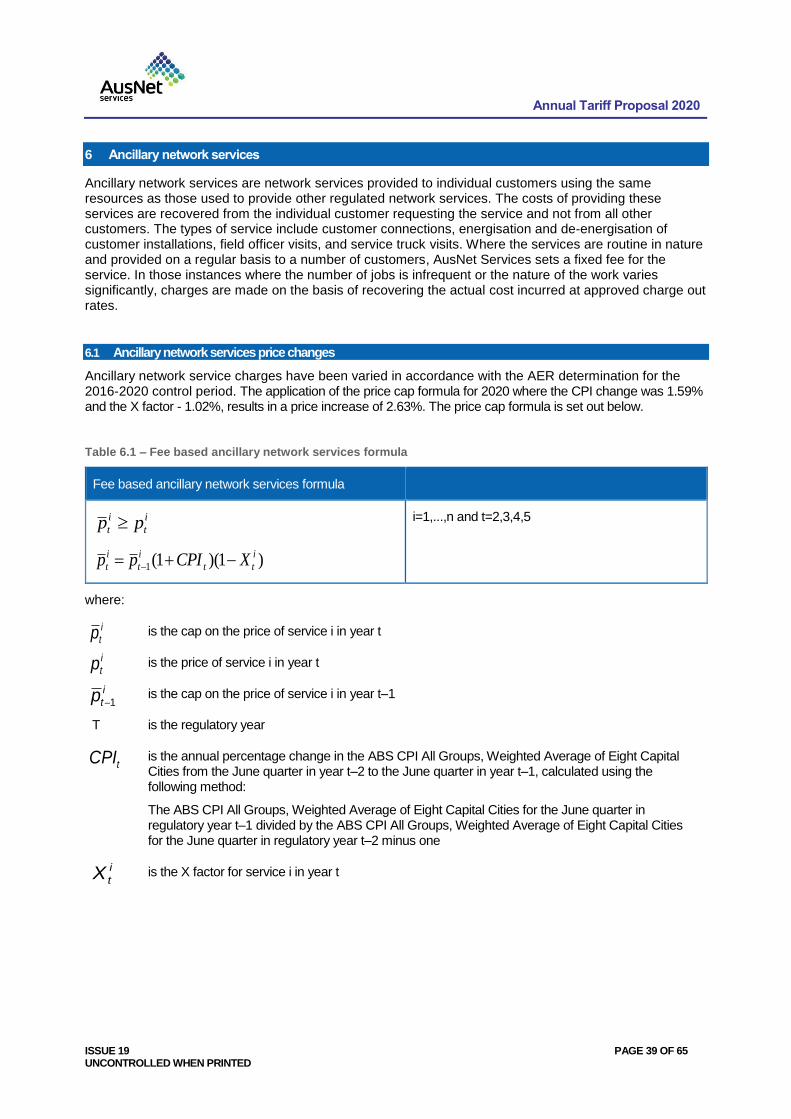
Annual Tariff Proposal 2020
ISSUE 19 PAGE 39 OF 65 UNCONTROLLED WHEN PRINTED
6 Ancillary network services
Ancillary network services are network services provided to individual customers using the same resources as those used to provide other regulated network services. The costs of providing these services are recovered from the individual customer requesting the service and not from all other customers. The types of service include customer connections, energisation and de-energisation of customer installations, field officer visits, and service truck visits. Where the services are routine in nature and provided on a regular basis to a number of customers, AusNet Services sets a fixed fee for the service. In those instances where the number of jobs is infrequent or the nature of the work varies significantly, charges are made on the basis of recovering the actual cost incurred at approved charge out rates.
6.1 Ancillary network services price changes
Ancillary network service charges have been varied in accordance with the AER determination for the 2016-2020 control period. The application of the price cap formula for 2020 where the CPI change was 1.59% and the X factor - 1.02%, results in a price increase of 2.63%. The price cap formula is set out below.
Table 6.1 – Fee based ancillary network services formula
Fee based ancillary network services formula
i
t
i
t pp
)1)(1(1
i
tt
i
t
i
t XCPIpp
i=1,...,n and t=2,3,4,5
where:
is the cap on the price of service i in year t
is the price of service i in year t
is the cap on the price of service i in year t–1
T is the regulatory year
is the annual percentage change in the ABS CPI All Groups, Weighted Average of Eight Capital Cities from the June quarter in year t–2 to the June quarter in year t–1, calculated using the following method:
The ABS CPI All Groups, Weighted Average of Eight Capital Cities for the June quarter in regulatory year t–1 divided by the ABS CPI All Groups, Weighted Average of Eight Capital Cities for the June quarter in regulatory year t–2 minus one
is the X factor for service i in year t
i
tp
i
tp
i
tp 1
tCPI
i
tX
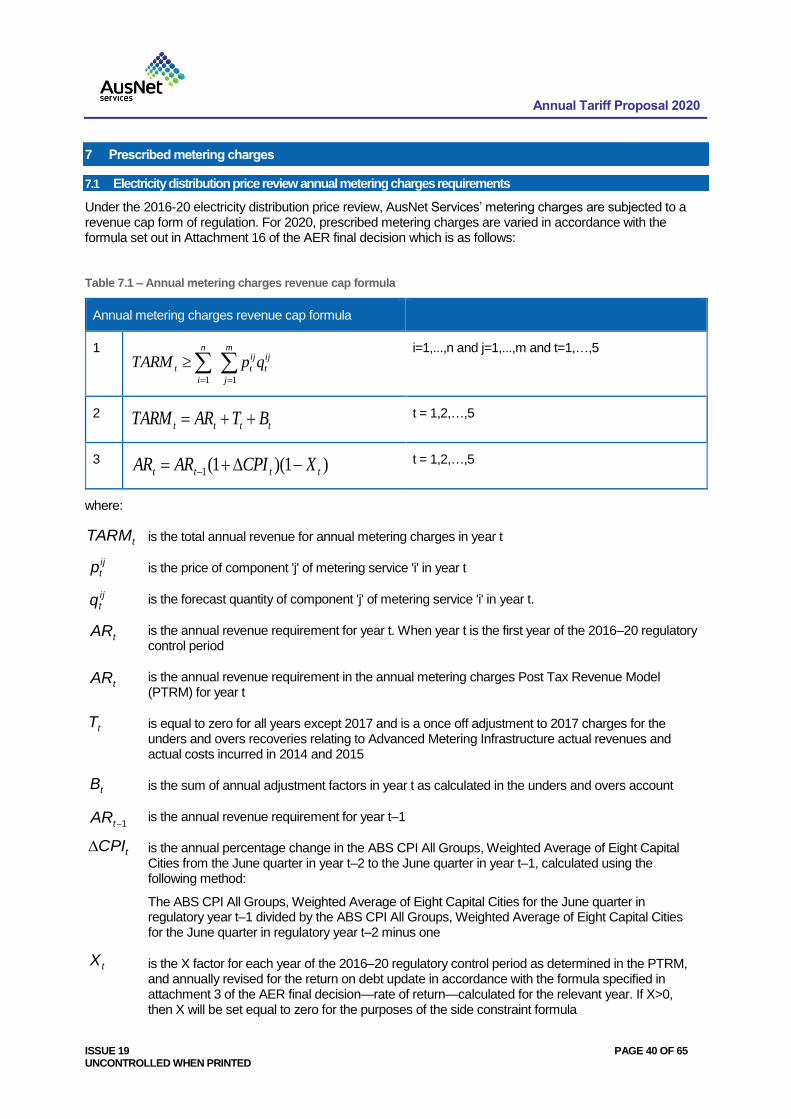
Annual Tariff Proposal 2020
ISSUE 19 PAGE 40 OF 65 UNCONTROLLED WHEN PRINTED
7 Prescribed metering charges
7.1 Electricity distribution price review annual metering charges requirements
Under the 2016-20 electricity distribution price review, AusNet Services’ metering charges are subjected to a revenue cap form of regulation. For 2020, prescribed metering charges are varied in accordance with the formula set out in Attachment 16 of the AER final decision which is as follows:
Table 7.1 – Annual metering charges revenue cap formula
Annual metering charges revenue cap formula
1 ij
t
m
j
ij
t
n
i
t qpTARM
11
i=1,...,n and j=1,...,m and t=1,…,5
2 tttt BTARTARM
t = 1,2,…,5
3 )1)(1(1 tttt XCPIARAR t = 1,2,…,5
where:
is the total annual revenue for annual metering charges in year t
is the price of component 'j' of metering service 'i' in year t
is the forecast quantity of component 'j' of metering service 'i' in year t.
is the annual revenue requirement for year t. When year t is the first year of the 2016–20 regulatory control period
is the annual revenue requirement in the annual metering charges Post Tax Revenue Model (PTRM) for year t
is equal to zero for all years except 2017 and is a once off adjustment to 2017 charges for the unders and overs recoveries relating to Advanced Metering Infrastructure actual revenues and actual costs incurred in 2014 and 2015
is the sum of annual adjustment factors in year t as calculated in the unders and overs account
is the annual revenue requirement for year t–1
is the annual percentage change in the ABS CPI All Groups, Weighted Average of Eight Capital Cities from the June quarter in year t–2 to the June quarter in year t–1, calculated using the following method:
The ABS CPI All Groups, Weighted Average of Eight Capital Cities for the June quarter in regulatory year t–1 divided by the ABS CPI All Groups, Weighted Average of Eight Capital Cities for the June quarter in regulatory year t–2 minus one
is the X factor for each year of the 2016–20 regulatory control period as determined in the PTRM, and annually revised for the return on debt update in accordance with the formula specified in attachment 3 of the AER final decision—rate of return—calculated for the relevant year. If X>0, then X will be set equal to zero for the purposes of the side constraint formula
tTARM
i j
tp
i j
tq
tAR
tAR
tT
tB
1tAR
tCPI
tX
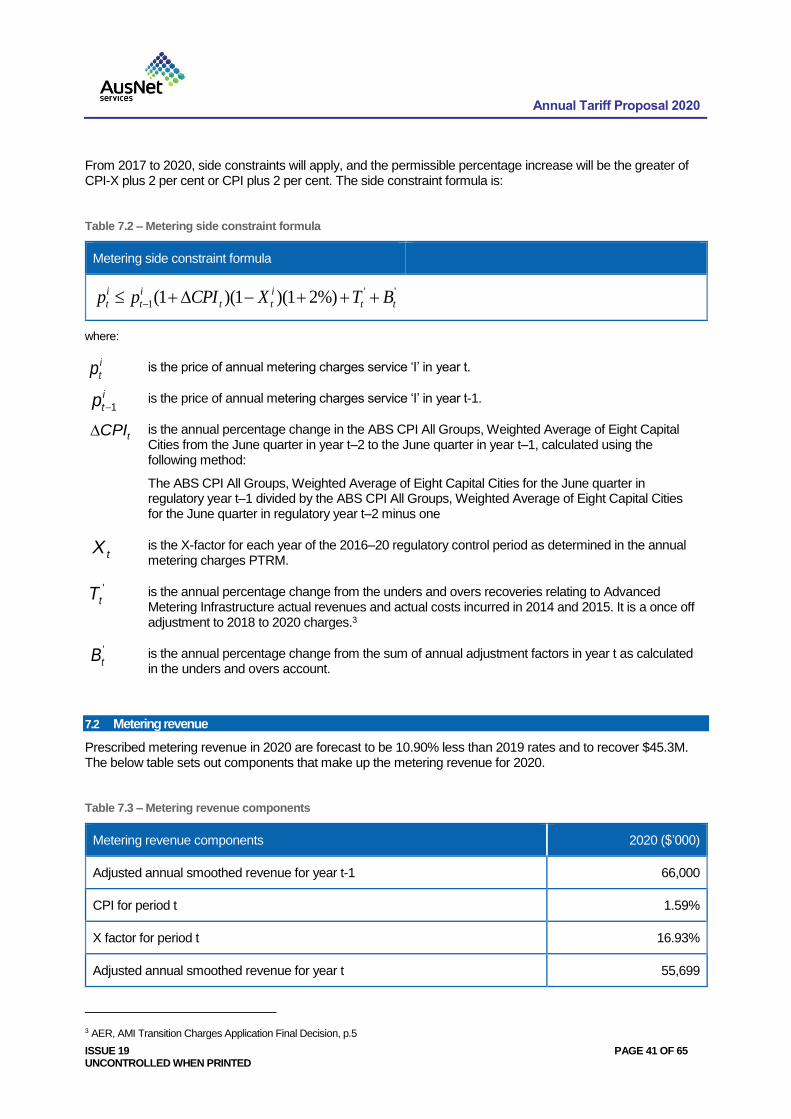
Annual Tariff Proposal 2020
ISSUE 19 PAGE 41 OF 65 UNCONTROLLED WHEN PRINTED
From 2017 to 2020, side constraints will apply, and the permissible percentage increase will be the greater of CPI-X plus 2 per cent or CPI plus 2 per cent. The side constraint formula is:
Table 7.2 – Metering side constraint formula
Metering side constraint formula
''
1 %)21)(1)(1( tt
i
tt
i
t
i
t BTXCPIpp
where:
is the price of annual metering charges service ‘I’ in year t.
is the price of annual metering charges service ‘I’ in year t-1.
is the annual percentage change in the ABS CPI All Groups, Weighted Average of Eight Capital Cities from the June quarter in year t–2 to the June quarter in year t–1, calculated using the following method:
The ABS CPI All Groups, Weighted Average of Eight Capital Cities for the June quarter in regulatory year t–1 divided by the ABS CPI All Groups, Weighted Average of Eight Capital Cities for the June quarter in regulatory year t–2 minus one
is the X-factor for each year of the 2016–20 regulatory control period as determined in the annual metering charges PTRM.
is the annual percentage change from the unders and overs recoveries relating to Advanced Metering Infrastructure actual revenues and actual costs incurred in 2014 and 2015. It is a once off adjustment to 2018 to 2020 charges.3
is the annual percentage change from the sum of annual adjustment factors in year t as calculated in the unders and overs account.
7.2 Metering revenue
Prescribed metering revenue in 2020 are forecast to be 10.90% less than 2019 rates and to recover $45.3M. The below table sets out components that make up the metering revenue for 2020.
Table 7.3 – Metering revenue components
Metering revenue components 2020 ($’000)
Adjusted annual smoothed revenue for year t-1 66,000
CPI for period t 1.59%
X factor for period t 16.93%
Adjusted annual smoothed revenue for year t 55,699
3 AER, AMI Transition Charges Application Final Decision, p.5
i
tp
tCPI
i
tp 1
tX
'
tT
'
tB
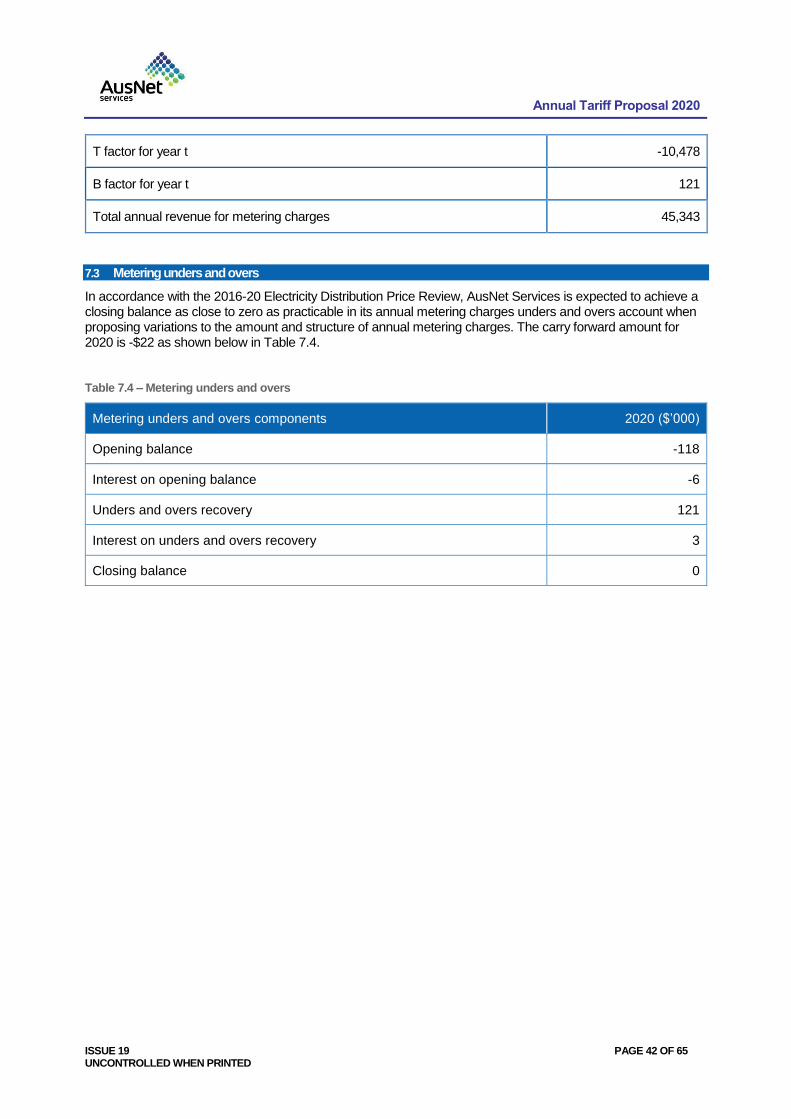
Annual Tariff Proposal 2020
ISSUE 19 PAGE 42 OF 65 UNCONTROLLED WHEN PRINTED
T factor for year t -10,478
B factor for year t 121
Total annual revenue for metering charges 45,343
7.3 Metering unders and overs
In accordance with the 2016-20 Electricity Distribution Price Review, AusNet Services is expected to achieve a closing balance as close to zero as practicable in its annual metering charges unders and overs account when proposing variations to the amount and structure of annual metering charges. The carry forward amount for 2020 is -$22 as shown below in Table 7.4.
Table 7.4 – Metering unders and overs
Metering unders and overs components 2020 ($’000)
Opening balance -118
Interest on opening balance -6
Unders and overs recovery 121
Interest on unders and overs recovery 3
Closing balance 0
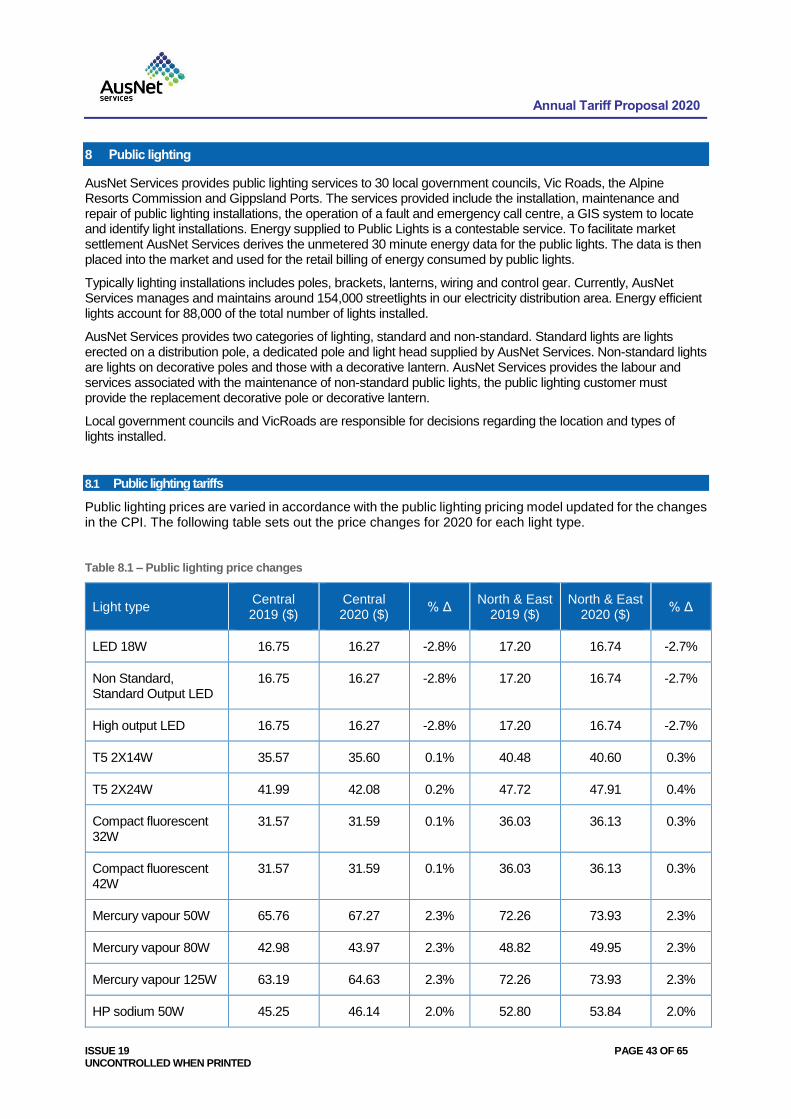
Annual Tariff Proposal 2020
ISSUE 19 PAGE 43 OF 65 UNCONTROLLED WHEN PRINTED
8 Public lighting
AusNet Services provides public lighting services to 30 local government councils, Vic Roads, the Alpine Resorts Commission and Gippsland Ports. The services provided include the installation, maintenance and repair of public lighting installations, the operation of a fault and emergency call centre, a GIS system to locate and identify light installations. Energy supplied to Public Lights is a contestable service. To facilitate market settlement AusNet Services derives the unmetered 30 minute energy data for the public lights. The data is then placed into the market and used for the retail billing of energy consumed by public lights.
Typically lighting installations includes poles, brackets, lanterns, wiring and control gear. Currently, AusNet Services manages and maintains around 154,000 streetlights in our electricity distribution area. Energy efficient lights account for 88,000 of the total number of lights installed.
AusNet Services provides two categories of lighting, standard and non-standard. Standard lights are lights erected on a distribution pole, a dedicated pole and light head supplied by AusNet Services. Non-standard lights are lights on decorative poles and those with a decorative lantern. AusNet Services provides the labour and services associated with the maintenance of non-standard public lights, the public lighting customer must provide the replacement decorative pole or decorative lantern.
Local government councils and VicRoads are responsible for decisions regarding the location and types of lights installed.
8.1 Public lighting tariffs
Public lighting prices are varied in accordance with the public lighting pricing model updated for the changes in the CPI. The following table sets out the price changes for 2020 for each light type.
Table 8.1 – Public lighting price changes
Light type Central 2019 ($)
Central 2020 ($)
% Δ North & East
2019 ($) North & East
2020 ($) % Δ
LED 18W 16.75 16.27 -2.8% 17.20 16.74 -2.7%
Non Standard, Standard Output LED
16.75 16.27 -2.8% 17.20 16.74 -2.7%
High output LED 16.75 16.27 -2.8% 17.20 16.74 -2.7%
T5 2X14W 35.57 35.60 0.1% 40.48 40.60 0.3%
T5 2X24W 41.99 42.08 0.2% 47.72 47.91 0.4%
Compact fluorescent 32W
31.57 31.59 0.1% 36.03 36.13 0.3%
Compact fluorescent 42W
31.57 31.59 0.1% 36.03 36.13 0.3%
Mercury vapour 50W 65.76 67.27 2.3% 72.26 73.93 2.3%
Mercury vapour 80W 42.98 43.97 2.3% 48.82 49.95 2.3%
Mercury vapour 125W 63.19 64.63 2.3% 72.26 73.93 2.3%
HP sodium 50W 45.25 46.14 2.0% 52.80 53.84 2.0%
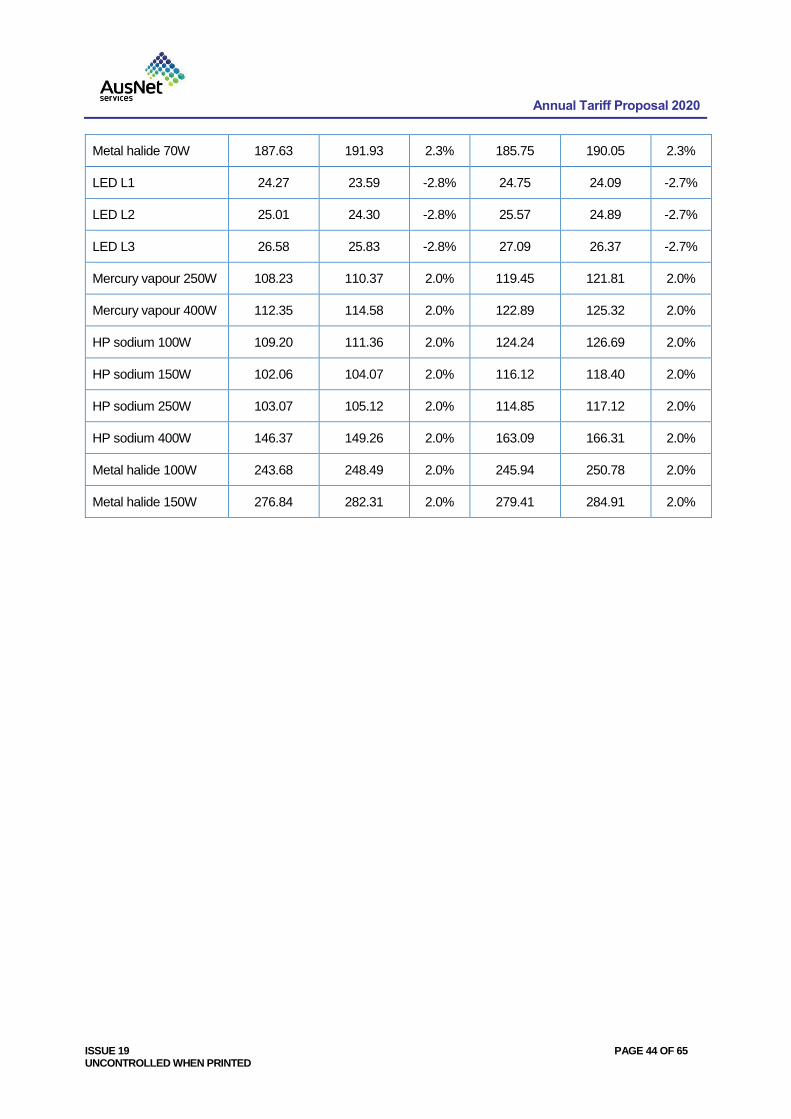
Annual Tariff Proposal 2020
ISSUE 19 PAGE 44 OF 65 UNCONTROLLED WHEN PRINTED
Metal halide 70W 187.63 191.93 2.3% 185.75 190.05 2.3%
LED L1 24.27 23.59 -2.8% 24.75 24.09 -2.7%
LED L2 25.01 24.30 -2.8% 25.57 24.89 -2.7%
LED L3 26.58 25.83 -2.8% 27.09 26.37 -2.7%
Mercury vapour 250W 108.23 110.37 2.0% 119.45 121.81 2.0%
Mercury vapour 400W 112.35 114.58 2.0% 122.89 125.32 2.0%
HP sodium 100W 109.20 111.36 2.0% 124.24 126.69 2.0%
HP sodium 150W 102.06 104.07 2.0% 116.12 118.40 2.0%
HP sodium 250W 103.07 105.12 2.0% 114.85 117.12 2.0%
HP sodium 400W 146.37 149.26 2.0% 163.09 166.31 2.0%
Metal halide 100W 243.68 248.49 2.0% 245.94 250.78 2.0%
Metal halide 150W 276.84 282.31 2.0% 279.41 284.91 2.0%
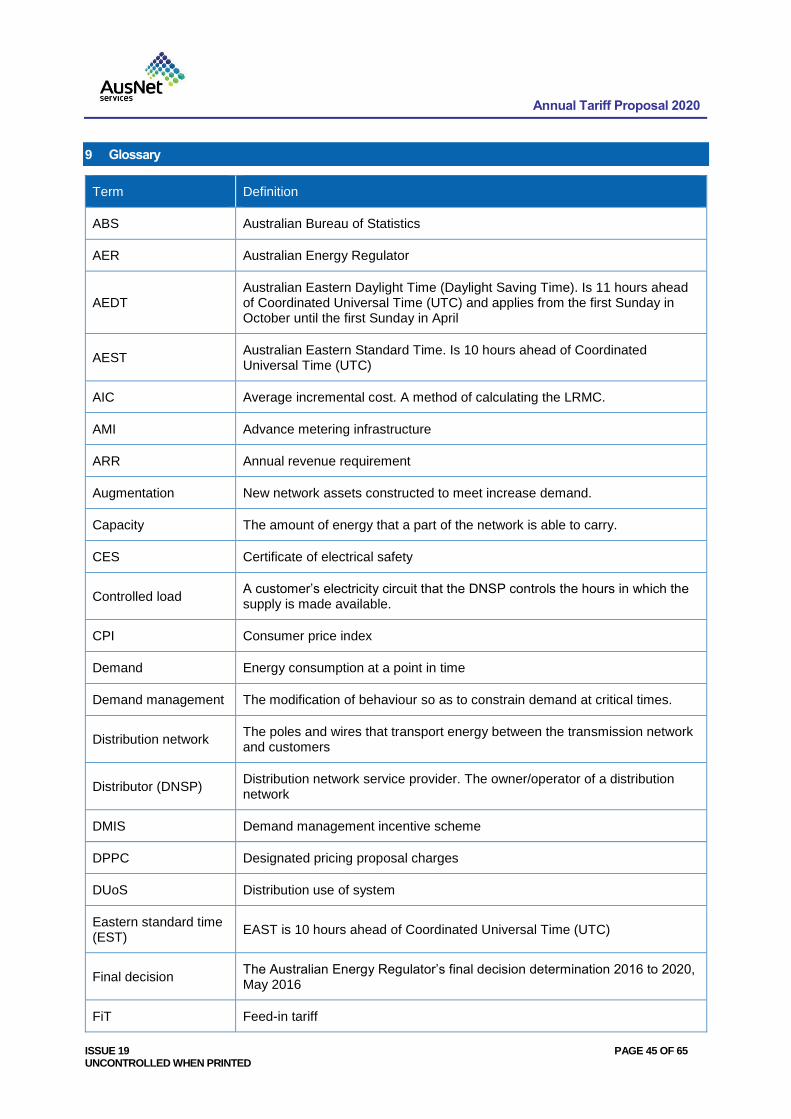
Annual Tariff Proposal 2020
ISSUE 19 PAGE 45 OF 65 UNCONTROLLED WHEN PRINTED
9 Glossary
Term Definition
ABS Australian Bureau of Statistics
AER Australian Energy Regulator
AEDT Australian Eastern Daylight Time (Daylight Saving Time). Is 11 hours ahead of Coordinated Universal Time (UTC) and applies from the first Sunday in October until the first Sunday in April
AEST Australian Eastern Standard Time. Is 10 hours ahead of Coordinated Universal Time (UTC)
AIC Average incremental cost. A method of calculating the LRMC.
AMI Advance metering infrastructure
ARR Annual revenue requirement
Augmentation New network assets constructed to meet increase demand.
Capacity The amount of energy that a part of the network is able to carry.
CES Certificate of electrical safety
Controlled load A customer’s electricity circuit that the DNSP controls the hours in which the supply is made available.
CPI Consumer price index
Demand Energy consumption at a point in time
Demand management The modification of behaviour so as to constrain demand at critical times.
Distribution network The poles and wires that transport energy between the transmission network and customers
Distributor (DNSP) Distribution network service provider. The owner/operator of a distribution network
DMIS Demand management incentive scheme
DPPC Designated pricing proposal charges
DUoS Distribution use of system
Eastern standard time (EST)
EAST is 10 hours ahead of Coordinated Universal Time (UTC)
Final decision The Australian Energy Regulator’s final decision determination 2016 to 2020, May 2016
FiT Feed-in tariff
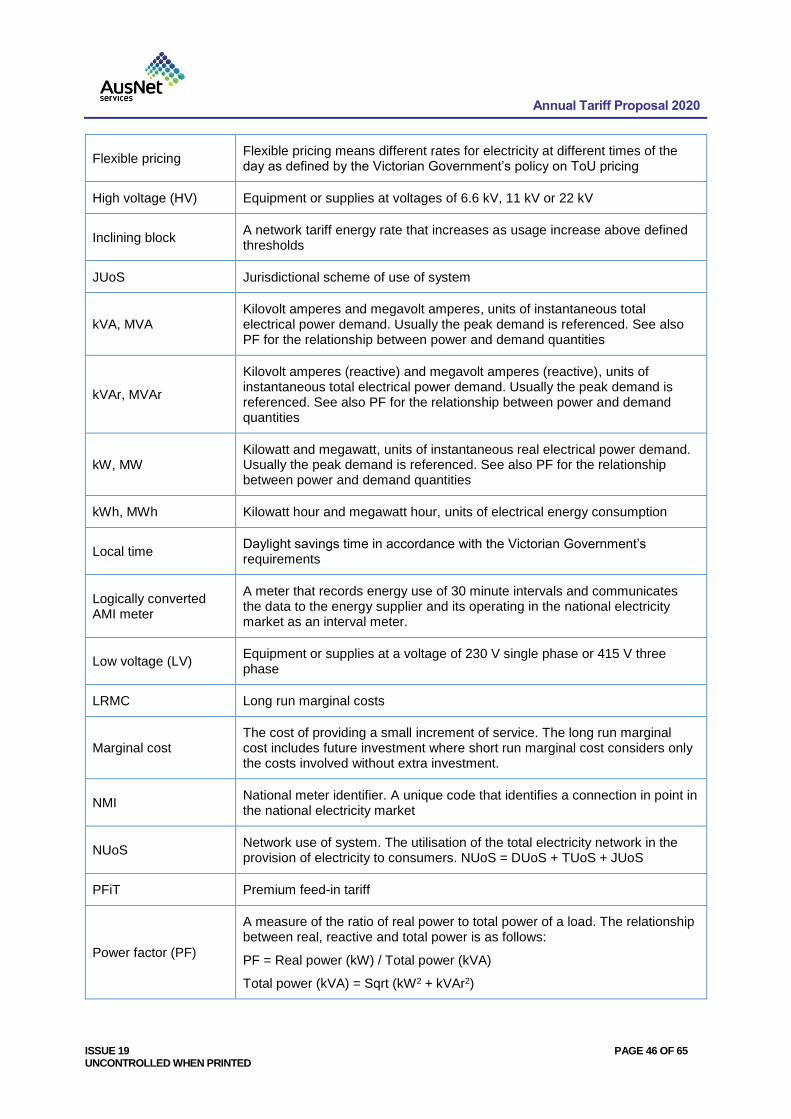
Annual Tariff Proposal 2020
ISSUE 19 PAGE 46 OF 65 UNCONTROLLED WHEN PRINTED
Flexible pricing Flexible pricing means different rates for electricity at different times of the day as defined by the Victorian Government’s policy on ToU pricing
High voltage (HV) Equipment or supplies at voltages of 6.6 kV, 11 kV or 22 kV
Inclining block A network tariff energy rate that increases as usage increase above defined thresholds
JUoS Jurisdictional scheme of use of system
kVA, MVA Kilovolt amperes and megavolt amperes, units of instantaneous total electrical power demand. Usually the peak demand is referenced. See also PF for the relationship between power and demand quantities
kVAr, MVAr
Kilovolt amperes (reactive) and megavolt amperes (reactive), units of instantaneous total electrical power demand. Usually the peak demand is referenced. See also PF for the relationship between power and demand quantities
kW, MW Kilowatt and megawatt, units of instantaneous real electrical power demand. Usually the peak demand is referenced. See also PF for the relationship between power and demand quantities
kWh, MWh Kilowatt hour and megawatt hour, units of electrical energy consumption
Local time Daylight savings time in accordance with the Victorian Government’s requirements
Logically converted AMI meter
A meter that records energy use of 30 minute intervals and communicates the data to the energy supplier and its operating in the national electricity market as an interval meter.
Low voltage (LV) Equipment or supplies at a voltage of 230 V single phase or 415 V three phase
LRMC Long run marginal costs
Marginal cost The cost of providing a small increment of service. The long run marginal cost includes future investment where short run marginal cost considers only the costs involved without extra investment.
NMI National meter identifier. A unique code that identifies a connection in point in the national electricity market
NUoS Network use of system. The utilisation of the total electricity network in the provision of electricity to consumers. NUoS = DUoS + TUoS + JUoS
PFiT Premium feed-in tariff
Power factor (PF)
A measure of the ratio of real power to total power of a load. The relationship between real, reactive and total power is as follows:
PF = Real power (kW) / Total power (kVA)
Total power (kVA) = Sqrt (kW2 + kVAr2)
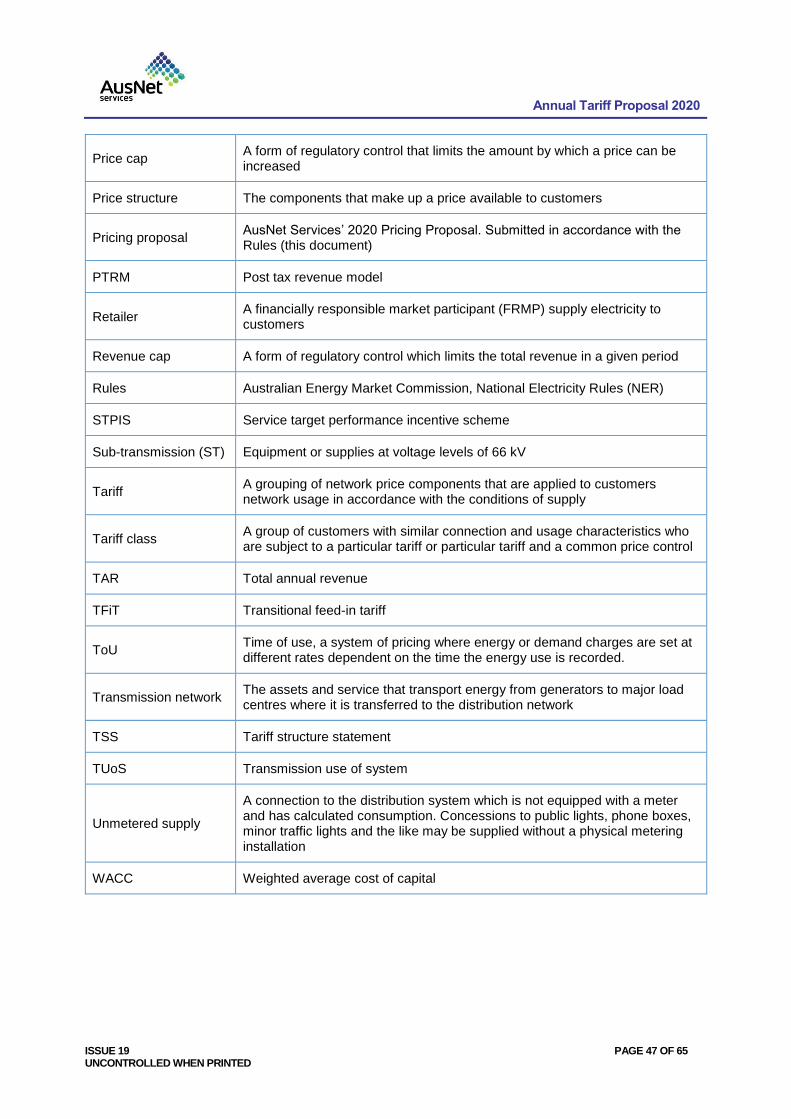
Annual Tariff Proposal 2020
ISSUE 19 PAGE 47 OF 65 UNCONTROLLED WHEN PRINTED
Price cap A form of regulatory control that limits the amount by which a price can be increased
Price structure The components that make up a price available to customers
Pricing proposal AusNet Services’ 2020 Pricing Proposal. Submitted in accordance with the Rules (this document)
PTRM Post tax revenue model
Retailer A financially responsible market participant (FRMP) supply electricity to customers
Revenue cap A form of regulatory control which limits the total revenue in a given period
Rules Australian Energy Market Commission, National Electricity Rules (NER)
STPIS Service target performance incentive scheme
Sub-transmission (ST) Equipment or supplies at voltage levels of 66 kV
Tariff A grouping of network price components that are applied to customers network usage in accordance with the conditions of supply
Tariff class A group of customers with similar connection and usage characteristics who are subject to a particular tariff or particular tariff and a common price control
TAR Total annual revenue
TFiT Transitional feed-in tariff
ToU Time of use, a system of pricing where energy or demand charges are set at different rates dependent on the time the energy use is recorded.
Transmission network The assets and service that transport energy from generators to major load centres where it is transferred to the distribution network
TSS Tariff structure statement
TUoS Transmission use of system
Unmetered supply
A connection to the distribution system which is not equipped with a meter and has calculated consumption. Concessions to public lights, phone boxes, minor traffic lights and the like may be supplied without a physical metering installation
WACC Weighted average cost of capital
Annual Tariff Proposal 2020
ISSUE 19 PAGE 48 OF 65 UNCONTROLLED WHEN PRINTED
10 Attachments
Intentionally Left Blank
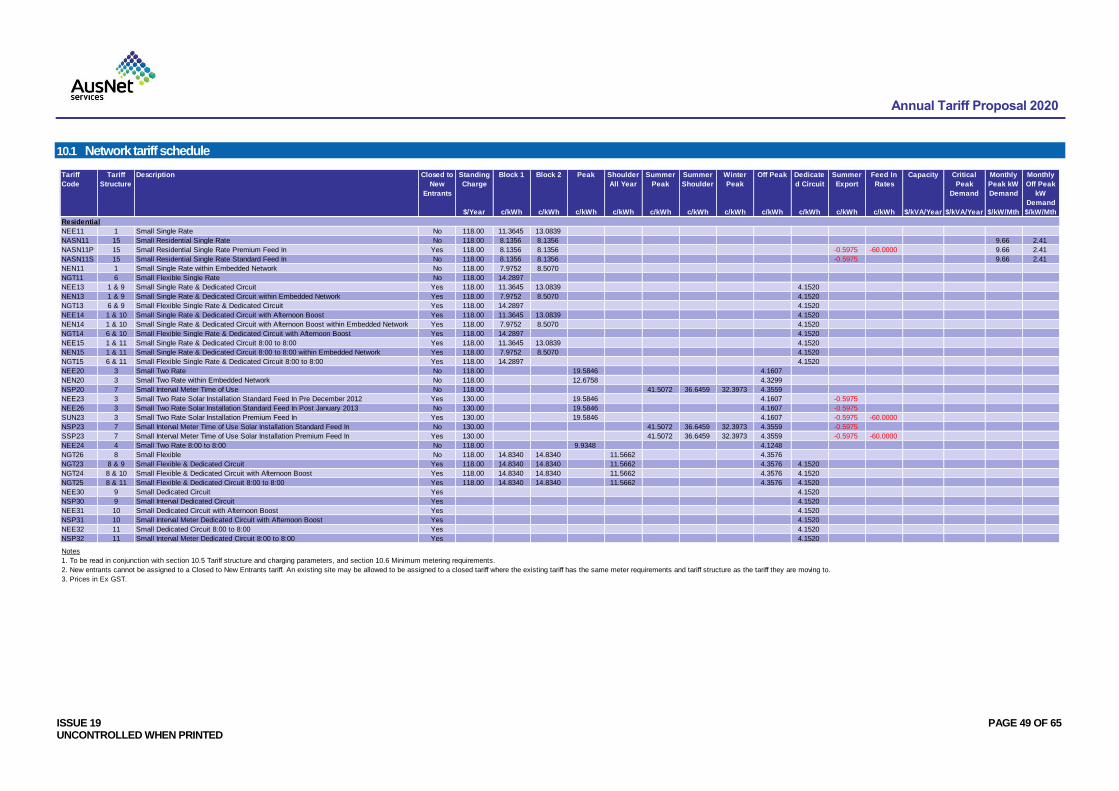
Annual Tariff Proposal 2020
ISSUE 19 PAGE 49 OF 65 UNCONTROLLED WHEN PRINTED
10.1 Network tariff schedule
Tariff
Code
Tariff
Structure
Description Closed to
New
Entrants
Standing
Charge
Block 1 Block 2 Peak Shoulder
All Year
Summer
Peak
Summer
Shoulder
Winter
Peak
Off Peak Dedicate
d Circuit
Summer
Export
Feed In
Rates
Capacity Critical
Peak
Demand
Monthly
Peak kW
Demand
Monthly
Off Peak
kW
Demand
$/Year c/kWh c/kWh c/kWh c/kWh c/kWh c/kWh c/kWh c/kWh c/kWh c/kWh c/kWh $/kVA/Year $/kVA/Year $/kW/Mth $/kW/Mth
Residential
NEE11 1 Small Single Rate No 118.00 11.3645 13.0839
NASN11 15 Small Residential Single Rate No 118.00 8.1356 8.1356 9.66 2.41
NASN11P 15 Small Residential Single Rate Premium Feed In Yes 118.00 8.1356 8.1356 -0.5975 -60.0000 9.66 2.41
NASN11S 15 Small Residential Single Rate Standard Feed In No 118.00 8.1356 8.1356 -0.5975 9.66 2.41
NEN11 1 Small Single Rate within Embedded Network No 118.00 7.9752 8.5070
NGT11 6 Small Flexible Single Rate No 118.00 14.2897
NEE13 1 & 9 Small Single Rate & Dedicated Circuit Yes 118.00 11.3645 13.0839 4.1520
NEN13 1 & 9 Small Single Rate & Dedicated Circuit within Embedded Network Yes 118.00 7.9752 8.5070 4.1520
NGT13 6 & 9 Small Flexible Single Rate & Dedicated Circuit Yes 118.00 14.2897 4.1520
NEE14 1 & 10 Small Single Rate & Dedicated Circuit with Afternoon Boost Yes 118.00 11.3645 13.0839 4.1520
NEN14 1 & 10 Small Single Rate & Dedicated Circuit with Afternoon Boost within Embedded Network Yes 118.00 7.9752 8.5070 4.1520
NGT14 6 & 10 Small Flexible Single Rate & Dedicated Circuit with Afternoon Boost Yes 118.00 14.2897 4.1520
NEE15 1 & 11 Small Single Rate & Dedicated Circuit 8:00 to 8:00 Yes 118.00 11.3645 13.0839 4.1520
NEN15 1 & 11 Small Single Rate & Dedicated Circuit 8:00 to 8:00 within Embedded Network Yes 118.00 7.9752 8.5070 4.1520
NGT15 6 & 11 Small Flexible Single Rate & Dedicated Circuit 8:00 to 8:00 Yes 118.00 14.2897 4.1520
NEE20 3 Small Two Rate No 118.00 19.5846 4.1607
NEN20 3 Small Two Rate within Embedded Network No 118.00 12.6758 4.3299
NSP20 7 Small Interval Meter Time of Use No 118.00 41.5072 36.6459 32.3973 4.3559
NEE23 3 Small Two Rate Solar Installation Standard Feed In Pre December 2012 Yes 130.00 19.5846 4.1607 -0.5975
NEE26 3 Small Two Rate Solar Installation Standard Feed In Post January 2013 No 130.00 19.5846 4.1607 -0.5975
SUN23 3 Small Two Rate Solar Installation Premium Feed In Yes 130.00 19.5846 4.1607 -0.5975 -60.0000
NSP23 7 Small Interval Meter Time of Use Solar Installation Standard Feed In No 130.00 41.5072 36.6459 32.3973 4.3559 -0.5975
SSP23 7 Small Interval Meter Time of Use Solar Installation Premium Feed In Yes 130.00 41.5072 36.6459 32.3973 4.3559 -0.5975 -60.0000
NEE24 4 Small Two Rate 8:00 to 8:00 No 118.00 9.9348 4.1248
NGT26 8 Small Flexible No 118.00 14.8340 14.8340 11.5662 4.3576
NGT23 8 & 9 Small Flexible & Dedicated Circuit Yes 118.00 14.8340 14.8340 11.5662 4.3576 4.1520
NGT24 8 & 10 Small Flexible & Dedicated Circuit with Afternoon Boost Yes 118.00 14.8340 14.8340 11.5662 4.3576 4.1520
NGT25 8 & 11 Small Flexible & Dedicated Circuit 8:00 to 8:00 Yes 118.00 14.8340 14.8340 11.5662 4.3576 4.1520
NEE30 9 Small Dedicated Circuit Yes 4.1520
NSP30 9 Small Interval Dedicated Circuit Yes 4.1520
NEE31 10 Small Dedicated Circuit with Afternoon Boost Yes 4.1520
NSP31 10 Small Interval Meter Dedicated Circuit with Afternoon Boost Yes 4.1520
NEE32 11 Small Dedicated Circuit 8:00 to 8:00 Yes 4.1520
NSP32 11 Small Interval Meter Dedicated Circuit 8:00 to 8:00 Yes 4.1520
Notes
1. To be read in conjunction with section 10.5 Tariff structure and charging parameters, and section 10.6 Minimum metering requirements.
2. New entrants cannot be assigned to a Closed to New Entrants tariff. An existing site may be allowed to be assigned to a closed tariff where the existing tariff has the same meter requirements and tariff structure as the tariff they are moving to.
3. Prices in Ex GST.
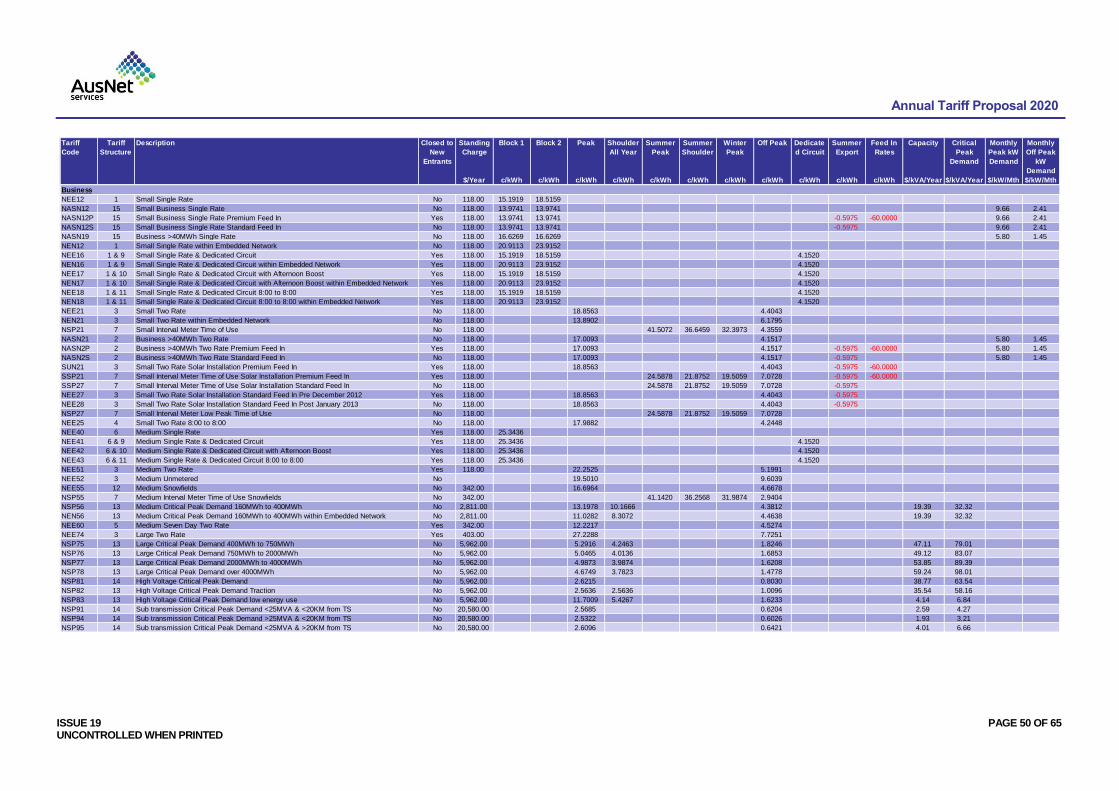
Annual Tariff Proposal 2020
ISSUE 19 PAGE 50 OF 65 UNCONTROLLED WHEN PRINTED
Tariff
Code
Tariff
Structure
Description Closed to
New
Entrants
Standing
Charge
Block 1 Block 2 Peak Shoulder
All Year
Summer
Peak
Summer
Shoulder
Winter
Peak
Off Peak Dedicate
d Circuit
Summer
Export
Feed In
Rates
Capacity Critical
Peak
Demand
Monthly
Peak kW
Demand
Monthly
Off Peak
kW
Demand
$/Year c/kWh c/kWh c/kWh c/kWh c/kWh c/kWh c/kWh c/kWh c/kWh c/kWh c/kWh $/kVA/Year $/kVA/Year $/kW/Mth $/kW/Mth
Business
NEE12 1 Small Single Rate No 118.00 15.1919 18.5159
NASN12 15 Small Business Single Rate No 118.00 13.9741 13.9741 9.66 2.41
NASN12P 15 Small Business Single Rate Premium Feed In Yes 118.00 13.9741 13.9741 -0.5975 -60.0000 9.66 2.41
NASN12S 15 Small Business Single Rate Standard Feed In No 118.00 13.9741 13.9741 -0.5975 9.66 2.41
NASN19 15 Business >40MWh Single Rate No 118.00 16.6269 16.6269 5.80 1.45
NEN12 1 Small Single Rate within Embedded Network No 118.00 20.9113 23.9152
NEE16 1 & 9 Small Single Rate & Dedicated Circuit Yes 118.00 15.1919 18.5159 4.1520
NEN16 1 & 9 Small Single Rate & Dedicated Circuit within Embedded Network Yes 118.00 20.9113 23.9152 4.1520
NEE17 1 & 10 Small Single Rate & Dedicated Circuit with Afternoon Boost Yes 118.00 15.1919 18.5159 4.1520
NEN17 1 & 10 Small Single Rate & Dedicated Circuit with Afternoon Boost within Embedded Network Yes 118.00 20.9113 23.9152 4.1520
NEE18 1 & 11 Small Single Rate & Dedicated Circuit 8:00 to 8:00 Yes 118.00 15.1919 18.5159 4.1520
NEN18 1 & 11 Small Single Rate & Dedicated Circuit 8:00 to 8:00 within Embedded Network Yes 118.00 20.9113 23.9152 4.1520
NEE21 3 Small Two Rate No 118.00 18.8563 4.4043
NEN21 3 Small Two Rate within Embedded Network No 118.00 13.8902 6.1795
NSP21 7 Small Interval Meter Time of Use No 118.00 41.5072 36.6459 32.3973 4.3559
NASN21 2 Business >40MWh Two Rate No 118.00 17.0093 4.1517 5.80 1.45
NASN2P 2 Business >40MWh Two Rate Premium Feed In Yes 118.00 17.0093 4.1517 -0.5975 -60.0000 5.80 1.45
NASN2S 2 Business >40MWh Two Rate Standard Feed In No 118.00 17.0093 4.1517 -0.5975 5.80 1.45
SUN21 3 Small Two Rate Solar Installation Premium Feed In Yes 118.00 18.8563 4.4043 -0.5975 -60.0000
SSP21 7 Small Interval Meter Time of Use Solar Installation Premium Feed In Yes 118.00 24.5878 21.8752 19.5059 7.0728 -0.5975 -60.0000
SSP27 7 Small Interval Meter Time of Use Solar Installation Standard Feed In No 118.00 24.5878 21.8752 19.5059 7.0728 -0.5975
NEE27 3 Small Two Rate Solar Installation Standard Feed In Pre December 2012 Yes 118.00 18.8563 4.4043 -0.5975
NEE28 3 Small Two Rate Solar Installation Standard Feed In Post January 2013 No 118.00 18.8563 4.4043 -0.5975
NSP27 7 Small Interval Meter Low Peak Time of Use No 118.00 24.5878 21.8752 19.5059 7.0728
NEE25 4 Small Two Rate 8:00 to 8:00 No 118.00 17.9882 4.2448
NEE40 6 Medium Single Rate Yes 118.00 25.3436
NEE41 6 & 9 Medium Single Rate & Dedicated Circuit Yes 118.00 25.3436 4.1520
NEE42 6 & 10 Medium Single Rate & Dedicated Circuit with Afternoon Boost Yes 118.00 25.3436 4.1520
NEE43 6 & 11 Medium Single Rate & Dedicated Circuit 8:00 to 8:00 Yes 118.00 25.3436 4.1520
NEE51 3 Medium Two Rate Yes 118.00 22.2525 5.1991
NEE52 3 Medium Unmetered No 19.5010 9.6039
NEE55 12 Medium Snowfields No 342.00 16.6964 4.6678
NSP55 7 Medium Interval Meter Time of Use Snowfields No 342.00 41.1420 36.2568 31.9874 2.9404
NSP56 13 Medium Critical Peak Demand 160MWh to 400MWh No 2,811.00 13.1978 10.1666 4.3812 19.39 32.32
NEN56 13 Medium Critical Peak Demand 160MWh to 400MWh within Embedded Network No 2,811.00 11.0282 8.3072 4.4638 19.39 32.32
NEE60 5 Medium Seven Day Two Rate Yes 342.00 12.2217 4.5274
NEE74 3 Large Two Rate Yes 403.00 27.2288 7.7251
NSP75 13 Large Critical Peak Demand 400MWh to 750MWh No 5,962.00 5.2916 4.2463 1.8246 47.11 79.01
NSP76 13 Large Critical Peak Demand 750MWh to 2000MWh No 5,962.00 5.0465 4.0136 1.6853 49.12 83.07
NSP77 13 Large Critical Peak Demand 2000MWh to 4000MWh No 5,962.00 4.9873 3.9874 1.6208 53.85 89.39
NSP78 13 Large Critical Peak Demand over 4000MWh No 5,962.00 4.6749 3.7823 1.4778 59.24 98.01
NSP81 14 High Voltage Critical Peak Demand No 5,962.00 2.6215 0.8030 38.77 63.54
NSP82 13 High Voltage Critical Peak Demand Traction No 5,962.00 2.5636 2.5636 1.0096 35.54 58.16
NSP83 13 High Voltage Critical Peak Demand low energy use No 5,962.00 11.7009 5.4267 1.6233 4.14 6.84
NSP91 14 Sub transmission Critical Peak Demand <25MVA & <20KM from TS No 20,580.00 2.5685 0.6204 2.59 4.27
NSP94 14 Sub transmission Critical Peak Demand >25MVA & <20KM from TS No 20,580.00 2.5322 0.6026 1.93 3.21
NSP95 14 Sub transmission Critical Peak Demand <25MVA & >20KM from TS No 20,580.00 2.6096 0.6421 4.01 6.66
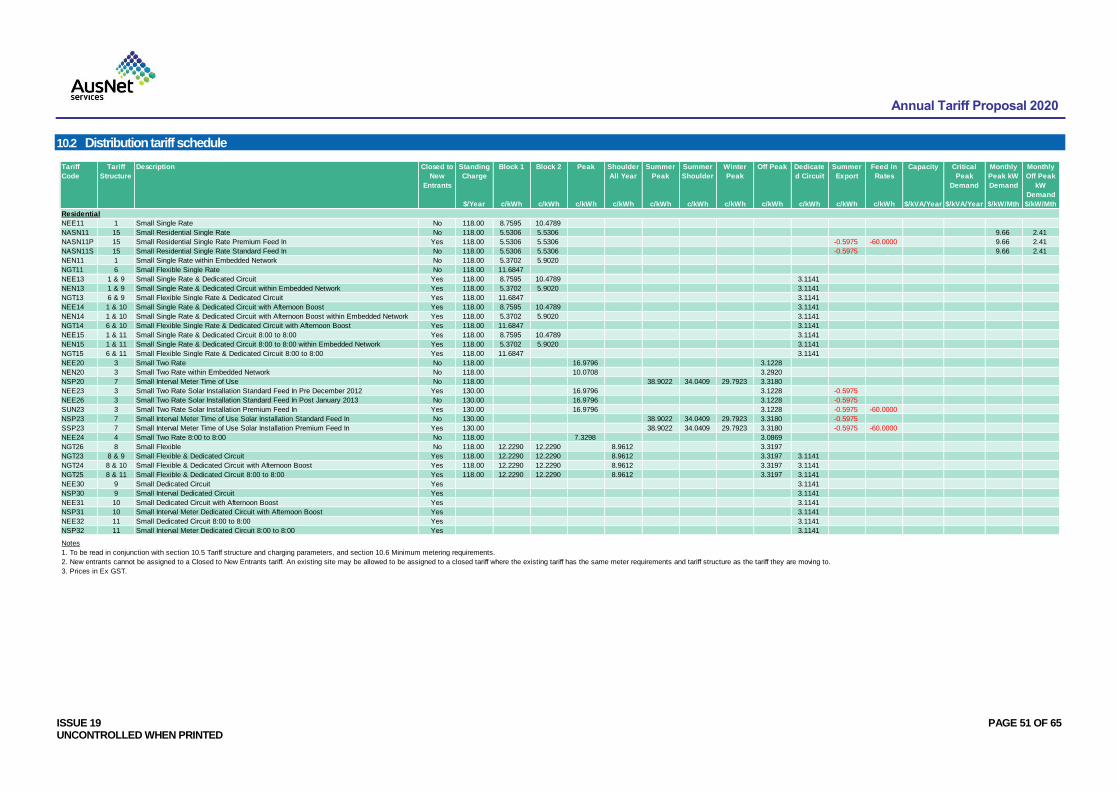
Annual Tariff Proposal 2020
ISSUE 19 PAGE 51 OF 65 UNCONTROLLED WHEN PRINTED
10.2 Distribution tariff schedule
Tariff
Code
Tariff
Structure
Description Closed to
New
Entrants
Standing
Charge
Block 1 Block 2 Peak Shoulder
All Year
Summer
Peak
Summer
Shoulder
Winter
Peak
Off Peak Dedicate
d Circuit
Summer
Export
Feed In
Rates
Capacity Critical
Peak
Demand
Monthly
Peak kW
Demand
Monthly
Off Peak
kW
Demand
$/Year c/kWh c/kWh c/kWh c/kWh c/kWh c/kWh c/kWh c/kWh c/kWh c/kWh c/kWh $/kVA/Year $/kVA/Year $/kW/Mth $/kW/Mth
Residential
NEE11 1 Small Single Rate No 118.00 8.7595 10.4789
NASN11 15 Small Residential Single Rate No 118.00 5.5306 5.5306 9.66 2.41
NASN11P 15 Small Residential Single Rate Premium Feed In Yes 118.00 5.5306 5.5306 -0.5975 -60.0000 9.66 2.41
NASN11S 15 Small Residential Single Rate Standard Feed In No 118.00 5.5306 5.5306 -0.5975 9.66 2.41
NEN11 1 Small Single Rate within Embedded Network No 118.00 5.3702 5.9020
NGT11 6 Small Flexible Single Rate No 118.00 11.6847
NEE13 1 & 9 Small Single Rate & Dedicated Circuit Yes 118.00 8.7595 10.4789 3.1141
NEN13 1 & 9 Small Single Rate & Dedicated Circuit within Embedded Network Yes 118.00 5.3702 5.9020 3.1141
NGT13 6 & 9 Small Flexible Single Rate & Dedicated Circuit Yes 118.00 11.6847 3.1141
NEE14 1 & 10 Small Single Rate & Dedicated Circuit with Afternoon Boost Yes 118.00 8.7595 10.4789 3.1141
NEN14 1 & 10 Small Single Rate & Dedicated Circuit with Afternoon Boost within Embedded Network Yes 118.00 5.3702 5.9020 3.1141
NGT14 6 & 10 Small Flexible Single Rate & Dedicated Circuit with Afternoon Boost Yes 118.00 11.6847 3.1141
NEE15 1 & 11 Small Single Rate & Dedicated Circuit 8:00 to 8:00 Yes 118.00 8.7595 10.4789 3.1141
NEN15 1 & 11 Small Single Rate & Dedicated Circuit 8:00 to 8:00 within Embedded Network Yes 118.00 5.3702 5.9020 3.1141
NGT15 6 & 11 Small Flexible Single Rate & Dedicated Circuit 8:00 to 8:00 Yes 118.00 11.6847 3.1141
NEE20 3 Small Two Rate No 118.00 16.9796 3.1228
NEN20 3 Small Two Rate within Embedded Network No 118.00 10.0708 3.2920
NSP20 7 Small Interval Meter Time of Use No 118.00 38.9022 34.0409 29.7923 3.3180
NEE23 3 Small Two Rate Solar Installation Standard Feed In Pre December 2012 Yes 130.00 16.9796 3.1228 -0.5975
NEE26 3 Small Two Rate Solar Installation Standard Feed In Post January 2013 No 130.00 16.9796 3.1228 -0.5975
SUN23 3 Small Two Rate Solar Installation Premium Feed In Yes 130.00 16.9796 3.1228 -0.5975 -60.0000
NSP23 7 Small Interval Meter Time of Use Solar Installation Standard Feed In No 130.00 38.9022 34.0409 29.7923 3.3180 -0.5975
SSP23 7 Small Interval Meter Time of Use Solar Installation Premium Feed In Yes 130.00 38.9022 34.0409 29.7923 3.3180 -0.5975 -60.0000
NEE24 4 Small Two Rate 8:00 to 8:00 No 118.00 7.3298 3.0869
NGT26 8 Small Flexible No 118.00 12.2290 12.2290 8.9612 3.3197
NGT23 8 & 9 Small Flexible & Dedicated Circuit Yes 118.00 12.2290 12.2290 8.9612 3.3197 3.1141
NGT24 8 & 10 Small Flexible & Dedicated Circuit with Afternoon Boost Yes 118.00 12.2290 12.2290 8.9612 3.3197 3.1141
NGT25 8 & 11 Small Flexible & Dedicated Circuit 8:00 to 8:00 Yes 118.00 12.2290 12.2290 8.9612 3.3197 3.1141
NEE30 9 Small Dedicated Circuit Yes 3.1141
NSP30 9 Small Interval Dedicated Circuit Yes 3.1141
NEE31 10 Small Dedicated Circuit with Afternoon Boost Yes 3.1141
NSP31 10 Small Interval Meter Dedicated Circuit with Afternoon Boost Yes 3.1141
NEE32 11 Small Dedicated Circuit 8:00 to 8:00 Yes 3.1141
NSP32 11 Small Interval Meter Dedicated Circuit 8:00 to 8:00 Yes 3.1141
Notes
1. To be read in conjunction with section 10.5 Tariff structure and charging parameters, and section 10.6 Minimum metering requirements.
2. New entrants cannot be assigned to a Closed to New Entrants tariff. An existing site may be allowed to be assigned to a closed tariff where the existing tariff has the same meter requirements and tariff structure as the tariff they are moving to.
3. Prices in Ex GST.
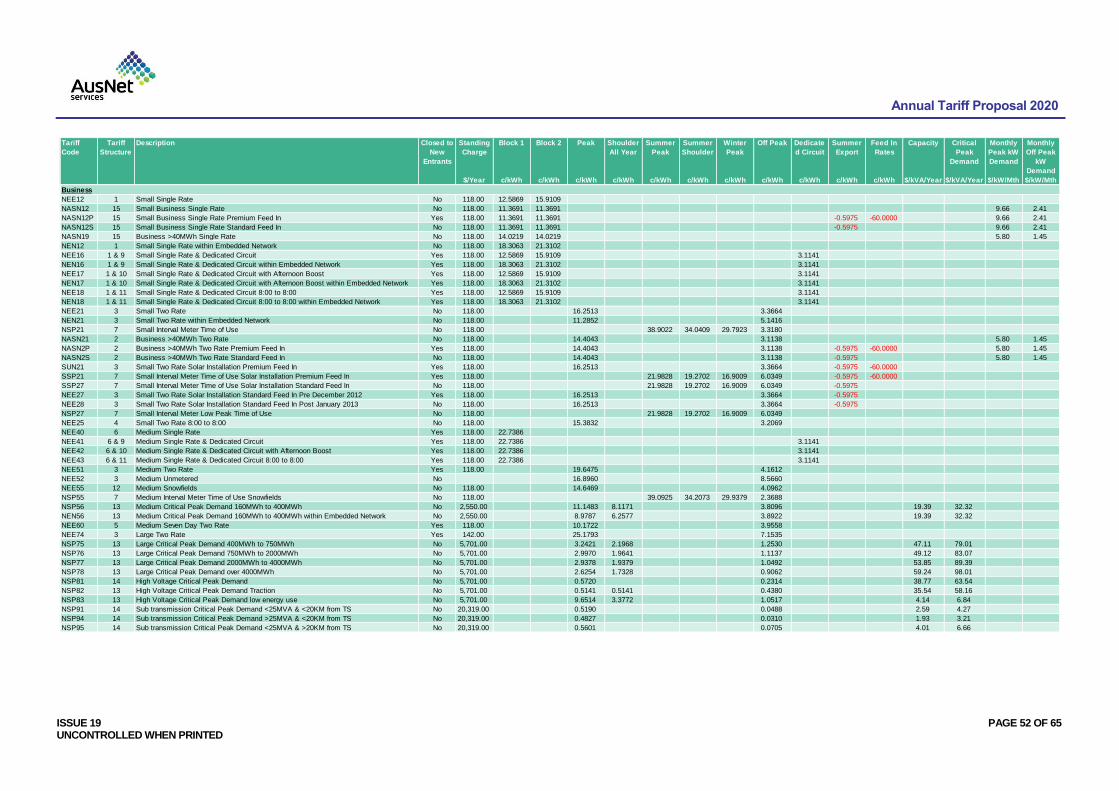
Annual Tariff Proposal 2020
ISSUE 19 PAGE 52 OF 65 UNCONTROLLED WHEN PRINTED
Tariff
Code
Tariff
Structure
Description Closed to
New
Entrants
Standing
Charge
Block 1 Block 2 Peak Shoulder
All Year
Summer
Peak
Summer
Shoulder
Winter
Peak
Off Peak Dedicate
d Circuit
Summer
Export
Feed In
Rates
Capacity Critical
Peak
Demand
Monthly
Peak kW
Demand
Monthly
Off Peak
kW
Demand
$/Year c/kWh c/kWh c/kWh c/kWh c/kWh c/kWh c/kWh c/kWh c/kWh c/kWh c/kWh $/kVA/Year $/kVA/Year $/kW/Mth $/kW/Mth
Business
NEE12 1 Small Single Rate No 118.00 12.5869 15.9109
NASN12 15 Small Business Single Rate No 118.00 11.3691 11.3691 9.66 2.41
NASN12P 15 Small Business Single Rate Premium Feed In Yes 118.00 11.3691 11.3691 -0.5975 -60.0000 9.66 2.41
NASN12S 15 Small Business Single Rate Standard Feed In No 118.00 11.3691 11.3691 -0.5975 9.66 2.41
NASN19 15 Business >40MWh Single Rate No 118.00 14.0219 14.0219 5.80 1.45
NEN12 1 Small Single Rate within Embedded Network No 118.00 18.3063 21.3102
NEE16 1 & 9 Small Single Rate & Dedicated Circuit Yes 118.00 12.5869 15.9109 3.1141
NEN16 1 & 9 Small Single Rate & Dedicated Circuit within Embedded Network Yes 118.00 18.3063 21.3102 3.1141
NEE17 1 & 10 Small Single Rate & Dedicated Circuit with Afternoon Boost Yes 118.00 12.5869 15.9109 3.1141
NEN17 1 & 10 Small Single Rate & Dedicated Circuit with Afternoon Boost within Embedded Network Yes 118.00 18.3063 21.3102 3.1141
NEE18 1 & 11 Small Single Rate & Dedicated Circuit 8:00 to 8:00 Yes 118.00 12.5869 15.9109 3.1141
NEN18 1 & 11 Small Single Rate & Dedicated Circuit 8:00 to 8:00 within Embedded Network Yes 118.00 18.3063 21.3102 3.1141
NEE21 3 Small Two Rate No 118.00 16.2513 3.3664
NEN21 3 Small Two Rate within Embedded Network No 118.00 11.2852 5.1416
NSP21 7 Small Interval Meter Time of Use No 118.00 38.9022 34.0409 29.7923 3.3180
NASN21 2 Business >40MWh Two Rate No 118.00 14.4043 3.1138 5.80 1.45
NASN2P 2 Business >40MWh Two Rate Premium Feed In Yes 118.00 14.4043 3.1138 -0.5975 -60.0000 5.80 1.45
NASN2S 2 Business >40MWh Two Rate Standard Feed In No 118.00 14.4043 3.1138 -0.5975 5.80 1.45
SUN21 3 Small Two Rate Solar Installation Premium Feed In Yes 118.00 16.2513 3.3664 -0.5975 -60.0000
SSP21 7 Small Interval Meter Time of Use Solar Installation Premium Feed In Yes 118.00 21.9828 19.2702 16.9009 6.0349 -0.5975 -60.0000
SSP27 7 Small Interval Meter Time of Use Solar Installation Standard Feed In No 118.00 21.9828 19.2702 16.9009 6.0349 -0.5975
NEE27 3 Small Two Rate Solar Installation Standard Feed In Pre December 2012 Yes 118.00 16.2513 3.3664 -0.5975
NEE28 3 Small Two Rate Solar Installation Standard Feed In Post January 2013 No 118.00 16.2513 3.3664 -0.5975
NSP27 7 Small Interval Meter Low Peak Time of Use No 118.00 21.9828 19.2702 16.9009 6.0349
NEE25 4 Small Two Rate 8:00 to 8:00 No 118.00 15.3832 3.2069
NEE40 6 Medium Single Rate Yes 118.00 22.7386
NEE41 6 & 9 Medium Single Rate & Dedicated Circuit Yes 118.00 22.7386 3.1141
NEE42 6 & 10 Medium Single Rate & Dedicated Circuit with Afternoon Boost Yes 118.00 22.7386 3.1141
NEE43 6 & 11 Medium Single Rate & Dedicated Circuit 8:00 to 8:00 Yes 118.00 22.7386 3.1141
NEE51 3 Medium Two Rate Yes 118.00 19.6475 4.1612
NEE52 3 Medium Unmetered No 16.8960 8.5660
NEE55 12 Medium Snowfields No 118.00 14.6469 4.0962
NSP55 7 Medium Interval Meter Time of Use Snowfields No 118.00 39.0925 34.2073 29.9379 2.3688
NSP56 13 Medium Critical Peak Demand 160MWh to 400MWh No 2,550.00 11.1483 8.1171 3.8096 19.39 32.32
NEN56 13 Medium Critical Peak Demand 160MWh to 400MWh within Embedded Network No 2,550.00 8.9787 6.2577 3.8922 19.39 32.32
NEE60 5 Medium Seven Day Two Rate Yes 118.00 10.1722 3.9558
NEE74 3 Large Two Rate Yes 142.00 25.1793 7.1535
NSP75 13 Large Critical Peak Demand 400MWh to 750MWh No 5,701.00 3.2421 2.1968 1.2530 47.11 79.01
NSP76 13 Large Critical Peak Demand 750MWh to 2000MWh No 5,701.00 2.9970 1.9641 1.1137 49.12 83.07
NSP77 13 Large Critical Peak Demand 2000MWh to 4000MWh No 5,701.00 2.9378 1.9379 1.0492 53.85 89.39
NSP78 13 Large Critical Peak Demand over 4000MWh No 5,701.00 2.6254 1.7328 0.9062 59.24 98.01
NSP81 14 High Voltage Critical Peak Demand No 5,701.00 0.5720 0.2314 38.77 63.54
NSP82 13 High Voltage Critical Peak Demand Traction No 5,701.00 0.5141 0.5141 0.4380 35.54 58.16
NSP83 13 High Voltage Critical Peak Demand low energy use No 5,701.00 9.6514 3.3772 1.0517 4.14 6.84
NSP91 14 Sub transmission Critical Peak Demand <25MVA & <20KM from TS No 20,319.00 0.5190 0.0488 2.59 4.27
NSP94 14 Sub transmission Critical Peak Demand >25MVA & <20KM from TS No 20,319.00 0.4827 0.0310 1.93 3.21
NSP95 14 Sub transmission Critical Peak Demand <25MVA & >20KM from TS No 20,319.00 0.5601 0.0705 4.01 6.66

Annual Tariff Proposal 2020
ISSUE 19 PAGE 53 OF 65 UNCONTROLLED WHEN PRINTED
10.3 Transmission tariff schedule
Tariff
Code
Tariff
Structure
Description Closed to
New
Entrants
Standing
Charge
Block 1 Block 2 Peak Shoulder
All Year
Summer
Peak
Summer
Shoulder
Winter
Peak
Off Peak Dedicate
d Circuit
Summer
Export
Feed In
Rates
Capacity Critical
Peak
Demand
Monthly
Peak kW
Demand
Monthly
Off Peak
kW
Demand
$/Year c/kWh c/kWh c/kWh c/kWh c/kWh c/kWh c/kWh c/kWh c/kWh c/kWh c/kWh $/kVA/Year $/kVA/Year $/kW/Mth $/kW/Mth
Residential
NEE11 1 Small Single Rate No 2.0495 2.0495
NASN11 15 Small Residential Single Rate No 2.0495 2.0495
NASN11P 15 Small Residential Single Rate Premium Feed In Yes 2.0495 2.0495
NASN11S 15 Small Residential Single Rate Standard Feed In No 2.0495 2.0495
NEN11 1 Small Single Rate within Embedded Network No 2.0495 2.0495
NGT11 6 Small Flexible Single Rate No 2.0495
NEE13 1 & 9 Small Single Rate & Dedicated Circuit Yes 2.0495 2.0495 0.5716
NEN13 1 & 9 Small Single Rate & Dedicated Circuit within Embedded Network Yes 2.0495 2.0495 0.5716
NGT13 6 & 9 Small Flexible Single Rate & Dedicated Circuit Yes 2.0495 0.5716
NEE14 1 & 10 Small Single Rate & Dedicated Circuit with Afternoon Boost Yes 2.0495 2.0495 0.5716
NEN14 1 & 10 Small Single Rate & Dedicated Circuit with Afternoon Boost within Embedded Network Yes 2.0495 2.0495 0.5716
NGT14 6 & 10 Small Flexible Single Rate & Dedicated Circuit with Afternoon Boost Yes 2.0495 0.5716
NEE15 1 & 11 Small Single Rate & Dedicated Circuit 8:00 to 8:00 Yes 2.0495 2.0495 0.5716
NEN15 1 & 11 Small Single Rate & Dedicated Circuit 8:00 to 8:00 within Embedded Network Yes 2.0495 2.0495 0.5716
NGT15 6 & 11 Small Flexible Single Rate & Dedicated Circuit 8:00 to 8:00 Yes 2.0495 0.5716
NEE20 3 Small Two Rate No 2.0495 0.5716
NEN20 3 Small Two Rate within Embedded Network No 2.0495 0.5716
NSP20 7 Small Interval Meter Time of Use No 2.0495 2.0495 2.0495 0.5716
NEE23 3 Small Two Rate Solar Installation Standard Feed In Pre December 2012 Yes 2.0495 0.5716
NEE26 3 Small Two Rate Solar Installation Standard Feed In Post January 2013 No 2.0495 0.5716
SUN23 3 Small Two Rate Solar Installation Premium Feed In Yes 2.0495 0.5716
NSP23 7 Small Interval Meter Time of Use Solar Installation Standard Feed In No 2.0495 2.0495 2.0495 0.5716
SSP23 7 Small Interval Meter Time of Use Solar Installation Premium Feed In Yes 2.0495 2.0495 2.0495 0.5716
NEE24 4 Small Two Rate 8:00 to 8:00 No 2.0495 0.5716
NGT26 8 Small Flexible No 2.0495 2.0495 2.0495 0.5716
NGT23 8 & 9 Small Flexible & Dedicated Circuit Yes 2.0495 2.0495 2.0495 0.5716 0.5716
NGT24 8 & 10 Small Flexible & Dedicated Circuit with Afternoon Boost Yes 2.0495 2.0495 2.0495 0.5716 0.5716
NGT25 8 & 11 Small Flexible & Dedicated Circuit 8:00 to 8:00 Yes 2.0495 2.0495 2.0495 0.5716 0.5716
NEE30 9 Small Dedicated Circuit Yes 0.5716
NSP30 9 Small Interval Dedicated Circuit Yes 0.5716
NEE31 10 Small Dedicated Circuit with Afternoon Boost Yes 0.5716
NSP31 10 Small Interval Meter Dedicated Circuit with Afternoon Boost Yes 0.5716
NEE32 11 Small Dedicated Circuit 8:00 to 8:00 Yes 0.5716
NSP32 11 Small Interval Meter Dedicated Circuit 8:00 to 8:00 Yes 0.5716
Notes
1. To be read in conjunction with section 10.5 Tariff structure and charging parameters, and section 10.6 Minimum metering requirements.
2. New entrants cannot be assigned to a Closed to New Entrants tariff. An existing site may be allowed to be assigned to a closed tariff where the existing tariff has the same meter requirements and tariff structure as the tariff they are moving to.
3. Prices in Ex GST.
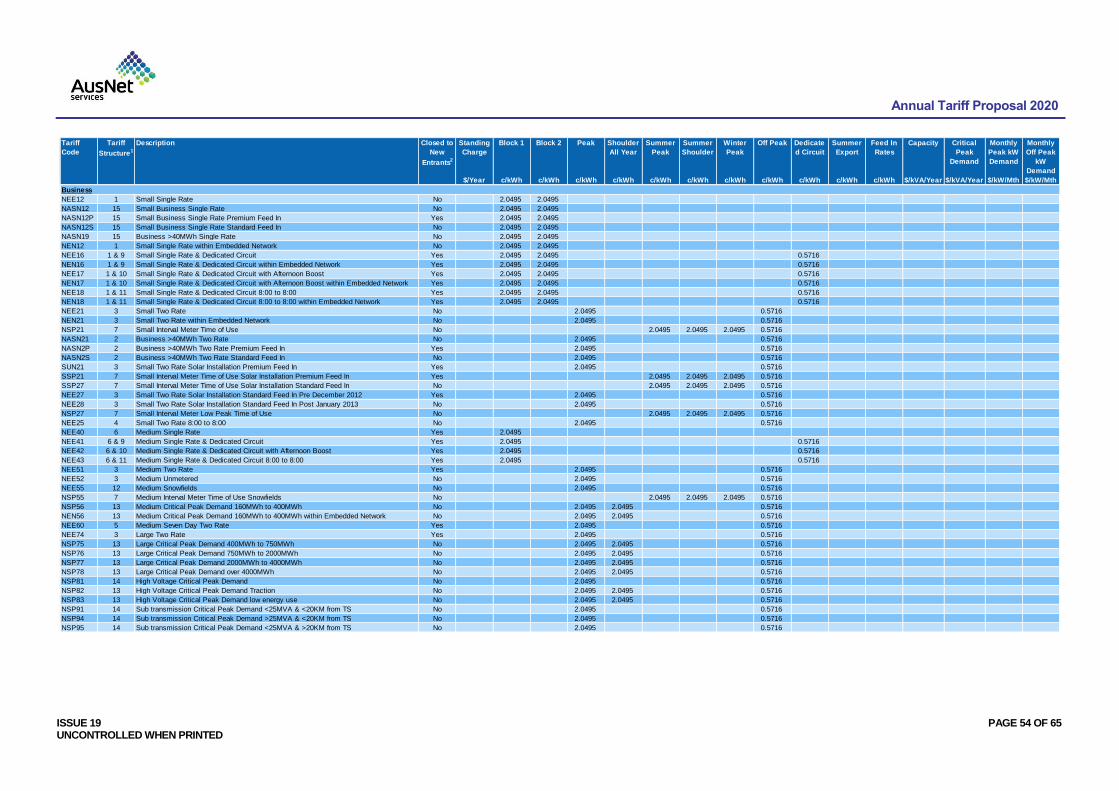
Annual Tariff Proposal 2020
ISSUE 19 PAGE 54 OF 65 UNCONTROLLED WHEN PRINTED
Tariff
Code
Tariff
Structure1
Description Closed to
New
Entrants2
Standing
Charge
Block 1 Block 2 Peak Shoulder
All Year
Summer
Peak
Summer
Shoulder
Winter
Peak
Off Peak Dedicate
d Circuit
Summer
Export
Feed In
Rates
Capacity Critical
Peak
Demand
Monthly
Peak kW
Demand
Monthly
Off Peak
kW
Demand
$/Year c/kWh c/kWh c/kWh c/kWh c/kWh c/kWh c/kWh c/kWh c/kWh c/kWh c/kWh $/kVA/Year $/kVA/Year $/kW/Mth $/kW/Mth
Business
NEE12 1 Small Single Rate No 2.0495 2.0495
NASN12 15 Small Business Single Rate No 2.0495 2.0495
NASN12P 15 Small Business Single Rate Premium Feed In Yes 2.0495 2.0495
NASN12S 15 Small Business Single Rate Standard Feed In No 2.0495 2.0495
NASN19 15 Business >40MWh Single Rate No 2.0495 2.0495
NEN12 1 Small Single Rate within Embedded Network No 2.0495 2.0495
NEE16 1 & 9 Small Single Rate & Dedicated Circuit Yes 2.0495 2.0495 0.5716
NEN16 1 & 9 Small Single Rate & Dedicated Circuit within Embedded Network Yes 2.0495 2.0495 0.5716
NEE17 1 & 10 Small Single Rate & Dedicated Circuit with Afternoon Boost Yes 2.0495 2.0495 0.5716
NEN17 1 & 10 Small Single Rate & Dedicated Circuit with Afternoon Boost within Embedded Network Yes 2.0495 2.0495 0.5716
NEE18 1 & 11 Small Single Rate & Dedicated Circuit 8:00 to 8:00 Yes 2.0495 2.0495 0.5716
NEN18 1 & 11 Small Single Rate & Dedicated Circuit 8:00 to 8:00 within Embedded Network Yes 2.0495 2.0495 0.5716
NEE21 3 Small Two Rate No 2.0495 0.5716
NEN21 3 Small Two Rate within Embedded Network No 2.0495 0.5716
NSP21 7 Small Interval Meter Time of Use No 2.0495 2.0495 2.0495 0.5716
NASN21 2 Business >40MWh Two Rate No 2.0495 0.5716
NASN2P 2 Business >40MWh Two Rate Premium Feed In Yes 2.0495 0.5716
NASN2S 2 Business >40MWh Two Rate Standard Feed In No 2.0495 0.5716
SUN21 3 Small Two Rate Solar Installation Premium Feed In Yes 2.0495 0.5716
SSP21 7 Small Interval Meter Time of Use Solar Installation Premium Feed In Yes 2.0495 2.0495 2.0495 0.5716
SSP27 7 Small Interval Meter Time of Use Solar Installation Standard Feed In No 2.0495 2.0495 2.0495 0.5716
NEE27 3 Small Two Rate Solar Installation Standard Feed In Pre December 2012 Yes 2.0495 0.5716
NEE28 3 Small Two Rate Solar Installation Standard Feed In Post January 2013 No 2.0495 0.5716
NSP27 7 Small Interval Meter Low Peak Time of Use No 2.0495 2.0495 2.0495 0.5716
NEE25 4 Small Two Rate 8:00 to 8:00 No 2.0495 0.5716
NEE40 6 Medium Single Rate Yes 2.0495
NEE41 6 & 9 Medium Single Rate & Dedicated Circuit Yes 2.0495 0.5716
NEE42 6 & 10 Medium Single Rate & Dedicated Circuit with Afternoon Boost Yes 2.0495 0.5716
NEE43 6 & 11 Medium Single Rate & Dedicated Circuit 8:00 to 8:00 Yes 2.0495 0.5716
NEE51 3 Medium Two Rate Yes 2.0495 0.5716
NEE52 3 Medium Unmetered No 2.0495 0.5716
NEE55 12 Medium Snowfields No 2.0495 0.5716
NSP55 7 Medium Interval Meter Time of Use Snowfields No 2.0495 2.0495 2.0495 0.5716
NSP56 13 Medium Critical Peak Demand 160MWh to 400MWh No 2.0495 2.0495 0.5716
NEN56 13 Medium Critical Peak Demand 160MWh to 400MWh within Embedded Network No 2.0495 2.0495 0.5716
NEE60 5 Medium Seven Day Two Rate Yes 2.0495 0.5716
NEE74 3 Large Two Rate Yes 2.0495 0.5716
NSP75 13 Large Critical Peak Demand 400MWh to 750MWh No 2.0495 2.0495 0.5716
NSP76 13 Large Critical Peak Demand 750MWh to 2000MWh No 2.0495 2.0495 0.5716
NSP77 13 Large Critical Peak Demand 2000MWh to 4000MWh No 2.0495 2.0495 0.5716
NSP78 13 Large Critical Peak Demand over 4000MWh No 2.0495 2.0495 0.5716
NSP81 14 High Voltage Critical Peak Demand No 2.0495 0.5716
NSP82 13 High Voltage Critical Peak Demand Traction No 2.0495 2.0495 0.5716
NSP83 13 High Voltage Critical Peak Demand low energy use No 2.0495 2.0495 0.5716
NSP91 14 Sub transmission Critical Peak Demand <25MVA & <20KM from TS No 2.0495 0.5716
NSP94 14 Sub transmission Critical Peak Demand >25MVA & <20KM from TS No 2.0495 0.5716
NSP95 14 Sub transmission Critical Peak Demand <25MVA & >20KM from TS No 2.0495 0.5716
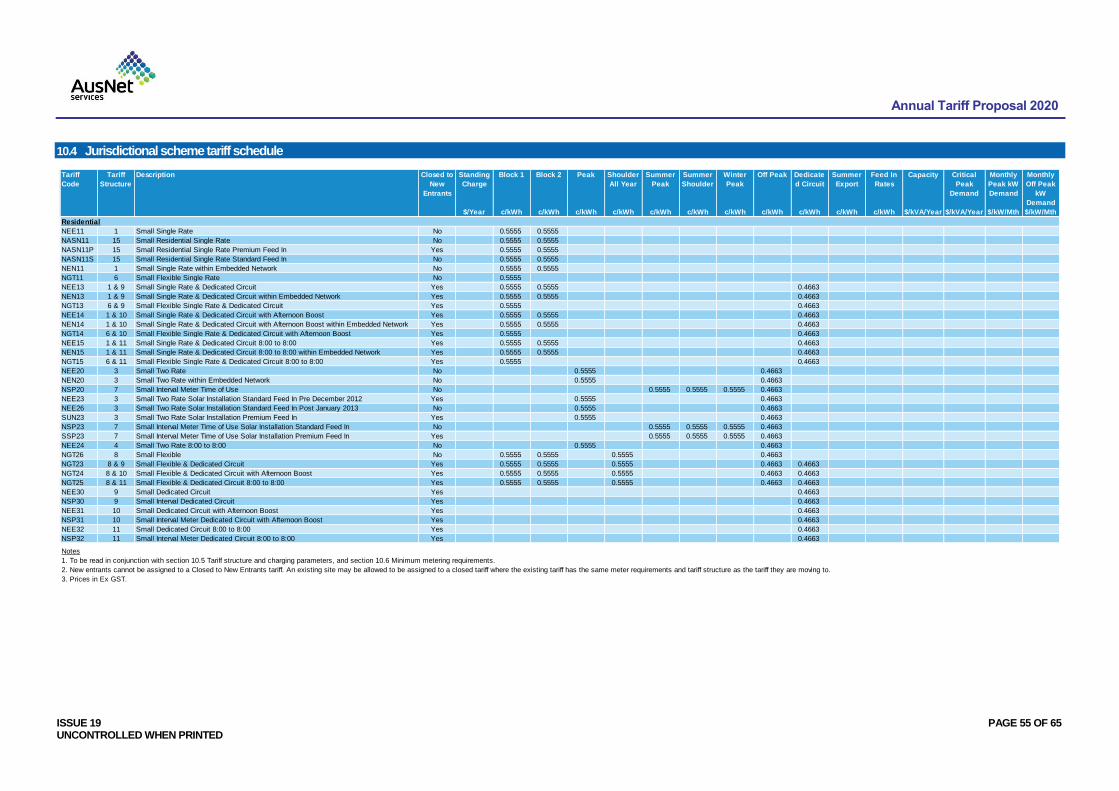
Annual Tariff Proposal 2020
ISSUE 19 PAGE 55 OF 65 UNCONTROLLED WHEN PRINTED
10.4 Jurisdictional scheme tariff schedule
Tariff
Code
Tariff
Structure
Description Closed to
New
Entrants
Standing
Charge
Block 1 Block 2 Peak Shoulder
All Year
Summer
Peak
Summer
Shoulder
Winter
Peak
Off Peak Dedicate
d Circuit
Summer
Export
Feed In
Rates
Capacity Critical
Peak
Demand
Monthly
Peak kW
Demand
Monthly
Off Peak
kW
Demand
$/Year c/kWh c/kWh c/kWh c/kWh c/kWh c/kWh c/kWh c/kWh c/kWh c/kWh c/kWh $/kVA/Year $/kVA/Year $/kW/Mth $/kW/Mth
Residential
NEE11 1 Small Single Rate No 0.5555 0.5555
NASN11 15 Small Residential Single Rate No 0.5555 0.5555
NASN11P 15 Small Residential Single Rate Premium Feed In Yes 0.5555 0.5555
NASN11S 15 Small Residential Single Rate Standard Feed In No 0.5555 0.5555
NEN11 1 Small Single Rate within Embedded Network No 0.5555 0.5555
NGT11 6 Small Flexible Single Rate No 0.5555
NEE13 1 & 9 Small Single Rate & Dedicated Circuit Yes 0.5555 0.5555 0.4663
NEN13 1 & 9 Small Single Rate & Dedicated Circuit within Embedded Network Yes 0.5555 0.5555 0.4663
NGT13 6 & 9 Small Flexible Single Rate & Dedicated Circuit Yes 0.5555 0.4663
NEE14 1 & 10 Small Single Rate & Dedicated Circuit with Afternoon Boost Yes 0.5555 0.5555 0.4663
NEN14 1 & 10 Small Single Rate & Dedicated Circuit with Afternoon Boost within Embedded Network Yes 0.5555 0.5555 0.4663
NGT14 6 & 10 Small Flexible Single Rate & Dedicated Circuit with Afternoon Boost Yes 0.5555 0.4663
NEE15 1 & 11 Small Single Rate & Dedicated Circuit 8:00 to 8:00 Yes 0.5555 0.5555 0.4663
NEN15 1 & 11 Small Single Rate & Dedicated Circuit 8:00 to 8:00 within Embedded Network Yes 0.5555 0.5555 0.4663
NGT15 6 & 11 Small Flexible Single Rate & Dedicated Circuit 8:00 to 8:00 Yes 0.5555 0.4663
NEE20 3 Small Two Rate No 0.5555 0.4663
NEN20 3 Small Two Rate within Embedded Network No 0.5555 0.4663
NSP20 7 Small Interval Meter Time of Use No 0.5555 0.5555 0.5555 0.4663
NEE23 3 Small Two Rate Solar Installation Standard Feed In Pre December 2012 Yes 0.5555 0.4663
NEE26 3 Small Two Rate Solar Installation Standard Feed In Post January 2013 No 0.5555 0.4663
SUN23 3 Small Two Rate Solar Installation Premium Feed In Yes 0.5555 0.4663
NSP23 7 Small Interval Meter Time of Use Solar Installation Standard Feed In No 0.5555 0.5555 0.5555 0.4663
SSP23 7 Small Interval Meter Time of Use Solar Installation Premium Feed In Yes 0.5555 0.5555 0.5555 0.4663
NEE24 4 Small Two Rate 8:00 to 8:00 No 0.5555 0.4663
NGT26 8 Small Flexible No 0.5555 0.5555 0.5555 0.4663
NGT23 8 & 9 Small Flexible & Dedicated Circuit Yes 0.5555 0.5555 0.5555 0.4663 0.4663
NGT24 8 & 10 Small Flexible & Dedicated Circuit with Afternoon Boost Yes 0.5555 0.5555 0.5555 0.4663 0.4663
NGT25 8 & 11 Small Flexible & Dedicated Circuit 8:00 to 8:00 Yes 0.5555 0.5555 0.5555 0.4663 0.4663
NEE30 9 Small Dedicated Circuit Yes 0.4663
NSP30 9 Small Interval Dedicated Circuit Yes 0.4663
NEE31 10 Small Dedicated Circuit with Afternoon Boost Yes 0.4663
NSP31 10 Small Interval Meter Dedicated Circuit with Afternoon Boost Yes 0.4663
NEE32 11 Small Dedicated Circuit 8:00 to 8:00 Yes 0.4663
NSP32 11 Small Interval Meter Dedicated Circuit 8:00 to 8:00 Yes 0.4663
Notes
1. To be read in conjunction with section 10.5 Tariff structure and charging parameters, and section 10.6 Minimum metering requirements.
2. New entrants cannot be assigned to a Closed to New Entrants tariff. An existing site may be allowed to be assigned to a closed tariff where the existing tariff has the same meter requirements and tariff structure as the tariff they are moving to.
3. Prices in Ex GST.
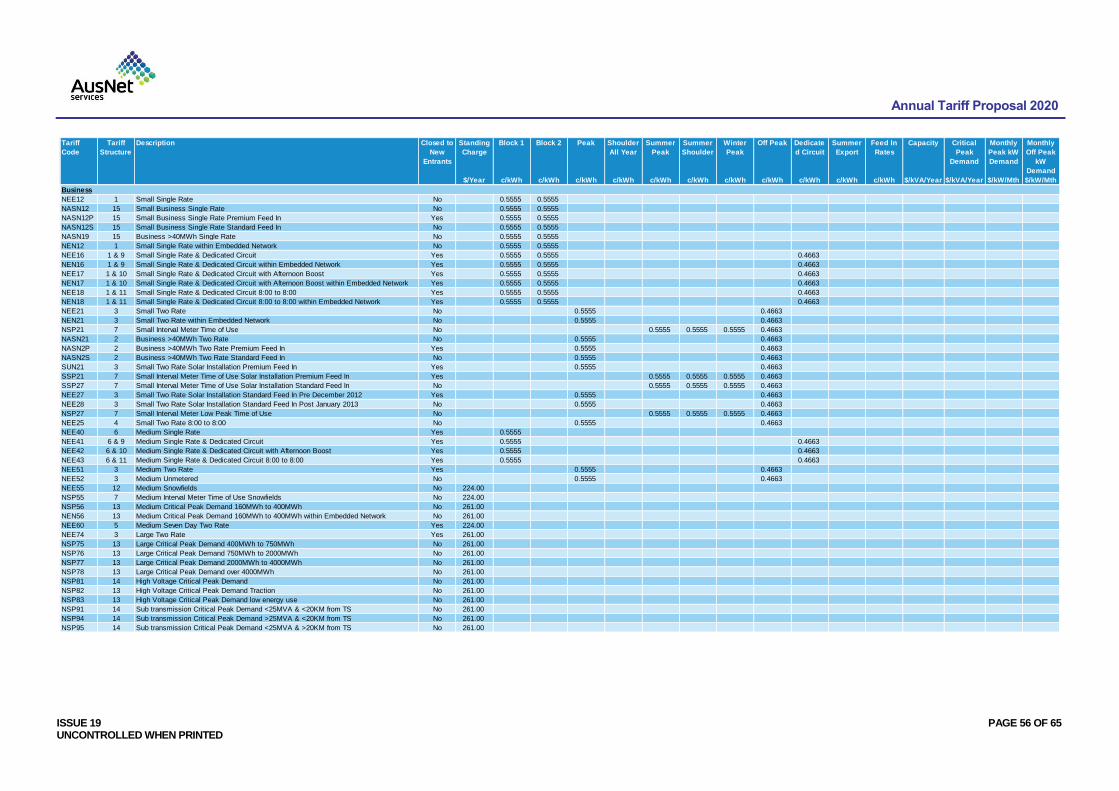
Annual Tariff Proposal 2020
ISSUE 19 PAGE 56 OF 65 UNCONTROLLED WHEN PRINTED
Tariff
Code
Tariff
Structure
Description Closed to
New
Entrants
Standing
Charge
Block 1 Block 2 Peak Shoulder
All Year
Summer
Peak
Summer
Shoulder
Winter
Peak
Off Peak Dedicate
d Circuit
Summer
Export
Feed In
Rates
Capacity Critical
Peak
Demand
Monthly
Peak kW
Demand
Monthly
Off Peak
kW
Demand
$/Year c/kWh c/kWh c/kWh c/kWh c/kWh c/kWh c/kWh c/kWh c/kWh c/kWh c/kWh $/kVA/Year $/kVA/Year $/kW/Mth $/kW/Mth
Business
NEE12 1 Small Single Rate No 0.5555 0.5555
NASN12 15 Small Business Single Rate No 0.5555 0.5555
NASN12P 15 Small Business Single Rate Premium Feed In Yes 0.5555 0.5555
NASN12S 15 Small Business Single Rate Standard Feed In No 0.5555 0.5555
NASN19 15 Business >40MWh Single Rate No 0.5555 0.5555
NEN12 1 Small Single Rate within Embedded Network No 0.5555 0.5555
NEE16 1 & 9 Small Single Rate & Dedicated Circuit Yes 0.5555 0.5555 0.4663
NEN16 1 & 9 Small Single Rate & Dedicated Circuit within Embedded Network Yes 0.5555 0.5555 0.4663
NEE17 1 & 10 Small Single Rate & Dedicated Circuit with Afternoon Boost Yes 0.5555 0.5555 0.4663
NEN17 1 & 10 Small Single Rate & Dedicated Circuit with Afternoon Boost within Embedded Network Yes 0.5555 0.5555 0.4663
NEE18 1 & 11 Small Single Rate & Dedicated Circuit 8:00 to 8:00 Yes 0.5555 0.5555 0.4663
NEN18 1 & 11 Small Single Rate & Dedicated Circuit 8:00 to 8:00 within Embedded Network Yes 0.5555 0.5555 0.4663
NEE21 3 Small Two Rate No 0.5555 0.4663
NEN21 3 Small Two Rate within Embedded Network No 0.5555 0.4663
NSP21 7 Small Interval Meter Time of Use No 0.5555 0.5555 0.5555 0.4663
NASN21 2 Business >40MWh Two Rate No 0.5555 0.4663
NASN2P 2 Business >40MWh Two Rate Premium Feed In Yes 0.5555 0.4663
NASN2S 2 Business >40MWh Two Rate Standard Feed In No 0.5555 0.4663
SUN21 3 Small Two Rate Solar Installation Premium Feed In Yes 0.5555 0.4663
SSP21 7 Small Interval Meter Time of Use Solar Installation Premium Feed In Yes 0.5555 0.5555 0.5555 0.4663
SSP27 7 Small Interval Meter Time of Use Solar Installation Standard Feed In No 0.5555 0.5555 0.5555 0.4663
NEE27 3 Small Two Rate Solar Installation Standard Feed In Pre December 2012 Yes 0.5555 0.4663
NEE28 3 Small Two Rate Solar Installation Standard Feed In Post January 2013 No 0.5555 0.4663
NSP27 7 Small Interval Meter Low Peak Time of Use No 0.5555 0.5555 0.5555 0.4663
NEE25 4 Small Two Rate 8:00 to 8:00 No 0.5555 0.4663
NEE40 6 Medium Single Rate Yes 0.5555
NEE41 6 & 9 Medium Single Rate & Dedicated Circuit Yes 0.5555 0.4663
NEE42 6 & 10 Medium Single Rate & Dedicated Circuit with Afternoon Boost Yes 0.5555 0.4663
NEE43 6 & 11 Medium Single Rate & Dedicated Circuit 8:00 to 8:00 Yes 0.5555 0.4663
NEE51 3 Medium Two Rate Yes 0.5555 0.4663
NEE52 3 Medium Unmetered No 0.5555 0.4663
NEE55 12 Medium Snowfields No 224.00
NSP55 7 Medium Interval Meter Time of Use Snowfields No 224.00
NSP56 13 Medium Critical Peak Demand 160MWh to 400MWh No 261.00
NEN56 13 Medium Critical Peak Demand 160MWh to 400MWh within Embedded Network No 261.00
NEE60 5 Medium Seven Day Two Rate Yes 224.00
NEE74 3 Large Two Rate Yes 261.00
NSP75 13 Large Critical Peak Demand 400MWh to 750MWh No 261.00
NSP76 13 Large Critical Peak Demand 750MWh to 2000MWh No 261.00
NSP77 13 Large Critical Peak Demand 2000MWh to 4000MWh No 261.00
NSP78 13 Large Critical Peak Demand over 4000MWh No 261.00
NSP81 14 High Voltage Critical Peak Demand No 261.00
NSP82 13 High Voltage Critical Peak Demand Traction No 261.00
NSP83 13 High Voltage Critical Peak Demand low energy use No 261.00
NSP91 14 Sub transmission Critical Peak Demand <25MVA & <20KM from TS No 261.00
NSP94 14 Sub transmission Critical Peak Demand >25MVA & <20KM from TS No 261.00
NSP95 14 Sub transmission Critical Peak Demand <25MVA & >20KM from TS No 261.00
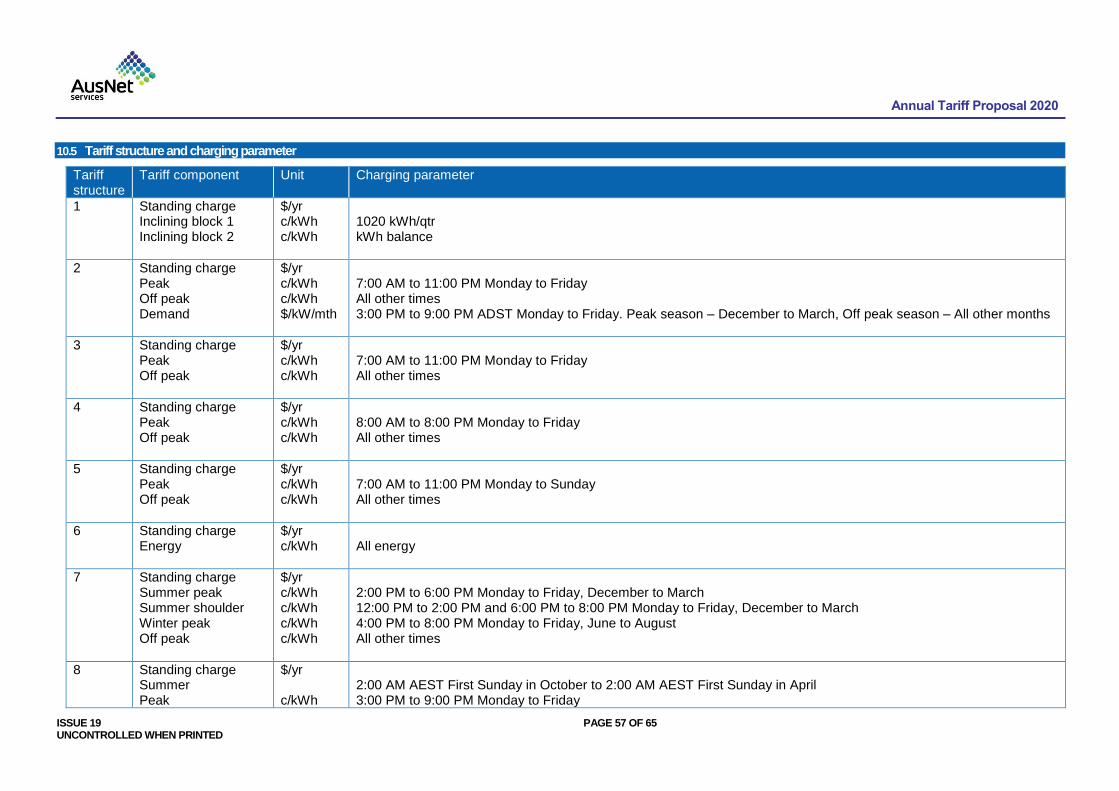
Annual Tariff Proposal 2020
ISSUE 19 PAGE 57 OF 65 UNCONTROLLED WHEN PRINTED
10.5 Tariff structure and charging parameter
Tariff structure
Tariff component Unit Charging parameter
1 Standing charge Inclining block 1 Inclining block 2
$/yr c/kWh c/kWh
1020 kWh/qtr kWh balance
2 Standing charge Peak Off peak Demand
$/yr c/kWh c/kWh $/kW/mth
7:00 AM to 11:00 PM Monday to Friday All other times 3:00 PM to 9:00 PM ADST Monday to Friday. Peak season – December to March, Off peak season – All other months
3 Standing charge Peak Off peak
$/yr c/kWh c/kWh
7:00 AM to 11:00 PM Monday to Friday All other times
4 Standing charge Peak Off peak
$/yr c/kWh c/kWh
8:00 AM to 8:00 PM Monday to Friday All other times
5 Standing charge Peak Off peak
$/yr c/kWh c/kWh
7:00 AM to 11:00 PM Monday to Sunday All other times
6 Standing charge Energy
$/yr c/kWh
All energy
7 Standing charge Summer peak Summer shoulder Winter peak Off peak
$/yr c/kWh c/kWh c/kWh c/kWh
2:00 PM to 6:00 PM Monday to Friday, December to March 12:00 PM to 2:00 PM and 6:00 PM to 8:00 PM Monday to Friday, December to March 4:00 PM to 8:00 PM Monday to Friday, June to August All other times
8 Standing charge Summer Peak
$/yr c/kWh
2:00 AM AEST First Sunday in October to 2:00 AM AEST First Sunday in April 3:00 PM to 9:00 PM Monday to Friday
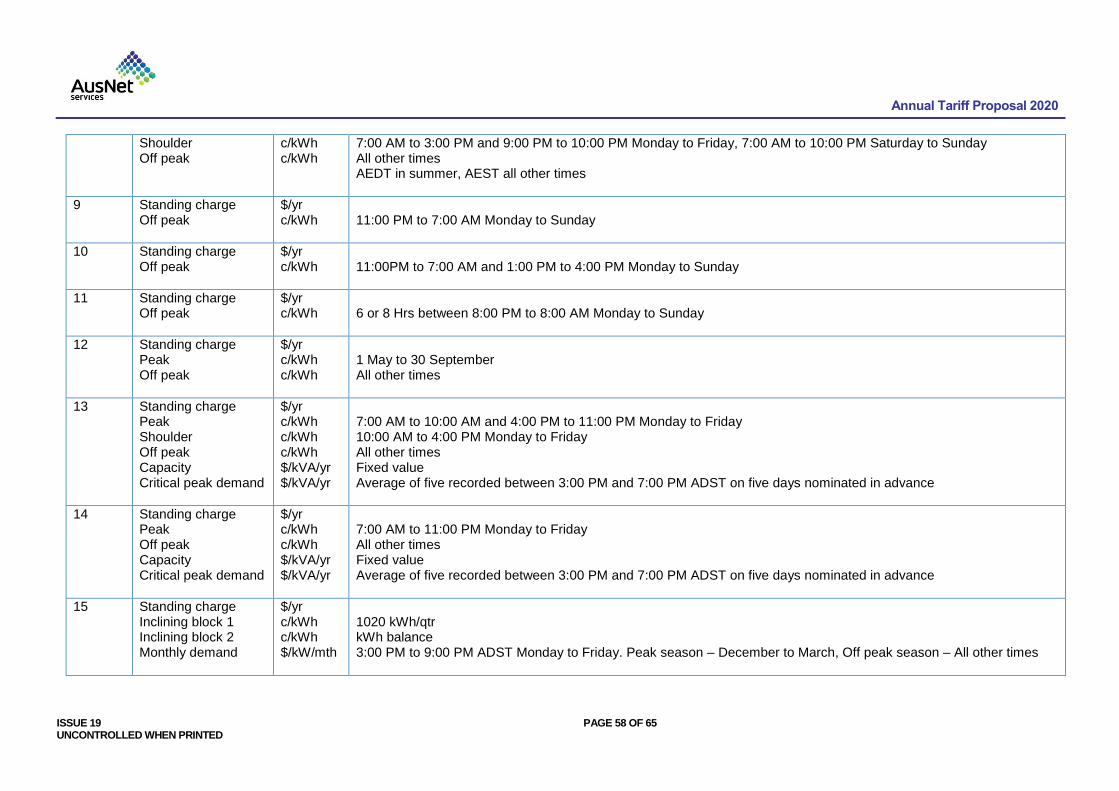
Annual Tariff Proposal 2020
ISSUE 19 PAGE 58 OF 65 UNCONTROLLED WHEN PRINTED
Shoulder Off peak
c/kWh c/kWh
7:00 AM to 3:00 PM and 9:00 PM to 10:00 PM Monday to Friday, 7:00 AM to 10:00 PM Saturday to Sunday All other times AEDT in summer, AEST all other times
9 Standing charge Off peak
$/yr c/kWh
11:00 PM to 7:00 AM Monday to Sunday
10 Standing charge Off peak
$/yr c/kWh
11:00PM to 7:00 AM and 1:00 PM to 4:00 PM Monday to Sunday
11 Standing charge Off peak
$/yr c/kWh
6 or 8 Hrs between 8:00 PM to 8:00 AM Monday to Sunday
12 Standing charge Peak Off peak
$/yr c/kWh c/kWh
1 May to 30 September All other times
13 Standing charge Peak Shoulder Off peak Capacity Critical peak demand
$/yr c/kWh c/kWh c/kWh $/kVA/yr $/kVA/yr
7:00 AM to 10:00 AM and 4:00 PM to 11:00 PM Monday to Friday 10:00 AM to 4:00 PM Monday to Friday All other times Fixed value Average of five recorded between 3:00 PM and 7:00 PM ADST on five days nominated in advance
14 Standing charge Peak Off peak Capacity Critical peak demand
$/yr c/kWh c/kWh $/kVA/yr $/kVA/yr
7:00 AM to 11:00 PM Monday to Friday All other times Fixed value Average of five recorded between 3:00 PM and 7:00 PM ADST on five days nominated in advance
15 Standing charge Inclining block 1 Inclining block 2 Monthly demand
$/yr c/kWh c/kWh $/kW/mth
1020 kWh/qtr kWh balance 3:00 PM to 9:00 PM ADST Monday to Friday. Peak season – December to March, Off peak season – All other times
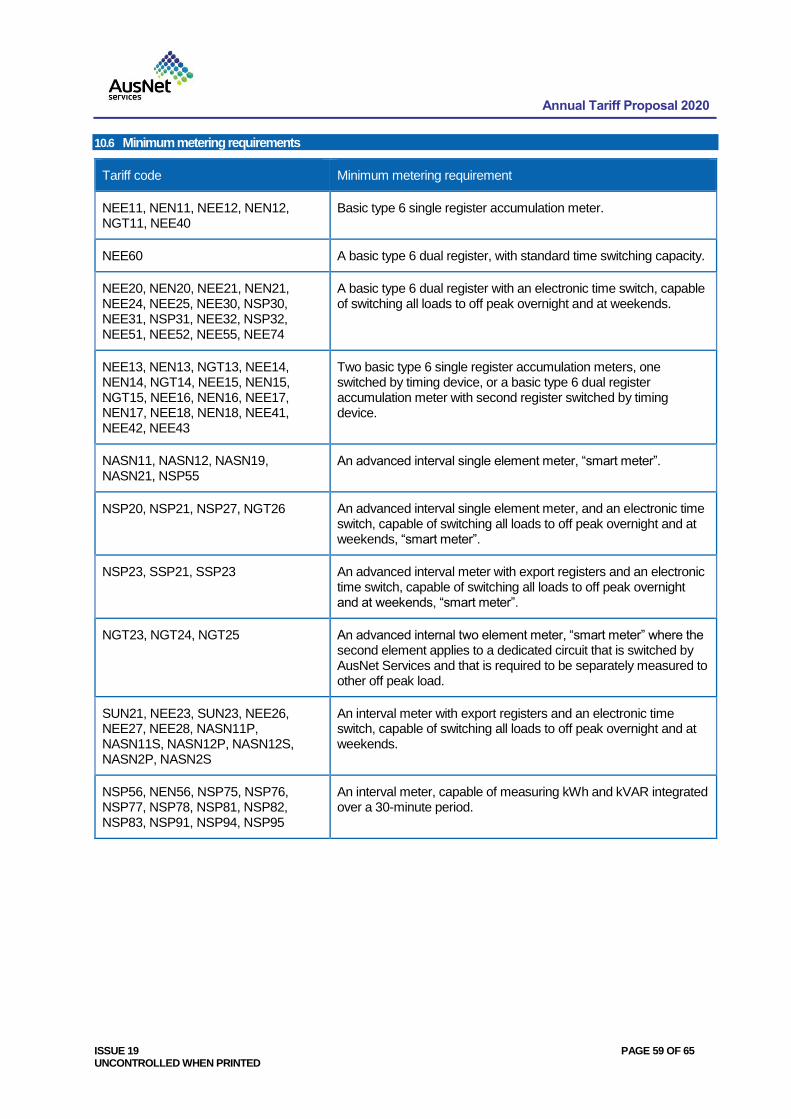
Annual Tariff Proposal 2020
ISSUE 19 PAGE 59 OF 65 UNCONTROLLED WHEN PRINTED
10.6 Minimum metering requirements
Tariff code Minimum metering requirement
NEE11, NEN11, NEE12, NEN12, NGT11, NEE40
Basic type 6 single register accumulation meter.
NEE60 A basic type 6 dual register, with standard time switching capacity.
NEE20, NEN20, NEE21, NEN21, NEE24, NEE25, NEE30, NSP30, NEE31, NSP31, NEE32, NSP32, NEE51, NEE52, NEE55, NEE74
A basic type 6 dual register with an electronic time switch, capable of switching all loads to off peak overnight and at weekends.
NEE13, NEN13, NGT13, NEE14, NEN14, NGT14, NEE15, NEN15, NGT15, NEE16, NEN16, NEE17, NEN17, NEE18, NEN18, NEE41, NEE42, NEE43
Two basic type 6 single register accumulation meters, one switched by timing device, or a basic type 6 dual register accumulation meter with second register switched by timing device.
NASN11, NASN12, NASN19, NASN21, NSP55
An advanced interval single element meter, “smart meter”.
NSP20, NSP21, NSP27, NGT26 An advanced interval single element meter, and an electronic time switch, capable of switching all loads to off peak overnight and at weekends, “smart meter”.
NSP23, SSP21, SSP23 An advanced interval meter with export registers and an electronic time switch, capable of switching all loads to off peak overnight and at weekends, “smart meter”.
NGT23, NGT24, NGT25 An advanced internal two element meter, “smart meter” where the second element applies to a dedicated circuit that is switched by AusNet Services and that is required to be separately measured to other off peak load.
SUN21, NEE23, SUN23, NEE26, NEE27, NEE28, NASN11P, NASN11S, NASN12P, NASN12S, NASN2P, NASN2S
An interval meter with export registers and an electronic time switch, capable of switching all loads to off peak overnight and at weekends.
NSP56, NEN56, NSP75, NSP76, NSP77, NSP78, NSP81, NSP82, NSP83, NSP91, NSP94, NSP95
An interval meter, capable of measuring kWh and kVAR integrated over a 30-minute period.
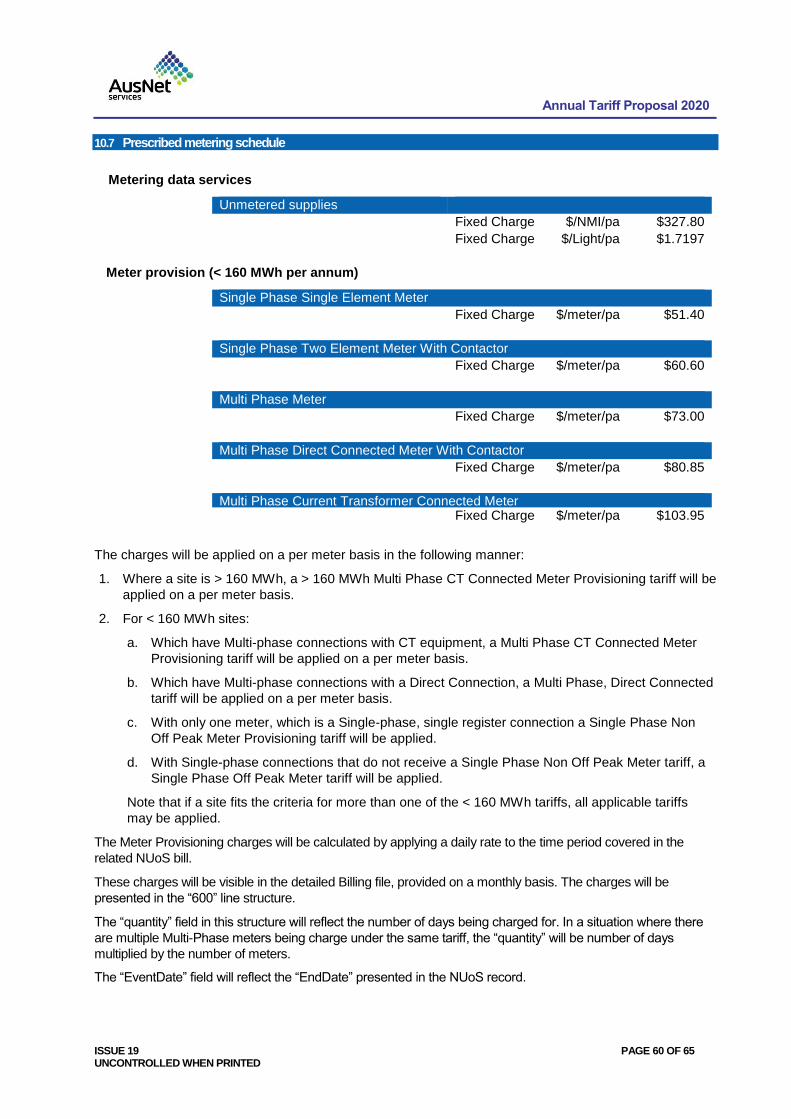
Annual Tariff Proposal 2020
ISSUE 19 PAGE 60 OF 65 UNCONTROLLED WHEN PRINTED
10.7 Prescribed metering schedule
Metering data services
Unmetered supplies
Fixed Charge $/NMI/pa $327.80
Fixed Charge $/Light/pa $1.7197
Meter provision (< 160 MWh per annum)
Single Phase Single Element Meter
Fixed Charge $/meter/pa $51.40
Single Phase Two Element Meter With Contactor
Fixed Charge $/meter/pa $60.60
Multi Phase Meter
Fixed Charge $/meter/pa $73.00
Multi Phase Direct Connected Meter With Contactor
Fixed Charge $/meter/pa $80.85
Multi Phase Current Transformer Connected Meter Fixed Charge $/meter/pa $103.95
The charges will be applied on a per meter basis in the following manner:
1. Where a site is > 160 MWh, a > 160 MWh Multi Phase CT Connected Meter Provisioning tariff will be
applied on a per meter basis.
2. For < 160 MWh sites:
a. Which have Multi-phase connections with CT equipment, a Multi Phase CT Connected Meter
Provisioning tariff will be applied on a per meter basis.
b. Which have Multi-phase connections with a Direct Connection, a Multi Phase, Direct Connected
tariff will be applied on a per meter basis.
c. With only one meter, which is a Single-phase, single register connection a Single Phase Non
Off Peak Meter Provisioning tariff will be applied.
d. With Single-phase connections that do not receive a Single Phase Non Off Peak Meter tariff, a
Single Phase Off Peak Meter tariff will be applied.
Note that if a site fits the criteria for more than one of the < 160 MWh tariffs, all applicable tariffs
may be applied.
The Meter Provisioning charges will be calculated by applying a daily rate to the time period covered in the
related NUoS bill.
These charges will be visible in the detailed Billing file, provided on a monthly basis. The charges will be
presented in the “600” line structure.
The “quantity” field in this structure will reflect the number of days being charged for. In a situation where there
are multiple Multi-Phase meters being charge under the same tariff, the “quantity” will be number of days
multiplied by the number of meters.
The “EventDate” field will reflect the “EndDate” presented in the NUoS record.
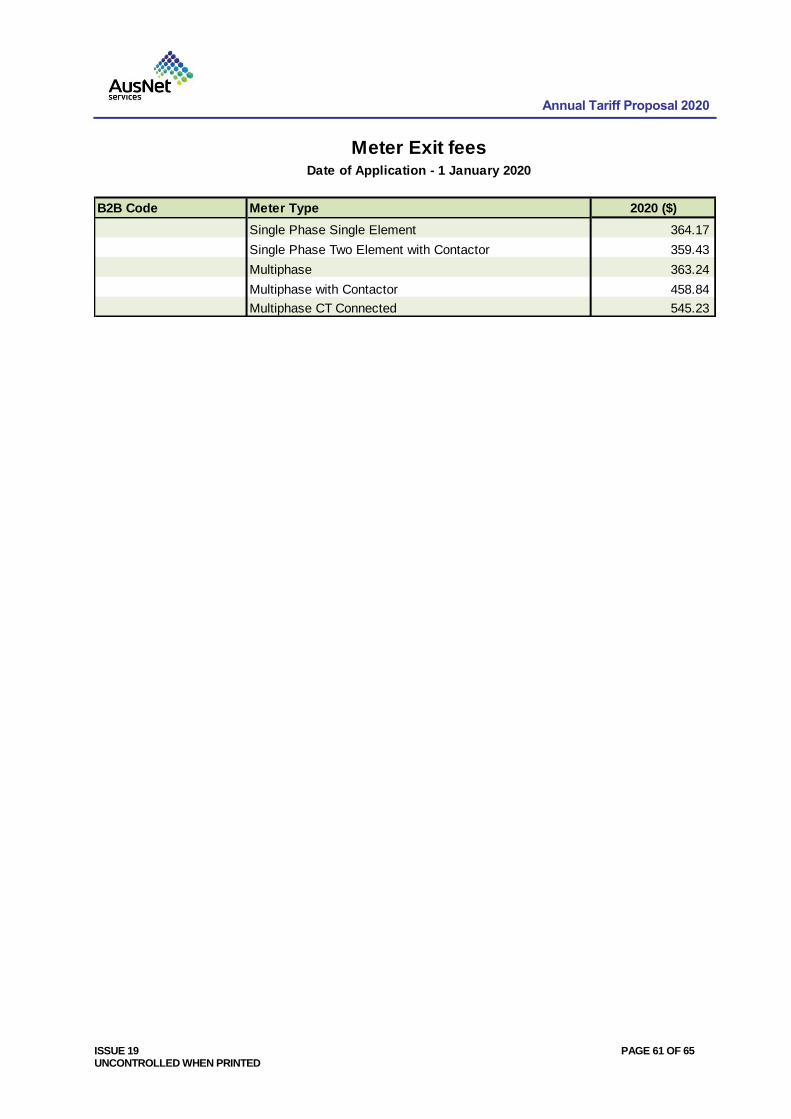
Annual Tariff Proposal 2020
ISSUE 19 PAGE 61 OF 65 UNCONTROLLED WHEN PRINTED
Meter Exit feesDate of Application - 1 January 2020
B2B Code Meter Type 2020 ($)
Single Phase Single Element 364.17
Single Phase Two Element with Contactor 359.43
Multiphase 363.24
Multiphase with Contactor 458.84
Multiphase CT Connected 545.23
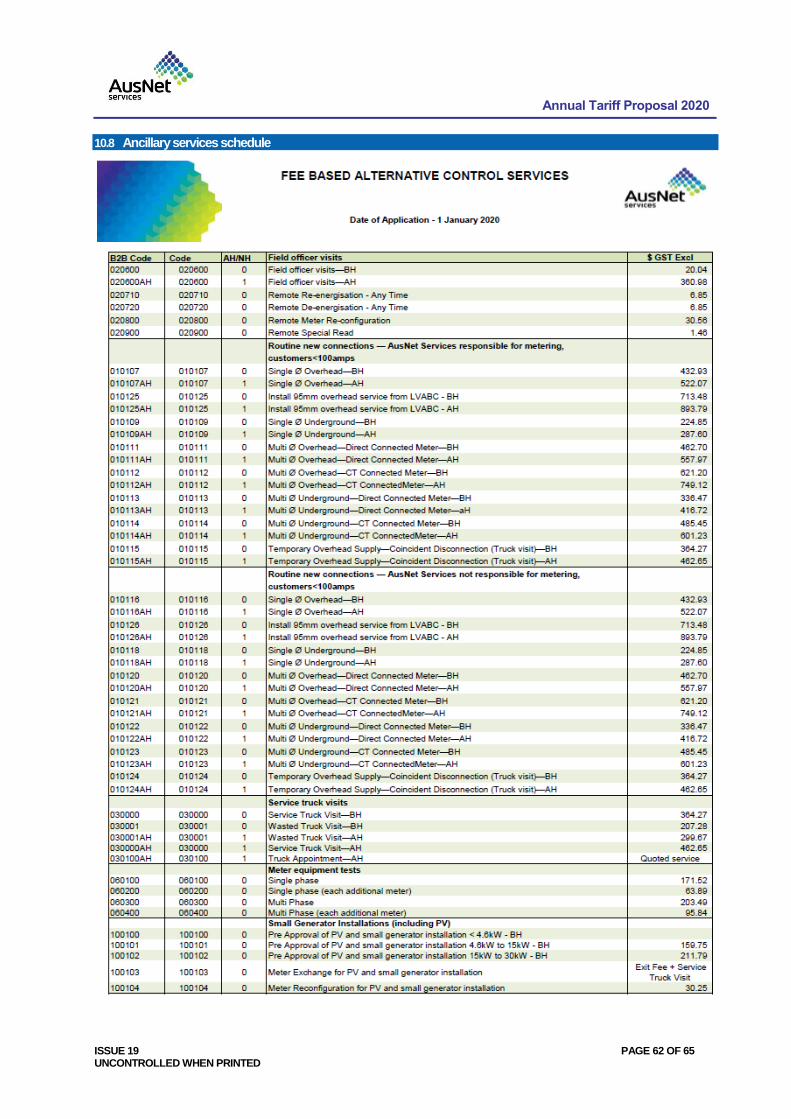
Annual Tariff Proposal 2020
ISSUE 19 PAGE 62 OF 65 UNCONTROLLED WHEN PRINTED
10.8 Ancillary services schedule
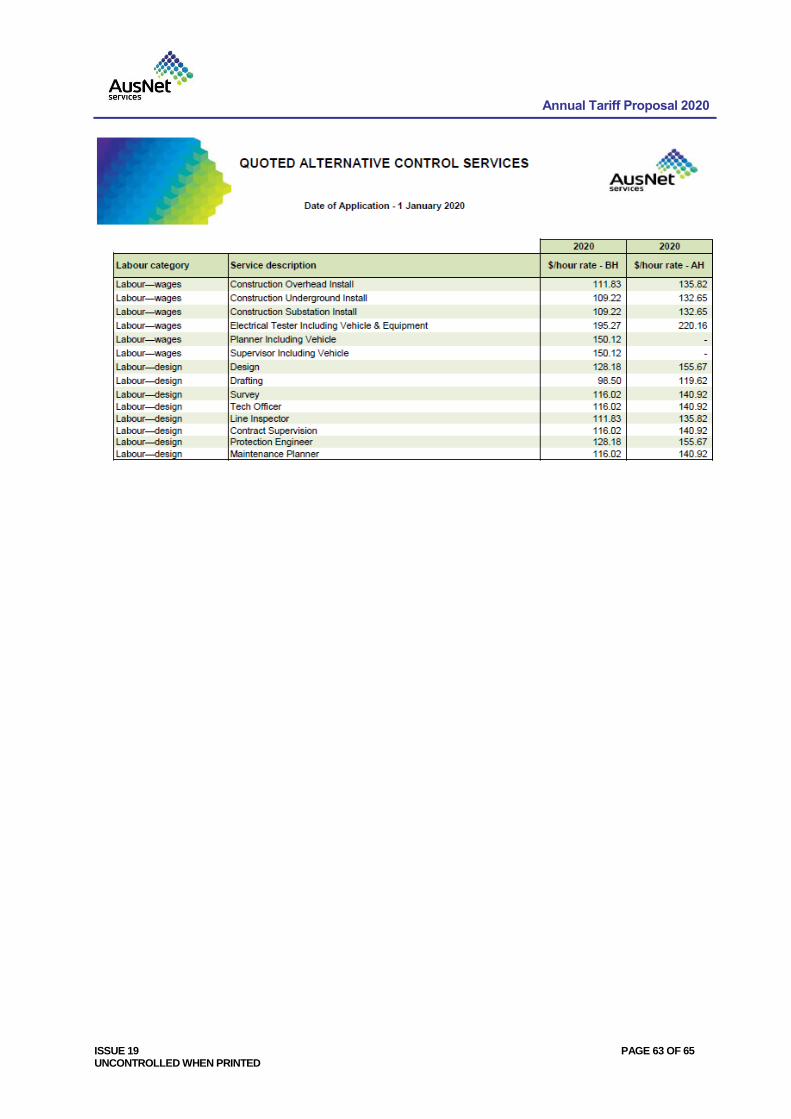
Annual Tariff Proposal 2020
ISSUE 19 PAGE 63 OF 65 UNCONTROLLED WHEN PRINTED
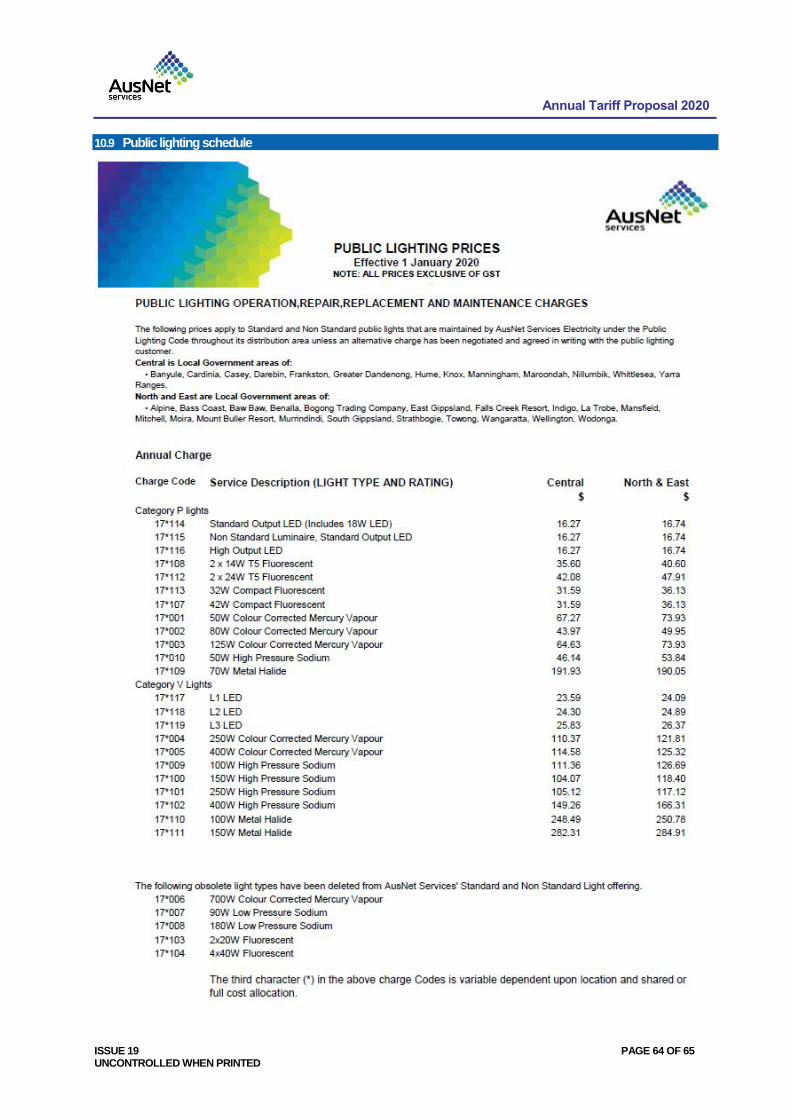
Annual Tariff Proposal 2020
ISSUE 19 PAGE 64 OF 65 UNCONTROLLED WHEN PRINTED
10.9 Public lighting schedule
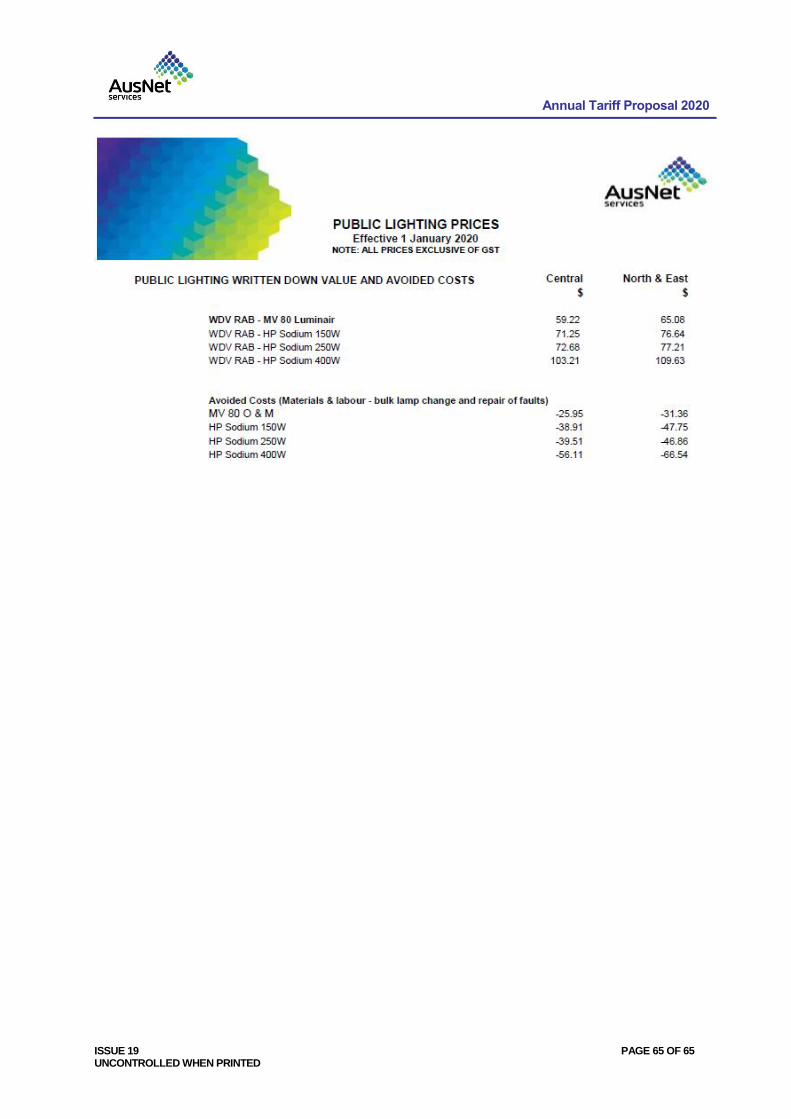
Annual Tariff Proposal 2020
ISSUE 19 PAGE 65 OF 65 UNCONTROLLED WHEN PRINTED


