88
ELECTRICITY INFORMATION 2019 FINAL EDITION DATABASE DOCUMENTATION

ELECTRICITY INFORMATION 2019 FINAL EDITION
DATABASE DOCUMENTATION

2 - ELECTRICITY INFORMATION: DATABASE DOCUMENTATION (2019 final edition)
INTERNATIONAL ENERGY AGENCY
This document provides support information for the IEA Electricity Information database. This document can be found online at: http://wds.iea.org/wds/pdf/ele_documentation.pdf. Please address your inquiries to [email protected]. Please note that all IEA data are subject to the Terms and Conditions which can be found on the IEA’s website at: www.iea.org/t&c/termsandconditions/

ELECTRICITY INFORMATION: DATABASE DOCUMENTATION (2019 final edition) - 3
INTERNATIONAL ENERGY AGENCY
TABLE OF CONTENTS
1. CHANGES FROM LAST EDITION ............................................................................... 4
2. DATABASE STRUCTURE ........................................................................................... 5
3. FLOW DEFINITIONS .................................................................................................... 9
4. PRODUCT DEFINITIONS ........................................................................................... 15
5. GEOGRAPHICAL COVERAGE ................................................................................. 30
6. COUNTRY NOTES AND SOURCES .......................................................................... 45
7. UNITS AND CONVERSIONS ..................................................................................... 85
8. ABBREVIATIONS ...................................................................................................... 88

4 - ELECTRICITY INFORMATION: DATABASE DOCUMENTATION (2019 final edition)
INTERNATIONAL ENERGY AGENCY
1. CHANGES FROM LAST EDITION In the 2019 edition of this online data service the default data display is figures rounded to zero decimal places.
However, from 2017 data onwards, further detail, up to the three decimal place level, is available where reported by the national administrations, upon selecting View > Decimals in the Menu bar. Please note that the constituent data summed to produce regional and flow aggregates may be reported at differing levels of precision. Therefore, care should be taken when using data for aggregated flows beyond the level of 0 decimal places.
Data up to and including 2016 have been rounded to 0 decimal places. Please note that this may result in some rounding errors when comparing values for aggregates to the sum of their constituents.
Note: Periods (.) are used to separate decimal places.
Moreover, in the 2019 edition the list of import origins and export destinations was expanded. As a result quanti-ties may no longer appear in the non-specified/others geographical aggregate.
Geographical coverage Lithuania became an OECD Member in July 2018. Accordingly, starting with this edition, Lithuania appears in the list of OECD Members for data starting in 1990. Prior to 1990, data for Lithuania are included in Former So-viet Union.
From 2011 data onwards, France now includes Monaco, and the following overseas departments (Guadeloupe; French Guiana; Martinique; Mayotte; and Réunion); and excludes the overseas collectivities (New Caledonia; French Polynesia; Saint Barthélemy; Saint Martin; Saint Pierre and Miquelon; and Wallis and Futuna). Prior to 2011, France includes Monaco and excludes the following overseas departments and territories: Guadeloupe; French Guiana; Martinique; Mayotte and Réunion; New Caledonia; French Polynesia; Saint Barthélemy; Saint Martin; Saint Pierre and Miquelon; and Wallis and Futuna.
South Africa became an IEA Association country in November 2018. Accordingly, South Africa is now included in the IEA and Accession/Association countries aggregate in the World file (EleHeatBal.IVT).
The country previously known as Former Yugoslav Republic of Macedonia has been renamed as Republic of North Macedonia.
Old longname New longname Shortname Old shortname (if changed)
Former Yugoslav Republic of Mace-donia
Republic of North Macedonia NORTHMACED FYROM
ELECTRICITY INFORMATION: DATABASE DOCUMENTATION (2019 final edition) - 5
INTERNATIONAL ENERGY AGENCY
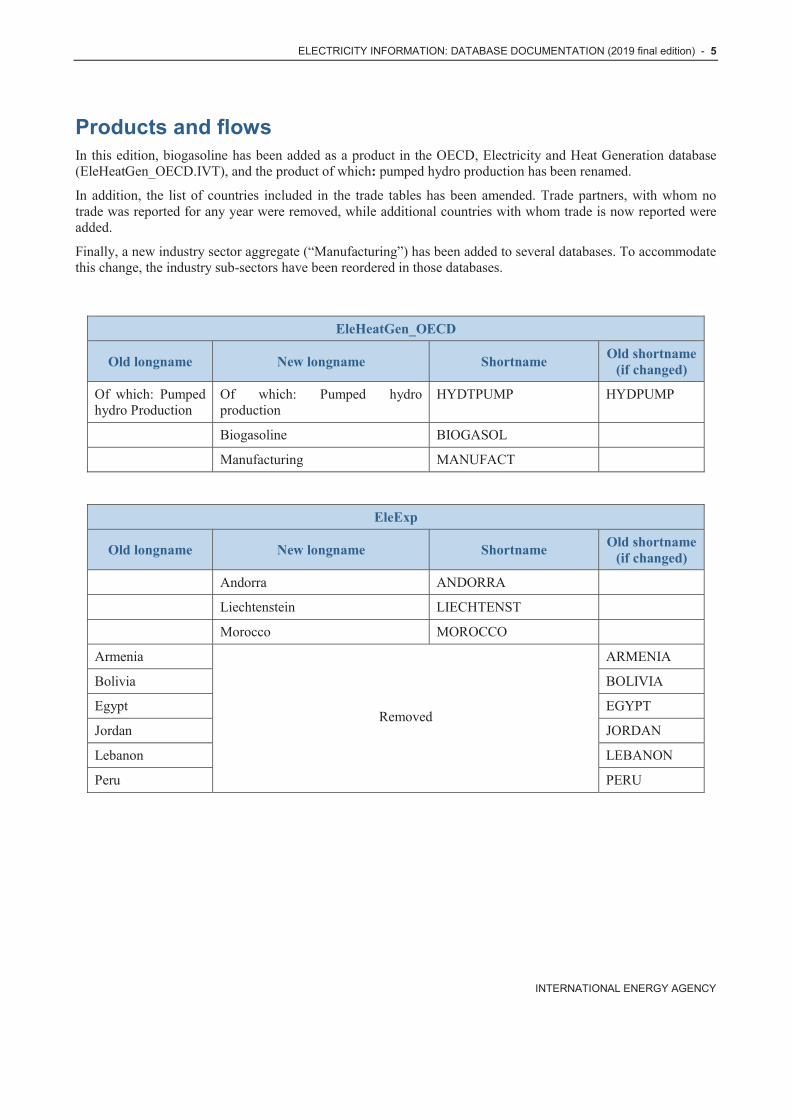
Products and flows In this edition, biogasoline has been added as a product in the OECD, Electricity and Heat Generation database (EleHeatGen_OECD.IVT), and the product of which: pumped hydro production has been renamed.
In addition, the list of countries included in the trade tables has been amended. Trade partners, with whom no trade was reported for any year were removed, while additional countries with whom trade is now reported were added.
Finally, a new industry sector aggregate (“Manufacturing”) has been added to several databases. To accommodate this change, the industry sub-sectors have been reordered in those databases.
EleHeatGen_OECD
Old longname New longname Shortname Old shortname (if changed)
Of which: Pumped hydro Production
Of which: Pumped hydro production
HYDTPUMP HYDPUMP
Biogasoline BIOGASOL
Manufacturing MANUFACT
EleExp
Old longname New longname Shortname Old shortname (if changed)
Andorra ANDORRA
Liechtenstein LIECHTENST
Morocco MOROCCO
Armenia
Removed
ARMENIA
Bolivia BOLIVIA
Egypt EGYPT
Jordan JORDAN
Lebanon LEBANON
Peru PERU

6 - ELECTRICITY INFORMATION: DATABASE DOCUMENTATION (2019 final edition)
INTERNATIONAL ENERGY AGENCY
EleImp
Old longname New longname Shortname Old shortname (if changed)
Islamic Republic of Iran IRAN
Liechtenstein LIECHTENST
Malta MALTA
Morocco MOROCCO
Argentina
Removed
ARGENTINA
Armenia ARMENIA
Bolivia BOLIVIA
Egypt EGYPT
Jordan JORDAN
Lebanon LEBANON
Peru PERU
Syria SYRIA
EleAuto
Old longname New longname Shortname Old shortname (if changed)
Manufacturing MANUFACT
Other Removed TOTOTHER
EleHeatBal
Old longname New longname Shortname Old shortname (if changed)
Manufacturing MANUFACT

ELECTRICITY INFORMATION: DATABASE DOCUMENTATION (2019 final edition) - 7
INTERNATIONAL ENERGY AGENCY
2. DATABASE STRUCTURE The database Electricity Information includes:
Annual data for: countries: 170 countries and regional aggregates (see section Geographical coverage); years: 1960-2018 (OECD countries and regions unless otherwise specified);
1960-2018 (OECD Imports and Exports to partner countries) 1971-2017 (non-OECD countries and regions; world unless otherwise specified); 2018 (provisional energy supply data)
Monthly data for: countries: 34 countries and regional aggregates (see section Geographical coverage); years: January 2000-December 2018 (OECD countries and regions unless otherwise specified);
OECD files (updated July 2019):
EleHeatBal_OECD.IVT OECD, Electricity and Heat Supply and Consumption (GWh, TJ) Electricity and heat balance (36 OECD countries + 5 aggregates; 54 flows; 2 products). Data begin in 1974.
EleHeatGen.IVT OECD, Electricity and Heat Generation (GWh, TJ, kt) Gross electricity and heat production by fuel and plant types (36 OECD countries + 5 aggregates; 6 flows; 64 products; 7 plant types).
EleAuto.IVT OECD, Net Electricity and Heat Production by Auto-producers (GWh, TJ) Net electricity and heat production by autoproducers in all plants, by sector (36 OECD countries + 5 aggregates; 41 sectors; 2 products; 4 plant types).
EleImp.IVT OECD, Electricity Imports by Origin (GWh) Electricity imports by origin (36 countries + 5 aggregates; 48 countries of origin).
EleExp.IVT OECD, Electricity Exports by Destination (GWh) Electricity exports by destination (36 countries + 5 aggregates; 50 destinations).
EleCap.IVT OECD, Net Electrical Capacity (MWe) Net electrical capacity by type of energy (36 countries + 5 aggregates; 28 sources; 3 plant types).

8 - ELECTRICITY INFORMATION: DATABASE DOCUMENTATION (2019 final edition)
INTERNATIONAL ENERGY AGENCY
EleMonthly.IVT OECD, Monthly Net Electricity Supply (GWh) Monthly net electricity production from main sources and trades from January 2000 to December 2018 (35 countries + 5 aggregates; 21 flows).
Data for 2018 are based on the official mini-questionnaire submissions of countries. However, some data have been estimated by the IEA secretariat.
World files (updated July 2019):
EleHeatBal.IVT World, Electricity and Heat Supply and Consumption (GWh, TJ) Reduced electricity and heat balance (145 countries + 22 aggregates; 8 flows).
Data for 2018 are based on the official mini-questionnaire submissions of countries. However, some data have been estimated by the IEA secretariat.

ELECTRICITY INFORMATION: DATABASE DOCUMENTATION (2019 final edition) - 9
INTERNATIONAL ENERGY AGENCY
3. FLOW DEFINITIONS Supply
Flow Short name Definition
Gross production GROSPROD This is the total gross electricity or heat production.
Own use OWNUSE This is the difference between Gross and Net production, i.e. it is the electricity and heat used by power station auxiliaries directly related to generation and including that used for fuel handling plant, cooling water plant, power station services, heating, lighting, work-shops and administrative buildings directly associated with the power station during both on-load and off-load periods.
Net production NETPROD This is the total net electricity or heat production.
Imports TOTIMPSB Amounts are considered as imported when they have crossed the national territorial boundaries of the country. If electricity is “wheeled” or transited through a country, the amount is shown as both an import and an export.
Exports TOTEXPSB Amounts are considered as exported when they have crossed the national territorial boundaries of the country. If electricity is “wheeled” or transited through a country, the amount is shown as both an import and an export.
Used for heat pumps EHEAT This is the electricity used in heat pumps (as defined previously).
Used for electric boilers
EBOILER This is the electricity used in electric boilers.
Used for pumped Storage
EPUMPST This is the electricity consumed by pumping in hydro-electric power plants.
Used for electricity production
EELE Heat from chemical processes used as a primary energy form, and purchased secondary waste heat consumed as input to electricity generation.

10 - ELECTRICITY INFORMATION: DATABASE DOCUMENTATION (2019 final edition)
INTERNATIONAL ENERGY AGENCY
Supply Flow Short name Definition
Energy supplied SUPPLY For electricity, this is the electrical energy supplied from the plant. In the case of a national network this is equal to the sum of the net electrical energy production supplied by all power stations within the country, reduced by the amount used simultaneously for pump-ing as well as the amount used for heat sold using heat pumps and electric boilers. It is then reduced or increased by exports to or im-ports from abroad. For heat, this is equal to the sum of the net heat production for sale by all plants within a country reduced or increased by exports or imports from abroad.
Transmission and distribution Losses
DISTLOSS This comprises all losses due to transport and distribution of electri-cal energy and heat. For electricity, losses in transformers which are not considered as integral parts of the power plants are also included.
Total consumption (calculated)
TFCCALC This equals the Energy Supplied minus Transmission and Distribu-tion Losses.
Statistical difference STATDIFF This equals the Total Consumption (calculated) – Total Con-sumption (observed).
Total consumption (observed)
TFCOBS This is the amount actually recorded in surveys of end-use sectors. It should, in principle, correspond to the total consumption (calculated).

ELECTRICITY INFORMATION: DATABASE DOCUMENTATION (2019 final edition) - 11
INTERNATIONAL ENERGY AGENCY
Energy Industry Flow Short name Definition
Total energy industry TOTENGY All electricity and purchased heat consumed by the energy sector to support the extraction (mining, oil and gas production) and plant operation of transformation activities. It exclude Own use by plant, Used for pumped storage, Used by heat pumps and Used for elec-tric boilers, which are reported elsewhere. Heat consumed by auto-producers for their own use is not included. Consumption in sup-port of the operation of pipelines (e.g. oil, gas, and coal slurry) is reported in the Transport sector. The Energy Sector covers ISIC1 Divisions 05, 06, 19 and 35, Group 091, Classes 0892 and 0721 (NACE2 Divisions 05, 06 19, and 35, Group 09.1, Classes 08.92 and 07.21). The Energy sector includes the manufacture of chemical materials for atomic fission and fusion and the products of these processes. Electricity and heat used in the manufacture of fuel briquettes and packaged fuel from coal, lignite or peat and consumption in coke ovens, gas works, blast furnaces, liquefaction plants, gasification plants, charcoal production plants and other transformation industries is also reported here.
Coal mines EMINES Electricity and purchased heat consumed to support the extraction and preparation of coal within the coal mining industry.
Oil and gas extraction EOILGASEX Electricity and purchased heat consumed to support the operation of oil and gas extraction facilities.
Patent fuel plants EPATFUEL Electricity and purchased heat consumed at patent fuel plants.
Coke ovens ECOKEOVS Electricity and purchased heat consumed at coke ovens.
Gas works EGASWKS Electricity and purchased heat consumed at gas works plants and coal gasification plants.
Blast furnaces EBLASTFUR Electricity and purchased heat consumed at blast furnaces operations.
Gasification plants for biogas
EBIOGAS Electricity and purchased heat consumed at biogas gasification plants.
BKB/PB plants EBKB Electricity and purchased heat consumed at briquetting plants.
Oil refineries EREFINER Electricity and purchased heat consumed at oil refineries.
Coal liquefaction plants ECOALLIQ Electricity and purchased heat consumed at coal liquefaction plants.
Liquefaction (LNG) / regasification plants
ELNG Electricity and purchased heat consumed at natural gas liquefaction and regasification plants.
Gas-to-liquids (GTL) plants
EGTL Electricity and purchased heat consumed at gas-to-liquids plants.
Nuclear industry ENUC Electricity and purchased heat consumed at nuclear power plants.
Charcoal production plants
ECHARCOAL Electricity and purchased heat consumed at charcoal production plants.
Not elsewhere specified (energy)
ENONSPEC Electricity and purchased heat consumed for other purposes not reported above.

12 - ELECTRICITY INFORMATION: DATABASE DOCUMENTATION (2019 final edition)
INTERNATIONAL ENERGY AGENCY
Final Consumption Flow Short name Definition
Total industry TOTIND Consumption of industry is specified in the following sub-sectors (energy used for transport by industry is not included here but is reported under transport):
Mining and quarrying MINING [ISIC Divisions 07 and 08 + Group 099 (NACE Divisions 07 and 08 + Group 09.9)] Mining (excluding fuels) and quarrying.
Construction CONSTRUC [ISIC and NACE Divisions 41, 42 and 43].
Manufacturing MANUFACT Manufacturing refers to the sum of the following industrial sub-sectors: • Iron and Steel: • Chemical and petrochemical: • Non-ferrous metals • Non-metallic minerals • Transport equipment • Machinery • Food and tobacco • Paper, pulp and print • Wood and wood products • Textile and leather Definitions of the sub-sectors themselves can be found under the listing for each respective sub-sector below.
Iron and Steel IRONSTL [ISIC Group 241 + Class 2431 (NACE Groups 24.1, 24.2, 24.3, Classes 24.51 and 24.52)]. To avoid double counting, electricity used in blast furnaces is reported in the Energy sector.
Chemical and petrochemical
CHEMICAL [ISIC and NACE Divisions 20 and 21]
Non-ferrous metals NONFERR [ISIC Group 242 + Class 2432 (NACE Group 24.4, Classes 24.53 and 24.54)] Basic industries.
Non-metallic minerals NONMET [ISIC and NACE Division 23] Such as glass, ceramic, cement, and other building materials industries.
Transport equipment TRANSEQ [ISIC and NACE Divisions 29 and 30]
Machinery MACHINE [ISIC and NACE Divisions 25, 26, 27 and 28] Fabricated metal products, machinery and equipment other than transport equipment.
Food and tobacco FOODPRO [ISIC and NACE Divisions 10, 11 and 12].
Paper, pulp and print PAPERPRO [ISIC and NACE Divisions 17 and 18].
Wood and wood products
WOODPRO [ISIC and NACE Division 16] Wood and wood products other than pulp and paper.

ELECTRICITY INFORMATION: DATABASE DOCUMENTATION (2019 final edition) - 13
INTERNATIONAL ENERGY AGENCY
Final Consumption Flow Short name Definition
Textile and leather TEXTILES [ISIC and NACE Divisions 13, 14 and 15].
Not elsewhere specified - industry
INONSPEC [ISIC and NACE Divisions 22, 31 and 32] Any manufacturing industry not included above. Note: Most countries have difficul-ties supplying an industrial breakdown for all fuels. In these cases, the non-specified industry row has been used. Regional aggregates of industrial consumption should therefore be used with caution.
Total transport TOTTRANS Electricity used for all transport activity irrespective of the eco-nomic sector, in which the activity occurs (except military fuel use, see Not elsewhere specified - Other). Electricity and pur-chased heat used for heating and lighting at railway and bus sta-tions and airports is reported in Commercial and public services. [ISIC and NACE categories: Divisions 49, 50 and 51] Consump-tion in transport covers all transport activity and is divided into the following sub-sectors: rail, pipeline, road and non-specified transport.
Rail RAIL Electricity consumption for use in rail traffic, including industrial railways and consumption for use in rail transport as part of urban or suburban transport systems.
Pipeline transport PIPELINE Electricity consumption in support of the operations of both sub-marine and overland pipelines transporting gases, liquids, slurries and other commodities up to the distributors network, including the energy used for pump stations and maintenance of the pipe-line. Use for pipeline distribution of natural or manufactured gas, hot water or steam (ISIC 35) from the distributor to the final users is excluded and is reported in the Energy sector while use for the final distribution of water (ISIC 36) to household, industrial, commercial and other users is included in the Commercial/public services sector.
Road ROAD Electricity use in road vehicles. This includes electricity consump-tion in road transport vehicles such as electric buses, electric cars and trolley buses when the electricity is supplied from external sources to directly generate mechanical energy or used to charge batteries. Include use by agricultural vehicles on highways. Exclude use in stationary engines (see Not elsewhere specified – Other), non-highway use in tractors (see Agriculture/forestry – Other sec-tor), and military use (see Not elsewhere specified – Other). It is to be noted that the consumption of vehicles running on rails in ur-ban transport (trams, metro, etc.) is included under Rail transport.
Not elsewhere specified - transport
TRNONSPE Electricity use for transport activities not included elsewhere.
Residential sector RESIDENT [ISIC and NACE Divisions 97 and 98] Includes consumption by households, excluding fuels used for transport. Includes house-holds with employed persons.
14 - ELECTRICITY INFORMATION: DATABASE DOCUMENTATION (2019 final edition)
INTERNATIONAL ENERGY AGENCY
Final Consumption Flow Short name Definition
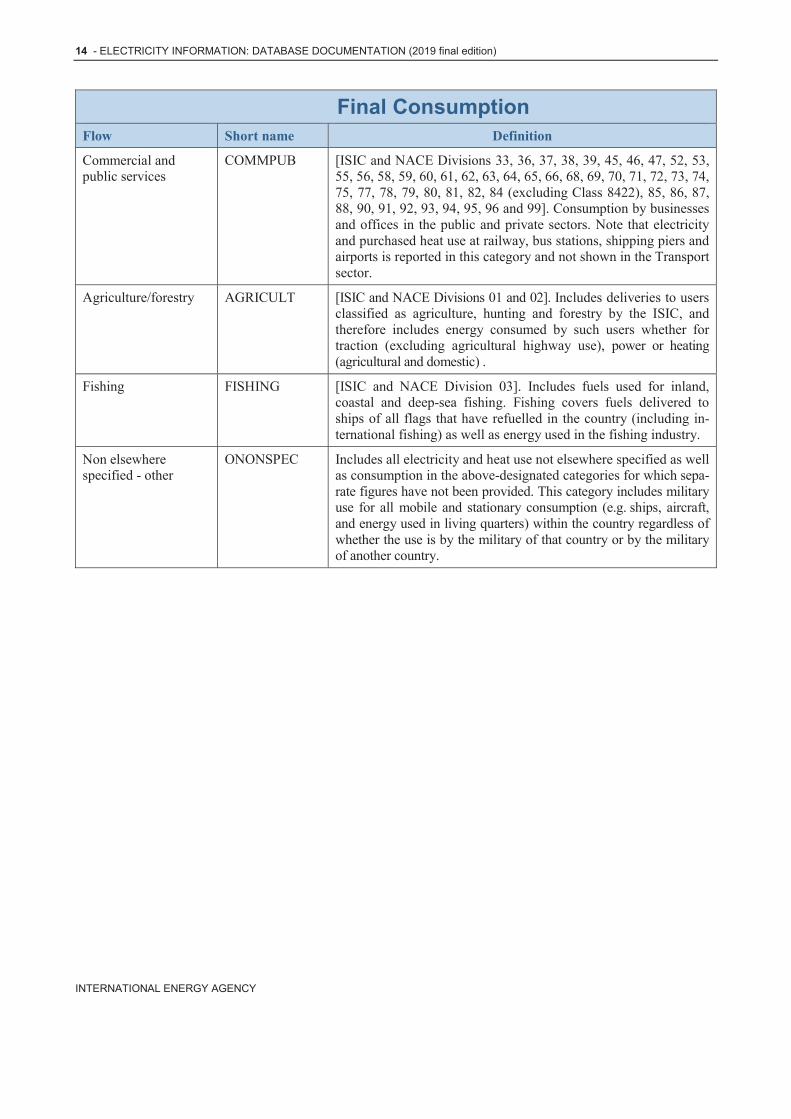
Commercial and public services
COMMPUB [ISIC and NACE Divisions 33, 36, 37, 38, 39, 45, 46, 47, 52, 53, 55, 56, 58, 59, 60, 61, 62, 63, 64, 65, 66, 68, 69, 70, 71, 72, 73, 74, 75, 77, 78, 79, 80, 81, 82, 84 (excluding Class 8422), 85, 86, 87, 88, 90, 91, 92, 93, 94, 95, 96 and 99]. Consumption by businesses and offices in the public and private sectors. Note that electricity and purchased heat use at railway, bus stations, shipping piers and airports is reported in this category and not shown in the Transport sector.
Agriculture/forestry AGRICULT [ISIC and NACE Divisions 01 and 02]. Includes deliveries to users classified as agriculture, hunting and forestry by the ISIC, and therefore includes energy consumed by such users whether for traction (excluding agricultural highway use), power or heating (agricultural and domestic) .
Fishing FISHING [ISIC and NACE Division 03]. Includes fuels used for inland, coastal and deep-sea fishing. Fishing covers fuels delivered to ships of all flags that have refuelled in the country (including in-ternational fishing) as well as energy used in the fishing industry.
Non elsewhere specified - other
ONONSPEC Includes all electricity and heat use not elsewhere specified as well as consumption in the above-designated categories for which sepa-rate figures have not been provided. This category includes military use for all mobile and stationary consumption (e.g. ships, aircraft, and energy used in living quarters) within the country regardless of whether the use is by the military of that country or by the military of another country.

ELECTRICITY INFORMATION: DATABASE DOCUMENTATION (2019 final edition) - 15
INTERNATIONAL ENERGY AGENCY
4. PRODUCT DEFINITIONS Electricity and Heat Output
Electricity is expressed in gigawatt hours and heat is expressed in terajoules. Direct use of geothermal and solar thermal is in terajoules on a net calorific value basis.
Product Short name Definition
Electricity ELECTR Gross electricity production is the sum of the electrical energy production by all the generating sets concerned (including pumped storage) measured at the output terminals of the main generators. Net electricity production is equal to the gross electricity produc-tion less the electrical energy absorbed by the generating auxilia-ries and the losses in the main generator transformers (Own use). Production in hydro stations includes production from pumped storage plants.
Heat HEAT Gross heat production is the total heat produced by the installation and includes the heat used by the installation’s auxiliaries which use a hot fluid (space heating, liquid fuel heating etc.) and losses in the installation/network heat exchanges, as well as heat from chemical processes used as a primary energy form. Note that for autoproducers, heat used by the undertaking for its own processes is not included here; only heat sold to third parties is reported. As only heat sold to third parties is reported, gross heat production for autoproducers will be equal to net heat production. Net heat production is the heat supplied to the distribution system as determined from measurements of the outgoing and return flows.

16 - ELECTRICITY INFORMATION: DATABASE DOCUMENTATION (2019 final edition)
INTERNATIONAL ENERGY AGENCY
Primary Electricity and Heat Sources Electricity is expressed in gigawatt hours and heat is expressed in terajoules.
Direct use of geothermal and solar thermal is in terajoules on a net calorific value basis.
Product Short name Definition
Nuclear NUCLEAR Energy released by nuclear fission or nuclear fusion.
Hydro HYDRO Potential and kinetic energy of water converted into electricity in hydroelectric plants. Electricity from pure and mixed pump storage plants is included in both the total hydro and the pumped hydro.
Pumped hydro production
HYDTPUMP Electricity produced in hydroelectric power stations from water pumped above the station.
Geothermal GEOTHERM Energy available as heat emitted from within the earth’s crust, usually in the form of hot water or steam. It is exploited at suitable sites: for electricity generation using dry stream or high enthalpy
brine after flashing directly as heat for district heating, agriculture, etc.
Solar SOLAR Solar radiation exploited for hot water production and electrici-ty/heat generation. It includes solar photovoltaic and solar thermal. Passive solar energy for the direct heating, cooling and lighting
of dwellings or other buildings is not included.
Solar photovoltaic SOLARPV Converts sunlight into electricity by the use of solar cells usually made of semi-conducting materials which exposed to light generate electrical current.
Solar thermal SOLARTH It can consist of: solar thermal-electric plants, or equipment for the production of domestic/commercial hot wa-
ter or for the seasonal heating of swimming pools (e.g. flat plate collectors).
Tidal, wave and ocean TIDE Mechanical energy derived from tidal movement, wave motion or ocean current and exploited for electricity generation.
Wind WIND Kinetic energy of wind exploited for electricity generation in wind turbines.
Combustible Fuels Electricity is expressed in gigawatt hours and heat is expressed in terajoules under this fuel aggregate.
Product Short name Definition
Combustible fuels COMBFUEL Refers to fuels that are capable of igniting or burning, i.e. reacting with oxygen to produce a significant rise in temperature. They are combusted directly for the production of electricity and/or heat.

ELECTRICITY INFORMATION: DATABASE DOCUMENTATION (2019 final edition) - 17
INTERNATIONAL ENERGY AGENCY
Coal and Coal Derived Products With the exception of coal gases, the fuels in this section are expressed both in thousand tonnes and terajoules.
The coal gases are expressed only in terajoules on a gross calorific value basis.
Product Short name Definition
Hard coal and patent fuel
HARDCOAL Prior to 1990, hard coal includes anthracite, coking coal, other bitumi-nous coal, patent fuel, coke oven coke and gas coke.
Brown coal and BKB BROWN Prior to 1990, brown coal includes sub-bituminous coal, lignite, coal tar and BKB.
Coal gases MANGAS Prior to 1990, coal gases include coke oven gas, blast furnace gas oxy-gen steel furnace gas.
Anthracite ANTCOAL High rank coal normally used for industrial and residential applications. It has generally less than 10% volatile matter and a high carbon content (about 90% fixed carbon). Its gross calorific value is equal to or greater than 24 000 kJ/kg (5 732 kcal/kg) on an ash-free but moist basis.
Coking coal COKCOAL Bituminous coal with a quality that allows the production of a coke suitable to support a blast furnace charge. Its gross calorific value is equal to or greater than 24 000 kJ/kg (5 732 kcal/kg) on an ash-free but moist basis.
Other bituminous coal BITCOAL Coal used for steam raising purposes and includes all bituminous coal that is not included under coking coal nor anthracite. It is characterised by higher volatile matter than anthracite (more than 10%) and lower carbon content (less than 90% fixed carbon). Its gross calorific value is equal to or greater than 24 000 kJ/kg (5 732 kcal/kg) on an ash-free but moist basis.
Sub-bituminous coal SUBCOAL Non-agglomerating coal with a gross calorific value equal to or greater than 20 000 kJ/kg (4 777 kcal/kg) and less than 24 000 kJ/kg (5 732 kcal/kg) containing more than 31% volatile matter on an ash free moist basis.
Lignite LIGNITE Non-agglomerating coal with a gross calorific value less than 20 000 kJ/kg (4 777 kcal/kg) and greater than 31% volatile matter on an ash free moist basis.
Patent fuel PATFUEL A composition fuel manufactured from hard coal fines with the addition of a binding agent. The amount of patent fuel produced is, therefore, slightly higher than the actual amount of coal consumed in the transformation process.
Coke Oven Coke and Lignite Coke
OVENCOKE The solid product obtained from the carbonisation of coal, princi-pally coking coal, at high temperature. It is low in moisture content and volatile matter. Coke oven coke is used mainly in the iron and steel industry, acting as energy source and chemical agent. Coke breeze and foundry coke are included in this category. Semi-coke (a solid product obtained from carbonisation of coal at low temper-ature) is included in this category. This heading also includes coke, coke breeze and semi-coke made from lignite coal.
Gas coke GASCOKE By-product of hard coal used for the production of town gas in gas works. Gas coke is used for heating purposes.

18 - ELECTRICITY INFORMATION: DATABASE DOCUMENTATION (2019 final edition)
INTERNATIONAL ENERGY AGENCY
Coal and Coal Derived Products With the exception of coal gases, the fuels in this section are expressed both in thousand tonnes and terajoules.
The coal gases are expressed only in terajoules on a gross calorific value basis.
Product Short name Definition
Coal tar COALTAR A result of the destructive distillation of bituminous coal or of the low-temperature carbonisation of brown coal. Coal tar from bitu-minous coal is the liquid by-product of the distillation of coal to make coke in the coke oven process. Coal tar can be further dis-tilled into different organic products (e.g. benzene, toluene, naph-thalene), which normally would be reported as a feedstock to the petrochemical industry.
BKB (Brown coal briquettes)
BKB A composition fuel manufactured from lignite coal, or sub-bituminous coal, produced by briquetting under high pressure without the addition of a binding agent. These figures include dried lignite fines and dust.
Gas works gas GASWKSGS Covers all types of gases produced in public utility or private plants, whose main purpose is manufacture, transport and distribu-tion of gas. It includes gas produced by carbonisation (including gas produced by coke ovens and transferred to gas works gas), by total gasification with or without enrichment with oil products (LPG, residual fuel oil, etc.), and by reforming and simple mixing of gases and/or air. The quantity of fuel is reported on a gross calo-rific value basis.
Coke oven gas COKEOVGS Obtained as a by-product of the manufacture of coke oven coke for the production of iron and steel. The quantity of fuel is reported on a gross calorific value basis.
Blast furnace gas BLFURGS Produced during the combustion of coke in blast furnaces in the iron and steel industry. It is recovered and used as a fuel partly within the plant and partly in other steel industry processes or in power stations equipped to burn it. The quantity of fuel is reported on a gross calorific value basis. In addition, off-gases from all iron-production reduction processes utilising air as the oxygen source (such as Direct reduced iron) are reported here.
Other recovered gases OGASES By-product of the production of steel in an oxygen furnace, recov-ered on leaving the furnace. The gases are also known as converter gas, LD gas or BOS gas. Also covers non-specified manufactured gases not mentioned above, such as combustible gases of solid car-bonaceous origin recovered from manufacturing and chemical pro-cesses not elsewhere defined. The quantity of recuperated fuel is reported on a gross calorific value basis.
Peat PEAT A combustible soft, porous or compressed, fossil sedimentary de-posit of plant origin with high water content (up to 90 per cent in the raw state), easily cut, of light to dark brown colour. Peat used for non-energy purposes is not included. Milled peat is included here.
Peat products PEATPROD Products such as peat briquettes derived directly or indirectly from sod peat and milled peat.

ELECTRICITY INFORMATION: DATABASE DOCUMENTATION (2019 final edition) - 19
INTERNATIONAL ENERGY AGENCY
Coal and Coal Derived Products With the exception of coal gases, the fuels in this section are expressed both in thousand tonnes and terajoules.
The coal gases are expressed only in terajoules on a gross calorific value basis.
Product Short name Definition
Oil shale and oil sands
OILSHALE Oil shale and oil sands are sedimentary rock which contains organ-ic matter in the form of kerogen. Kerogen is a waxy hydrocar-bon-rich material regarded as a precursor of petroleum. Oil shale may be burned directly or processed by heating to extract shale oil. Shale oil and other products derived from liquefaction are reported under “Other oil products”.
Crude, NGL and Petroleum Products The fuels in this section are expressed in both thousand tonnes and in terajoules on a gross calorific basis.
Product Short name Definition
Liquid Fuels and Refinery Gas
LIQFUELS Prior to 1990, liquid fuels include all petroleum products (crude oil, NGL, refinery gas, LPG, naphtha, jet fuel, other kerosene, gas/diesel oil, residual fuel oil, bitumen, petroleum coke, other oil products) and refinery gases.
Crude oil CRUDEOIL A mineral oil consisting of a mixture of hydrocarbons of natural origin and associated impurities, such as sulphur. It exists in the liquid phase under normal surface temperatures and pressure and its physical characteristics (density, viscosity, etc.) are highly vari-able. It includes field or lease condensates (separator liquids) which are recovered from associated and non-associated gas where it is commingled with the commercial crude oil stream.
Natural gas liquids NGL Liquid or liquefied hydrocarbons recovered from natural gas in separation facilities or gas processing plants. Natural gas liquids include ethane, propane, butane (normal and iso-), (iso) pentane and pentanes plus (sometimes referred to as natural gasoline or plant condensate).
Refinery gas REFINGAS A mixture of non-condensed gases mainly consisting of hydrogen, methane, ethane and olefins obtained during distillation of crude oil or treatment of oil products (e.g. cracking) in refineries. This also includes gases which are returned from the petrochemical industry.
Liquefied petroleum gases
LPG Are light paraffinic hydrocarbons derived from the refinery pro-cesses, crude oil stabilisation and natural gas processing plants. They consist mainly of propane (C3H8) and butane (C4Hl0) or a combination of the two. They could also include propylene, butyl-ene, isobutene and isobutylene. LPG are normally liquefied under pressure for transportation and storage.

20 - ELECTRICITY INFORMATION: DATABASE DOCUMENTATION (2019 final edition)
INTERNATIONAL ENERGY AGENCY
Crude, NGL and Petroleum Products The fuels in this section are expressed in both thousand tonnes and in terajoules on a gross calorific basis.
Product Short name Definition
Naphtha NAPHTHA A feedstock destined for either the petrochemical industry (e.g. ethylene manufacture or aromatics production) or for gasoline production by reforming or isomerisation within the refinery. Naphtha comprises material in the 30oC and 2l0oC distillation range or part of this range.
Kerosene type jet fuel JETKERO A distillate used for aviation turbine power units. It has the same distillation characteristics between 150oC and 300oC (generally not above 250oC) and flash point as kerosene. In addition, it has par-ticular specifications (such as freezing point) which are established by the International Air Transport Association (IATA).
Kerosene OTHKERO Kerosene comprises refined petroleum distillate and is used in sec-tors other than aircraft transport. It distils between 150oC and 300oC.
Gas/diesel oil GASDIES A medium distillate distilling between 180oC and 380oC. It is comprised of road diesel, heating and other gasoil.
Fuel oil RESFUEL This covers all residual (heavy) fuel oils (including those obtained by blending). Kinematic viscosity is above 10 cSt at 80oC. The flash point is always above 50oC and density is always more than 0.90 kg/l.
Bitumen BITUMEN A solid, semi-solid or viscous hydrocarbon with a colloidal struc-ture that is brown to black in colour. It is obtained by vacuum dis-tillation of oil residues from atmospheric distillation of crude oil. Bitumen is often referred to as asphalt and is primarily used for surfacing of roads and for roofing material. This category includes fluidised and cut back bitumen as well as Orimulsion.
Petroleum coke PETCOKE A black solid by-product, obtained mainly by cracking and carbon-ising petroleum derived feedstock, vacuum bottoms, tar and pitch-es in processes such as delayed coking or fluid coking. It consists mainly of carbon (90 to 95%) and has a low ash content. It is used as a feedstock in coke ovens for the steel industry, for heating pur-poses, for electrode manufacture and for production of chemicals. The two most important qualities are "green coke" and "calcinated coke". This category also includes "catalyst coke" deposited on the catalyst during refining processes; this coke is not recoverable and is usually burned as refinery fuel.
Non-specified petroleum products
OPRODS All products not specifically mentioned above, for example: tar, sulphur, and shale oil. Oil products not specifically mentioned above.

ELECTRICITY INFORMATION: DATABASE DOCUMENTATION (2019 final edition) - 21
INTERNATIONAL ENERGY AGENCY
Gas Natural gas is expressed in terajoules on a gross calorific value basis.
Product Short name Definition
Natural gas and gas works gas
GAS Prior to 1990, this aggregate includes natural gas and gas works gas.
Natural gas NATGAS Consists mainly of methane occurring naturally in underground deposits. This includes colliery gas. The quantity of fuel used is reported on a gross calorific value basis.
Biofuels and Wastes The fuels in this section are expressed in terajoules on a net calorific value basis, with the exception of bio-diesel, liquid biofuels and non-specified combustible renewables and waste, which are in thousand tonnes.
Product Short name Definition
Municipal waste MUNWASTE Prior to 1990, municipal waste consists of products that are com-busted directly to produce heat and/or power and comprises wastes produced by households, industry, hospitals and the tertiary sector that are collected by local authorities for incineration at specific installations. After 1989, municipal waste is split into renewable and non-renewable.
Industrial waste INDWASTE Wastes of industrial non-renewable origin (solids or liquids) combust-ed directly for the production of electricity and/or heat. Renewable industrial waste is reported in the Solid biomass, Biogas and/or Liquid Biofuels categories. The quantity of fuel used is reported on a net calorific value basis.
Municipal waste (renewable)
MUNWASTER Portion of waste produced by households, industry, hospitals and the tertiary sector which is biological material collected by local authorities and incinerated at specific installations. The quantity of fuel used is reported on a net calorific value basis.
Municipal waste (non-renewable)
MUNWASTEN Portion of waste produced by households, industry, hospitals and the tertiary sector which is non-biological material collected by local authorities and incinerated at specific installations. The quan-tity of fuel used is reported on a net calorific value basis.

22 - ELECTRICITY INFORMATION: DATABASE DOCUMENTATION (2019 final edition)
INTERNATIONAL ENERGY AGENCY
Biofuels and Wastes The fuels in this section are expressed in terajoules on a net calorific value basis, with the exception of bio-diesel, liquid biofuels and non-specified combustible renewables and waste, which are in thousand tonnes.
Product Short name Definition
Solid biofuels SBIOFUELS Covers organic, non-fossil material of biological origin which may be used as fuel for heat production or electricity generation. It comprises: Charcoal: covers the solid residue of the destructive distilla-
tion and pyrolysis of wood and other vegetal material. Fuelwood, wood residues and by-products: Fuelwood or
firewood (in log, brushwood, pellet or chip form) obtained from natural or managed forests or isolated trees. Also includ-ed are wood residues used as fuel and in which the original composition of wood is retained. Charcoal and black liquor are excluded. The quantity of fuel used is reported on a net calorific value basis.
Black liquor: Energy from the alkaline-spent liquor obtained from the digesters during the production of sulphate or soda pulp required for paper manufacture.
Bagasse: Fuel obtained from the fibre which remains after juice extraction in sugar cane processing.
Animal waste: Energy from excreta of animals, meat and fish residues which, when dry, are used directly as a fuel. This ex-cludes waste used in anaerobic fermentation plants. Fuel gases from these plants are included under biogases.
Other vegetal materials and residuals: Biofuels not specified elsewhere and including straw, vegetable husks, ground nut shells, pruning brushwood, olive pomace and other wastes arising from the maintenance, cropping and processing of plants.
Biogas BIOGASES A gas composed principally of methane and carbon dioxide produced by anaerobic digestion of biomass, or by thermal processes. The quantity of fuel used is reported on a net calorific value basis. It in-cludes Landfill gas, Sewage sludge gas, Other biogases from an-aerobic digestion and Biogases from thermal processes.
Landfill gas LANDFILL Landfill gas is formed by the digestion of landfilled wastes. Data for inputs and outputs to heat production and electricity generation are available up to 2011.
Sewage sludge gas SLUDGEGS Sewage sludge gas, produced from the anaerobic fermentation of sewage sludge. Data for inputs and outputs to heat production and electricity generation are available up to 2011.
Other biogases OBIOGAS Other biogases, such as biogas produced from the anaerobic fer-mentation of animal slurries and of wastes in abattoirs, breweries and other agro-food industries. Data for inputs and outputs to heat production and electricity generation are available up to 2011.

ELECTRICITY INFORMATION: DATABASE DOCUMENTATION (2019 final edition) - 23
INTERNATIONAL ENERGY AGENCY
Biofuels and Wastes The fuels in this section are expressed in terajoules on a net calorific value basis, with the exception of bio-diesel, liquid biofuels and non-specified combustible renewables and waste, which are in thousand tonnes.
Product Short name Definition
Biodiesel BIODIESEL This category includes biodiesel (a methyl-ester produced from vegetable or animal oil, of diesel quality), biodimethylether (di-methylether produced from biomass), Fischer-Tropsch (Fisch-er-Tropsch produced from biomass), cold pressed biooil (oil pro-duced from oil seed through mechanical processing only) used straight as road diesel or for electricity and heat generation.
Biogasoline BIOGASOL Biogasoline includes bioethanol (ethanol produced from biomass and/or the biodegradable fraction of waste), biomethanol (metha-nol produced from biomass and/or the biodegradable fraction of waste), bioETBE (ethyl-tertio-butyl-ether produced on the basis of bioethanol; the percentage by volume of bioETBE that is calculat-ed as biofuel is 47%) and bioMTBE (methyl-tertio-butyl-ether produced on the basis of biomethanol: the percentage by volume of bioMTBE that is calculated as biofuel is 36%). Biogasoline in-cludes the amounts that are blended into the gasoline - it does not include the total volume of gasoline into which the biogasoline is blended.
Liquid biofuels OBIOLIQ Liquid fuels produced from biofuels, biodegradable organic waste, used frying oils, or other organic material. This category includes liquid biofuels not included in biodiesels. Please note that the quantities of liquid biofuels reported in this category should relate to the quantities of biofuel and not to the total volume of liquids into which the biofuels are blended.
Non-specified comb. renew. and waste
RENEWNS This item is used when the detailed breakdown for primary bio-fuels and waste is not available.

24 - ELECTRICITY INFORMATION: DATABASE DOCUMENTATION (2019 final edition)
INTERNATIONAL ENERGY AGENCY
Other Generation Sources Electricity is expressed in gigawatt hours and heat is expressed in terajoules.
Product Short name Definition
Heat pumps HEATPUMP Heat output from heat pumps only where the heat is sold to third parties (i.e. in cases where production occurs in the Transfor-mation sector).
Electric boilers BOILER Heat from electric boilers where the output is sold to third parties.
Heat from Chemical Sources
CHEMHEAT Heat originating from processes without input energy, such as a chemical reaction (e.g. the treatment of zinc oxide ore with hydro-chloric acid). Note that waste heat originating from energy driven processes is not considered as a primary energy source. Therefore, it is reported as heat produced from the corresponding fuel.
Other sources OTHER Electricity production from sources other than those listed, e.g. from fuel cells. Heat from other sources; for example, recovered waste heat from industry sold to third parties.
Heat output from non-specified comb fuels
HEATNS This item is only used if the detailed breakdown is not available.
Total Sources TOTAL This item represents the sum of all the sources of electricity and heat generation.

ELECTRICITY INFORMATION: DATABASE DOCUMENTATION (2019 final edition) - 25
INTERNATIONAL ENERGY AGENCY
Electricity and Heat Generation Flows Flow Short name Definition
Fuel input (kt) INPUTTON This is the quantity of fuel used to produce electricity and heat measured in thousand metric tons.
Fuel input (TJ) INPUTTJ This is the quantity of fuel used to produce electricity and heat measured in terajoules (TJ). Quantities are reported using net calo-rific values, except for gases which are reported in gross calorific values.
Gross electricity production
GELEPROD Gross Electricity Production is the sum of the electrical energy production by all the generating sets concerned (including pumped storage) measured at the output terminals of the main generators.
Net electricity production
NELEPROD Net Electricity Production is equal to the gross electricity produc-tion less the electrical energy absorbed by the generating auxilia-ries and the losses in the main generator transformers.
Gross heat production GHEATPRO Gross Heat Production is the total heat produced by the installation and includes the heat used by the installation's auxiliaries which use a hot fluid (space heating, liquid fuel heating, etc.) and losses in the installation/network heat exchanges. Note that for autoproducers, heat used by the undertaking for its own processes is not included here; only heat sold to third parties is reported. As only heat sold to third parties is reported, gross heat production for autoproducers is equal to net heat production.
Net heat production NHEATPRO Net Heat Production is the heat supplied to the distribution system as determined from measurements of the outgoing and return flows.

26 - ELECTRICITY INFORMATION: DATABASE DOCUMENTATION (2019 final edition)
INTERNATIONAL ENERGY AGENCY
Plant Type Flow Short name Definition
Main activity producer electricity plants
MAINELEC Refers to plants which are designed to produce electricity only. If one or more units of the plant is a CHP unit (and the inputs and outputs cannot be distinguished on a unit basis) then the whole plant is designated as a CHP plant. Main activity producers (for-merly referred to as public supply undertakings) generate electrici-ty for sale to third parties, as their primary activity. They may be privately or publicly owned. Note that the sale need not take place through the public grid.
Main activity producer CHP plants
MAINCHP Refers to plants which are designed to produce both heat and elec-tricity (sometimes referred to as co-generation power stations). If possible, fuel inputs and electricity/heat outputs are on a unit basis rather than on a plant basis. However, if data are not available on a unit basis, the convention for defining a CHP plant noted above is adopted. Main activity producers (formerly referred to as public supply undertakings) generate electricity and/or heat for sale to third parties, as their primary activity. They may be privately or publicly owned. Note that the sale need not take place through the public grid.
Main activity producer heat plants
MAINHEAT Refers to plants (including heat pumps and electric boilers) de-signed to produce heat only and who sell heat to a third party (e.g. residential, commercial or industrial consumers) under the provisions of a contract. Main activity producers (formerly referred to as public supply undertakings) generate heat for sale to third parties, as their primary activity. They may be privately or publicly owned. Note that the sale need not take place through the public grid.
Auto-producer electricity plants
AUTOELEC Refers to plants which are designed to produce electricity only. If one or more units of the plant is a CHP unit (and the inputs and outputs cannot be distinguished on a unit basis) then the whole plant is designated as a CHP plant. Auto-producer undertakings generate electricity wholly or partly for their own use as an activity which supports their primary activity. They may be privately or publicly owned.
Auto-producer CHP plants
AUTOCHP Refers to plants which are designed to produce both heat and elec-tricity (sometimes referred to as co-generation power stations). If possible, fuel inputs and electricity/heat outputs are on a unit basis rather than on a plant basis. However, if data are not available on a unit basis, the convention for defining a CHP plant noted above is adopted. Note that for autoproducer CHP plants, all fuel inputs to electricity production are taken into account, while only the part of fuel inputs to heat sold is shown. Fuel inputs for the production of heat consumed within the autoproducer's establishment are not included here but are included with figures for the final consump-tion of fuels in the appropriate consuming sector. Auto-producer undertakings generate electricity and/or heat, wholly or partly for their own use as an activity which supports their primary activity. They may be privately or publicly owned.

ELECTRICITY INFORMATION: DATABASE DOCUMENTATION (2019 final edition) - 27
INTERNATIONAL ENERGY AGENCY
Plant Type Flow Short name Definition
Auto-producer heat plants
AUTOHEAT Refers to plants (including heat pumps and electric boilers) de-signed to produce heat only and who sell heat to a third party (e.g. residential, commercial or industrial consumers) under the provisions of a contract. Auto-producer undertakings generate heat, wholly or partly for their own use as an activity which supports their primary activity. They may be privately or publicly owned.
Total main activity producer plants
MAINTOT This refers to inputs to and outputs from all main activity producer plants.
Total autoproducer plants
AUTOTOT This refers to inputs to and outputs from all autoproducer plants.
Total plants TOTAL This refers to inputs to and outputs from all plants.

28 - ELECTRICITY INFORMATION: DATABASE DOCUMENTATION (2019 final edition)
INTERNATIONAL ENERGY AGENCY
Electricity Capacity Flow Short name Definition
Total capacity TOTCAP The capacity at 31st December is reported. It includes electrical capacity of both electricity (only) and CHP plants. Data for fuel cells are reported in the row "Other fuel sources". Net Maximum Electrical Capacity: the sum of the net maximum capacities of all stations taken individually at a given period of operation. The net maximum capacity is the maximum active pow-er that can be supplied, continuously, with all plants running, at the point of outlet to the network (i.e. after taking the power supplies for the station auxiliaries and allowing for the losses in those trans-formers considered integral to the station). It represents the sum of all individual plants' maximum capacities available to run continu-ously throughout a prolonged period of operation in a day. Does not include overload capacity that can only be sustained for a short period of time (e.g. internal combustion engines momentarily run-ning above their rated capacity). It is assumed that all equipment is in full working order, that the power produced can be disposed of without any restrictions and that optimum conditions prevail as regards primary sources (i.e. flow and head in the case of hydro plant; grade and quantity of fuel in hand and water supply, temper-ature, and purity in the case of thermal plant, and assuming that the output and method of production in CHP plant are those which lend to maximum electricity production). Mixed (hydro) plants are hydro plants with natural inflow where part or all equipment can be used for pumping water uphill and also for producing electricity from natural inflow and pump stor-age. Pure pumped storage plants are plants with no natural inflow, producing electricity only from water previously pumped uphill.
Solid/liquid SOLLIQ Refers to units capable of generating electricity using solid and liquid fuel.
Solid/natural gas SOLGAS Refers to units capable of generating electricity using solid fuel and natural gas.
Liquid/natural gas LIQGAS Refers to units capable of generating electricity using liquid fuels and natural gas.
Solid/liquid/gas SOLIGAS Refers to units capable of generating electricity using solid, liquid fuels and natural gas.
Steam STEAM Refers to two main types of steam turbines -- non-condensing (or open cycle), also called back-pressure turbines, and condensing turbines (or closed cycle). In non-condensing turbines, the exhaust steam leaving the turbine is used either as co-generated process steam or, more rarely, released into the atmosphere. In a condens-ing turbine, the exhaust steam is condensed and the water thus formed supplies the feed-water for the generator. The boilers sup-plying steam turbines can be fuelled by all forms of fossil fuels.

ELECTRICITY INFORMATION: DATABASE DOCUMENTATION (2019 final edition) - 29
INTERNATIONAL ENERGY AGENCY
Electricity Capacity Flow Short name Definition
Internal combustion INTCOMB Refers to the engines based on the gasoline or diesel cycle, which work on the spark ignition or the compression-ignition principle. Diesel-type engines can use a variety of fuels ranging from natural gas to liquid fuels.
Gas turbine GASTURB The gas turbine uses high temperature, high pressure gas as fuel, in which part of the heat supplied by the gas is converted into rota-tional energy. Fuel can be natural gas, coal gases or liquid fuels.
Combined cycle COMBINED The combined cycle system refers to electricity produced by cou-pling two heat engines in a sequence to drive generators. The heat discharged from one heat engine serves as the energy source for the next engine. The gas turbine is generally used as the first heat engine and a conventional condensing steam turbine at the second stage.
Other Type of Generation
OTHGEN This refers to electric generating capacity not included elsewhere.
Peak load PEAKLOAD This is the highest value of the power absorbed or supplied by a network or combination of networks within the country. The peak load demand is the highest simultaneous demand for electricity satisfied during the year. Note that the electricity supply at the time of peak demand may include demand satisfied by imported elec-tricity or alternatively the demand may include exports of electrici-ty. Total peak load on the national grid is not the sum of the peak loads during the year on every power station as they may occur at different times.
Capacity at peak PEAKCAP The available capacity of an installation at peak period is the max-imum power at which it can be operated under the prevailing con-ditions at the time, assuming no external constraints. It depends on the technical state of the equipment and its ability to operate, and may differ from the Net maximum capacity due to lack of water for hydro capacity, plant maintenance, unanticipated shutdown, or other outages at the time of peak load.

30 - ELECTRICITY INFORMATION: DATABASE DOCUMENTATION (2019 final edition)
INTERNATIONAL ENERGY AGENCY
5. GEOGRAPHICAL COVERAGE Countries and Regions
This document is without prejudice to the status of or sovereignty over any territory, to the delimitation of international frontiers and boundaries and to the name of any territory, city or area. In this publication, ‘country’ refers to country or territory, as the case may be. Data start in 1960 for OECD countries and regions, and in 1971 for non-OECD countries and regions, unless otherwise specified. Long name Short name Definition
Australia AUSTRALI Excludes the overseas territories. Data are reported on a fiscal year basis. By convention data for the fiscal year that starts on 1 July Y-1 and ends on 30 June Y are labelled as Year Y.
Austria AUSTRIA
Belgium BELGIUM
Canada CANADA
Chile CHILE Data start in 1971.
Czech Republic CZECH Data start in 1971.
Denmark DENMARK Excludes the Faroe Islands and Greenland.
Estonia ESTONIA
Finland FINLAND
France FRANCE From 2011 data onwards, France includes Monaco, and the following overseas departments (Guadeloupe; French Guiana; Martinique; Mayotte; and Réunion); and ex-cludes the overseas collectivities (New Caledonia; French Polynesia; Saint Barthélemy; Saint Martin; Saint Pierre and Miquelon; and Wallis and Futuna).
Prior to 2011, France includes Monaco and excludes the following overseas departments and collectivities: Gua-deloupe; French Guiana; Martinique; Mayotte and Réu-nion; New Caledonia; French Polynesia; Saint Barthéle-my; Saint Martin; Saint Pierre and Miquelon; and Wallis and Futuna.

ELECTRICITY INFORMATION: DATABASE DOCUMENTATION (2019 final edition) - 31
INTERNATIONAL ENERGY AGENCY
Countries and Regions This document is without prejudice to the status of or sovereignty over any territory, to the delimitation of international frontiers and boundaries and to the name of any territory, city or area. In this publication, ‘country’ refers to country or territory, as the case may be. Data start in 1960 for OECD countries and regions, and in 1971 for non-OECD countries and regions, unless otherwise specified. Long name Short name Definition
Germany GERMANY Includes the new federal states of Germany from 1970 onwards
Greece GREECE
Hungary HUNGARY Data start in 1965.
Iceland ICELAND
Ireland IRELAND
Israel ISRAEL The statistical data for Israel are supplied by and under the responsibility of the relevant Israeli authorities. The use of such data by the OECD is without prejudice to the status of the Golan Heights, East Jerusalem and Israeli settlements in the West Bank under the terms of international law. Data start in 1971.
Italy ITALY Includes San Marino and the Holy See.
Japan JAPAN Includes Okinawa. Starting 1990, data are reported on a fiscal year basis. By convention data for the fiscal year that starts on 1 April Y and ends on 31 March Y+1 are labelled as Year Y
Korea KOREA Data start in 1971.
Latvia LATVIA Data start in 1990. Prior to that, they are included within Former Soviet Union. Note: Latvia joined the OECD in July 2016.
Lithuania LITHUANIA Data start in 1990. Prior to that, they are included in Former Soviet Union. Note: Lithuania joined the OECD in July 2018.
Luxembourg LUXEMBOU
Mexico MEXICO Data start in 1971.
Netherlands NETHLAND Excludes Suriname, Aruba and the other former Netherlands Antilles (Bonaire, Curaçao, Saba, Saint Eustatius and Sint Maarten).
New Zealand NZ
Norway NORWAY
Poland POLAND
Portugal PORTUGAL Includes the Azores and Madeira.

32 - ELECTRICITY INFORMATION: DATABASE DOCUMENTATION (2019 final edition)
INTERNATIONAL ENERGY AGENCY
Countries and Regions This document is without prejudice to the status of or sovereignty over any territory, to the delimitation of international frontiers and boundaries and to the name of any territory, city or area. In this publication, ‘country’ refers to country or territory, as the case may be. Data start in 1960 for OECD countries and regions, and in 1971 for non-OECD countries and regions, unless otherwise specified. Long name Short name Definition
Slovak Republic SLOVAKIA Data start in 1971.
Slovenia SLOVENIA Data start in 1990. Prior to that, they are included within Former Yugoslavia. .
Spain SPAIN Includes the Canary Islands.
Sweden SWEDEN
Switzerland SWITLAND Does not include Liechtenstein.
Turkey TURKEY
United Kingdom UK Does not includes the Channel Islands and the Isle of Man.
United States USA For 2017 onwards, includes the 50 states, the District of Columbia, and Puerto Rico. Prior to 2017, includes the 50 states and the District of Columbia.
OECD Total OECDTOT Includes Australia, Austria, Belgium, Canada, Chile, the Czech Republic, Denmark, Estonia, Finland, France, Germany, Greece, Hungary, Iceland, Ireland, Israel1, Italy, Japan, Korea, Latvia2, Lithuania3, Luxembourg, Mexico, the Netherlands, New Zealand, Norway, Poland, Portugal, the Slovak Republic, Slovenia, Spain, Sweden, Switzerland, Turkey, the United Kingdom and the United States. Estonia, Latvia, Lithuania and Slovenia are included starting in 1990. Prior to 1990, data for Estonia. Latvia and Lithuania are included in Former Soviet Union, and data for Slovenia in Former Yugoslavia.
OECD Americas OECDAM Includes Canada, Chile, Mexico and the United States.
OECD Asia Oceania OECDAO Includes Australia, Israel1, Japan, Korea and New Zealand.
1. The statistical data for Israel are supplied by and under the responsibility of the relevant Israeli authorities. The use of such data by the OECD is without prejudice to the status of the Golan Heights, East Jerusalem and Israeli settlements in the West Bank under the terms of international law. 2. Latvia became an OECD member in in July 2016. Accordingly, Latvia appears in the list of OECD members and is included in the zone aggregates for data from 1990, starting with the 2017 edition. Prior to 1990, data for Latvia are included in Former Soviet Union. 3. Lithuania became an OECD member in July 2018. Accordingly, Lithuania appears in the list of OECD Members and is included in the zone ag-gregates for data from 1990, starting with the 2019 edition. Prior to 1990, data for Lithuania are included in Former Soviet Union.

ELECTRICITY INFORMATION: DATABASE DOCUMENTATION (2019 final edition) - 33
INTERNATIONAL ENERGY AGENCY
Countries and Regions This document is without prejudice to the status of or sovereignty over any territory, to the delimitation of international frontiers and boundaries and to the name of any territory, city or area. In this publication, ‘country’ refers to country or territory, as the case may be. Data start in 1960 for OECD countries and regions, and in 1971 for non-OECD countries and regions, unless otherwise specified. Long name Short name Definition
OECD Europe OECDEUR Includes Austria, Belgium, the Czech Republic, Denmark, Estonia, Finland, France, Germany, Greece, Hungary, Iceland, Ireland, Italy, Latvia2, Lithanuia3, Luxembourg, the Netherlands, Norway, Poland, Portugal, the Slovak Republic, Slovenia, Spain, Sweden, Switzerland, Turkey and the United Kingdom. Estonia, Latvia, Lithuania and Slovenia are included starting in 1990. Prior to 1990, data for Estonia, Latvia and Lithuania are included in Former Soviet Union, and data for Slovenia in Former Yugoslavia.
IEA Total IEATOT Includes Australia, Austria, Belgium, Canada, the Czech Republic, Denmark, Estonia, Finland, France, Germany, Greece, Hungary, Ireland, Italy, Japan, Korea, Luxembourg, Mexico, the Netherlands, New Zealand, Norway, Portugal, the Slovak Republic, Spain, Sweden, Switzerland, Turkey, the United Kingdom and the United States. Estonia is included starting in 1990. Prior to 1990, data for Estonia are included in Former Soviet Union.
The IEA and Accession/Association countries
IEAFAMILY Includes: IEA member countries: Australia, Austria, Belgium, Canada, the Czech Republic, Denmark, Estonia4, Finland, France, Germany, Greece, Hungary, Ireland, Italy, Japan, Korea, Luxembourg, Mexico, the Netherlands, New Zealand, Norway, Poland, Portugal, the Slovak Republic, Spain, Sweden, Switzerland, Turkey, the United Kingdom and the United States; Accession countries: Chile; Association countries: Brazil, the People’s Republic of China; India; Indonesia; Morocco; Singapore; South Africa; Thailand.
Argentina ARGENTINA
Bolivia BOLIVIA
Brazil BRAZIL
Colombia COLOMBIA
Costa Rica COSTARICA
Cuba CUBA
4. Estonia is included starting in 1990. Prior to 1990, data for Estonia are included in Former Soviet Union.

34 - ELECTRICITY INFORMATION: DATABASE DOCUMENTATION (2019 final edition)
INTERNATIONAL ENERGY AGENCY
Countries and Regions This document is without prejudice to the status of or sovereignty over any territory, to the delimitation of international frontiers and boundaries and to the name of any territory, city or area. In this publication, ‘country’ refers to country or territory, as the case may be. Data start in 1960 for OECD countries and regions, and in 1971 for non-OECD countries and regions, unless otherwise specified. Long name Short name Definition
Netherlands Antilles/ Curaçao
CURACAO The Netherlands Antilles was dissolved on 10 October 2010, resulting in two new constituent countries, Curaçao and Sint Maarten, with the remaining islands joining Netherlands as special municipalities. In this edition, the methodology for accounting for the energy statistics of Netherlands Antilles has been revised in order to follow the above-mentioned geographical changes. From 2012 onwards, data now account for the energy statistics of Curaçao Island only. Prior to 2012, data remain unchanged and still cover the entire territory of the former Netherlands Antilles.
Dominican Republic DOMINICANR
Ecuador ECUADOR
El Salvador ELSALVADOR
Guatemala GUATEMALA
Haiti HAITI
Honduras HONDURAS
Jamaica JAMAICA
Nicaragua NICARAGUA
Panama PANAMA
Paraguay PARAGUAY
Peru PERU
Suriname SURINAME Data for Suriname are available starting in 2000. Prior to that, they are included in Other non-OECD Americas.
Trinidad and Tobago TRINIDAD
Uruguay URUGUAY
Venezuela VENEZUELA

ELECTRICITY INFORMATION: DATABASE DOCUMENTATION (2019 final edition) - 35
INTERNATIONAL ENERGY AGENCY
Countries and Regions This document is without prejudice to the status of or sovereignty over any territory, to the delimitation of international frontiers and boundaries and to the name of any territory, city or area. In this publication, ‘country’ refers to country or territory, as the case may be. Data start in 1960 for OECD countries and regions, and in 1971 for non-OECD countries and regions, unless otherwise specified. Long name Short name Definition
Other non-OECD Americas
OTHERLATIN Includes Anguilla, Antigua and Barbuda; Aruba; the Bahamas; Barbados; Belize; Bermuda; Bonaire (from 2012); the British Virgin Islands; the Cayman Islands; Dominica; the Falkland Islands (Malvinas); French Guiana (until 2010); Grenada; Guadeloupe (until 2010); Guyana; Martinique (until 2010); Montserrat; Puerto Rico (for natural gas and – up to 2016 data, electricity); Saba (from 2012); Saint Eustatius (from 2012); Saint Kitts and Nevis; Saint Lucia; Saint Pierre and Miquelon; Saint Vincent and the Grenadines; Sint Maarten (from 2012); Suriname (until 1999); and Turks and Caicos Islands.
Non-OECD Americas LATINAMERI Includes Argentina; Plurinational State of Bolivia (Bolivia); Brazil; Colombia; Costa Rica; Cuba; Curaçao; the Dominican Republic; Ecuador; El Salvador; Guatemala; Haiti; Honduras; Jamaica; Nicaragua; Panama; Paraguay; Peru; Suriname; Trinidad and Tobago; Uruguay; Bolivarian Republic of Venezuela (Venezuela) and Other non-OECD Americas.
Albania ALBANIA
Bosnia and Herzegovina
BOSNIAHERZ Data for Bosnia and Herzegovina are available starting in 1990. Prior to that, they are included in Former Yugoslavia.
Bulgaria BULGARIA
Croatia CROATIA Data for Croatia are available starting in 1990. Prior to that, they are included in Former Yugoslavia.
Cyprus CYPRUS Note by Turkey: The information in this document with reference to “Cyprus” relates to the southern part of the Island. There is no single authority representing both Turkish and Greek Cypriot people on the Island. Turkey recognises the Turkish Republic of Northern Cyprus (TRNC). Until a lasting and equitable solution is found within the context of the United Nations, Turkey shall preserve its position concerning the “Cyprus issue”. Note by all the European Union member states of the OECD and the European Union: The Republic of Cyprus is recognised by all members of the United Nations with the exception of Turkey. The information in this document relates to the area under the effective control of the Government of the Republic of Cyprus.
Gibraltar GIBRALTAR

36 - ELECTRICITY INFORMATION: DATABASE DOCUMENTATION (2019 final edition)
INTERNATIONAL ENERGY AGENCY
Countries and Regions This document is without prejudice to the status of or sovereignty over any territory, to the delimitation of international frontiers and boundaries and to the name of any territory, city or area. In this publication, ‘country’ refers to country or territory, as the case may be. Data start in 1960 for OECD countries and regions, and in 1971 for non-OECD countries and regions, unless otherwise specified. Long name Short name Definition
Kosovo KOSOVO Data for Kosovo are available starting in 2000. Between 1990 and 1999, data for Kosovo are included in Serbia5. Prior to 1990, they are included in Former Yugoslavia. This designation is without prejudice to positions on status, and is in line with United Nations Security Council Resolution 1244/99 and the Advisory Opinion of the International Court of Justice on Kosovo’s declaration of independence.
Malta MALTA
Montenegro MONTENEGRO Data for Montenegro are available starting in 2005. Between 1990 and 2004, data for Montenegro are included in Serbia5. Prior to 1990, they are included in Former Yugoslavia.
Romania ROMANIA
Republic of North Macedonia
NORTHMACED Data for the Republic of North Macedonia are available starting in 1990. Prior to that, they are included in Former Yugoslavia.
Serbia SERBIA Data for Serbia are available starting in 1990. Prior to that, they are included in Former Yugoslavia. Serbia includes Montenegro until 2004 and Kosovo6 until 1999.
Former Yugoslavia (if no detail)
YUGOND Before 1990, includes Bosnia and Herzegovina; Croatia; Kosovo; Montenegro; the Republic of North Macedonia; Slovenia and Serbia.
Non-OECD Europe and Eurasia
EURASIA Includes Albania; Armenia; Azerbaijan; Belarus; Bosnia and Herzegovina; Bulgaria; Croatia; Cyprus7; Georgia; Gibraltar; Kazakhstan; Kosovo; Kyrgyzstan; Lithuania; Malta; Republic of Moldova (Moldova); Montenegro; Republic of North Macedonia; Romania; Russian Federation; Serbia5; Tajikistan; Turkmenistan; Ukraine; Uzbekistan; Former Soviet Union (prior to 1990) and Former Yugoslavia (prior to 1990).
5. Serbia includes Montenegro until 2004 and Kosovo until 1999. 6. This designation is without prejudice to positions on status, and is in line with United Nations Security Council Resolution 1244/99 and the Advi-sory Opinion of the International Court of Justice on Kosovo’s declaration of independence. 7. Note by Turkey: The information in this document with reference to “Cyprus” relates to the southern part of the Island. There is no single authority representing both Turkish and Greek Cypriot people on the Island. Turkey recognises the Turkish Republic of Northern Cyprus (TRNC). Until a lasting and equitable solution is found within the context of the United Nations, Turkey shall preserve its position concerning the “Cyprus issue”. Note by all the European Union member states of the OECD and the European Union: The Republic of Cyprus is recognised by all members of the United Nations with the exception of Turkey. The information in this document relates to the area under the effective control of the Government of the Republic of Cyprus.

ELECTRICITY INFORMATION: DATABASE DOCUMENTATION (2019 final edition) - 37
INTERNATIONAL ENERGY AGENCY
Countries and Regions This document is without prejudice to the status of or sovereignty over any territory, to the delimitation of international frontiers and boundaries and to the name of any territory, city or area. In this publication, ‘country’ refers to country or territory, as the case may be. Data start in 1960 for OECD countries and regions, and in 1971 for non-OECD countries and regions, unless otherwise specified. Long name Short name Definition
Armenia ARMENIA Data for Armenia are available starting in 1990. Prior to that, they are included in Former Soviet Union.
Azerbaijan AZERBAIJAN Data for Azerbaijan are available starting in 1990. Prior to that, they are included in Former Soviet Union.
Belarus BELARUS Data for Belarus are available starting in 1990. Prior to that, they are included in Former Soviet Union.
Georgia GEORGIA Data for Georgia are available starting in 1990. Prior to that, they are included in Former Soviet Union.
Kazakhstan KAZAKHSTAN Data for Kazakhstan are available starting in 1990. Prior to that, they are included in Former Soviet Union.
Kyrgyzstan KYRGYZSTAN Data for Kyrgyzstan are available starting in 1990. Prior to that, they are included in Former Soviet Union.
Republic of Moldova MOLDOVA Data for Moldova are available starting in 1990. Prior to that, they are included in Former Soviet Union.
Russian Federation RUSSIA Data for Russia are available starting in 1990. Prior to that, they are included in Former Soviet Union.
Tajikistan TAJIKISTAN Data for Tajikistan are available starting in 1990. Prior to that, they are included in Former Soviet Union.
Turkmenistan TURKMENIST Data for Turkmenistan are available starting in 1990. Prior to that, they are included in Former Soviet Union.
Ukraine UKRAINE Data for Ukraine are available starting in 1990. Prior to that, they are included in Former Soviet Union.
Uzbekistan UZBEKISTAN Data for Uzbekistan are available starting in 1990. Prior to that, they are included in Former Soviet Union.
Former Soviet Union (if no detail)
FSUND Before 1990, includes Armenia; Azerbaijan; Belarus; Estonia; Georgia; Kazakhstan; Kyrgyzstan; Latvia; Lithuania; Republic of Moldova; Russian Federation; Tajikistan; Turkmenistan; Ukraine and Uzbekistan.
Algeria ALGERIA
Angola ANGOLA
Benin BENIN
Botswana BOTSWANA Data for Botswana are available from 1981. Prior to that, they are included in Other Africa.
Cameroon CAMEROON
Congo CONGO

38 - ELECTRICITY INFORMATION: DATABASE DOCUMENTATION (2019 final edition)
INTERNATIONAL ENERGY AGENCY
Countries and Regions This document is without prejudice to the status of or sovereignty over any territory, to the delimitation of international frontiers and boundaries and to the name of any territory, city or area. In this publication, ‘country’ refers to country or territory, as the case may be. Data start in 1960 for OECD countries and regions, and in 1971 for non-OECD countries and regions, unless otherwise specified. Long name Short name Definition
Democratic Republic of the Congo
CONGOREP
Côte d'Ivoire COTEIVOIRE
Egypt EGYPT Data for Egypt are reported on a fiscal year basis. By convention, data for the fiscal year that starts on 1 July Y and ends on 30 June Y+1 are labelled as year Y.
Eritrea ERITREA Data for Eritrea are available from 1992. Prior to that, they are included in Ethiopia.
Ethiopia ETHIOPIA Ethiopia includes Eritrea prior to 1992.
Gabon GABON
Ghana GHANA
Kenya KENYA Electricity data are reported on a fiscal year basis. By convention, data for the fiscal year that starts on 1 July Y and ends on 30 June Y+1 are labelled as year Y.
Libya LIBYA
Mauritius MAURITIUS
Morocco MOROCCO
Mozambique MOZAMBIQUE
Namibia NAMIBIA Data for Namibia are available starting in 1991. Prior to that, data are included in Other Africa.
Niger NIGER Prior to 2000, data for Niger are presented in Other Africa.
Nigeria NIGERIA
Senegal SENEGAL
South Africa SOUTHAFRIC
South Sudan SSUDAN Data for South Sudan are available from 2012. Prior to 2012, they are included in Sudan.
Sudan SUDAN South Sudan became an independent country on 9 July 2011. From 2012, data for South Sudan are reported sep-arately.
United Republic of Tanzania
TANZANIA Oil data are reported on a fiscal year basis, beginning on the 1 July Y and ending on the 30 June Y+1.
Togo TOGO

ELECTRICITY INFORMATION: DATABASE DOCUMENTATION (2019 final edition) - 39
INTERNATIONAL ENERGY AGENCY
Countries and Regions This document is without prejudice to the status of or sovereignty over any territory, to the delimitation of international frontiers and boundaries and to the name of any territory, city or area. In this publication, ‘country’ refers to country or territory, as the case may be. Data start in 1960 for OECD countries and regions, and in 1971 for non-OECD countries and regions, unless otherwise specified. Long name Short name Definition
Tunisia TUNISIA
Zambia ZAMBIA
Zimbabwe ZIMBABWE Other Africa OTHERAFRIC Includes Botswana (until 1980); Burkina Faso; Burundi;
Cabo Verde; Central African Republic; Chad; Comoros; Djibouti; Equatorial Guinea; the Kingdom of Eswatini; Gambia; Guinea; Guinea-Bissau; Lesotho; Liberia; Madagascar; Malawi; Mali; Mauritania; Namibia (until 1990); Niger (until 1999); Réunion (until 2010); Rwanda; Sao Tome and Principe; Seychelles; Sierra Leone; Somalia; Uganda and Western Sahara (from 1990).
Africa AFRICA Includes Algeria; Angola; Benin; Botswana; Burkina Faso; Burundi; Cabo Verde; Cameroon; Central African Republic; Chad; Comoros; the Republic of the Congo (Congo); Côte d’Ivoire; the Democratic Republic of the Congo; Djibouti; Egypt; Equatorial Guinea; Eritrea; the Kingdom of Eswatini; Ethiopia; Gabon; Gambia; Ghana; Guinea; Guinea-Bissau; Kenya; Lesotho; Liberia; Libya; Madagascar; Malawi; Mali; Mauritania; Mauritius; Morocco; Mozambique; Namibia; Niger; Nigeria; Réunion (until 2010); Rwanda; Sao Tome and Principe; Senegal; the Seychelles; Sierra Leone; Somalia; South Africa; South Sudan (from 2012); Sudan; the United Republic of Tanzania (Tanzania); Togo; Tunisia; Uganda; Zambia; Zimbabwe.
Bahrain BAHRAIN
Islamic Republic of Iran
IRAN Data are reported according to the Iranian calendar year. By convention data for the year that starts on 20 March Y and ends on 19 March Y+1 are labelled as year Y.
Iraq IRAQ
Jordan JORDAN
Kuwait KUWAIT
Lebanon LEBANON
Oman OMAN
Qatar QATAR
Saudi Arabia SAUDIARABI

40 - ELECTRICITY INFORMATION: DATABASE DOCUMENTATION (2019 final edition)
INTERNATIONAL ENERGY AGENCY
Countries and Regions This document is without prejudice to the status of or sovereignty over any territory, to the delimitation of international frontiers and boundaries and to the name of any territory, city or area. In this publication, ‘country’ refers to country or territory, as the case may be. Data start in 1960 for OECD countries and regions, and in 1971 for non-OECD countries and regions, unless otherwise specified. Long name Short name Definition
Syrian Arab Republic SYRIA
United Arab Emirates UAE
Yemen YEMEN
Middle East MIDDLEEAST Includes Bahrain, Islamic Republic of Iran, Iraq, Jordan, Kuwait, Lebanon, Oman, Qatar, Saudi Arabia, Syrian Arab Republic, United Arab Emirates and Yemen.
Bangladesh BANGLADESH Data are reported on a fiscal year basis. By convention data for the fiscal year that starts on 1 July Y-1 and ends on 30 June Y are labelled as Year Y.
Brunei BRUNEI
Cambodia CAMBODIA Data for Cambodia are available starting in 1995. Prior to that, they are included in Other Asia.
India INDIA Data are reported on a fiscal year basis. By convention data for the fiscal year that starts on 1 April Y and ends on 31 March Y+1 are labelled as Year Y.
Indonesia INDONESIA
Democratic People’s Republic of Korea
KOREADPR
Malaysia MALAYSIA
Mongolia MONGOLIA Data for Mongolia are available starting in 1985. Prior to that, they are included in Other Asia.
Myanmar MYANMAR Data were reported on a fiscal year basis until 2015 data. By convention data for the fiscal year that starts on 1 April Y and ends on 31 March Y+1 are labelled as Year Y.
Nepal NEPAL Data are reported on a fiscal year basis. By convention data for the fiscal year that starts on 1 July Y and ends on 30 June Y+1 are labelled as Year Y.
Pakistan PAKISTAN Data are reported on a fiscal year basis. By convention fiscal year Y/Y+1 is labelled as year Y.
Philippines PHILIPPINE
Singapore SINGAPORE
Sri Lanka SRILANKA
Chinese Taipei TAIPEI

ELECTRICITY INFORMATION: DATABASE DOCUMENTATION (2019 final edition) - 41
INTERNATIONAL ENERGY AGENCY
Countries and Regions This document is without prejudice to the status of or sovereignty over any territory, to the delimitation of international frontiers and boundaries and to the name of any territory, city or area. In this publication, ‘country’ refers to country or territory, as the case may be. Data start in 1960 for OECD countries and regions, and in 1971 for non-OECD countries and regions, unless otherwise specified. Long name Short name Definition
Thailand THAILAND
Vietnam VIETNAM
Other non-OECD Asia OTHERASIA Includes Afghanistan; Bhutan; Cambodia (until 1994); Cook Islands; Fiji; French Polynesia; Kiribati; the Lao People’s Democratic Republic; Macau, China; Maldives; Mongolia (until 1984); New Caledonia; Palau (from 1994); Papua New Guinea; Samoa; the Solomon Islands; Timor-Leste; Tonga and Vanuatu.
Non-OECD Asia excluding China
ASIA Includes Bangladesh; Brunei Darussalam; Cambodia (from 1995); India; Indonesia; the Democratic People’s Republic of Korea; Malaysia; Mongolia (from 1985); Myanmar; Nepal; Pakistan; the Philippines; Singapore; Sri Lanka; Chinese Taipei; Thailand; Viet Nam; Other non-OECD Asia.
People's Republic of China
CHINA
Hong Kong, China HONGKONG
China Region CHINAREG Includes the People’s Republic of China and Hong Kong, China.
Non-OECD Total NONOECDTOT Includes Africa; Asia (excluding China); China (People's Republic of China and Hong Kong, China); Non-OECD Americas; Middle East and Non-OECD Europe and Eurasia.
World WORLD Includes OECD Total; Africa; Non-OECD Americas; Non-OECD Asia (excluding China); China (People’s Republic of China and Hong Kong, China); Non-OECD Europe and Eurasia; Middle East; World aviation bunkers and World marine bunkers. It is also the sum of Africa, Americas, Asia, Europe, Oceania, World aviation bunkers and World marine bunkers.

42 - ELECTRICITY INFORMATION: DATABASE DOCUMENTATION (2019 final edition)
INTERNATIONAL ENERGY AGENCY
Countries and Regions This document is without prejudice to the status of or sovereignty over any territory, to the delimitation of international frontiers and boundaries and to the name of any territory, city or area. In this publication, ‘country’ refers to country or territory, as the case may be. Data start in 1960 for OECD countries and regions, and in 1971 for non-OECD countries and regions, unless otherwise specified. Long name Short name Definition
Africa (UN) AFRICATOT Includes Algeria; Angola; Benin; Botswana; Burkina Faso; Burundi; Cabo Verde; Cameroon; Central African Republic; Chad; Comoros; the Republic of the Congo (Congo); Côte d’Ivoire; the Democratic Republic of the Congo; Djibouti; Egypt; Equatorial Guinea; Eritrea; the Kingdom of Eswatini; Ethiopia; Gabon; Gambia; Ghana; Guinea; Guinea-Bissau; Kenya; Lesotho; Liberia; Libya; Madagascar; Malawi; Mali; Mauritania; Mauritius; Morocco; Mozambique; Namibia; Niger; Nigeria; Réunion (until 2010); Rwanda; Sao Tome and Principe; Senegal; the Seychelles; Sierra Leone; Somalia; South Africa; South Sudan (from 2012); Sudan; the United Republic of Tanzania (Tanzania); Togo; Tunisia; Uganda; Zambia; Zimbabwe.
Americas (UN) AMERICAS Includes Antigua and Barbuda; Argentina; Aruba; the Bahamas; Barbados; Belize; Bermuda; the Plurinational State of Bolivia (Bolivia); Bonaire (from 2012); the British Virgin Islands; Brazil; Canada; the Cayman Islands; Chile; Colombia; Costa Rica; Cuba; Curaçao; Dominica; the Dominican Republic; Ecuador; El Salvador; the Falkland Islands (Malvinas); Guatemala; French Guiana (until 2010); Grenada; Guadeloupe (until 2010); Guyana; Haiti; Honduras; Jamaica; Martinique (until 2010); Mexico; Montserrat; Nicaragua; Panama; Paraguay; Peru; Puerto Rico (for natural gas and electricity); Saba (from 2012); Saint Kitts and Nevis; Saint Lucia; Saint Pierre and Miquelon; Saint Vincent and the Grenadines; Sint Eustatius (from 2012); Sint Maarten (from 2012); Suriname; Trinidad and Tobago; the Turks and Caicos Islands; the United States; Uruguay; the Bolivarian Republic of Venezuela (Venezuela).

ELECTRICITY INFORMATION: DATABASE DOCUMENTATION (2019 final edition) - 43
INTERNATIONAL ENERGY AGENCY
Countries and Regions This document is without prejudice to the status of or sovereignty over any territory, to the delimitation of international frontiers and boundaries and to the name of any territory, city or area. In this publication, ‘country’ refers to country or territory, as the case may be. Data start in 1960 for OECD countries and regions, and in 1971 for non-OECD countries and regions, unless otherwise specified. Long name Short name Definition
Asia (UN) ASIATOT Includes Afghanistan; Armenia; Azerbaijan; Bahrain; Bangladesh; Bhutan; Brunei Darussalam; Cambodia; the People’s Republic of China; Cyprus7; Georgia; Hong Kong, China; India; Indonesia; the Islamic Republic of Iran; Iraq; Israel; Japan; Jordan; the Democratic People’s Republic of Korea; Korea; Kazakhstan; Kuwait; Kyrgyzstan; the Lao People’s Democratic Republic; Lebanon; Macau, China; Malaysia; the Maldives; Mongolia; Myanmar; Nepal; Oman; Pakistan; the Philippines; Qatar; Saudi Arabia; Singapore; Sri Lanka; the Syrian Arab Republic; Tajikistan; Chinese Taipei; Thailand; Timor-Leste; Turkey; Turkmenistan; the United Arab Emirates; Uzbekistan; Viet Nam; and Yemen.
Europe (UN) EUROPE Includes Albania; Austria; Belarus; Belgium; Bosnia and Herzegovina; Bulgaria; Croatia; the Czech Republic; Denmark; Estonia; Finland; France8; Germany; Gibraltar; Greece; Hungary; Iceland; Ireland; Italy; Kosovo9; Latvia; Lithuania; Luxembourg; Malta; the Republic of Moldova (Moldova); Montenegro; the Netherlands; the Republic of North Macedonia; Norway; Poland; Portugal; Romania; the Russian Federation; Serbia10; the Slovak Republic; Slovenia; Spain; Sweden; Switzerland; Ukraine; the United Kingdom.
Oceania (UN) OCEANIA Includes Australia; New Zealand; Cook Islands; Fiji; French Polynesia; Kiribati; New Caledonia; Palau; Papua New Guinea; Samoa; the Solomon Islands; Tonga; Vanuatu.
8. Data for the French overseas departments are included in Europe from 2011, and in other regions as appropriate (America or Africa) before 2011. 9. This designation is without prejudice to positions on status, and is in line with United Nations Security Council Resolution 1244/99 and the Advi-sory Opinion of the International Court of Justice on Kosovo’s declaration of independence. 10. Serbia includes Montenegro until 2004 and Kosovo until 1999.

44 - ELECTRICITY INFORMATION: DATABASE DOCUMENTATION (2019 final edition)
INTERNATIONAL ENERGY AGENCY
Countries and Regions This document is without prejudice to the status of or sovereignty over any territory, to the delimitation of international frontiers and boundaries and to the name of any territory, city or area. In this publication, ‘country’ refers to country or territory, as the case may be. Data start in 1960 for OECD countries and regions, and in 1971 for non-OECD countries and regions, unless otherwise specified. Long name Short name Definition
Please note that the following countries have not been considered:
Non-OECD Europe and Eurasia: Andorra; Faroe Islands (after 1990); Liechtenstein; the Palestini-an Authority; Svalbard; Jan Mayen Islands;
Africa: British Indian Ocean Territory; French Southern and Antarctic Lands; Mayotte (until 2010); Saint Helena; Western Sahara;
Non-OECD Americas: Bouvet Island; Saint Barthélemy; Greenland (after 1990); Saint Martin (French Part); South Georgia and the South Sandwich Islands;
Antarctica; Non-OECD Asia excluding China: American Samoa; Cocos (Keeling) Islands; Christmas Island;
Heard Island and McDonald Islands; Marshall Islands; Micronesia (Federated States of); Nauru; Niue; Nor-folk Island; Northern Mariana Islands; Pitcairn; Tokelau; Tuvalu; United States Minor Outlying Islands; Wallis and Futuna Islands.

ELECTRICITY INFORMATION: DATABASE DOCUMENTATION (2019 final edition) - 45
INTERNATIONAL ENERGY AGENCY
6. COUNTRY NOTES AND SOURCES GENERAL NOTES APPLICABLE TO ALL COUNTRIES These notes refer to data from 1960 to 2018p.
As a general rule, most series show a more detailed breakdown from 1970, due to limited availability of data prior to that year. Data on inputs to and output from combined heat and power plants and from heat plants may have been estimated by the Secretariat.
Prior to 1974, there is no split available between main activity producer and autoproducer electricity plants for any country.
In general, more detailed notes are available for data starting in 1990. Data are obtained through annual submission of five fuel questionnaires from national administrations, as indicated for each country in the section on sources.
In some instances it has been necessary for the IEA Secretariat to estimate some data; explanations of the estimates are provided in the country notes. For more information on fuel-specific methodologies, please refer to the various IEA information books. Energy data reported for 2017 (shown as 2017p) in the world file are provisional supply data based on submissions received in early 2018 and on monthly submissions to the IEA from member countries.
This section lists a few specific notes that apply to all countries, and it is followed by a time series of com-prehensive country-specific notes by fuel and flow.
Prior to 1974, most fuel inputs and electricity and heat outputs for autoproducers are included in main activity producers. The figures for the quantities of fuels used for the generation of electricity and heat and the correspond-ing outputs in CHP and heat plants should be used with caution. Despite estimates introduced by the IEA
Secretariat, inputs and outputs are not always consistent. Please refer to notes below under Electricity and heat.
Data for anthracite, coking coal, other bituminous coal, sub-bituminous coal and lignite are available sep-arately from 1978. Prior to 1978, only data for hard coal and brown coal (lignite/sub-bituminous coal) are available.
In 1996, the IEA Secretariat extensively revised data on coal and coke use in blast furnaces, and in the iron and steel industry (for those countries with blast furnaces), based on data provided to the OECD Steel Committee and other sources. The quantities of fuels transformed into blast furnace gas have been estimated by the IEA Secretariat based on its blast furnace model.
For biofuels and waste (i.e. solid biofuels, biogases, liquid biofuels, industrial waste and municipal waste), there may be breaks in time series between 1988 and 1989, as in 1997 the IEA Secretariat extensively re-vised these data based on data from Eurostat (for the EU-15 member countries) and on other national sources for other OECD member countries, and data from Eurostat were generally available from 1989. Generally, data on biofuels and waste are reported in non-specified prior to 1989.
Australia
Source Department of Environment and Energy, Canberra.
General notes All data refer to the fiscal year (e.g. July 2016 to
June 2017 for 2017). Starting with the 2013 edition and following, data
for Australia were revised back to 2003 due to the adoption of the National Greenhouse and Energy

46 - ELECTRICITY INFORMATION: DATABASE DOCUMENTATION (2019 final edition)
INTERNATIONAL ENERGY AGENCY
Reporting (NGER) as the main energy consump-tion data source for the Australian Energy Statis-tics. As a result, there are breaks in the time series for many data between 2002 and 2003. The revi-sions have also introduced some methodological issues, including identifying inputs and outputs to certain transformation processes such as gas works plants, electricity plants and CHP plants. Energy industry own use and inputs to the trans-formation processes are sometimes not reported separately in the correct categories. More detail is given in the notes below.
In the 2015 edition, increases of production and consumption of other bituminous coal for 2013 are due to both new mine capacity and improved classification data. In the 2016 edition, these revi-sions were extended back to 2010. Apparent switching between sub-bituminous coal and oth-er bituminous coal between 2009 and 2010 sug-gests that some other bituminous coal was re-ported as sub-bituminous coal prior to this, across several flows.
Hard coal data prior to 1978 may include sub-bituminous coal.
In the 2016 edition, several combustible fuel elec-tricity production time series as well as some elec-tricity consumption time series were revised by the Australian administration back to 2010 in order to limit the use of estimated data and are causing some breaks.
From 1992 onwards, heat data are not available.
Supply Data for production of electricity from wind are
available from 1994. Data for electricity production from solar photo-
voltaic start in 1992 and from solar thermal in 2003.
Transformation In 2018, electricity output from lignite declined
due to the closure of the Hazelwood power plant. In addition, there was no output from BKB due to the closure of both Hazelwood power plant, and the only briquette manufacturer in Australia.
Fuels used for generation by autoproducers repre-sent single fuel-fired units only. The use of fuel in multi-fired units operated by autoproducers is in-cluded in industry consumption.
In the 2018 edition, new methodologies were in-troduced by the Australian administration for re-porting electricity production from solar sources. First, the methodology for reporting electricity production from solar PV and solar thermal was changed between 2009 and 2010, resulting in a break in time series. Prior to 2010, the ratio of electricity production from solar thermal to total solar was assumed to be the same each year. After 2010, solar PV autoproducer electricity produc-tion is the residual after the main activity solar PV and solar thermal are deducted from total solar production. There is an additional break in time se-ries between 2013 and 2014 for solar production when a new methodology for determining large-scale solar PV production was introduced for main activity solar PV plants.
In the 2017 edition, following an extended review of past data, the Australian administration revised electricity outputs of blast furnace gas auto-producer electricity plants for the period 2003-2004 and of autoproducer CHP plants fuelled by other oil products for 2009, resulting in more re-alistic efficiency rates for these plants.
In 2002, the Australian administration started to use a new survey methodology and reclassified the types of plants between main activity producers and autoproducers.
Prior to 1995, electricity production from biogases is included in natural gas.
Prior to 1986, inputs and outputs from autoproducer CHP plants are not available.
Consumption The significant growth in electricity consumption
at LNG/regasification plants in 2016 and 2017, is due to the commencement of large-scale produc-tion at Australia’s new east coast LNG plants.
Prior to 2006, electricity consumption in mining and quarrying includes consumption in liquefaction/regasification plants.
From 1990 to 2008, electricity consumption in wood and wood products is included together with paper, pulp and printing.
The direct use of solar heat (mostly domestic so-lar panels) is available from 1974.
Electricity consumption in coke ovens has been estimated by the Australian administration from 1974 to 1999.

ELECTRICITY INFORMATION: DATABASE DOCUMENTATION (2019 final edition) - 47
INTERNATIONAL ENERGY AGENCY
Prior to 1974, the breakdown of electricity con-sumption in industry and energy sub-sectors is not available and energy industry consumption is in-cluded in industry.
Electricity consumption in the non-specified transport sector represents transport support ser-vices, including those for air and water transport, and for transport for mining operations. Prior to 1971 electricity consumption in the commercial and public services sector is included in industry.
Reported electricity consumption in the oil and gas extraction section may include some con-sumption in LNG/regasification plants.
Capacity Capacity refers to net maximum capacity on
30 June.
Austria
Source Bundesanstalt Statistik Österreich, Vienna.
General note Starting with the 2016 edition and following,
widespread data revisions were received due to enhanced reporting from 2005 onwards as a con-sequence of improved Austrian Final Energy Con-sumption surveys. For some time series, these re-visions were extrapolated back to 1990. As a con-sequence, there may be breaks between 2004 and 2005, and 1989 and 1990. For more details on the methodologies in the revisions in the energy bal-ance, there is more information here: http://www.statistik.at/wcm/idc/idcplg?IdcService=GET_PDF_FILE&RevisionSelectionMethod=LatestReleased&dDocName=036412. For more de-tails on the methodologies related to consumption in households, there is more information here: http://www.statistik.at/wcm/idc/idcplg?IdcService=GET_PDF_FILE&RevisionSelectionMethod=LatestReleased&dDocName=078265
Supply Amounts for both net electricity production and
plant own use are calculated by the Austrian ad-ministration by applying a fixed percentage multi-
plier to the gross production of all plants in the public grid, regardless of plant type or fuel.
Electricity production from geothermal main elec-tricity plants only refers to electricity that is fed in-to the grid. Total production is not known as these plants are below the reporting threshold.
Transformation Between 1995 and 1996 there is a break in time
series for autoproducer electricity and CHP plants due to the availability of more detailed data.
Electricity plants data may include some CHP plants operating in electricity-only mode.
Fluctuating efficiencies from year to year for solid biofuel and industrial waste plants are related to operational decisions which are governed by a formula described in the Standard documentation Meta information on Energy balances for Austria and the Laender of Austria published in June 2016 on the Statistics Austria website.
In the 2018 edition, electricity production from municipal waste main activity electricity plants was revised from 2003-2009. Additionally, elec-tricity production from municipal waste main ac-tivity CHP plants was revised in 2014.
A large autoproducer electricity plant was re-classified as an autoproducer CHP plant and there-fore creates a break in time series for municipal waste in 2011.
In 2009, inputs of other oil products to auto-producer CHP plants were reclassified as refinery gas and natural gas.
Due to a change in the survey methodology, the heat produced in small plants (capacity inferior to 1 MW) is not reported starting in 2002.
Heat from chemical processes used for electrici-ty production is available from 2004.
Electricity generation from geothermal started in 2002.
Prior to 2002, data for biogases only include plants of 1 MW or larger.
Prior to 1981, inputs to main activity producer electricity plants include inputs to CHP plants. All electricity production by CHP plants is included in electricity plants, and only production from com-bustible fuel sources is taken into account. Auto-producer CHP heat production is included in main activity producer CHP plants. For heat, own use is included in distribution losses.

48 - ELECTRICITY INFORMATION: DATABASE DOCUMENTATION (2019 final edition)
INTERNATIONAL ENERGY AGENCY
Consumption In the 2019 edition, Austria revised data back to
2005 in order to present international reporting as consistent as possible with the national energy bal-ances. In addition, consumption figures were re-vised based on more recent surveys of energy con-sumption in small and medium-sized enterprises. Outliers and the extrapolation methodology will be revised following the results of the next survey.
Electricity consumption in oil refineries includes consumption in gas works plants prior to 1991.
From 1990 to 2009, small amounts of electricity used in heat pumps have been included in the resi-dential sector.
Starting in 1990, consumption of electricity in the field of electricity supply, district heating and water supply are included in other energy industry own use, prior to that it was included in commercial/public services.
Prior to 1991, electricity consumption in the iron and steel industry includes consumption in coke ovens and blast furnaces.
Capacity Only gross maximum electrical capacity is available. The breakdown of capacity by type of generation
and fuel for autoproducer plants is not available for 1988 and 1989.
Belgium
Source Observatoire de l'Énergie, Brussels.
General notes Data for anthracite prior to 2014 may include a
small portion of other bituminous coal. Hard coal data prior to 1978 may include
sub-bituminous coal.
Supply Electricity production from other sources mainly
comprises production at a gas expansion station with heat recovery and at a hydraulic turbine in a waste water treatment plant.
From 2013 onwards, reported heat distribution losses decreased due to a more precise estimation method.
The production of electricity from wind is avail-able from 1987. The first year of offshore wind production in Belgium was 2009. Data are availa-ble from 2010.
Transformation In 2018, electricity output from nuclear decreased
due to outages at a number of reactors. In 2015, the decrease of coke oven gas inputs to
autoproducer CHP plants is due to a power plant closure in 2015.
In 2014, the decrease of other bituminous coal inputs to main activity producer electricity plants is due to a power plant closure in 2014.
Between 2008 and 2009, there is a break in effi-ciency of natural gas autoproducer CHP plants due to a change in methodology regarding the re-porting of unsold heat.
Langerlo, Belgium’s last coal-fired main activity electricity producer closed permanently in March 2016.Heat production from chemical processes used for electricity production is available from 2005.
In 2012, heat production from chemical sources has been estimated by the IEA Secretariat.
Prior to 2009 some unsold heat was reported in natural gas autoproducer CHP plants, together with the associated natural gas input. This causes the drop in efficiency in 2009.
In 2007 data, no information was available on heat production in main activity CHP plants for indus-trial waste.
In 2003, combustion of municipal waste for elec-tricity and heat generation purposes increased sig-nificantly. However, because a large portion of the heat produced is not used (sold), plant efficiencies dropped significantly between 2002 and 2003.
In 2000, most autoproducer electricity plants using combustible fuels were reclassified as auto-producer CHP plants; the heat production from these plants was used for internal industrial pro-cesses and not sold to third parties until 2005.
For 1998 and 1999, electricity production at main activity producer CHP plants with annual heat

ELECTRICITY INFORMATION: DATABASE DOCUMENTATION (2019 final edition) - 49
INTERNATIONAL ENERGY AGENCY
output below 0.5 TJ is reported with main activity producer electricity only plants.
Prior to 1982, electricity production in main activity producer CHP plants is included in production from electricity plants. Also, inputs of fuels for electricity generation in main activity producer electricity plants include inputs for heat production in CHP plants.
Consumption For 2012, electricity consumption in the mining
and quarrying sector has been estimated by the IEA Secretariat.
For 2012, oil refineries electricity consumption has been estimated by the IEA Secretariat based on refinery activity data. Part of the estimated amount has been removed from consumption in the chemi-cal and petrochemical sector.
Breaks in time series may exist between 2007 and 2008 due to revisions of the Classification of the Economic Activities in the European Community (NACE) classifications.
There is no heat consumption starting in 2007 in the iron and steel industry because the installation concerned became an autoproducer in July 2006 and the heat is no longer sold.
Capacity Combustible fuels electricity capacity by type of
generation has been revised, accordingly to a new methodology adopted by the Belgian authorities, back to 2008 leading to breaks in the time series between 2007 and 2008.
After 2006 for main activity producers and 2005 for autoproducers, data on combustible fuels elec-trical capacity by fuel type are not available.
Prior to 1982, data on electrical capacity by type of generation are not available.
Canada
Source Natural Resources Canada, Ottawa.
General notes In the 2018 edition, data for Canada were revised
back to 2005 following a ten year revision of the
Report on Energy Supply and Demand (RESD), the main set of Canadian annual data. The revision standardises the methodology used for the IEA da-ta submission and has mainly affected the demand side.
From the 2014 edition, the Canadian administration revised time series back to 2005, using additional data from the Annual Industrial Consumption of Energy, the Annual Survey of Secondary Dis-tributors, the Report on Energy Supply and Demand and the Natural Resources Canada Office of Energy Efficiency. Breaks in time series also between ap-pear 1989 and 1990, due to changes in meth-odology, incorporated in 2002.
The Canadian administration has undertaken revi-sions of many parts of the electricity time series back to 2005, based on the results of the Report on Energy Supply and Demand in Canada (RESD). In particular, revisions were made on the inputs and outputs of power plants fuelled by combustible fuels and on the breakdown of final electricity con-sumption, resulting in possible breaks in time series.
Supply For the 2019 edition, gross electricity output from
wind in 2017 shows a 6% decline over 2016. However, downward revisions to historical data are pending, which would alter this trend.
Autoproducer solar PV electricity generation is available from 2016. Prior to 2016, data are in-cluded in main activity producers. As a result, a break in series occurs for main activity producer solar generation between 2015 and 2016.
Due to confidentiality constraints, from 2014 the breakdown of production by type of coal is estim-ated by the Canadian administration, while stock changes and statistical differences are estimated since 2001.
In the 2018 edition, revisions were made to elec-tricity production from wind back to 2013.
Starting in 2009, a new source has been used for electricity production from solar, wind, and tidal. This new source covers production from solar and wind only from plants with capacity higher than 500 kW.
Heat production includes heat produced by nucle-ar power stations for distribution to other consum-ers up to 1997.

50 - ELECTRICITY INFORMATION: DATABASE DOCUMENTATION (2019 final edition)
INTERNATIONAL ENERGY AGENCY
Transformation For the 2019 edition, breaks in series appear for
solid biofuel inputs to autoproducer electricity plants because of the availability of improved da-ta. Historical revisions are pending.
For 2000, the increase in main activity producer electricity is due to new generation plants in Al-berta and Ontario.
Before 1978, lignite inputs to main activity pro-ducer heat plants are included in final con-sumption. Starting in 1979, these inputs are in-cluded in main activity producer electricity plants.
In the 2016 edition of this publication, there was a reclassification from autoproducer to main activity producer for plants fuelled by biogases and mu-nicipal waste.
For autoproducers generating electricity with pro-cess steam produced from biofuels and waste, the energy required to produce the initial steam is not taken into account by the Canadian administration and as a result the efficiencies are overstated.
The breakdown of electricity and heat generation between natural gas and oil products in main ac-tivity producer CHP plants has been estimated by the Canadian administration starting in 1990. This may cause breaks in the time series between 1989 and 1990.
Net electricity production by autoproducers prior to 1990 includes production from combustible fuel sources only.
Inputs of fuels to heat plants are not available for 1979 to 1987.
Consumption In 2017, the decrease in electricity consumption in
the chemicals sector is partially due to a large con-sumer having been rotated out of the source sample survey used to compile the data.
Under a new methodology introduced in the 2018 edition, non-specified (Other sectors) is being partly treated as a residual Data submitted by Canada for 2015 were for negative -19,998 GWh, which is not possible, so this was revised to zero by the IEA Sec-retariat, with the increased consumption being re-moved from Statistical differences.
Electricity transmission and distribution losses could include statistical difference for certain years.
Consumption of electricity in oil and gas extrac-tion is not available prior to 1987.
Consumption of electricity in coal mines is not available between 1982 and 1986.
Breaks in the time series occur between 1973 and 1974 in agriculture, and between 1987 and 1988 in the industry sector.
Trade Discrepancies occur between respective reported
figures for electricity trade between the US and Can-ada for 2016 onwards. Work to reconcile trade data is an ongoing aspect of the North America Trilateral.
Capacity Only gross maximum electrical capacity is available. Prior to 1981, data on electrical capacity by type of
generation are not available.
Chile
Source Energía Abierta, Comisión Nacional de Energía, Mi-nisterio de Energía, Santiago.
General notes Data are available starting in 1971. In the 2017 edition, data for 2014 and 2015 were
revised to replace figures previously estimated by the Secretariat.
From 1990, consumption in paper and pulp in-cludes forestry and consumption in agriculture is included in non-specified industry. In general, a new methodology has been applied for data since 1990, leading to other breaks in time series be-tween 1989 and 1990.
Other bituminous coal data includes sub-bituminous coal for all years, if present.
Supply Electricity production from geothermal started at
Cerro Pabellón in 2017. In 2014, the Chilean administration applied a
new methodology in the reporting of electricity generation from solar PV and wind, resulting in

ELECTRICITY INFORMATION: DATABASE DOCUMENTATION (2019 final edition) - 51
INTERNATIONAL ENERGY AGENCY
breaks in time series between 2013 and 2014. Re-visions for previous years are pending.
The majority of electricity generation from other sources is from a conveyor belt transporting crushed rock from high altitude to lower altitude in a mine. A small amount from waste heat is also included.
Solar thermal heat production has been estimated by the IEA Secretariat using data published by Chilean ministry of energy.
Heat production from solid biofuels and biogas use in Main CHP plants is not available.
Electricity production by autoproducer hydro plants is self-declared, and as such, subject to vari-ation.
Transformation For 2009 and 2010, inputs of natural gas to auto-
producer CHP plants were estimated by the Chilean administration. For other years, these inputs are included in autoproducer electricity consumption.
In 2014, data inputs to transformation processes were taken from the published energy balance, and the output was estimated based on the efficiency reported in previous years.
Electricity production from other bituminous coal includes sub-bituminous coal.
Production of chemical heat used for electricity generation started in 2013. Besides chemical heat, data for heat production in CHP and heat plants are not available.
Increases in electricity from natural gas in 2010 are due to the openings of new LNG terminals.
The split of electricity generation by main activity and autoproducer by fuel was estimated by the Chilean administration for the period 1990 to 2003.
The variability of electricity output from oil prod-ucts is in part due to the fact that oil-fired power plants are used for backup generation.
Consumption Consumption in agriculture/forestry, and con-
struction are available from 2017. For prior years, data are reported under Industry (non-specified).
Increases in electricity consumption in the road transport sector from 2014 onwards are the result of a new estimation methodology, while electric
vehicles used for the transportation of ores are re-ported as consumption within the mining and quar-rying industry.
Solar thermal consumption data are not available so all consumption data are allocated to the non-specified other sector.
Prior to 2009, most statistical differences are in-cluded in distribution losses.
Trade Imports of electricity from non-specified/others
are from Argentina.
Capacity Installed capacity by type of technology is not
available prior to 2011. Data for peak load is available from 1998.
Czech Republic
Sources Czech Statistical Office, Prague. Ministry of Industry and Trade, Prague.
General notes For 2017, apparent declines in autoproducer heat
production by the chemical (incl. petroleum) sector, and in consumption by petroleum refineries, occur due to the incorporation of an oil refinery into a neighbouring petrochemical enterprise.
Due to ongoing review of energy data for 2010-2014, revisions were made in the 2017 edi-tion.
Data are available starting in 1971. The restructuring of the Czech electricity market
leads to breaks in the time series in all sectors be-tween 1998 and 1999.
In the 2017 edition, data for the Czech Republic were revised back to 2010 due to the acquisition of new administrative data, allowing access to more accurate and detailed data sources. As a result, there are breaks in several time series between 2009 and 2010.
Data from 1990 onwards have been officially submit-ted by the Czech administration. This may lead to breaks in time series between 1989 and 1990.

52 - ELECTRICITY INFORMATION: DATABASE DOCUMENTATION (2019 final edition)
INTERNATIONAL ENERGY AGENCY
Electricity statistics from 1971 to 1989 have been estimated by the IEA Secretariat except for final consumption and trade which were submitted by the Czech administration.
Supply The amount of heat reported under other sources
is primarily waste heat from the glass industry un-til 2009.
From 1999 onwards, small amounts of heat have been exported to Slovak Republic.
Transformation For 2017, heat production from electric boilers
and heat pumps is based on new survey data, whereas, data for prior years have been estimated by the Czech administration. As a result, some breaks in series may occur. Historic revisions are pending.
In 2016, a main activity producer CHP incinera-tion plant fired by municipal waste was in test operation at Chotíkov.
Electricity generated from waste heat in CHP plants is included with the total production from combustible fuels.
In the 2017 edition, a revision of the methodology for reporting the production of autoproducer plants running on combustible fuels causes multiple breaks in time series between 2009 and 2010 for CHP and electricity-only plants.
Data on imports and own use of heat are available from 2009 and 2010 respectively
The production of electricity reported in the cate-gory other fuel sources refers to electricity pro-duced from turbines driven by the mixture of air, ammonia and other non-coal gases derived from the petrochemical industry.
From 2014, some autoproducer heat plants pro-duction figures became too small to appear in data collected.
From 2012 data, new autoproducer heat plants were added to the data collection, causing a break in time series.
In 2012, a main activity producer electricity plant using solid biofuels started to produce also heat and was reclassified as main activity CHP plant.
A different reporting methodology used by the Czech administration for biofuels and waste caus-
es some breaks in time series between 2002 and 2003.
In 1999 and 2000, various large enterprises were divided, sold and merged. This causes breaks in the time series of all types of plants.
Industrial waste use in main activity producer electricity plants is included with solid biofuels from 1996.
Data on biogases and waste used in main activity producer CHP and autoproducer heat plants start in 1993.
Prior to 1990, electricity production in main activ-ity producer CHP and autoproducer CHP plants is included in main activity producer electricity plants.
Prior to 1990, heat production excludes heat sold by industry. In addition, heat production prior to 1990 is reported under main activity heat plants because the breakdown by producer and plant type is not available before then.
The breakdown of net electricity production by source is not available prior to 1990.
Data on heat production, and the corresponding fuel inputs, have been estimated from 1980 to 1989 based on consumption in residential and commercial/public services. Prior to that, inputs are included in industry.
Consumption Data on electricity consumption by cable cars (re-
ported under non-specified transport) are available from 2017.
Data for direct use of solar energy are available from 2003.
Prior to 2000, the split of rail transport and non-specified transport is not available.
Trade From 1999 onwards, small amounts of heat have
been exported to Slovak Republic.
Capacity Starting in 2000, the peak load data reported in
main activity producers includes the autoproduc-er’s value which is no longer reported in its own right.
The breakdown of generating capacity is not avail-able prior to 1990.
ELECTRICITY INFORMATION: DATABASE DOCUMENTATION (2019 final edition) - 53
INTERNATIONAL ENERGY AGENCY
Denmark
Source Danish Energy Agency, Copenhagen.
General notes In the 2004 edition, major revisions were made by
the Danish administration for the 1990 to 2001 da-ta, which may cause breaks in time series between 1989 and 1990.
Heat data are not available prior to 1976. Between 1995 and 2004, other hydrocarbon im-
ports and inputs to main activity producer CHP plants represent orimulsion.
From 1990 onwards, Greenland and the Danish Faroes are not included in the oil data.
Supply For 2017, the decline in electricity and heat output
from other bituminous coal and the corres-ponding increases in output from solid biofuels are attributable to fuel switching in co-fired plants
A large increase of steam coal imports in 2003 was related to a drought in Scandinavia. Thermal power plants were operated more intensively to replace hydro-generated electricity that was consumed in the country. Additionally, more coal-generated elec-tricity was exported to other countries in the region. Significant fluctuations in demand are also evident for other years for similar reasons, including 2006 and 2013, but exist to a lesser extent.
Declines in stocks of steam coal stem from ex-tensive deployment of renewable generation tech-nologies and policy to further reduce Denmark’s utilisation of coal-fired power and implement co-firing with renewable fuels as a part of their Energy Strategy 2050.
The amount of heat reported under other sources is heat recovered from industrial processes and sold for district heating.
Heat produced for sale by heat pumps starts in 1994.
Geothermal and solar heat production for sale is available from 1989.
From 1984 onwards, small amounts of heat have been imported from Germany.
The production of electricity from wind is avail-able from 1978.
Transformation Due to improved survey methods, inputs to elec-
tricity and heat generation have been reclassified, causing a break in time series between 1993 and 1994. The oil inputs used in industrial sub-sectors for producing surplus heat, which is delivered to district heating networks, are allocated to these in-dustrial sub-sectors.
In 1994, the marked increase in inputs to CHP pro-duction is due to increased electricity exports to Norway.
From 1974 to 1979, consumption of fuel oil for the CHP production by autoproducers has been estimated.
Fish oil used in main activity producer heat plants is included with solid biofuels.
Due to the high number of heating companies burning wood chips that are equipped with boilers with flue-gas condensation, the solid biofuels heat plants show a high efficiency. The efficiency de-cline evident in 2016 was due to two less efficient plants switching to biofuels.
For some years, heat plants fired by natural gas, municipal waste, biogases, and other oil prod-ucts show efficiencies greater than 100%, on a net calorific value basis, due to the use of con-densing boilers and other flue gas condensation technologies that recover the latent heat of vapor-isation.
Biodiesels and biogasoline consumption for elec-tricity and heat production are reported under oth-er liquid biofuels, for confidentiality reasons.
Data for other liquid biofuels main activity heat plants are available back to 1994.
Consumption In the 2016 edition, the Danish administration re-
vised electricity and heat consumption in the in-dustry sector from 1990.
For 2015 and 2016 data, the breakdown of electrici-ty and heat total final consumption is estimated by the Danish administration based on 2014 data and will be revised in the following reporting cycle once their new industry survey results are released.
The direct use of solar thermal energy is available from 1978.
Electricity consumption in non-specified industry includes consumption in district heating plants and for the distribution of electricity.
54 - ELECTRICITY INFORMATION: DATABASE DOCUMENTATION (2019 final edition)
INTERNATIONAL ENERGY AGENCY
Trade From 1984 onwards, small amounts of heat have
been imported from Germany.
Capacity Prior to 1981 for main activity producers and to
1994 for autoproducers, data on electrical capacity by type of generation are not available.
Estonia
Source Statistics Estonia, Tallinn.
General notes Data for Estonia are available starting in 1990.
Prior to that, they are included in Former Soviet Union in the World Energy Statistics publication.
Transformation Fuels reported as coke oven coke and gas works
gas are the solid and gaseous by-products of oil shale liquefaction, and main activity heat and elec-tricity generation from these fuels is tightly associ-ated with liquefaction plants.
Inputs of fuel oil and gas works gas to trans-formation processes include shale oil.
In the 2018 edition, the surge in main activity heat from solid biofuels was related to reclassification from autoproducer heat plants, where previously au-toproducer own use heat and associated fuel inputs are not reported, and the fuel consumption appears in the main economic activity of the autoproducer.
From 1990 to 1999, some of the electricity and heat production are reported under other oil products while the inputs are reported under the individual fuels.
Consumption Electricity consumption in the non-specified en-
ergy sector includes consumption in the Classifica-tion of the Economic Activities in the European Community (NACE) 3512 and 3513 categories.
Finland
Source Statistics Finland, Helsinki.
General notes In 2014, a new survey system and a reclass-
ification of the data lead to breaks in the time se-ries between 1999 and 2000 for most products and sectors. The new survey system is more detailed and has better product coverage, especially in elec-tricity, CHP and heat production, as well as in industry.
A large increase of steam coal imports in 2003 is related to a drought in Scandinavia. Thermal pow-er plants were operated more intensively to replace hydro-generated electricity that is consumed in the country. Additionally, more coal-generated elec-tricity was exported to other countries in the region.
The increase of other bituminous coal inputs into main activity producer electricity plants from 1993 to 1994 was due to coal replacing imported elec-tricity and hydro power.
Hard coal data prior to 1978 may include sub-bituminous coal.
Supply Electricity production in Finland is affected by the
connection to the Nord Pool. During periods of high rainfall, importing electricity from other Nor-dic countries is more economic than producing it. This can cause breaks in the time series.
Other sources include hydrogen, purchased steam, and heat recovered from flue gas scrub-bers. For 2017, the increase in heat production from other sources is due to the reporting of heat recovered from flue gas scrubbers for the first time.
The increasing heat production from heat pumps in 2007 and 2008 is due to the opening of the Kat-ri Vala district heating and cooling plant.
Heat from chemical processes and associated elec-tricity generation are available from 2000.
Transformation In 2017, the use of coal in main activity producer
electricity plants decreased considerably following

ELECTRICITY INFORMATION: DATABASE DOCUMENTATION (2019 final edition) - 55
INTERNATIONAL ENERGY AGENCY
the move of a large plant to the national capacity reserve.
In the 2017 edition, fuel inputs and heat pro-duction from peat main activity heat plants have been revised from 2000 as a result of new data ac-cess for smaller peat heat plant units.
The significant increases and decreases of other bituminous coal inputs into main activity producer electricity plants from year to year are due to coal replacing imported electricity and hydro power.
Likewise, peat production is highly dependent upon favourable weather conditions and the pric-ing of other fuels. The decrease in peat and other bituminous coal usage in main activity electricity plants in 2008 was due to record electricity genera-tion from hydro plants. A similar circumstance oc-curred in 2012.
Electricity plants data may include some CHP plants operating in electricity-only mode. Like-wise, heat plants data may include some CHP plants operating in heat-only mode.
In the 2017 edition, fuel inputs and heat pro-duction from peat main activity heat plants have been revised since 2000 as new data became avail-able for small peat heat plant units.
In the 2016 edition, the allocation of solar photo-voltaic between main activity and autoproducer plants was revised.
From 2014 data, an autoproducer in the field of iron and steel industry running on coke oven gases and blast furnace gases was sold and is now re-ported as main-activity producer.
The increase in heat production from municipal waste in 2014 is due to the opening of a new plant.
In 2014, the new consumption of other liquid bio-fuels in main activity electricity plant corresponds to biopyrolysis oil made from wood chips.
Data on peat products electricity and heat genera-tion are available since 2008. Prior to that, they are included in peat.
Heat output from autoproducer CHP plants is available starting in 1996 and from autoproducer heat plants starting in 2000; corresponding inputs may be under-reported.
Before 1999, all electricity production from auto-producers running on fuelwood is allocated to CHP plants.
Electricity and heat production from biogases are available from 1996.
Prior to 1992, outputs from the use of combustible renewables and waste to generate electricity and/or heat were included in peat. Therefore, the IEA Secretariat estimated the breakdown of out-puts from municipal waste and solid biofuels based on reported inputs.
Inputs of liquid fuels and natural gas to CHP plants are included with the inputs of these fuels to main activity producer electricity-only and heat-only plants prior to 1978.
Electricity production from biofuels and waste is not available between 1974 and 1976.
Consumption For 2016 data, the production of heat from oil re-
fineries in autoproducer plants ceased, following the change of ownership of these plants and their reclassification to main activity producers. This re-sult in the consumption of (sold) heat under the oil refineries sub-sector to jump as most heat formerly produced by oil and gas autoproducers are now purchased.
In the 2017 edition and following, an extended review of NACE sector encoding by the Finnish administration resulted in the revision of the sec-toral heat consumption time series back to 2007, leading to breaks in time series between 2006 and 2007 in some heat consumption sectors.
A new survey of the agriculture and forestry sector leads to breaks in the electricity consumption be-tween 2007 and 2008.
The split of heat consumption in the different ind-ustry sectors is available starting from 2007. Prior to that, it is aggregated in non-specified industry.
Prior to 2000, consumption of heat in residential includes consumption in agriculture/forestry and commercial/public services.
Consumption of electricity in the industry sub-sector machinery includes consumption in trans-port equipment prior to 1995.
Capacity Prior to 2000, capacity reported in autoproducers
steam generation includes all types of generation. Net maximum electrical capacity data are not
available prior to 1974.

56 - ELECTRICITY INFORMATION: DATABASE DOCUMENTATION (2019 final edition)
INTERNATIONAL ENERGY AGENCY
France
Source Ministère de la Transition Écologique et Solidaire, Paris.
General notes In the 2019 edition, data for France were revised
back to 2011 in include the following overseas de-partments (Guadeloupe; French Guiana; Marti-nique; Mayotte; and Réunion).
In the 2018 edition, data for France were revised back to 2011 following changes in methodology and procedures used by the energy statistics sub-department (SDSE) within the Ministry for the ecological and inclusive transition. As a result, the revisions, to bring the reporting more in line with the international standards, impacted all fuels.
From 2012, the energy consumption is more de-tailed due to a more precise national survey.
For 1989 to 1998, the IEA Secretariat has estim-ated industry consumption based on Consomm-ations d’Énergie dans l‘Industrie, SESSI.
Hard coal data prior to 1978 may include sub-bituminous coal.
In the 2018 edition, solid biofuels’ indigenous production and inputs to main activity and auto-producer heat plants have been revised back to 2007 Electricity production has been revised back to 2013. This causes breaks in time series between 2006 and 2007 as well as 2012 and 2013.
In the 2018 edition, indigenous production and inputs to main activity heat plants have been re-vised back to 2007 for municipal waste. Electrici-ty production has been revised back to 2011. This causes breaks in time series between 2006 and 2007 as well as 2010 and 2011.
Supply In the 2019 edition, heat supply and consumption
data were revised due to improved information on heat production from renewables.
All solar photovoltaic plants with capacity above 1 MWp are considered as main activity producers, while all plants with capacity below that value are considered autoproducers.
Electricity production from other sources is avail-able starting in 2007, representing production of
electricity from purchased steam. The input is shown under non-specified transformation.
Data on electricity production from wind are available from 1990.
For 2013, the split between electricity generation from main activity and autoproducer wind plants has been estimated, pending receipt of revised da-ta.
Transformation For 2014 onwards, the implied efficiencies of heat
pumps are much lower than expected. This is un-der investigation by the French Administration, and revisions are expected in future editions.
The methodology for reporting inputs to CHP plants is under currently under review by the French administration and historical revisions are expected.
For the 2018 edition, revisions for heat production in all plant types were received and accepted for many fuels from 2007 onwards, with the exception of natural gas, where the planned revisions for 2007 and 2008 are still pending implementation by the Secretariat.
For the 2018 edition, electricity production from hydro was revised back to the year 2000, in some cases only amounting to plant reclassification.
In 2016, the company that consumed blast fur-nace gas for electricity and heat generation ceased its activity.
Electricity production from the Bouillante geo-thermal main electricity plant in Guadeloupe is included from 2011 onwards, when data coverage for France is extended to include the overseas de-partments. Electricity production from autopro-ducer geothermal started in 2011 and stopped in 2012 due to the maintenance of the only plant. This production restarted in 2016.
Starting in 2012, separate data on main activity heat plants inputs are available for oil products.
Heat not sold in autoproducer plants is included in total heat production up to 2007.
In 2005, autoproducer CHP efficiencies for bio-gases drop due to the opening of a larger, less effi-cient plant.
From 2000 several plants have been reclassified from electricity-only to CHP plants. This causes breaks in the time series between 1999 and 2000.

ELECTRICITY INFORMATION: DATABASE DOCUMENTATION (2019 final edition) - 57
INTERNATIONAL ENERGY AGENCY
Prior to 2000, inputs and outputs of oil products are not available separately and are reported to-gether under other oil products. From 2000 to 2008, there are further classification problems for inputs and outputs of electricity and heat from oil products. The French administration is working to reconcile their data collection methods for the in-puts and the outputs for electricity generation.
A new method of survey and a reclassification between main activity producer electricity plants and autoproducer electricity plants may cause breaks in the time series for other bituminous coal between 1998 and 1999.
There was reclassification on autoproducer plants using municipal waste in 1995, which leads to a break in the time series.
Net electricity production by autoproducer CHP plants is available from 1989.
Net electricity production by autoproducers prior to 1983 includes production from combustible fuel sources only.
Consumption In the 2019 edition, revisions for 2011 onwards
were received for all electricity consumption flows, based on a correction to a survey. This has introduced a wider statistical difference than pre-viously published, and is under review.
In the 2018 edition, revisions for 2011 onwards were received for all electricity consumption flows, based on an improved survey. This has led to breaks in time series between 2010 and 2011. Similarly, heat consumption from 2007 onwards was revised to account for autoproducer own use heat generation in its correct economic activity.
In the 2017 edition, the French administration un-dertook comprehensive revisions on sectoral elec-tricity consumption time series, for some sectors revising back to 1990. Electricity consumption at railway and bus stations, shipping piers and air-ports is no longer included in the transport sector but in the commercial and public services sector. Road electricity consumption has also been re-vised back to 1990, following an extended review of NACE sector encoding by the administration. These revisions created breaks in time series for several sectors, which the administration antici-pates to address in subsequent reporting cycles.
For the 2014 edition of this publication, the French administration revised electricity consumption da-ta in the agriculture/forestry sector back to 2004, resulting in breaks in time series.
Consumption of electricity in uranium treatment plants is confidential for the period 2003 through 2010, and unavailable prior to 1980.
Data on heat distribution losses are available only starting from 2007. Prior to that, they were in-cluded in final consumption.
Prior to 2005, all the geothermal heat con-sumption was reported as direct use. From 2005 data, some quantities are reported as output of heat plants, resulting in breaks in time series for pro-duction, transformation and consumption.
Consumption of electricity for oil and gas extrac-tion includes that used in oil refineries from 1988 to 2000.
Non-specified other consumption includes exports to Monaco prior to 1992 and defence-related activ-ities, among others.
The industry classifications used by the French administration were changed in 1986.
There are major breaks in the time series in 1965 when more detailed breakdown of data on elec-tricity consumption became available.
Capacity The main activity plants peak load includes also
the peak load of autoproducers plants. Prior to 1981 and after 1999, data on electrical
capacity by type of generation and fuel are not available.
Germany
Source Federal Ministry for Economic Affairs and Energy, Berlin.
General notes Data starts in 1960. German data include the new
federal states of Germany from 1970 onwards. The German administration has changed the meth-
odology for reporting heat over time:

58 - ELECTRICITY INFORMATION: DATABASE DOCUMENTATION (2019 final edition)
INTERNATIONAL ENERGY AGENCY
Starting in 2007, more information is available on main activity heat plants and additional inputs started to be reported for this category. This causes breaks in time series between 2006 and 2007.
Between 2003 and 2006, autoproducer heat output was provided, but no inputs.
Between 2002 and 2003 and between 2003 and 2004, breaks in time series occur, due to the imp-lementation of the Energy Statistics Act, collection concerning heat produced in heat plants and dis-trict heating plants became more efficient and more complete.
Comprehensive official data are only collected for the aggregate of hard coal. Due to the unavaila-bility of detailed data, the split into anthracite, coking coal and other bituminous coal is partly estimated by the national administration.
In the 2014 edition, significant revisions were submitted for all primary coal types, derived prod-ucts and manufactured gases for the period 2003 to 2011 as previous estimations were updated with more accurate information. Revisions primarily af-fected consumption, including industry and other sectors; but also supply, statistical differences and weighted calorific values.
Prior to 1970, heat production and consumption have been estimated by the Secretariat based on Energiebilanz für die Bundesrepublik für das Jahr 1990 provided by the German Institute for Economic Research.
Supply In some instances, electricity generation from nu-
clear, hydro, solar, wind and biogases in auto-producer electricity plants is confidential or not available and therefore is included in main activity producer electricity plants.
For 2017 onwards, own-use consumption of elec-tricity by wind plants is assumed to be 2% at on-shore and 1.5% for off-shore wind farms. For prior years, own-use only included electricity drawn from the grid while the turbines were not in operation.
Since 2011, due to a reclassification of wind ener-gy and solar photovoltaic in the official data of the German Federal Statistical Office, the pro-duction is now only reported under main activity producer plants.
Electricity production from other sources is avail-able starting in 2003. This refers to the production
of electricity from turbines which are located at pressure drops in fluid transport and from pur-chased waste heat.
Prior to 1991, electricity trade data includes only trade of the Former Federal Republic of Germany.
Data on electricity production from wind and solar are available from 1986 and 1990, respectively.
Starting in 1984, small amounts of heat have been exported to Denmark.
Transformation For 2018p, the increase in electricity output from
solar PV was in part due higher than average so-lar radiation during that year.
For 2018p, the increase in heat output from bio-gases was mainly due to an increase in survey coverage following an amendment to the Energy Statistics Law in 2017.
Electricity inputs to both mixed hydro and pure pumped storage pumping plants are reported un-der inputs to pure pumped storage. Disaggregated data will be available starting with 2018.
Detailed data by fuel are not available for total heat production. The non-allocated part is reported as heat production from non-specified com-bustible fuels.
Weather conditions were not favourable for wind and solar generation in 2016.
In 2015, a reclassification of some main activity producer electricity and CHP plants to autoproducer CHP plants powered by coke oven gas results in a break in time series for this period. Similarly, a re-classification of blast furnace gas main activity electricity plants into autoproducer plants results in a break in time series for the same period.
From 2003 onwards, all heat production in auto-producers is considered as non-sold (i.e. for self-use) and, therefore, not reported. Inputs for this heat production are no longer reported in the trans-formation sector.
For 2002 and 2003, the German administration did not submit the breakdown of electricity and heat production from combustible fuels. The data were estimated as follows: renewables and waste were taken from the Renewables and Waste Question-naire and the other combustible fuels were esti-mated pro rata based on 2001 estimates.
Prior to 2003, electricity production in electricity plants includes production from CHP plants and

ELECTRICITY INFORMATION: DATABASE DOCUMENTATION (2019 final edition) - 59
INTERNATIONAL ENERGY AGENCY
heat production in CHP plants includes production from heat plants.
Due to the implementation of the Energy Statistics Act, collection concerning heat produced in heat plants and district heating plants became more ef-ficient and more complete. This leads to breaks in time series between 2002 and 2003 and between 2003 and 2004.
A new survey for the renewable products can cause breaks in the time series between 1998 and 1999.
Prior to 1995, inputs of natural gas for main activi-ty producer heat plants are included with main ac-tivity producer CHP plants.
Prior to 1993, all heat production from BKB/peat briquettes is included in main activity producer CHP plants.
Consumption In 2016, increases in electricity generation by au-
to-producers within the transport equipment indus-trial sector are due to reclassifications from main activity generation, rather than the development of new plant.
More information on district heat became avail-able, causing breaks in the time series between 2006 and 2007.
Data on geothermal heat production and direct consumption are only available starting in 2003.
From 2002, electricity consumption in the com-mercial and public services sector includes the construction sector, and the fishing, agriculture and forestry sectors for the whole time series.
In 2000, revisions from the German administration to the electricity consumption data may cause breaks in the time series.
In 1995, the German Federal Statistics Office re-classified some industrial branches which may cause a break in time series in industry sub-sectors.
Between 1971 and 1980 electricity consumption in coal mines includes consumption in coke ovens and BKB plants.
Trade Prior to 1991, electricity trade data includes only
trade of the Former Federal Republic of Germany. Starting in 1984, small amounts of heat have been
exported to Denmark.
Capacity Electricity generating capacity before 1991 covers
the Former Federal Republic of Germany, and ex-cludes the absorbed states of the Former German Democratic Republic.
Prior to 1974 and after 2001, data on electrical capacity by type of generation are not available.
Greece
Source Ministry for Environment and Energy, Athens.
Supply For 2016, gross electricity generation from com-
bustible fuels in main activity electricity and auto-producer CHP units was estimated by the IEA Sec-retariat, based upon the gross to net ratio for com-bustible fuels for these plant types in 2015. This increase in production was assigned to lig-nite-fired and natural gas-fired plant.
No production of solar heat is reported.
Transformation In 2017, electricity production from industrial
waste in autoproducer electricity plants was sus-pended.
In 2008 a new plant using refinery gas started operating in an experimental phase, causing a low efficiency.
Production and consumption of distributed heat (heat sold) that is produced from lignite is availa-ble from 1997.
The big increase in delivery of industrial waste to autoproducer CHP plant in 2010 is mainly due to the opening of a new plant.
Industrial waste used in autoproducer CHP plants decreased substantially in 2006 because a plant closed.
Data for biofuels and waste input and output to transformation are available from 1992.
Consumption Transmission and distribution losses of electricity
increased between 2013 and 2016 due to growth in non-technical losses. Data reported for 2017 show a noticeable decline in losses. However, this is un-der review.
60 - ELECTRICITY INFORMATION: DATABASE DOCUMENTATION (2019 final edition)
INTERNATIONAL ENERGY AGENCY
Electricity consumption in road is available from 2013.
A break in time series exists between 1991 and 1992 for electricity consumption in transport.
Direct use of geothermal heat in residential is available starting in 2004.
Electricity consumption in iron and steel and in the non-ferrous metals industry prior to 1971 has been estimated by the Secretariat.
Capacity Prior to 1981, data on electrical capacity by type of
generation are not available.
Hungary
Source Hungarian Energy and Public Utility Regulatory Authority, Budapest.
General notes Data are available starting in 1965. The Hungarian administration submitted ques-
tionnaires to the IEA Secretariat for the first time with 1993 data.
From 1992, the production of sub-bituminous coal has been included with lignite due to the low quali-ty of the coal. For 1990 to 1999, the use of this do-mestic coal in main activity producer electricity and CHP plants has also been included with lignite.
Supply For 2017 onwards, inputs and outputs from power
plants are reported at a unit level, while for prior years, data are reported at a plant level. As a re-sult, breaks in series are observed between 2016 and 2017. In particular, for electricity output from main activity producer CHP and main activity producer nuclear power plants, and for heat out-put from industrial waste at autoproducer CHP and autoproducer heat plants.
In 2017, a main activity producer CHP plant was reclassified as an autoproducer. As a result, de-clines are observed in heat production from other bituminous coal and industrial waste, as heat previously sold may now be used onsite.
Other sources electricity and heat production is available from 2013 and represents generation
from residual tail gases from the manufacturing of soot as well as from hydrogen.
Geothermal heat production from main activity producer heat plants is available from 1995.
Nuclear electricity production in main activity producer electricity plants is available from 1983.
Transformation In late 2017, a new geothermal power plant began
operations. For 2017, the decline in heat production from in-
dustrial waste is partly due to the reclassification of a main activity producer as an autoproducer.
Heat and electricity consumption by military ser-vices is reported under Other sectors - non-specified for the first time in 2015. The change is due to the recent authorisation to disseminate these data. Previously they were included under Com-mercial and public services.
From 2014 data onwards, more data suppliers were involved in submitting energy data to the national administration, causing new autoproducer time se-ries to appear for geothermal and industrial waste plants.
In 2014 data, some CHP plants running on solid biofuels produced only heat and were reclassified as heat plants.
The Hungarian administration reclassified some of their plants between 1996 and 2000, which may lead to breaks in the time series.
Prior to 2000, electricity output from sub-bituminous coal is included with lignite.
Autoproducer heat and power plants using coke oven gas and blast furnace gas were reclassified in 1998 as main activity power plants.
Since 1997 two autoproducer heat plants have been reclassified to main activity producer heat plants.
Data on electricity and heat production from solid biofuels in autoproducer CHP plants are available from 1995.
Autoproducer electricity, CHP, and heat plants using coke oven gas and blast furnace gas were reclassified as main activity power plants in 1998.

ELECTRICITY INFORMATION: DATABASE DOCUMENTATION (2019 final edition) - 61
INTERNATIONAL ENERGY AGENCY
Consumption Data for direct use of solar thermal heat are avail-
able from 2001 and from 1990 for geothermal heat.
Iceland
Source National Energy Authority, Reykjavik.
General notes Prior to 1970, final consumption includes inputs
and outputs to heat production. The industrial classifications used by the Icelandic
administration were changed in 1987.
Supply The increase in hydro and geothermal electricity
production from 2007 is due to the expansion of the aluminium industry.
Transformation For 2016, access to improved data revealed
considerably better heat plant efficiencies than previously inferred, with increases in heat produc-tion seen during this period. The Icelandic admin-istration plans to revise previous years’ figures in succeeding editions.
From 2013 data, the Hellisheidi geothermal pow-er plant, previously reported under main activity electricity plant, was categorised as main activity CHP plant.
Heat production from municipal waste is availa-ble from 1993 and stops in 2010.
In 1998, 60 MW of generating capacity was in-stalled in the geothermal CHP plant at Nesjavellir. Since the plant was inoperable for four months, production of geothermal heat decreased com-pared to 1997. The extra electricity capacity caused electricity production from geothermal to almost double over the same period.
Electricity production from geothermal sources in main activity producer CHP plants is available from 1992.
Consumption For 2017, the split between electricity consump-
tion in the iron and steel, and non-metallic miner-als sectors has been estimated by the IEA secre-tariat.
The significant increase in electricity consumption in the commercial and public services sector from 2015 onwards is due to the growth of cryptocur-rency mining.
Gross heat production from geothermal sources increased by 30% in 2016 from 2015. This is due to more accurate reporting from Reykjavik Energy about the temperature of delivered and returned water, rather than physical increases in supply or generation. Revisions to historical data may be forthcoming in future editions.
In the 2015 edition, the heat consumption break-down by sector for the years 1990 onwards has be-come available following reviews by the Icelandic administration. In addition, heat consumption was revised significantly upwards as more information became available. This has caused large breaks in time series across the heat balance between 1989 and 1990.
Revisions in direct use of geothermal heat start-ing in 2013 create breaks in time series between 2012 and 2013.
Direct use geothermal consumption in the industri-al sector is reported under non-specified industry, as the Icelandic administration decided not to estimate the allocation amongst the sub-sectors of industry.
Electricity consumption in non-specified transport includes consumption for ferries and cruise lines.
Non-specified consumption of electricity within the energy sector refers mainly to the use of electricity by the geothermal industry to pump hot water from underground sources, and from 1991, also includes electricity used for the transport by pipeline of hot water from Nesjavellir to Reykjavik.
The increase of electricity consumption in the con-struction sector from 2004 to 2007 is due to the drilling of tunnels for the Kárahnjúkar power plant.
The consumption of electricity reported in non-specified other corresponds to a NATO base at Keflavik airport which closed in 2005.
Prior to 1990, all heat for space heating was re-ported in residential.
The residential sector includes agriculture prior to 1983.

62 - ELECTRICITY INFORMATION: DATABASE DOCUMENTATION (2019 final edition)
INTERNATIONAL ENERGY AGENCY
Prior to 1970, total final consumption includes inputs to and outputs from heat production and non-energy use. After 1970, data on inputs and outputs in CHP plants and in main activity produc-er heat plants (district heat plants) and for non-energy use are separately specified.
Ireland
Sources Department of Communications, Energy and Natu-
ral Resources, Dublin. Sustainable Energy Authority of Ireland, Cork.
General note Data for solid biofuels and biogases are available
from 1990.
Supply Electricity production from wind begins in 1992
and from biogases in 1996. Rainfall in 2012 led to the lowest peat harvest since
IEA records began in 1960, requiring large stock drawdown and increased use of biofuels for elec-tricity generation. In 2013, production targets were met before the end of the year however production continued in order to further build stocks to allevi-ate the potential impacts of future weather events.
Low production of peat in 1985 was due to a poor “harvest”, due to an unusually wet summer.
Production data for peat products (briquettes) are available from 1975.
Transformation In 2018, electricity output from other bituminous
coal declined due to a 3-month shutdown at Moneypoint power station.
In 2017, a new municipal waste-fired main activi-ty producer electricity plant (Dublin waste-to-energy) began operations.
Starting in 2016, the increase of electricity produc-tion of solid biofuels is a result of a decarbonisation programme and comes from a plant which is co-firing peat and biomass.
In the 2016 edition, revisions were introduced in the electricity generation by fuel from 2010 due to
improved data available from the transmission sys-tem operator.
In 2015, a new combined cycle gas turbine plant began commercial operations at Great Island pow-er station, replacing the existing heavy fuel oil power plant.
In 2012, a new municipal waste-fired main activi-ty producer electricity plant (Meath waste-to-energy) began operations.
In 2011, very little electricity was produced from pumped hydro as Turlough Hill, Ireland’s pumped storage station, was taken offline from late 2010 until February 2012. The 2011 values appear as zero due to rounding.
Since 2006, a different methodology for allocating unsold steam from autoproducer CHP is used.
Other bituminous coal inputs to main activity producer electricity plants increased from 1986 due to three new generating units at Moneypoint coming online.
From 1984 to 1989, inputs of hard coal in auto-producer CHP plants have been estimated by the Secretariat.
Consumption In 2004, the increase of electricity consumption is
due to the new light rail transit system in Dublin. The decrease of electricity consumption in the iron
and steel sector from 2001 onwards is due to Ire-land’s main steel plant ceasing production.
Prior to 1990, electricity consumption in agri-culture is included with residential.
Electricity consumption in the iron and steel in-dustry includes consumption in the non-ferrous metals industry prior to 1990.
Data for direct use of geothermal heat and solar thermal heat are available from 1989 and 1990, respectively.
Capacity Capacity reported under other sources corresponds
to cross-border transmission capacity with North-ern Ireland.
Prior to 1981, data on electrical capacity by type of generation are not available for main activity producers.

ELECTRICITY INFORMATION: DATABASE DOCUMENTATION (2019 final edition) - 63
INTERNATIONAL ENERGY AGENCY
Israel
Source Israel Central Bureau of Statistics, Jerusalem.
General notes Data are available starting in 1971. For 2018p, all data have been estimated by the
IEA Secretariat. The statistical data for Israel are supplied by and
under the responsibility of the relevant Israeli ad-ministration. The use of such data by the OECD and/or the IEA is without prejudice to the status of the Golan Heights, East Jerusalem and Israeli set-tlements in the West Bank under the terms of in-ternational law.
Due to the unavailability of data for certain fuels, some data for Israel have been estimated by the IEA secretariat. In particular, some oil data in 2014 and 2015, natural gas data from 2012 on-wards, and renewables and waste data in 2013.
Supply Due to confidentiality constraints, imports of oth-
er bituminous coal have been estimated by the IEA Secretariat for 2016.
Electricity production from wind begins in 2001. Autoproducer electricity generation from chemi-
cal heat (production of sulphuric acid) occurs, but is not reported separately or included elsewhere in national totals, with the exception of 2017.
Transformation For 2017 data, due to confidentiality reasons, elec-
tricity production reported under auto producer wind includes generation from main activity wind, total hydro, and autoproducer biogases. Similarly, for 2016 data, reported auto producer solar PV generation includes total generation from hydro and wind.
The 2016 data for natural gas inputs to electricity production were estimated by the IEA Secretariat.
For 2013 and 2014, other oil products inputs to autoproducer electricity plants were estimated by the IEA Secretariat.
Consumption Since the 2017 edition, solar thermal production
and direct consumption were revised, and are now estimated by the IEA Secretariat from 2012 on-wards, using data published in the IEA Solar Heat-ing and Cooling Programme Annual Report. These estimations may create breaks in time series be-tween 2011 and 2012.
For 2013 onwards, for reasons of confidentiality, electricity consumption in non-ferrous metals is included under mining and quarrying, and con-sumption in chemical (including petrochemical) and construction is included under not elsewhere specified (industry).
For 2013, and 2015 onwards, the split of electrici-ty consumption in industry has been estimated by the IEA Secretariat. In addition, electricity con-sumption in agriculture/forestry for 2015 onwards has also been estimated by the IEA Secretariat.
Electricity own use, as well as transmission and distribution losses were estimated by the IEA Sec-retariat from 2010 to 2012.
Capacity In the 2014 edition, main activity plants net
electricity capacities by type of generation have been revised back to 2008 by the Israeli administration and capacities by fuel have been estimated by the IEA Secretariat for the same period. This leads to breaks between 2007 and 2008.
From 2013 onwards, the split of combustible fuels autoproducer electrical capacity by fuel type is un-available.
Italy
Sources Ministry of Economic Development, Rome. Terna, Rome.
General notes A change in methodology lead to breaks in time
series for industry and transformation between 2003 and 2004.

64 - ELECTRICITY INFORMATION: DATABASE DOCUMENTATION (2019 final edition)
INTERNATIONAL ENERGY AGENCY
Supply For 2017, more information became available on
fossil fuel use in heat plants allowing additional inputs to be reported for this category. This causes breaks in time series between 2016 and 2017.
The production of electricity reported in the cate-gory other fuel sources refers to electricity pro-duced from turbines which are located at pressure drops in fluid transport.
The methodology of data collection for photo-voltaic electricity production changed in 2009 and the distinction between main activity and auto-producer plants could not be determined, causing a break in the time series.
Electricity trade with Malta commenced in 2015, following the opening of the Malta-Sicily inter-connector submarine power cable in the same year.
Transformation For 2018p, the decrease in electricity output from
Solar PV was due to lower than normal solar ra-diation.
Prior to 2000, electricity used for pumped storage (mixed plants) is included under used for pumped storage (pure hydro pumping plants).
In 2016, the decline in autoproducer electricity generation and sold heat production by oil refiner-ies is partly due to the activities of these units being split off and reclassified as main activity enterprises.
Breaks in the time series between 2014 and 2015 for coke oven gas, blast furnace gas and other recovered gases are due to a reclassification of main activity producers and autoproducers.
The methodology of data collection for the geo-thermal sector changed in 2010, causing a break in time series between 2009 and 2010.
Prior to 2009, sub-bituminous coal used in main activity electricity plants was included under other bituminous coal.
With the introduction of a new survey in 2008, amounts of naphtha and other kerosene that were previously included in other oil products have been reported separately in autoproducer CHP plants.
Prior to 2004, electricity production from ori-mulsion is confidential and is included with fuel oil.
Heat production is reported starting in 2004 and includes self-generation in industry.
For data since 2001, calorific values for imports of other bituminous coal and sub-bituminous coal are derived from inputs to main activity electricity generation.
From 2000 onwards, the Italian administration defines electricity and heat production from auto-producers as generation from producers that con-sume more than 70% of their own electricity pro-duction. However, for the 2000 to 2002 period, all electricity production from autoproducers is re-ported with main activity producers.
The breakdown of renewables and waste inputs into electricity, heat and CHP plants is available from 1989 only. Prior to that year, the total of the different fuels involved is reported as non-specified renewables.
Prior to 1984, net electricity production by auto-producers includes production from combustible fuel sources only.
Consumption Non-specified energy industry own use includes
electricity consumption for blast furnaces. From 2000, it also includes consumption for the dis-tribution of gas and prior to 1989 consumption for uranium extraction.
The breakdown of heat consumption by sector is estimated by the Italian administration.
Revisions of the final consumption of heat by the Italian administration led to breaks between 2010 and 2011.
From 1981, consumption of electricity in transport includes electricity used for pumping in oil pipelines.
Trade Electricity trade with Malta started in 2015, fol-
lowing the opening of the Malta-Sicily inter-connector submarine power cable in the same year.
Capacity Prior to 1981, data on electrical capacity by type
of generation are not available.

ELECTRICITY INFORMATION: DATABASE DOCUMENTATION (2019 final edition) - 65
INTERNATIONAL ENERGY AGENCY
Japan
Source The Institute of Energy Economics Japan, Tokyo.
General notes In the 2019 edition, data for Japan were revised
back to 1990 based on new methodology. From 1990, data are reported on a fiscal year basis
(e.g. April 2016 to March 2017 for 2016). Consumption data for commercial and public ser-
vices may include consumption in small and medi-um-sized industries. The Japanese administration expects that this shortcoming will be corrected in the near future.
Other bituminous coal includes sub-bituminous coal.
The net calorific values for coal and coal products have been recalculated by the IEA Secretariat based upon gross values submitted by Japan.
In the 2018 edition, imports of other bituminous coal and coking coal by partner country - have been estimated by the IEA Secretariat for data from 1990 to 2016, based on customs data and to-tal imports by coal type.
Hard coal data prior to 1978 may include sub-bituminous coal.
Supply In the 2019 edition, electricity data were revised
back to 1990 to include additional autoproducer production previously excluded.
Generation of electricity and heat from combus-tible fuels is calculated by removing electricity and heat generation from other sources, such as wind, solar and nuclear, making it a residual item. Splits between combustible fuel types and consumption flows are also calculated.
Due to the liberalisation of the electricity market in April 2016 some generation previously report-ed under autoproducer plants is reported as main activity producer from 2016 onwards. As a result, breaks in series occur between 2015 and 2016. In particular, for solar PV and wind.
In the 2019 edition, the methodology used to esti-mate heat production from other sources was re-vised.
For 2017, electricity production from wind has been estimated by the IEA Secretariat.
For 2016, large increases in main activity electricity generation from solar photovoltaic and wind in 2016 are due to the reclassification of autoproducers following the liberalisation of the Japanese power market in April 2016.
Due to the events related to the March 2011 tsu-nami, the Japanese administration decided to scale back the level of their nuclear programme. As a consequence, there was no nuclear electrici-ty generation in 2014. The nuclear electricity gen-eration started again at a greatly reduced scale in 2015, while significant increases were observed in 2017 and 2018, with generation resuming at several facilities (2017: Takahama 3 and 4, Ooi 3, and Genkai 3; 2018: Genkai 4, Ikata 3, Ooi 4).
Other sources electricity represents electricity generated with purchased steam. Other sources heat represents heat derived from waste heat.
Net and Gross electricity generation from auto-producers equal, as no information is collected concerning autoproducer own use.
Total heat output from heat plants is available, but the breakdown by fuel is not. From 1990 onwards, where possible, heat outputs have been allocated on the basis of the share of inputs. However, due to data issues, such as the lack of disaggregated data on inputs and outputs to heat pumps, this methodology can lead to implausible efficiencies. For this reason, from 2010 onwards, the efficien-cies of heat output from natural gas, fuel oil, and other kerosene-fired main activity heat plants, and electric boilers have been capped at 100%, and the excess output allocated to statistical differ-ences. Production of electricity from solar photo-voltaic and wind in autoproducer electricity plants is understated as it covers only plants with capaci-ty higher than 1000 kW.
Autoproducer solar photovoltaic capacity is de-rived from data from the Japanese administration as well as the IEA Photovoltaic Power Systems Programme (IEA-PVPS) report, “Trends in Photo-voltaic Applications” published in 2017.
Data on electricity production from wind began in 1992.
Heat produced for sale in main activity producer heat plants from waste heat and from electric boilers is available from 1977 and 1983, respectively.

66 - ELECTRICITY INFORMATION: DATABASE DOCUMENTATION (2019 final edition)
INTERNATIONAL ENERGY AGENCY
Transformation Data on heat produced for sale by autoproducer
heat plants are not available. From 1998, inputs of coke oven gas, blast fur-
nace gas and other recovered gases into auto-producer electricity plants include the amount used to produce electricity with TRT technology (Top pressure Recovery Turbines) which was pre-viously included in industry.
Inputs of manufactured gases (coke oven gas, blast furnace gas and other recovered gases) to main activity electricity and heat plants are cal-culated based on outputs and using efficiencies of main activity producers from other fuels. For auto-producers, the specific inputs are known, however the specific electricity production by each gas is estimated based on a pro-rata of the total elec-tricity generation from all gas types.
Fuels used and corresponding electricity and heat produced in CHP plants are not included in the CHP data time series, but instead are reported as separate electricity or heat components, leading to some plant efficiency figures not to be accurately calculated.
Inputs of biofuels and waste for electricity pro-duction and related outputs are available from 1982.
Net electricity production by autoproducers prior to 1982 includes production from combustible fuel sources only.
Between 1972 and 1976, the use of combustible fuels in main activity producer heat plants is in-cluded in non-specified.
Consumption Consumption of electricity in non-specified ind-
ustry includes wood and wood products and con-struction prior to 1982.
Capacity Electricity generation capacity for nuclear power
increased in 1997 due to the commissioning of two nuclear plants.
Prior to 1981, data on electrical capacity by type of generation are not available for main activity pro-ducer plants.
Prior to 1974, data on electrical capacity by type of fuel are not available for autoproducer plants.
Korea
Sources Korea Energy Economics Institute, Ulsan. Korea National Oil Corporation, Ulsan.
General notes Data are available starting in 1971. Data for 2002 onwards have been reported on a
different basis, causing breaks in time series be-tween 2001 and 2002, especially for inputs and outputs to electricity generation and consumption in the iron and steel industry. The Korean admin-istration is planning to revise the historical time se-ries as time and resources allow.
Data for coal and coal products from 1971 to 2001 are based on information provided by the Korean administration, as well as information from the Yearbook of Energy Statistics 2002, the Yearbook of Coal Statistics 2001 (both from the Ministry of Commerce, Industry and Energy), and Statistics of Electric Power in Korea 2001 (from the Korea Electric Power Corporation). During this period, import data by coal type were estimated by the IEA Secretariat, based on statistics of the ex-porting countries.
Hard coal data prior to 1978 may include sub-bituminous coal.
Due to the change of reporting methodology, breaks in time series for biofuels and waste may occur between 2013-2014 and 2014-2015.
Electricity statistics from 1971 to 1993 have been estimated by the IEA Secretariat based on the Korean National Statistics. Data from 1994 have been sub-mitted by the Korean administration. This leads to breaks in time series between 1993 and 1994.
Heat data are available starting in 1993.
Supply The own use of heat in heat plants is very irregular
due to a lack of data. Electricity generation reported under other
sources is from fuel cells. Production of tidal electricity began in 2013. Data for heat from chemical processes that is
sold is available from 2008.

ELECTRICITY INFORMATION: DATABASE DOCUMENTATION (2019 final edition) - 67
INTERNATIONAL ENERGY AGENCY
Data for electricity production using heat from chemical processes in copper and zinc plants are available from 2005. The corresponding heat in-puts were estimated until 2013 data. In 2014, the company concerned switched to diesel oil for electricity generation.
Transformation For 2018p, the decrease in electricity output from
nuclear was due to a combination of shutdowns for maintenance, and the closure of the Kori and Wolseong nuclear power plants in June 2017 and June 2018 respectively.
For 2018p, the increase in heat production from natural gas was in part due to the commencement and expansion of operations at two CHP plants (Hwaseong Dongtan and Anyang).
For 2017, the decrease in electricity production from residual fuel oil is due to the closure of two main activity producer plants.
Some data discrepancies currently exist for residual fuel oil, between the oil databases and the electricity and heat databases. The Korean administration en-visages remedying this situation in a coming cycle.
Inputs to autoproducer heat plants have been estim-ated by the IEA Secretariat because of efficiency is-sues for municipal waste prior to 2011 and in 2012 and for biogas in 2008, 2011 and 2012.
New plants were included in the Korean survey creating breaks in time series in 2011.
Prior to 2009, autoproducer heat production in-cludes amounts of unsold heat.
In 2007, some main activity heat plants and auto-producers in the commercial/public services sector were reclassified as main activity CHP plants, re-sulting in a break in the time series between 2006 and 2007 for biogases.
Data for electricity and heat production by auto-producers using natural gas and liquid fuels are available from 2000.
In 2000, the Korean administration started to re-port heat statistics for some heat plants which were not reported before.
Between 1993 and 1999, the breakdown of heat output by type of fuel was estimated by the IEA Secretariat.
Before 1994, electricity production from main activity producer CHP plants is included with main activity producer electricity-only plants.
Consumption Data for direct use of geothermal heat are avail-
able from 2002. Geothermal direct use data are overstated as it refers to heat production by geo-thermal heat pumps, which include inputs of elec-tricity and/or gas in the transformation process.
Heat consumption by subsector was reclassified in 2010 due to new information available on heat sales from autoproducers to end-users by sector.
Prior to 2008, sales of electricity by Korea’s main electricity distributor, KEPCO, to the non-ferrous metals sector are included in iron and steel consumption.
Data on production and consumption of electricity and heat in oil refineries and LNG liquefaction/regasification plants are included in the industry sector. From 2007, oil refinery electricity and heat production and consumption started to be re-ported under the correct energy sector.
Data for heat consumption by sector are available from 2000.
Data for electricity consumption in the transport equipment sector are included in machinery from 1994 to 1999.
Capacity The breakdown of generating capacity by fuel is
not available prior to 1994.
Latvia
Source Central Statistical Bureau, Riga.
General notes Data for Latvia are available starting in 1990. Prior
to that, they are included in Former Soviet Union in the World Energy Statistics publication.
Breaks in the time series appear for inputs to and outputs from electricity generation between 2016 and 2017 due to a change in methodology. This is most notable for main activity producer CHP and Heat plants. Data for 2017 onwards are reported on a unit basis, whereas data for previous years are reported on a plant basis.

68 - ELECTRICITY INFORMATION: DATABASE DOCUMENTATION (2019 final edition)
INTERNATIONAL ENERGY AGENCY
Supply For 2017, higher rainfall resulted in a significant
increase in electricity output from hydro and a decrease both imports of electricity and output from combustible fuels.
Heat production from other sources represents waste heat recovered from industry, and heat pro-duced by condensing economisers.
Transformation Due to a reclassification in 2004, there was break
in the time series of electricity production from au-toproducer electricity plant fuelled by biogas be-tween 2003 and 2004.
From 2012 onwards, the increase in electricity production from solid biofuels is due to the de-ployment of six new main activity producer CHP plants running on wood chips.
Consumption For 2012, the increase in electricity consumption
in the iron and steel sector is due to a facility switching from open-hearth to electric furnace.
Lithuania
Source Statistics Lithuania, Vilnius.
General notes Data for Lithuania are available starting in 1990.
Prior to that, they are included in Former Soviet Union in the World Energy Statistics publication.
Transformation In 2009, the Ignalina nuclear power plant, the on-
ly nuclear plant in Lithuania, closed down. Since the end of 2013, the Fortum Klaipėda CHP
plant has produced electricity and heat from in-dustrial waste, municipal waste and solid bio-fuels. The ratio of fuels used is subject to varia-tion based on cost and availability. In addition, in 2016, the method for calculating the calorific val-ues of the fuels used was changed. As a result, there are fluctuations in absolute and relative fuel inputs, and energy outputs from the aforemen-tioned fuels.
In March 2017, the Geoterma geothermal heat plant, the only geothermal heat plant in Lithuania, closed down.
In 2013, an incinerator combusting industrial waste (non-renewable) and municipal waste began operations
Luxembourg
Source STATEC, Institut national de la statistique et des études économiques du Grand-Duché du Luxembourg, Luxembourg.
General notes A revision in the classification of power plants by
type and the production and consumption data for both electricity and heat back to 2000 causes breaks in the time series.
Supply Data for solar thermal are available starting in
2001 and for solar PV starting in 2000. Most of the hydro production shown for Luxembourg
is from the Vianden pumped storage plant and is exported directly to Germany.
Starting in 2005, data for electricity transmission and distribution losses were obtained from the net-work operator. Prior to that, they were estimated by the Luxembourgian administration.
In the 2017 edition, following plant reclassific-ation, heat production by main activity plants were revised from 2011 onwards.
Transformation A natural gas-fired, main activity electricity plant
(TGV Twinerg) closed in 2016.The production of electricity from solid biofuels from 2013 corre-sponds to the opening of a new plant burning wood wastes.
Data on electricity production from biogases are available from 1998 and heat production from 2010.
In 2002, the increase in electricity production is due to a new natural gas combined cycle power plant.

ELECTRICITY INFORMATION: DATABASE DOCUMENTATION (2019 final edition) - 69
INTERNATIONAL ENERGY AGENCY
At the end of 1997, the iron and steel industry stopped production of electricity.
Electricity data for natural gas autoproducer CHP plants are available starting in 1995, and for main activity CHP plants starting in 1996.
Prior to 1990, net electricity production by auto-producers includes production from combustible fuel sources only.
Consumption Heat consumption in industry is estimated based
on National Accounts. When not available, heat consumption figures for the most recent year re-ported are estimated based on data for the preced-ing year.
In 2015, the observed declines in the heat used in the textiles and leather sector and the chemical and petrochemical sector are due to the closure of two industrial main CHP plants. The heating needs of these sectors were met through direct purchase of natural gas, due in part to attractive pricing dur-ing this period.
In 2015, following the procurement of new in-formation, data for heat distribution losses and heat consumption in industry and energy sectors were revised from 2000 onwards.
A change in the data source caused some breaks in the industry electricity consumption time series between 2010 and 2011.
The breakdown of electricity consumption in in-dustry is not available from 1990 to 1999.
Capacity Production of electricity in the iron and steel in-
dustry ceased at the end of 1997. Therefore, auto-producer electrical capacity for combustible fuels declined.
Prior to 1995, data on electrical capacity by type of generation are not available for autoproducers.
Mexico
Source Secretaría de Energía, Mexico City.
General notes Data are available starting in 1971.
The Mexican administration submitted data di-rectly by questionnaire for the first time with 1992 data. As a result, some breaks in time series may occur between 1991 and 1992. For prior years, da-ta are partly estimated based on the publication Balance Nacional - Energía.
In the 2016 edition, the Mexican administration completed a major work on revisions of the time series back to 1990. More revisions to historical data are pending.
The Mexican administration is currently under-taking revisions of the electricity time series back to 1996. Revisions include changes on inputs and outputs on power plants fuelled mainly by com-bustible fuels and the reclassification of main electricity plants previously reporting sub-bituminous coal as fuel to other bituminous coal for the period 2003-2015.
The time series for blast furnace gas and inputs of coke oven coke to blast furnaces start in 1991.
Hard coal data prior to 1978 may include sub-bituminous coal.
IEA estimations For 2016, imports of other bituminous coal and
coking coal by country of origin have been esti-mated by the IEA Secretariat based on partner data.
For coking coal, amounts reported for con-sumption in main activity electricity generation and associated imports for the years 2003 to 2016 have been reallocated to other bituminous coal by the IEA Secretariat.
Supply Electricity generation from other sources mainly
represents generation from recovered waste heat from industry, and also a small amount of elec-tricity production from regenerative breaking in suburban trains.
The decrease in electricity produced from wind in 2017 data is due to an earthquake which damaged infrastructure in the south of the country.
Production of main activity producer electricity plants from wind is available from 1994.
Electricity production from wind and solar photo-voltaic is available from 1990.

70 - ELECTRICITY INFORMATION: DATABASE DOCUMENTATION (2019 final edition)
INTERNATIONAL ENERGY AGENCY
Discrepancies occur between respective reported figures for electricity trade between the US and Mexico from 2013 onwards.
Transformation New autoproducer electricity plants fuelled with
coke oven gases were put on-line in 1999. Electricity production from solid biofuels and bi-
ogases data are available respectively from 1991 and 1997.
Data for solid biofuels used in autoproducer elec-tricity plants from 1991 to 2005 have been esti-mated by the Mexican administration.
Data for fuel oil and gas/diesel inputs to auto-producer CHP generation are available from 1999.
Consumption Some electricity consumption in energy industry
is included in the industry sub-sector where it was generated (e.g. the chemical industry, as well as in non-specified industry).
Direct use of solar thermal heat is available from 1990.
Capacity In 2012, nuclear capacity increased due to the re-
placement of the turbines in the only nuclear plant. The capacity factor for wind appears high for 2011
as the capacity of plants on test was not reported. The breakdown of generating capacity for main
activity producer electricity plants by combustible fuels is not available prior to 1982.
Net maximum electrical capacity for auto-producers is not available prior to 1974.
Netherlands
Source The Netherlands Central Bureau of Statistics, The Hague.
General notes The Netherlands Central Bureau of Statistics has
conducted reviews and revisions of their energy balance three times; in 2005, 2011 and 2015. The 2005 revisions were to improve basic energy sta-tistics, particularly with respect to carbon and CO2
reporting, while the 2011 revisions were part of a harmonisation program with international energy statistics. The 2015 revisions were the result of in-creased data collection, availability of new source information, and further alignment with interna-tional energy definitions. More details are availa-ble here: www.cbs.nl.
In the 2017 edition, following an extended review of old national publications, data for the Nether-lands were revised for the years 1990-1994 to fol-low on the revisions entered in the previous edi-tion, covering period 1995-2013. This revision en-deavours to maintain data comparability through-out the entire time series. As part of these revi-sions, most of the time series for the consumption sectors in both electricity and heat were revised using newly obtained data from grid operators’ client files by the Dutch administration.
Supply For 2018p, the declines in heat generation from
municipal waste, and heat used for electricity generation, and the increase in electricity output from municipal waste, are due to a change in ownership of a company which sold heat.
Data on heat production from chemical sources are available from 2017.
The decrease in electricity production from nucle-ar plants in 2017, 2013, and 1997 is due to the Netherlands’ only nuclear power plant undergo-ing a shutdown for maintenance.
Electricity from other sources represents gen-eration from expansion gases and chemical waste gases (the latter up to 2007).
The large increase in electricity trade in 1999 is due to the liberalisation of the Dutch electricity market. Until 2003, trade data are based on con-tracted quantities instead of physical flows.
The increase of heat produced in main heat plants in 1995 is due to a change in ownership of one large installation, resulting in its reclassification from an autoproducer to a main activity plant.
Electricity production from solar photovoltaic is available from 1990.
Transformation In mid-2017, two other bituminous coal-fired
power stations closed, as a result output from oth-er bituminous coal declined in 2018p.

ELECTRICITY INFORMATION: DATABASE DOCUMENTATION (2019 final edition) - 71
INTERNATIONAL ENERGY AGENCY
The efficiency of blast furnace gas-fired autopro-ducer CHP plants increases between 2015 and 2016 due to improved methods for allocating in-puts between sold and unsold heat.
At the end of 2015 three low-efficiency plants running on bituminous coal input closed down. These closures were part of the Agreement on En-ergy for Sustainable Growth in the Netherlands (https://www.energieakkoordser.nl/doen/engels.aspx) agreed upon by the Social and Economic Council of the Netherlands (SER) and more than forty rep-resentative organisations and stakeholders.
Heat used for electricity production represents waste heat bought from other industries that was generated from combustible fuels. The corre-sponding electricity output is included with that of natural gas.
Autoproducer heat plants using refinery gases are included with autoproducer CHP plants because data are considered confidential for 1990.
Heat production in commercial and public ser-vices includes production in agriculture.
All municipal waste autoproducer electricity and heat only plants have been reclassified by Statis-tics Netherlands as autoproducer CHP from 2012, causing breaks in the time series.
The 2009 increase in input of natural gas to main activity electricity consumption is due to the open-ing of a new plant in the second half of 2008.
Prior to 2008, a few small autoproducer electricity plants using solid biofuels were included with main activity plants for reasons of confidentiality.
In 2006, some municipal waste plants changed ownership and were reclassified from electrici-ty-only to CHP plants as they started heat projects.
A new main activity producer CHP plant fuelled by refinery gas started up in 1999 and there was a fuel reclassification in 2000.
For natural gas, all electricity production prior to 1998 is included in CHP plants.
For biofuels and waste, all electricity and heat produced prior to 1995 is included in CHP plants.
Data for heat produced from biofuels and waste are available from 1990.
Prior to 1990, all electricity and heat produced from coal is included in CHP plants.
Inputs of hard coal for electricity production from 1981 to 1989 in terajoules (TJ) are estimated by
the Secretariat based on data submitted in kilo-tonnes (kt) by the Dutch administration.
Net electricity production by autoproducers prior to 1988 includes production from combustible fuel sources only.
Data for heat production by fuel in heat plants prior to 1987 are estimated by the Secretariat based on fuel inputs submitted by the Dutch administration.
Data for heat production from main activity pro-ducer CHP plants and heat plants are available from 1982.
Prior to 1982, electricity production from and in-puts to main activity producer CHP plants are in-cluded with main activity producer electricity plants.
For 1970 to 1973, electricity output from auto-producer CHP plants has been included with main activity producer CHP plants.
Consumption In 2018, there were four new geothermal installa-
tions producing heat which warmed greenhouses. As in the past, these would be categorised in the agriculture and forestry sector.
For data from 2015 onwards, there is improved data availability for heat. This causes breaks in series for transmission and distribution losses, and heat consumption in the non-ferrous metals sec-tors,
Increasing electricity consumption in agriculture/forestry is due to expansion of greenhouse farming.
Direct use of geothermal heat in agriculture/forestry starting in 2008 is due to a new project ex-tracting deep geothermal heat. The heat produced has been used for heating greenhouses.
Prior to 1979, electricity consumption in agriculture is included in commercial and public services.
Capacity Prior to 1981 for main activity producer plants and
1982 for autoproducers, data on electrical capacity by type of generation are not available.

72 - ELECTRICITY INFORMATION: DATABASE DOCUMENTATION (2019 final edition)
INTERNATIONAL ENERGY AGENCY
New Zealand
Source Ministry of Business, Innovation and Employment, Wellington.
General notes For the 2019 edition, the New Zealand administra-
tion submitted extensive revisions back to 1990 following an internal review of systems and meth-odologies.
Prior to 1994, data refer to fiscal year (April 1993 to March 1994 for 1993). From 1994, data refer to calendar year.
There are several breaks in the time series between 1987 and 1988 due to a reorganisation of govern-ment departments during 1987.
Supply Heat outputs from main activity and autoproducer
CHP plants are not available.
Transformation For 2018p, a shortage of natural gas resulted in
decreased use of natural gas for electricity genera-tion, and increased use of sub-bituminous coal.
In late 2015, two natural gas-fired power stations used for baseload demand closed. As the remain-ing natural gas-fired plants are used more for peak demand, there is a reduction in generation efficiency between 2015 and 2016.
Electricity and heat production from other sources represents waste heat recovered and used for electricity production. This includes heat from recovered from chemical processes at acid plants in the fertiliser industry, where sulphur is the main input.
In 1999, a reclassification of autoproducer plants causes some breaks in the time series.
Data for geothermal electricity production by au-toproducers are available from 1990.
The New Zealand administration has updated effi-ciencies for electricity production from geo-thermal heat from 10% to 15% from 1990 on-
wards; this causes a break in the time series be-tween 1989 and 1990.
In the 2018 edition, electricity production in hydro plants was revised back to 2002 due to a change in methodology. This results in a break in time series between 2001 and 2002.
The large 1998 increase in natural gas input to autoproducer CHP plants is due to two new auto-producer CHP plants.
Electricity production by autoproducers from nat-ural gas and from oil has been estimated by the Secretariat from 1970 to 1973.
Consumption A new survey starting with the 2013 data can cause
breaks in data for final consumption of electricity. The consumption of electricity by the transport
sector is collected under the Australian and New Zealand Standard Industrial Classification (ANZSIC) 2006 system’s “Transport, Postal and Warehousing” category. As this covers commer-cial services as well as transport, MBIE estimates the amount of this that can be allocated to transport. At present this data does not allow for the disaggregation by transport sub-sector.
Beginning in 2013, the falling electricity con-sumption in the pulp, paper and printing sector fol-lows with the permanent closure of a paper ma-chine in one of New Zealand’s larger energy users, following decreased demand for newsprint.
Data on direct use of geothermal heat are avail-able from 1990 and direct use of solar thermal heat from 2002.
From 1974 to 1993 distribution losses include the statistical differences.
The classifications used by the administration of New Zealand were changed in 1991.
Electricity consumption in paper, pulp and print-ing is included in wood and wood products prior to 1990.
Capacity Generating capacity for autoproducers is available
from 1994. Prior to 1981, data on electrical capacity by type of
generation are not available.

ELECTRICITY INFORMATION: DATABASE DOCUMENTATION (2019 final edition) - 73
INTERNATIONAL ENERGY AGENCY
Norway
Source Statistics Norway, Oslo.
General Notes In the 2018 edition, data for Norway were revised
back to 2010, following the introduction of a new system for energy balances and energy accounts. Breaks in series may appear between 2009 and 2010 as a result. For more detailed information re-garding the methodological changes, please refer to the documentation of statistics production since statistics year 2010 on the Statistics Norway web-site. At the time of writing, the document was available in Norwegian as “Dokumentasjon av statistikkproduksjonen fra statistikkår 2010 og fremover”.
Supply No data on electricity production from solar ener-
gy are submitted to the IEA by the Norwegian ad-ministration.
The electricity generated from other sources rep-resents electricity from waste heat.
Until the 2018 edition, distribution losses included statistical differences. Statistical differences now exist for 2010 onwards.
Heat produced by autoproducer heat plants from chemical processes and from other sources and used for electricity production has been estimated by the IEA Secretariat for the period 1990 to 2006.
Electricity production from wind is available from 1993.
Data for heat production from heat pumps and electric boilers (including the electricity used for this production) are available from 1989.
Data for heat production are not available prior to 1983.
Transformation In the 2016 edition, Norway corrected the indus-
trial waste consumption in heat plants, and reclas-sified some the corresponding heat output under other sources.
Starting in 2007, data for natural gas electricity and CHP plants are aggregated in autoproducer
electricity plants for confidentiality reasons. The revisions received for the 2018 edition partially al-tered these data for the period 2010 to 2016, but no explanations were given.
Breaks in the time series between 1996 and 1997 and between 2001 and 2002 and now 2009 and 2010 are due to a reclassification of main activity producers and autoproducers. This includes the ap-parent cessation of autoproducer pumped hydro and hydro electricity generation since 2010, where this generation has been reclassified as main activity.
Data for heat production from biogases are avail-able from 1995.
Prior to 1991, net electricity production by auto-producers by industry sub-sector was estimated by the Secretariat based on data submitted by the Norwegian administration.
Data on inputs and outputs in heat plants are not available prior to 1983 for main activity heat plants and prior to 1988 for autoproducer heat plants.
Consumption For the 2019 edition, heat consumption in the
chemical (incl. petrochemical) and commercial and public services sectors was revised back to 2007. Historical revisions for other sectors are pending. As a result, breaks in series occur for heat consumption in some sectors between 2016 and 2017.
Consumption of electricity for pipeline transport is included in oil and gas extraction.
The breakdown of heat consumption by the indus-try sub-sector was expanded in 1992, reclassified in 1994 and collected by a new reporting system in 1997.
Trade Electricity trade with the Netherlands begins in
2008 with the operation of a cross-sea cable inter-connection between the two countries.
Capacity The increase in gas-fired generating capacity and the
associated production of electricity in 2007 is due to the opening of a new plant at Kårstø in late 2007.
Net maximum electrical capacity of pumped stor-age plants is not available from 1970 to 1972.

74 - ELECTRICITY INFORMATION: DATABASE DOCUMENTATION (2019 final edition)
INTERNATIONAL ENERGY AGENCY
Poland
Source Central Statistical Office, Warsaw.
General note Prior to 2010, heat supply and consumption can
include autoproducers unsold heat. Previous at-tempts to address such issue may have caused breaks for heat production and fuel in autopro-ducer heat plants (1993) and in autoproducer CHP plants, and for heat consumption in industry sub-sectors.
Supply Electricity and heat from chemical heat and other
sources are available from 2011. Prior to that, these amounts could be included under different categories.
Heat distribution losses are available from 2010 and prior to that they are included in consumption.
Heat production from heat pumps is available from 2009.
Transformation For 2018p, data on heat production from munici-
pal waste are provisional and may be revised up-wards next cycle.
In the past two editions, the Central Statistical Of-fice has revised their methodology which accounts for sold heat produced from autoproducer heat plants using coking coal and other bituminous coal, resulting in lower, but more accurate data for 2007 onwards.
Starting with 2017 edition and following, the Polish administration revised electricity produc-tion data from power plants run by combustible fuels, reclassifying those that were previously re-ported as main activity CHP as main activity elec-tricity plants. These revisions mainly affected coal-fired power plants and created breaks in time series from 2004 onwards.
State support for biomass co-firing was reduced in 2016, resulting in electricity production from solid biofuels falling during this period (2016p).
Due to a reclassification of plant types, there is a break in time series in 2015 for the generation of heat in autoproducer CHP plants in the iron and steel sector.
In 2008 and 2014, a number of CHP plants were reclassified from autoproducer to main activity producer due to an industry re-organisation.
In 2013 and 2014 some CHP plants were used as backup reserve plants, resulting in a decrease in consumption under main activity producers CHP plants.
In 2004 and 2005 small amounts of gas were used to start up main activity electricity plants.
Data for electricity production in autoproducer electricity plants are available from 1986.
Prior to 2013, electricity used for pumped storage (mixed plants) is included under used for pumped storage (pure hydro pumping plants).
Consumption Heat consumption in energy industry own use
includes process heat not sold before 1995. Data for direct use of geothermal heat are availa-
ble from 2000 and direct use of solar thermal heat in commercial/public services from 2002 and in residential from 2009.
In the 2017 edition, the Polish administration re-classified some amounts of electricity con-sumption from the chemical and petrochemical sector to oil refineries, following access to im-proved survey methods.
Portugal
Source Direcção-Geral de Energia e Geologia, Lisbon.
Supply Data for production of electricity from solar pho-
tovoltaic and wind are available from 1989. The large decrease in electricity output from
hydro for 2017 is due to decreased rainfall.
Transformation For 2016 data onwards, heat and electricity pro-
duction from chemical sources have been reclassi-fied as autoproducer CHP production from indus-trial waste, causing cessation of the heat and elec-tricity generated from heat from chemical process-es time series, and causing breaks in the industrial waste time series between 2015 and 2016.

ELECTRICITY INFORMATION: DATABASE DOCUMENTATION (2019 final edition) - 75
INTERNATIONAL ENERGY AGENCY
Electricity production from other oil products refers to methanol.
In the 2017 edition, the data for production of elec-tricity by autoproducer hydro plants were revised between 1990 and 1999, according to a new na-tional methodology.
In 2007, some power plants that were previously reported as main activity CHP have been reclassi-fied as autoproducer CHP.
In 2007, the power station that burns industrial waste started to work as a CHP plant, whereas pre-viously it was only producing electricity.
New plants fuelled by solid biofuels and by mu-nicipal waste started in 1999.
Prior to 1992, data for net electricity production by autoproducers include production from com-bustible fuel sources only.
Data for production of electricity in main activity producer CHP plants and the associated fuel inputs are not available prior to 1980.
Consumption In the 2017 edition, the Portuguese administration
reclassified some amounts of heat consumption from the residential to the commercial and public services sector for the period 1998 to 2014 follow-ing a new national methodology.
Data for direct use of solar thermal heat is avail-able from 1989 and direct use of geothermal heat from 1994.
Capacity Peak load for main activity producer plants in-
cludes the autoproducers data and is not available prior to 1986.
Slovak Republic
Source Statistical Office of the Slovak Republic, Bratislava.
General notes Data are available starting in 1971. The Slovak Republic became a separate state in
1993 and harmonised its statistics to EU standards in 2000. These two facts lead to several breaks in
time series between 1992 and 1993, and between 2000 and 2001.
In 2002 the gross calorific value (GCV) of natural gas production increased significantly as extrac-tion from a field with a low GCV ended.
Prior to 2001, the data reported as industrial waste include biogases and municipal waste.
Data for solar photovoltaic are available from 2010.
Supply For 2018p, heat supply declined due to the closure
of a large producer in January 2018.
Transformation For 2018p, the distribution of electricity and heat
production across combustible fuels is provisional and subject to revision.
In 2014, the decrease in natural gas autoproducer CHP plants consumption was due to a plant closure.
Between 2008 and 2009, one of the companies changed its status from autoproducer CHP plant to main activity producer CHP plant, resulting in a decrease in fuel oil consumption for autoproducer CHP.
Electricity and heat production from combustible fuels from 1990 to 2003 have been estimated based on the data on fuel used for electricity and heat plants reported in the annual fuel question-naires.
Prior to 2001, electricity generation from primary solid biofuels, municipal waste and biogases are included with industrial waste.
Consumption The low electricity consumption in oil refineries
in 2003 and 2004 is due to a change in ownership and work carried out on a refinery.
Data for direct use of geothermal heat are availa-ble from 2001 and direct use of solar thermal heat from 2005.
Trade The breakdown of trade by origin and destination
is available from 1993.

76 - ELECTRICITY INFORMATION: DATABASE DOCUMENTATION (2019 final edition)
INTERNATIONAL ENERGY AGENCY
Capacity The breakdown of installed capacity by type of
generation/fuel is available from 2001. Peak load data for main activity producer plants
have been estimated by the IEA Secretariat based on the SEPS annual reports and include data for autoproducer plants. Data are available back to 2000.
Data for main activity generating capacity are not available prior to 1995, and for autoproducers pri-or to 2001.
Slovenia
Source Statistical Office of the Republic of Slovenia, Ljubljana.
General notes A new energy data collection system was imp-
lemented in January 2001, causing some breaks in time series between 1999 and 2000.
Data for Slovenia are available starting in 1990. Prior to that, they are included in Former Yugoslavia.
Transformation In 2015, one of the main activity electricity plants
burning lignite ceased its operations.
Consumption Data on electricity consumption in Road are avail-
able from 2017. The increase in electricity consumption in Rail for
2017 is due to a new survey started by the Minis-try of Infrastructure in 2018.
Direct use of solar thermal and geothermal heat is available from 2009.
Surveys for data on heat consumption are availa-ble from 2003 onwards for the residential, industry and energy sectors. Prior to 2003, the data have been estimated by the Slovenian administration.
Spain
Source Ministerio de Energía, Turismo y Agenda Digital, Madrid.
General notes Spain is currently working on improving its data
collection system. Therefore, breaks in time series are present in the data and historical revisions are expected in the future editions.
The calorific values for sub-bituminous coal are correct on an as received basis, and comply with definitions of sub-bituminous coal on a moist, but ash-free basis.
Spain has implemented a new tool in data collec-tion, so there are currently breaks in the time series for 2014 and 2015 in transformation and industry respectively.
Supply Electricity reported under other sources is from
waste heat. Transmission and distribution losses are estimated
by the Spanish administration. Data for electricity from solar thermal plants are
available from 2007. Starting in 2006, a new method was used to estim-
ate the losses from final consumption, resulting in a break in time series between 2005 and 2006.
From 2005, residential rooftop solar photovoltaic electricity production data, previously reported un-der autoproducer, are included in main activity elec-tricity plants according to the Spanish administra-tion classification.
Electricity production from wind and solar are reported from 1989 when data became available.
Transformation In 2018 edition, a reclassification of plants from
autoproducer to main activity has led to breaks be-tween 2015 and 2016.
In the 2017 edition, a change in reporting meth-odology resulting in reclassification of plants from autoproducer electricity to autoproducer CHP has led to breaks in electricity production in autopro-

ELECTRICITY INFORMATION: DATABASE DOCUMENTATION (2019 final edition) - 77
INTERNATIONAL ENERGY AGENCY
ducer electricity plants between 2012 and 2013 and 2014 and 2015. The administration anticipates further revisions to the time series in subsequent cycles.
Due to the implementation of an updated tool for gathering information on electricity generation plants in 2013 many autoproducer electricity plants were reclassified as autoproducer CHP plants.
The National Energy Commission reclassified plants that consume biogases, leading to breaks in time series between 2007 and 2008.
In 2000 and 2006, many plants were reclassified from main activity producer to autoproducer or vice versa.
For 2004 and 2005, electricity production from gas/diesel oil is included with fuel oil.
The large increase in electricity output from main activity producer electricity plants fuelled by nat-ural gas in 1997 is due to the opening of a new plant.
Between 1993 and 1994 there is a break in time series in autoproducer CHP plants consumption, since a new survey revealed a large number of CHP autoproducers that were previously included in industry consumption.
Prior to 1989, inputs and outputs from the use of biofuels and waste to generate electricity and/or heat (i.e. comprising solid and liquid biofuels, in-dustrial waste, municipal waste and biogases) are reported under non-specified biofuels and waste.
Prior to 1987, electricity production in main activ-ity producer CHP plants is included with pro-duction from main activity producer electricity plants.
From 1983, net electricity production by auto-producers has been estimated by the Spanish ad-ministration, and includes production from com-bustible fuel sources only and net electricity pro-duction by autoproducer CHP plants is included in electricity plants.
Consumption For 2012, the electricity consumption data are
estimated by the Spanish administration. Data for direct use of geothermal and solar ther-
mal heat are available from 1990.
Electricity consumption under the non-specified industry category includes the consumption for the manufacture of rubber and plastic products, furni-ture, repair and installation of machinery and equipment (except repair and maintenance of ships and boats) and other manufacturing. This aligns with the Classification of the Economic Activities in the European Community (NACE) group code 22 and 31 to 33 (excluding class 33.15).
Capacity From 2004, capacity of autoproducers is included
with main activity producers. Prior to 1980, data on electrical capacity by type of
generation are not available and from 2003 no breakdown of capacity by type of fuel and gen-eration type is available.
Sweden
Sources Statistics Sweden, Örebro. Swedish Energy Agency (Energimyndigheten),
Eskilstuna.
Supply For 2018p, electricity and heat production data are
based on surveys which do not have the same coverage as the annual survey. Therefore data are provisional and subject to revision. In particular, due to this difference in coverage, the distribution of output across combustible fuels shows breaks in-series compared with data for previous years.
For 2017, electricity inputs to and outputs from pumped hydro storage plants are based on a re-vised methodology. As a result, breaks occur be-tween 2016 and 2017. Prior to 2017, electricity inputs to mixed hydro storage plants are reported under pure pumped plants. Historical revisions are pending.
Inputs to heat pumps include heat recovered from industry and from ambient sources (including sew-age and seawater).
Ambient heat is shown as the indigenous pro-duction of heat.

78 - ELECTRICITY INFORMATION: DATABASE DOCUMENTATION (2019 final edition)
INTERNATIONAL ENERGY AGENCY
Information on heat for sale produced in heat pumps and electric boilers is available starting in 1992.
Transformation Autoproducer inputs to waste-heat production that
are sold are reported in the respective end-use sec-tors and not in the transformation sector.
In Sweden, heat produced in heat pumps is sold to third parties (as district heat) and is therefore in-cluded in transformation.
The electricity used to drive heat pumps is con-sidered to be transformed and appears as output in transformation rather than as electricity used in energy industry own use.
Heat production from solid biofuels in auto-producer CHP includes waste heat and chemical heat.
For 2012 and 2013, small quantities of bio-methanol used to produce electricity are included in other liquid biofuels, under production, as well as input and output of autoproducer CHP.
For 1997 and 1998, heat production from liquid fuels in main activity producer CHP plants in-cludes heat recovered from flue-gas condensing.
Prior to 1992, data on electricity production from biogases is included with solid biofuels.
Heat produced for sale by autoproducer CHP plants is reported starting in 1992.
From 1987, the breakdown of net electricity pro-duction by industry for autoproducer electricity plants is available.
Prior to 1987, net electricity production by auto-producer plants includes data for CHP plants only.
Prior to 1980, heat produced in main activity pro-ducer heat plants is not available.
Prior to 1974, heat produced in main activity pro-ducer CHP plants is not available.
Consumption Consumption of electricity for distribution of dis-
trict heat is included with other energy industry own use.
Fuel inputs to the heat that is recovered by the heat pump are reported in the appropriate industry sub-sector (i.e. chemical, and paper, pulp and printing).
In 2014, consumption of electricity in the mining and quarrying and the pulp, paper and printing sec-tors are confidential and were incorporated under the non-specified industry sector.
Data on direct use of solar thermal are available from 1989.
Consumption of heat in industry and other sectors is available from 1984.
Capacity In the 2017 edition, following improved access to
generating companies’ information on hydro-electric plants, Sweden’s pure pump hydroelectric capacities were reclassified to mixed plant hydro-electricity from 1990 onwards.
The breakdown of generating capacity of main activity producer and autoproducer electricity plants by fuel is not available from 1990 to 2003 and from 2006 to 2013 and is confidential from 2014 onwards.
Peak load data for main activity producer plants includes data for autoproducer plants from 1992.
Generating capacity of main activity producer electricity plants includes autoproducer plants pri-or to 1984.
Prior to 1981, data on electrical capacity by type of generation are not available for main activity pro-ducer plants.
Switzerland
Sources Swiss Federal Office of Energy (SFOE), Ittigen. Carbura – Swiss Organisation for the Compulsory
Stockpiling of Oil Products, Zurich.
General note From 1999, data on consumption result from a
new survey and are not comparable with data for previous years.
Supply Heat production includes heat produced by
nuclear power stations and distributed to other consumers.

ELECTRICITY INFORMATION: DATABASE DOCUMENTATION (2019 final edition) - 79
INTERNATIONAL ENERGY AGENCY
Data for electricity production from wind are available from 1996.
Data for solar electricity production by auto-producers are available from 1990.
Transformation For 2018p, gross heat production from heat pumps
declined due to the closure of the larger of two such facilities in Switzerland.
For 2016 and 2017, electricity output from nucle-ar sources declined due to shut downs at two of Switzerland’s five nuclear power plants (Bez-nau 1 and Leibstadt). For 2018p, output increased due to higher availability at these two plants.
Electricity used for pumped storage (pure hydro pumping plants) is included under used for pumped storage (mixed plants).
Gas/diesel oil non-specified transformation (in the oil databases) represents inputs to mobile and sta-tionary power generators, of which the electricity output is unknown at this stage.
In 2016, two new pumped hydroelectric plants went into operation.
For 2015, the large decline in electricity and heat production from industrial waste is due to one large main activity CHP plant significantly reduces their activity. This plant eventually closed in 2016, further lowering electricity and heat generation for this fuel.
Since 2013 there are fluctuations in natural gas inputs to main activity producers CHP plants due to the fuel flexibility of a plant.
From 2012, the municipal waste autoproducer plant previously reported as electricity plant met the CHP requirements and was reclassified as such.
Biogas is no longer being used for heat production as of 2011.
The decrease in the use of natural gas in main activity CHP plants in 2007 is caused by the re-duced operation of one plant after the start-up of a new waste-incineration plant and the closure of another plant. Use increases again in 2008 due to the re-starting of a district heating plant.
The autoproducer heat plant that produced heat for sale using municipal waste was closed in 2006.
In 1996, the increase of gas input to main activity CHP plants is due to more complete accounting for all producing entities.
The breakdown of electricity and heat generation from autoproducers by sector is not available after 1990.
Prior to 1978, data for heat output from CHP plants are not available.
The allocation of electricity production in main activity producer electricity-only and CHP plants between 1967 and 1973, and in main activity pro-ducer CHP and autoproducer CHP plants in 1974 are Secretariat estimates.
All hydro electricity production is reported under large scale hydro (> 10 MW) due to the fact that production data are not being collected by differ-ent size capacity categories.
Consumption Electricity consumption in the transport equip-
ment industry is included with machinery. Geothermal direct use is overstated as it refers to
heat production by geothermal heat pumps, which include inputs from electricity and/or gas in the transformation process.
The breakdown of final consumption of electricity in the industry sector from 2000 to 2001 was esti-mated by the Secretariat.
Data for direct use of geothermal heat and solar thermal heat are available from 1990.
Trade Electricity trade to and from non-specified/others
represents trade with Liechtenstein.
Capacity For 1990 to 2005, the split of hydro and pumped
hydro capacity between main activity producers and autoproducers is estimated based on the split of capacity at peak load.
Electricity generating capacity for liquid fuels in main activity producer plants includes all com-bustible fuels prior to 1990.
Turkey
Sources Ministry of Energy and Natural Resources (Enerji
ve Tabii Kaynaklar Bakanlığı), Ankara. Petrol İşleri Genel Müdürlüğü, Ankara.

80 - ELECTRICITY INFORMATION: DATABASE DOCUMENTATION (2019 final edition)
INTERNATIONAL ENERGY AGENCY
General notes In the 2018 edition, revisions were conducted by the
Turkish administration back to 1990 impacting the transformation and industrial sector. The revisions in the transformation sector were the result of new data submitted by the Turkish Electricity Transmission Company (TECT).
In the middle of 2014, most autoproducer elec-tricity, heat and CHP plants in Turkey were re-classified as main activity producer due to a change in the legislation. Although the licences of these plants changed, the Administration decided to re-store the affected plants’ classification back to auto-producer in 2017 to harmonise with plant defini-tions in the IEA questionnaire.
Calorific values for fuels used for electricity, CHP and heat plants are obtained from data submitted to the Ministry of Energy and Natural Resources (MENR) by the Turkish Electricity Transmission Company, and these values may differ signific-antly from production and import values provided by MENR, causing imbalances for some years.
Supply Other sources heat production represent pur-
chased steam (waste heat) from the industry, main-ly from cement and glass manufacturing, while other sources electricity is the proportion of gen-eration by plant obtained from this heat.
Electricity production from wind is available start-ing in 1998.
Transformation In 2017, the increase in electricity production from
solar PV main activity producers is related to new plants coming online, mostly unlicensed.
In the 2018 edition, Turkish administration revised 2014 and 2015 data, as some natural gas fired main activity producing plants in Turkey were re-classified as autoproducers.
In the 2006 edition, the Turkish Statistical Office started providing electricity and heat output on the basis of a new survey that revised time series back to 2000. This causes breaks in the time series between 1999 and 2000. Not all of the input time series have been revised.
A new gas-fired main activity producer CHP plant was put into operation in 1999 and a new auto-producer electricity plant fuelled with coking coal started in 2000.
Data for blast furnace gas for electricity and heat generation are available from 1995.
Data on electricity generated from biofuels are available from 1991.
Consumption Consumption data in the machinery sector includes
transport equipment. Comprehensive data on electricity consumption
are available from 1973. This causes a break in the time series between 1972 and 1973.
Trade Exports of electricity to Iraq are included under
non-specified/others. Trade of electricity with Albania and Romania are
contractual rather than physical quantities.
Capacity Generating capacity reported in other type of gen-
eration corresponds to gas engines. Net electricity generating capacity by type of gen-
eration for both main activity producers and auto-producers is not available prior to 1999.
United Kingdom
Source Department for Business, Energy and Industrial Strat-egy (BEIS), London.
General notes For the United Kingdom, it is necessary to com-
bine figures for main activity producers and auto-producers in order to prevent the disclosure of in-formation relating to less than three electricity generating companies, since this information is considered confidential. For this reason, data for main activity producer CHP plants have been in-cluded with autoproducer CHP plants from 1988. Prior to 1988, electricity output from CHP plants was included with autoproducer electricity plants.
The re-organisation and subsequent privatisation of the electricity supply industry in 1990 has re-sulted in some breaks in time series.

ELECTRICITY INFORMATION: DATABASE DOCUMENTATION (2019 final edition) - 81
INTERNATIONAL ENERGY AGENCY
Supply Data for off-grid solar PV are currently not avail-
able in the United Kingdom but the addition of these data is expected in the future.
Large declines in electricity generation from coal-fired power since 2013 are due to concrete plans to phase out coal use for electricity genera-tion entirely by 2025. Alternative generation has been supplied by increases from other sources, in-cluding biomass, natural gas, nuclear, solar and wind generation, and increases in imports through undersea HVDC interconnectors.
Electricity production data for solar PV are avail-able from 1999.
The launch of a feed-in-tariff scheme in April 2010 resulted in a rapid increase of capacity and corresponding electricity production growth from solar PV in the following years.
In 1996, the break in electricity production from nuclear is due to a reclassification of plants from autoproducer to main activity producer plants.
Data on electricity production from wind is avail-able from 1989.
Transformation For 2018p, the decrease in electricity output from
nuclear was due to plant outages for mainte-nance.
Electricity used for pumped storage (mixed plants) is included under used for pumped storage (pure hydro pumping plants) for confidentiality reasons.
The consumption of solid biofuels increased in 2015, as the largest power station in the UK con-verted a further unit from coal to biomass mid-year, and the previously converted unit had a full year of operation in 2015 rather than just the last few months of 2014.
Underground production of other bituminous coal in 2016 decreased due to the closure of Hat-field, Thoresby and Kellingley mines.
From 2015, the UK administration started collect-ing data from the main-activity solar PV comp-anies. Prior to this, all data were included under autoproducers.
The market decline in use of other bituminous coal from 2013 onwards for autoproducer elec-tricity generation was due to a plant being sold to a dedicated main-activity electricity producer.
Prior to 2013, due to data confidentiality reasons, one or two main-activity municipal waste plants had to be included within the autoproducer plant category. Since 2013, as there have been at least three main-activity companies, these plants have been reclassified from autoproducer plant to main activity electricity plant, with some CHP plants in-cluded under main electricity due to confidentiality reasons.
In 2007, outputs of electricity from petroleum coke are included in fuel oil.
Prior to 2003, all outputs of electricity and heat from oil products are reported in the other oil products category.
Heat production from autoproducers is available starting in 1999.
Inputs and output from natural gas for main activ-ity producer electricity production are included in autoproducer electricity for 1990 (for reasons of confidentiality).
Consumption For the 2019 edition, a change in methodology
was applied for heat consumption figures from 2015 onwards. Due to new information regarding the purchasing and reselling of heat, consumption previously included under the Commercial and Public services sector was reallocated to the Resi-dential sector.
Consumption in gas works includes electricity use in the transmission/distribution of public supply gas.
Consumption in the non-metallic mineral products sector includes mining and quarrying.
Electricity consumption in coal mines includes consumption in patent fuel plants.
Data for electricity consumption in transport was classified by sub-sector only starting from 2004 resulting in a break in time series between 2003 and 2004. Prior to 2004, non-specified transport includes consumption for traction by urban rails and road vehicles, and consumption for non-traction by railways and bus stations and airports. From 2004 onwards, road vehicles consumption is included under road transport. Prior to 2004, electricity consumption in rail refers to industrial rail only. From 2004 onwards it includes both in-dustrial and urban rail.

82 - ELECTRICITY INFORMATION: DATABASE DOCUMENTATION (2019 final edition)
INTERNATIONAL ENERGY AGENCY
Consumption in the machinery sub-sector includes that of the transport equipment industry before 1996.
Starting in 1990, small amounts of electricity used in heat pumps have been included in residential.
From 1984 onwards, the electricity consumption in the non-specified industry sector includes that of the wood and wood products sub-sector and unallocat-ed consumption. The unallocated consumption comes from data reported as ‘Other industries’ by companies and includes Standard Industrial Classi-fication (SIC) codes 7, 22, 31, 32, 33.19, 36, 38.3.
Electricity consumption in the energy non-specified sub-sector is primarily made up of ‘gas and electricity supply’ and includes Standard Industrial Classification (SIC) codes 24.46 and 35.
Capacity Prior to 1981 for main activity producer plants and
prior to 1983 for autoproducers, data on electrical capacity by type of generation are not available.
United States
Source US Energy Information Administration, Washington D.C.
General notes Starting with 2017 data, inputs to and outputs from
electricity and heat generation include Puerto Ri-co.
End-use energy consumption data for the Unit-ed States present a break in time series with histor-ical data due to a change in methodology in 2014. The break in time series occurs between 2011 and 2012 for oil; and between 2001 and 2002 for elec-tricity and natural gas. The new methodology is based on the last historical year of the most recent Annual Energy Outlook (AEO) publication. Changes occur primarily in reported end-use ener-gy consumption in the industrial sector and its sub-sectors, including the non-manufacturing indus-tries of mining, construction and agriculture. His-torical revisions are pending. Due to other changes in reporting methodologies, there are numerous breaks in time series for the US data, particularly in 1992, 1999, 2001, 2002 and 2013. Care should be taken when evaluating consumption by sector
since inputs of fuel to autoproducers are included in final consumption for some years. No data are available for most energy products in the construc-tion and mining and quarrying industries.
Geothermal supply and inputs to transformation data are estimated by the IEA Secretariat starting in 2009 because of efficiency discrepancies.
Between 2001 and 2002, there are breaks in time series concerning the total production of electrici-ty and heat in the United States. Comprehensive data on electricity and heat production and con-sumption in main activity producer electricity, CHP and heat plants and autoproducer electricity and CHP plants are not available for all years.
The EIA collects generation and consumption data from all plants 1 MW or more in capacity.
Supply There is a break in series for geothermal and so-
lar thermal direct use data between 2017 and 2018p as a new methodology for reporting these data was adopted with 2018p data. Historical revi-sions are expected in the next data cycle.
The IEA Secretariat estimated US solar PV elec-tricity generation from autoproducers starting in 1999 by multiplying the dispersed and distributed PV capacity estimated by the US administration by an average capacity factor of 12%. The capacity factor was based on a report published in 2007 by the IEA Photovoltaic Power Systems Programme, Cost and Performance Trends in Grid-Connected Photovoltaic Systems and Case Studies. The corre-sponding consumption of electricity has been in-cluded under non-specified other.
Data for electricity absorbed by pumping and elec-tricity production from pumped storage plants be-came available starting in 1987.
Discrepancies occur between respective reported figures for electricity trade between the US and Mexico from 2013 onwards, and between the US and Canada from 2016 onwards. This is in part due to a change in data source for US electricity trade figures, which creates a break in series be-tween 2015 and 2016.
Transformation Electricity inputs to both mixed hydro and pure
pumped storage pumping plants are reported un-der inputs to pure pumped storage.

ELECTRICITY INFORMATION: DATABASE DOCUMENTATION (2019 final edition) - 83
INTERNATIONAL ENERGY AGENCY
Beginning with 2016 data, the calculation for heat production in CHP plants has changed, resulting in breaks in time series. The United States admin-istration is currently unable to apply this method-ology to historic years, so will only cover heat data for 2016 onwards. As a result of this methodology change, several combustible fuel power plants have their overall efficiency values increased, re-cording increased heat production. The previous methodology existed for the years 2006 to 2015, so further breaks exist between 2005 and 2006.
In 2016, electricity and heat generation from some types of coal, for some plant types were es-timated by the IEA Secretariat, based on an initial submission from the US Administration and sub-sequent reclassification of portions of this coal be-tween coal types.
Accurate accounting of coke oven gas and refin-ery gas inputs is not always possible, which can lead to efficiencies of over 100% in main activity producer CHP plants.
Other sources electricity production represents purchased steam and waste heat from industries.
The low efficiencies from 2011 for other bit-uminous coal autoproducer electricity plants are due to the fact that one unit; the Albany Brewery Power Plant only produces unsold heat, and is re-ported in the wrong category of plant.
From 2007 to 2009, heat from industrial waste includes recovered heat from industrial processes. From 2010, the electricity produced from re-covered heat is reported under other sources.
The decline in patent fuel used for electricity pro-duction in 2008 and subsequent cessation in 2009 is a result of the termination of the “synthetic fuel from coal” tax credit in 2008, which had been in the order of USD 20 to USD 25 per tonne, and while intended to deal with coal liquefaction and similar technologies, it had spawned an industry of cosmetic upgrading as a tax minimisation vehicle.
From 2004 to 2013, the EIA reported electricity and heat production from anthracite under other bituminous coal. The Secretariat estimated the split of generation output by fuel type based on the assumption that the plant efficiencies of the aggre-gate are equal to that of each part.
Starting in 2002, autoproducer electricity output for oil includes generation from refinery gases with a low average calorific value. Prior to 2002, this output was not accounted for.
Prior to 2001, some data on plants consuming sub-bituminous coal and lignite have been estimated by the Secretariat using information provided in the EIA’s Annual Electricity Generator Report – Utility.
Data for peat are confidential between 1994 and 1998 and from 2000 are not reported.
Prior to 2000, autoproducers include small and in-dependent power producers which under IEA defi-nitions are considered as main activity producers. Production from these small and independent power producers accounts for about 25% of re-ported production of electricity by autoproducers in the United States. This reclassification causes breaks between 1999 and 2000.
In the 2003 edition, the United States administra-tion reclassified some plants to autoproducers. This reclassification causes more breaks between 1998 and 1999.
Data for heat produced in main activity producer heat plants are available from 1992 to 1999, and for autoproducer CHP plants for 1989 to 1999.
From 1999 onwards, the fuel used in heat pro-duction by autoproducers is included in final con-sumption because the US administration cannot distinguish between the heat used directly on-site and the heat sold. Therefore, this may under-estimate the heat sold to third parties.
Prior to 1999, solar thermal electricity production includes generation from natural gas because some natural gas units are attached to solar thermal plants and their production could not be separated.
Prior to 1991, some of the fuel inputs to electricity and heat production reported for autoproducer plants are reported as final consumption in the par-ticular economic sector in which the autoproducer is operating.
Since 1989 for natural gas, consumption by auto-producer CHP plants is available, while consump-tion by autoproducer electricity and main activity producer CHP plants is available since 1991. Prior to these years, these consumptions are included with industry and commerce/public services.
Prior to 1989, there are no generation data availa-ble from autoproducers.
Sub-bituminous coal inputs for electricity and heat production are included in hard coal before 1983.

84 - ELECTRICITY INFORMATION: DATABASE DOCUMENTATION (2019 final edition)
INTERNATIONAL ENERGY AGENCY
Consumption Consumption breakdown data for electricity are
modelled based on data obtained from the Annual Energy Outlook and conversion factors. These da-ta are based on fiscal values rather than physical tonnage, so if commodity prices increase or de-crease between AEO versions and the conversion factors are not updated, derived changes in con-sumption may appear that are not supported by physical changes in production, or actual changes in consumption. For example in 2016, production of steel in electric arc furnaces increased by 6%, however consumption of electricity in the iron and steel industry was reported as declining by 17%.
For the 2019 edition, the breakdown of final elec-tricity consumption for 2017 was based on the results of the Annual Energy Outlook (AEO) of 2018. The model used in the 2018 edition of the Outlook was updated to incorporate the results of the 2014 Manufacturing Energy Consumption Survey (MECS). The MECS values were last up-dated in 2010, and in the intervening period, sev-eral industries had changed significantly. For in-dustry sub-sectors where disaggregated AEO2018 values are unavailable e.g. non-ferrous metals, textiles, and non-metallic minerals, consumption was extrapolated from the MECS 2014 values at the same rate as shipments in that industry. Breaks in time series occur across several sectors between 2016 and 2017.
Similarly, for the 2017 edition, the breakdown of final electricity consumption for 2015 was based on the results of the Annual Energy Outlook (AEO) of 2016. Breaks in time series appear in the mining and agricultural electricity consumption sectors as a result of introduction of individual in-dustry benchmarking for 2015 results. Changes in iron and steel, and pulp and paper data from 2014 to 2015 are the result of fundamental revisions of
the iron and steel and pulp and paper models be-tween AEO2014 and AEO2016 as well as the use of individual industry benchmarking for AEO2016. These changes are a few notable exam-ples of series changes, and any series can change between AEO releases because of data updates and methodology changes.
Prior to 1991, total consumption of heat sold referred to consumption in commercial/public services.
No data are available for heat sold that is con-sumed in the residential and agriculture/forestry sectors for any years.
Data for direct use of solar thermal heat in resi-dential are available from 1999.
Since 1995, heat consumption data by sector are no longer collected, and have been estimated by the Secretariat, resulting in breaks in time series between 1994 and 1995, and 1999 and 2000.
Data for consumption of heat sold in industry are available from 1991 and in energy industry own use from 1992.
Capacity Capacity is net summer capacity. In the 2015 edition, revised data for hydro-
electricity, pumped hydro and mixed plants ca-pacity have been submitted back to 1995 data. This can cause breaks in the time series between 1994 and 1995.
Data on electrical capacity for autoproducers are available from 1989.
The breakdown of capacity by fuel type for 1989 is a Secretariat estimate.
Capacity by type of generation is not reported pri-or to 1981.

ELECTRICITY INFORMATION: DATABASE DOCUMENTATION (2019 final edition) - 85
INTERNATIONAL ENERGY AGENCY
7. UNITS AND CONVERSIONS
Conversions (to toe)
All units in this publication are metric units. Most IEA/OECD publications showing inter-fuel relations and projections present such information in a common energy unit, the tonne of oil equivalent (toe). A tonne of oil equivalent is defined as 107 kcal (41.868 GJ), a convenient measure because it is approximately the net heat content of one tonne of average crude oil. This unit is used by the IEA/OECD in its energy bal-ances. Note also that totals may not be the sum of their components due to independent rounding.
The change from using the original unit to tonne of oil equivalent implies choosing coefficients of equiva-lence between different forms and sources of energy. This problem can be approached in many different ways. For example one could adopt a single equiva-lence for each major primary energy source in all countries, e.g. 29 307 kJ/kg (7 000 kcal/kg) for hard coal, 41 868 kJ/kg (10 000 kcal/kg) for oil.
The main objection to this method is that it results in distortions since there is a wide spread in calorific values between types of coal and individual coal products, and between calorific values of these fuels in different countries.
The Secretariat has therefore adopted specific calorif-ic factors supplied by the national administrations for the main categories of each quality of coal and for each flow or use (i.e. production, imports, exports, electricity generation, coke ovens, blast furnaces and industry). For crude oil, specific factors have been used based on consultations with experts from the national administrations, while for petroleum products regional conversion factors have been used.
The balances are expressed in terms of “net” calorific value. The difference between the “net” and the “gross” calorific value for each fuel is the latent heat of vaporisation of the water produced during combus-tion of the fuel. For coal and oil, net calorific value is usually around 5% less than gross, for most forms of natural and manufactured gas the difference is 9-10%, while for electricity there is no difference as the con-cept has no meaning in this case. The use of the net calorific value is consistent with the practice of the Statistical Offices of the European Communities and the United Nations.
Electricity data are converted from original units of gigawatt hours to million tonnes of oil equivalent us-ing the relationship:
1 TWh = 0.086 Mtoe.
Complete listings of net calorific values to convert energy sources from basic units to tonne of oil equiva-lent are reported in section IV and can be found at the end of this Chapter.
Electricity All electricity data are reported to the IEA in GWh (for generation) or MW (for capacity).
Figures for electricity production, trade, and final con-sumption are calculated using the energy content of the electricity (i.e. at a rate of 1 TWh = 86 ktoe).
Hydro-electricity production (excluding pumped stor-age) and electricity produced by other non-thermal means (wind, tidal/wave/ocean, solar PV, etc.) are accounted for similarly using 1 TWh = 86 ktoe.
The primary energy equivalent of nuclear electricity is calculated from the gross generation by assuming a 33% conversion efficiency, i.e. 1 TWh = (86 ÷ 0.33) ktoe.

86 - ELECTRICITY INFORMATION: DATABASE DOCUMENTATION (2019 final edition)
INTERNATIONAL ENERGY AGENCY
For geothermal and solar thermal, if no country-specific information is reported, the primary energy equivalent is calculated as follows:
10% for geothermal electricity 1 TWh = (86 ÷ 0.1) ktoe
33% for solar thermal electricity 1 TWh = (86 ÷ 0.33) ktoe
Heat Information on heat is supplied in terajoules and 1 terajoule = 0.02388 ktoe.
For geothermal and solar, if no country-specific in-formation is reported, the primary energy equivalent is calculated as follows:
50% for geothermal heat 1 TJ = (0.02388 ÷ 0.5) ktoe.
100% for solar
For direct use of geothermal and solar heat, all the heat consumed is accounted for production and con-sumption.
Natural gas In this publication, natural gas excludes natural gas liquids. For the net heat content of a natural gas, its gross heat content is multiplied by 0.9.
Oil The IEA applies regional conversion factors (in con-junction with Eurostat for the European countries) for the petroleum products: Regional net calorific values for petroleum products
Petroleum products Europe Americas Asia Oceania
kJ/kg kJ/kg kJ/kg Refinery gas 49 500 48 100 48 100 Ethane 49 500 49 400 49 400 Liquefied petroleum gases 46 000 47 300 47 700
Motor gasoline 44 000 44 800 44 600 Aviation gasoline 44 000 44 800 44 600 Gasoline type jet fuel 43 000 44 800 44 600 Kerosene type jet fuel 43 000 44 600 44 500 Kerosene 43 000 43 800 42 900 Gas/diesel oil 42 600 Residual fuel oil 40 000 40 200 42 600 Naphtha 44 000 45 000 43 200 White spirit 43 600 43 000 43 000 Lubricants 42 000 42 000 42 900 Bitumen 39 000 40 000 38 800 Paraffin waxes 40 000 Petroleum coke 32 000 32 000 33 800 Non-specified petroleum products 40 000

ELECTRICITY INFORMATION: DATABASE DOCUMENTATION (2019 final edition) - 87
INTERNATIONAL ENERGY AGENCY
General conversion factors for energy
To: TJ Gcal Mtoe MBtu GWh From: multiply by:
Terajoule (TJ) 1 2.388x10² 2.388x10⁻⁵ 9.478x10² 2.778x10⁻¹ Gigacalorie (Gcal) 4.187x10⁻³ 1 1.000x10⁻⁷ 3.968 1.163x10⁻³ Million tonnes of oil equivalent (Mtoe) 4.187x10⁴ 1.000x10⁷ 1 3.968x10⁷ 1.163x10⁴
Million British thermal units (MBtu) 1.055x10⁻³ 2.520x10⁻¹ 2.520x10⁻⁸ 1 2.931x10⁻⁴
Gigawatt hour (GWh) 3.600 8.598x10² 8.598x10⁻⁵ 3.412x10³ 1
Conversion factors for mass To: kg t lt st lb
From: multiply by: Kilogramme (kg) 1 1.000x10⁻³ 9.842x10⁻⁴ 1.102x10⁻³ 2.205 Tonne (t) 1.000x10³ 1 9.842x10⁻¹ 1.102 2.205x10³ Long ton (lt) 1.016x10³ 1.016 1 1.120 2.240x10³ Short ton (st) 9.072x10² 9.072x10⁻¹ 8.929x10⁻¹ 1 2.000x10³ Pound (lb) 4.536x10⁻¹ 4.536x10⁻⁴ 4.464x10⁻⁴ 5.000x10⁻⁴ 1
Conversion factors for volume To: gal US gal UK bbl ft3 l m3
From: multiply by:
US gallon (gal US) 1 8.327x10⁻¹ 2.381x10⁻² 1.337x10⁻¹ 3.785 3.785x10⁻³
UK gallon (gal UK) 1.201 1 2.859x10⁻² 1.605x10⁻¹ 4.546 4.546x10⁻³ Barrel (bbl) 4.200x101 3.497x101 1 5.615 1.590x10² 1.590x10⁻¹ Cubic foot (ft3) 7.481 6.229 1.781x10⁻¹ 1 2.832x101 2.832x10⁻² Litre (l) 2.642x10⁻¹ 2.200x10⁻¹ 6.290x10⁻³ 3.531x10⁻² 1 1.000x10⁻³ Cubic metre (m3) 2.642x10² 2.200x10² 6.290 3.531x101 1.000x10³ 1
Decimal prefixes 01 deca (da) 10-1 deci (d)
102 hecto (h) 10-2 centi (c)
103 kilo (k) 10-3 milli (m)
106 mega (M) 10-6 micro (µ)
109 giga (G) 10-9 nano (n)
1012 tera (T) 10-12 pico (p)
1015 peta (P) 10-15 femto (f)
1018 exa (E) 10-18 atto (a)

88 - ELECTRICITY INFORMATION: DATABASE DOCUMENTATION (2019 final edition)
INTERNATIONAL ENERGY AGENCY
8. ABBREVIATIONS GJ : gigajoule (109 joules)
GW : gigawatt
GWh : gigawatt hour = 3.6 Terajoules
kW : kilowatt
kWh : kilowatt hour
MWe : megawatt (electric)
MWh : megawatt hour
MWth : megawatt (thermal)
m2 : metre squared
t : metric ton = tonne
TJ : terajoule (1012 joules)
1 toe : tonne of oil equivalent = 41.868 GJ = 107 kcal
TWh : terawatt hour
GDP : gross domestic product
RES : renewable energy sources
TPES : total primary energy supply
0 or 0.0 : negligible
c : confidential data
e : estimated data
.. : not available
x : not applicable


