48
Electricity market performance 2010–2011 in review

Electricity market performance
2010–2011 in review

Electricity market performance: 2010–2011 in review

Electricity market performance: 2010–2011 in reviewOverview
This report reviews market performance during the Electricity Authority’s first year. It is the first of what will be annual market performance assessments.
The purpose of producing these reviews is to highlight important events and trends during the year and to summarise the work of the Authority in monitoring and facilitating market performance.
This first edition serves the purpose of scene setting – recording the environment at the time of the Authority’s establishment and developments over the succeeding 12 months.
Future reviews will apply a more technical lens to analysing market behaviour, monitoring activity and measuring performance against this baseline.
The objectives of the AuthorityOn 1 November 2010, the Authority inherited a market in good operating shape, but with a number of structural shortcomings. The Authority’s mandate is to lift the industry’s game; to ensure conditions are in place for improvements that will benefit consumers over the long term.
The Authority’s objectives are more precise than those of its predecessor. It is tasked with pursuing and balancing tradeoffs across competition, reliable supply and efficient operation of the electricity industry. These are tied together by the ultimate objective of long-term benefit for consumers.
Getting this right is essential to the future prosperity of New Zealand. Electricity is a critical engine of our economy; and we’ve seen before how the introduction of competition, for example, can make that engine more productive.
Electricity supply is among the few sectors of the economy that has performed well in terms of productivity gains in recent decades,1 but we can do better.
The 2009 ministerial review of market performance, which led to the creation of the Authority, noted that retail margins for residential consumers had increased significantly in recent years.
The review also noted that continuous improvements in market performance and governance were necessary to meet the ongoing challenge of ensuring security of supply at prices that reflect efficient levels of supply.
Monitoring and improving market performanceImproving market performance is a matter of creating the right conditions for innovation and efficiency rather than stipulating particular outcomes. The Authority’s approach reflects this view.
This means there is no point at which one can say ‘the job is done’. Rather, the objective is continual improvement. The Authority will monitor market performance on an ongoing basis and evolve the market rules to make sure improvements are taking place.
Ultimately, the electricity market is not any one thing. It is the sum total of different players with different concerns, incentives and responsibilities. It is the end result of a range of submarkets trading in products and services that meet different needs.
The role of the Authority is to ensure these market segments interact with one another in a way that results in beneficial outcomes for consumers. That means, for example, providing information to consumers about retail tariffs, facilitating greater hedge market liquidity or providing for efficient settlement services.
Big changes in the first 12 monthsIn some respects, the landscape has changed significantly in the last 12 months. At year end, 400,000 consumers had switched to a new retailer, and asset swaps, virtual and actual, have altered the commercial geography of electricity generation. These are changes of a magnitude that would previously have taken years, not months.
We have also seen the installation of a new gas-fired peaking plant and associated gas reservoir – a first for the New Zealand energy market and a real innovation as well as a plus for system reliability and efficiency.
Overview
1 See http://nzier.org.nz/newsletter/industry-productivity-and-the-australia-new-zealand-income-gap-nzier-working-paper-2011.

Electricity market performance: 2010–2011 in reviewOverview
Yet, for many consumers, the past year has been unremarkableIn other respects, it has been business as usual for the market. From the point of view of many consumers, market activity has been smooth and unremarkable.
That is not to say that there has not been the odd bump in the road (such as the emergence of an undesirable trading situation, which is currently undergoing review in the courts). There will always be bumps in the road, but in some respects, Year 1 has been largely unremarkable due, in part, to the serendipity of reasonably significant hydro inflows and modest demand growth through much of the year.
For others, price volatility has caused concerns and imposed costsThis year, we have seen how significant hydro inflows can become a winner’s curse in the presence of capacity constraints in the transmission network. We have also seen how, on occasion, short-term bouts of uncertainty cause wholesale market price spikes.
Price volatility is a fact of life, but more can be done to ensure that participants have the capacity to respond to changing prices and manage price risks. The need to improve the timeliness and reliability of market information to help participants do precisely this has been a recurring theme in this year’s market monitoring.
Stakeholders are clear on where improvement is required mostMarket participants have told us that the wholesale market is operating well. Other aspects of the market such as the provision of system reliability services may require more focused monitoring to determine whether they are performing as well as should be expected.
Many of the themes from the 2009 ministerial review continue to lie at the forefront of stakeholders’ concerns, especially in terms of the competitiveness of some segments of the market.
The development of hedge markets, for example, is something we are monitoring closely and working to facilitate, including in regard to financial transmission rights.
Hedge instruments are essential to helping market participants manage risk and thereby lowering barriers to entry into key market segments such as retail and generation.
Again, information is a crucial issueA review of market performance over the past 12 months shows that the hedge market is not yet as robust as it needs to be for promoting competition and efficiency in vertically integrated generation and retail markets.
Long-term contracts remain thin on the ground and the structure of the market, on the sell side, is heavily concentrated in the hands of a few sellers. Once again, information is a crucial issue. A thin market with a few
sellers reduces the veracity or reliability of the signal from long-term contract prices. It is also not conducive to improving competition.
It is essential to have conditions that are conducive to flexibility on both the demand and supply sides of the market to ensure system reliability in drier years.
The Authority has made significant progress on this front, but challenges remain.
By working on system performance, we intend to provide the scope and conditions for innovation and a dynamically efficient market. Ongoing market monitoring and information provision will be a central part of this.
Dr Brent LaytonChairperson

Market structure as at 1 November 2010 1
Consumers 3
Residential consumers 4
Commercial consumers 5
Industrial consumers 5
Producers 6
Retail and distribution 10
Grid and system operation 13
Transmission 13
System operation 13
Ancillary services 14
Regulators 17
Statutory objective and outcomes 17
Section 42 17
Market monitoring processes at the Electricity Authority 18
The year to 31 October 2011 19
Wholesale market 22
Rapid rise in prices in December 2010 24
Dispatch of unscheduled generation 26
Retail market 27
Hedge market 30
Generation 32
Asset swaps 32
Stratford peaker commissioning 32
Grid operation, scheduling and dispatch 33
Grid investment 34
HVDC flow constrained-off in final pricing 35
Ancillary services 36
November 2011 and beyond 38
Other information 41
FiguresFigure 1 Market participants and money flows 2
Figure 2 Electricity demand by location 3
Figure 3 Long-run electricity prices by consumer
sector and residential cost components 4
Figure 4 Demand peaks and troughs, GWh per day in 2010 5
Figure 5 Generation 7
Figure 6 Rising costs of new supply 8
Figure 7 Sale and purchase of energy by company
and location, year to 31 October 2010 9
Figure 8 Retailer regional concentrations 10
Figure 9 Past hedge market development 11
Figure 10 Distribution companies 12
Figure 11 Planned transmission investment,
June year capital expenditure 13
Figure 12 New Zealand transmission network 14
Figure 13 Major providers of ancillary services 16
Figure 14 Supply potential 19
Figure 15 Wholesale prices at the Otahuhu node 20
Figure 16 Sector competitiveness: survey
respondent ratings 20
Figure 17 Demand, economic activity and climatic
trends 2010–11 21
Figure 18 Daily generation by fuel type 22
Figure 19 HVDC transfers 22
Figure 20 Wholesale spot market prices in 2010–11 23
Figure 21 Wholesale market price volatility
and demand 24
Figure 22 December 2010 price rise 25
Figure 23 Constrained-on costs 26
Figure 24 Residential ICP switches as percentage
of residential ICPs 27
Figure 25 Change in retail concentration 2010–11 28
Figure 26 Advanced meters installed 29
Figure 27 Hedge market activity 2010–11 31
Figure 28 System interruptions 33
Figure 29 Instantaneous reserve prices 34
Figure 30 Frequency-keeping costs 34
Figure 31 Average frequency-keeping constrained
price and energy price, North Island 35
Figure 32 August 2011 frequency-keeping costs
breakdown by participant, North Island 35
Figure 33 Price separation and reserve prices 37
Figure 34 Retail market share 38
Figure 35 Sale and purchase of energy by company
and location, year to 31 October 2011 40
Electricity market performance: 2010–2011 in reviewOverview
Contents

Electricity market performance: 2010–2011 in reviewMarket structure as at 1 November 2010
Market structure as at 1 November 2010
The Electricity Authority’s approach to monitoring and assessment of market performance is based on three aspects: structure of the market, conduct of its participants and performance of the market. The simple premise is that the structure of the market determines the conduct of its participants and this conduct drives market performance.
This framework is commonly used for gauging market competitiveness – the more competitive the structure, the more competitive the conduct of participants and the more efficient their performance. This SCP framework also links to a menu of competition metrics and indicators the Authority is developing to assist in its monitoring activities. Future reviews will be more technical than this first edition and will draw on a range of these and other indicators currently in development.
The SCP concept can also be used for framing analyses of market performance in terms of reliability and efficiency. It provides a basis for contextualising and comparing different determinants of competition, reliability and efficiency and highlighting their interdependencies.
Accordingly, this review begins with an assessment of market structure as at 1 November 2010 to provide context for discussion of the conduct and performance of the market during the year to 31 October 2011. The final section of this review then reflects on the market structure at year end and implications of market performance in the past 12 months for performance in 2011–12 and beyond.
The structure of the market dictates the kinds of tradeoffs that need to be made over time between system reliability, competition and efficiency. Structural issues affecting these tradeoffs and, ultimately, market performance include the following.
•Scale: Larger-scale supply systems can be productively more efficient, but a highly concentrated market can limit competitive pressure, making for a less dynamically efficient or innovative market over time.
•Time: Supply is matched to demand almost instantaneously in the wholesale market. Ensuring reliability of supply means that, from time to time, prices and volumes deviate significantly from expectations.
•Distance: Production may be cheapest near fuel sources that are some distance from demand, but the further electricity travels, the more it costs in terms of transmission infrastructure and energy lost along the way. Reflecting this tradeoff in electricity prices is important for the efficient provision and use of infrastructure. However, it also results in regionalised price spikes due to localised scarcity of supply or limited infrastructure capacity. This can act to limit competition, especially in retail markets.
•Non-contestablesegments: Parts of the electricity market are not contestable. This is true in general for services such as system operation, transmission and distribution.
It is also true for parts of the wholesale market from time to time, for example, when regional transmission constraints occur.
From the perspective of most producers and consumers, these features of the electricity market can be best described in terms of the presence of price risk.
•Participantsinfundamentallynon-contestableparts of the market face no risk, as they can pass costs on to others.
•Participantsonthesellsiderisknotachievinga return on investment if prices in the wholesale market are too low.
•Onthebuyside,theriskisthatpricesspikeunexpectedly and they cannot adjust demand to avoid potentially high costs, and even if they do, the opportunity cost of reducing consumption can be high, especially for consumers with production contracts.
In practice, participants do not fall neatly into these categories. Participants in uncontested portions of the market face regulatory constraints that hold them accountable for decisions and limit their capacity to pass on costs to consumers.
Participants with sufficient incentive and capability deal with price risk by taking a position on both the buy and the sell sides of the market and diversifying their energy supply. Generators sell electricity into the wholesale market and buy electricity in the wholesale market to serve their retail businesses.
1

Consumers Retailers
Clearingmanager
System operator
Electricity Authority
Other service providers
EECA
Direct connect customers
Line charges$2,000m
Authority levy $60m Authority levy $2m
Authority levy $20m
Authority levy $5m
Energy charges $500m
Energy and lines charges
$5,300m
Grid charges $450m
Energy charges $2,600m
Energy $2,500mInst. reserves $25mAncillary services $65mNet rentals $20m
Hedge contracts
Black start and OFA $2m
Service provider costs $5m
Reserves charges $25m
Service provider costs $2m
Service provider
cost $32m
Whirinaki contract $30m
Grid charges $110m
Voltage support $10m
Net rentals $70m
Energy efficiency programmes $13m
Frequency-keeping charges $50m
Frequency-keeping $5m
Net rentals $10m
Grid charges $60m
Generators
Transpower(grid owner)
Lines companies
Electricity market performance: 2010–2011 in reviewMarket structure as at 1 November 2010
Big industrial users typically adopt a portfolio of energy supply options including a mix of own generation (cogeneration), selling electricity (or capacity) into the wholesale market or buying short term from the wholesale market or longer term via contracts from futures markets or retailers. For these participants, the risk they face from high levels of hedge cover is that they may miss the opportunity to buy cheaply from the wholesale market when prices are low.
For most consumers, price risk is taken on by other parties, but this comes with a price premium. Most electricity consumed in New Zealand is bought under a bilateral contract between the consumer and a retailer. As the major retailers are also generators, this means that most electricity is bought under bilateral contracts between a consumer and a generator.
The tradeoff between uncertain benefit (choosing lower-priced wholesale electricity) and certain cost (choosing contract prices or high reliability of supply) is where the action is in electricity markets. Claims of adverse market outcomes often arise when a participant is caught with insufficient cover on one or other side of the market.
On the other side of price risk is supply risk. Producers and consumers have a strong interest in ensuring that supply meets demand and that adequate infrastructure is available to support this. Reliability of supply needs to be balanced, however, against the additional cost and potential price risk that typically comes with higher levels of system reliability and supply security. Striking the right balance here is another fundamental dynamic affecting market structure and market performance.
Figure 1: Market participants and money flows
2

Electricity market performance: 2010–2011 in review
50GWh 1,000GWh 5,000GWh
Market structure as at 1 November 2010
These issues cannot be resolved; they can only be attenuated, not least because the electricity market is not any one thing. It is the sum total of different players with different concerns, incentives and responsibilities. It is the end result of a range of submarkets trading in products and services that meet different needs. We define a well functioning market as one where all participants have the incentives and opportunities to conduct their business and manage risks in ways that deliver increasing benefits to consumers over the long run.
ConsumersAt the apex of the market are the consumers who benefit from access to reliable and reasonably priced electricity. In 2010, consumers spent nearly $6 billion on electricity.
Consumers range from large-scale heavy industrial consumers to small-scale residential users, and they are spread across the length and breadth of New Zealand.
As at 1 November 2010, the electricity industry served more than 1.9 million customers, channelling nearly 40,000GWh of electricity per year over much of New Zealand’s 260,000 square kilometres.
New Zealand’s major demand centres are the main cities, particularly Auckland, and isolated large-scale industrial facilities such as an aluminium smelter, wood-processing plants, dairy factories and steel mills.
Figure 2: Electricity demand by location
Source: Electricity Authority
3

Electricity market performance: 2010–2011 in reviewMarket structure as at 1 November 2010
Residential consumersResidential consumers are an extremely diverse and diffuse group; however, a range of consumer groups are frequently engaged in regulatory and policy processes to promote the views and interests of many households. The Domestic Energy Users’ Network (DEUN), for example, is an umbrella group comprising Age Concern New Zealand, Child Poverty Action Group, Grey Power Federation, Public Health Association and Rural Women New Zealand.
From a system reliability perspective, residential consumers drive most of the demand on New Zealand’s electricity infrastructure capacity (see Figure 4), despite residential demand making up only a third of total demand.
Residential demand varies considerably hour by hour and season by season. Daily peaks in consumption coincide with peaks in residential demand in the early evening and the morning. The lightest demand period is in the early hours of the morning.
Seasonal peaks in demand come in winter when electricity is particularly in demand from home heating and clothes drying. A cold front moving up the country can have a dramatic impact on household demand and demand overall, and the speed and temperature impact of cold fronts is relatively hard to predict.
Despite the pressure that households exert in demand peaks and troughs, households are insulated from short-term price swings through ‘fixed price’ retail contracts.
This means that residential consumers are not generally responsive to short-term shifts in the cost of electricity.
This lack of price responsiveness limits retail market competition and is exacerbated over the longer term by the transaction costs associated with switching retailers.
A lack of consumer responsiveness to electricity prices has been a key motivation behind policy and commercial initiatives in recent years to facilitate demand response, including the following.
•TheConsumerNZPowerswitchwebsite,established in 2001, offering information to consumers on relative costs of electricity retailers. The site was revamped
Figure 3: Long-run electricity prices by consumer sector and residential cost components
in 2008 during a period of rising electricity prices and appeared to facilitate a lift in the number of households switching retailers.
•The rollout by retailers of smart meters, which improve meter measurement by reducing the need for onsite meter reading and may eventually allow consumers to better understand and manage their demand.
•Subsidyschemestoencouragetheinstallation of energy-efficient home-heating equipment and insulation.
Source: Ministry of Economic Development, Electricity Authority
4
Residential
25
20
15
10
5
0
1980 1985 1990 1995 2000 2005 2010
Commercial Industrial
Generation 36%
Transmission 8%
Distribution 29%
Meters 2%
Retail cost and margin 14%
GST 11%
c/kW
h, in
flatio
n ad
just
ed

Electricity market performance: 2010–2011 in reviewMarket structure as at 1 November 2010
Figure 4: Demand peaks and troughs, GWh per day in 2010
Heat pumps, for example, had been installed in 21 percent of households in 2009, compared to 4 percent 4 years earlier.2 The proliferation of heat pump technology has impacted the shape of energy demand. Though they reduce energy demand on average, demand peaks become steeper because heat pumps are less efficient at colder temperatures when demand is already highest.
In the year to 1 November 2010, around 500,000 smart meters had been installed in New Zealand. Building on the work of the Electricity Commission, the Authority has revised the rules and procedures around metering and reconciliation to ensure they don’t inhibit the uptake of smart meters.
Commercial consumersCommercial consumption, which makes up around a quarter of electricity demand, is much like residential demand to the extent that it is often insulated from market price volatility through retail contracts. There are, however, some 10,000 commercial customers with retail tariffs linked directly to half-hourly wholesale market prices.
Commercial demand patterns are much less ‘peaky’ than residential demand, especially in terms of daily demand. There are, however, strong summer (ie air conditioning) and winter peaks in commercial demand.
Industrial consumersIndustrial demand, which is a little over a third of New Zealand’s demand, is concentrated in a few major sectors.
Rio Tinto, New Zealand’s aluminium smelter at Tiwai Point near Bluff, consumes approximately 15 percent of New Zealand’s total electricity.
Other major energy users include a range of sites that are directly connected to the transmission grid such as CHH Pulp and Paper, Norske Skog Tasman, Pan Pac Forest Products and New Zealand Steel.
Source: Electricity Authority
Other major users who are not directly connected include Fletcher Building Limited and Heinz Wattie’s.
Dairy factories are also big electricity consumers, although they have highly seasonal demand patterns, with the largest use in spring when pasture is growing vigorously and milk production is highest. Use diminishes during summer and autumn and is lowest in winter when milk production, except for the fresh milk market, ceases. Fresh milk processing requires relatively little energy.
2 Burrough, L (2010) Heat Pumps in New Zealand Houses, 5th Australasian Housing Researchers’ Conference, November, Auckland, www.branz.co.nz.
5
Weekly maximum
125
120
115
110
105
100
95
90
85
80
75
70Jan Feb Mar Apr May Jun
Weekly average Weekly minimum
GW
h
Jul Aug Sep Oct Nov Dec

Electricity market performance: 2010–2011 in reviewMarket structure as at 1 November 2010
A majority of large electricity users (primarily, but not exclusively, industrial users) cooperate to influence electricity regulatory and policy strategy decisions through the Major Electricity Users’ Group (MEUG). MEUG members represent over a quarter of New Zealand’s electricity demand.
Some large-scale users are active in the electricity market on a day-to-day basis. Indeed, a number operate as both consumers and producers, buying from and selling electricity into the grid.
However, the number of industrial and commercial businesses buying electricity directly from the wholesale spot market is quite limited, and of those that do, a number still buy much of their electricity from a retailer or generate the electricity themselves through a cogeneration plant. Some choose also to purchase from retailers under separate financial arrangements to cover their exposure to movements in the spot price when buying on the wholesale market.
Major industrial users have an important role in overall system reliability, efficiency and competition, as reduced consumption is a potential substitute for generating capacity, especially in terms of peak demand. About a dozen major users offer interruptible load into the instantaneous reserves market, for example, reducing the need to have costly generation capacity available to cover for situations when power stations trip off the system.
Major industrial users may also provide ‘last resort’ capacity to the energy market, in that they reduce their demand in situations when electricity supply becomes very tight and spot market prices rise to very high levels.
The value of demand-side participation will increase in coming years if investment in intermittent generation increases as expected. In so doing, it will become an increasing source of competition in the wholesale market, and we can expect innovative organisational responses if the spot market adequately rewards them for filling this role.
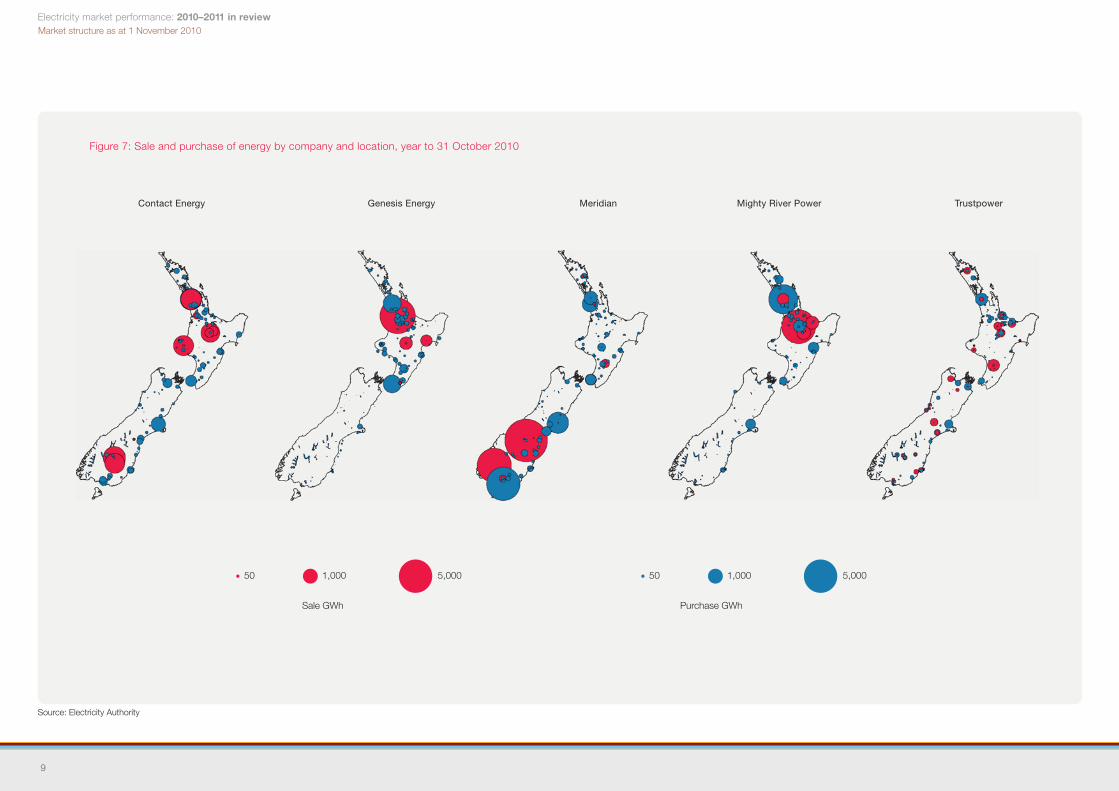
ProducersAs at 1 November, six generators owned the bulk of New Zealand’s generating capacity. Three of these were State-owned enterprises (SOEs) – Meridian Energy, Genesis Power and Mighty River Power. Two were privately owned and listed on the New Zealand Exchange – Contact Energy and TrustPower. One, Todd Energy, was privately owned and unlisted. Between them, these six companies account for well over 90 percent of New Zealand’s generating capacity.
The market that connects consumers draws energy from all over the country, with 40 percent of electricity produced in the South Island and 60 percent in the North Island in calendar year 2010. This compares with three-quarters of New Zealand’s population and two-thirds of the nation’s electricity demand residing in the North Island.
Recent years have seen a decline in the share of thermal generation in the overall generation mix. Part of this has been due to soft demand arising from the ongoing weakness in the New Zealand economy and a pronounced softening in industrial electricity demand.
The structure of electricity generation and prices for new plant dictate the structure and underlying trends of electricity prices. In the short term, prices tend towards the cost of running the most expensive plant needed to meet demand. Prices tend to rise and fall in cycles as more expensive plant is needed to serve demand. This provides incentives to invest in new electricity generation, and the kind of investment that takes place will tend to reflect movements in the costs of different technologies including running costs (such as gas and coal prices).
As a result, trends in electricity prices tend to reflect changes in the costs of new electricity generating plant, whereas short-term cycles tend to reflect rising and falling gaps between demand and productive capacity.
The cost of investing in new generating plant has been rising consistently over time. Key trends have included increases in the cost of thermal plant due to rising fuel costs and the New Zealand Emissions Trading Scheme.
Offsetting some of these cost drivers has been the relatively high value of the New Zealand dollar in the past 2 years, which has helped to reduce cost escalation for imported plant, equipment and materials. Nonetheless, rising capital costs have put upward pressure on electricity prices in the past decade (as shown in Figure 6).
6

Electricity market performance: 2010–2011 in review
Typeofgeneration
Hydro
Gas
Coal
Geothermal
Diesel
Wind
Other (biomass/waste heat)
Cogeneration
Clyde
Roxburgh
WaiporiTeviot
WaitakiAviemore
Ohau C
Coleridge
Highbank
Cobb
Mangahao
Te ApitiTararua
KapuniWhareroa
Patea
Southdown
Ngawha
OtahuhuGlenbrook
Huntly
Ohau BOhau ATekapo B Tekapo A
Manapouri
Whitehill (embedded)
Taranaki CC
See inset
Whirinaki
Benmore
West Wind
Figure 5: Generation
TuaiKaitawa
Matahina
OhaakiNga Awa Purua
Wheao & Flaxy
Arapuni
Karapiro
Te RapaKaimai Scheme
Edgecumbe
Rotokawa
KinleithWaipapaMaraetai
WhakamaruPoihipiMokai
Wairakei
OhakuriAtiamuri Aniwhenua
Rangipo
Tokaanu
Kawerau
Piripaua
Aratiatia
Market structure as at 1 November 2010
Source: Electricity Authority
At the same time, electricity has been serving an increasing share of New Zealand’s overall energy demand, compared to other energy sources such as gas.
The existence of alternatives to electricity provide a degree of competition for electricity producers, although this is limited by the fact that companies that sell gas also sell electricity. It is also limited by the incomplete coverage of reticulated gas supply in the North Island and absence of such supply in the South Island.
The stock of renewable generation capacity has grown in absolute terms in recent years, while its share of total generation capacity has remained constant at around two-thirds of installed capacity.
Around three-quarters of New Zealand’s electricity in 2010 was produced from renewable sources, the third highest such share in the OECD, behind Iceland and Norway.
The weight of renewables in New Zealand’s generation mix creates a number of structural challenges for producers and price risks for consumers. The most pronounced of these is the strong influence that hydrology exerts on production opportunities and on prices for electricity.
Hydro generation accounts for the largest share of New Zealand’s production resource, supplying around 56 percent of New Zealand’s electricity in 2010 and making up 54 percent of installed capacity. However, New Zealand has limited hydro storage capacity; from full capacity, only a few months of production capability in the absence of any water inflow.
Thus, production capacity swings with the availability of water. In general, South Island hydro tends to be at capacity in the spring months following snow melt and North Island hydro at peak capacity during the winter months.
These swings in production capacity from month to month affect intrayear prices quite significantly, with spot-market prices in dry years reaching multiples of average prices during ‘normal’ years.
7

Electricity market performance: 2010–2011 in reviewMarket structure as at 1 November 2010
Figure 6: Rising costs of new supply3Hydro generators need to gauge whether to use available water to generate or, if inflows are low, to wait for prices to rise. Conserving water early in a drought situation is beneficial to them if it allows them to generate more electricity at higher prices, and it signals scarcity. It comes with a risk, however, in that a lift in inflows can reduce a generator’s returns.
Large increases in wind-generating capacity in recent years have added to variability in overall generating capacity. The intermittency of this sort of generation means that market arrangements and firm capacity must be in place to ensure availability of backup.
Thermal generation also provides backup during dry years (known as ‘dry year firming’). Historically, this role has been mostly performed by coal-fired thermal plant. However, it is likely that gas-fired thermal plant will play a greater role in the future.
Price swings from variable production capacity introduce risks for producers, but most are vertically integrated with retail businesses. This provides a limited degree of natural hedge cover for when prices lift – higher wholesale prices meaning both higher revenue and higher costs across the entire business. This vertical integration is both a strategic response to price risk and a function of the historical absence of a liquid hedge market in New Zealand.
The presence of a natural hedge, from vertical integration, can impede retail market entry. Existing retailers are discouraged from entry into markets where they do not own generation. The resulting regionalised concentration of generators and retail providers limits the extent of the New Zealand market and reduces gains from trade.
Source: Ministry of Economic Development, NZIER, Electricity Authority
3 Capital costs for 2010 are from the MED Energy Outlook, based on the Authority’s generation expansion model. These are currently being updated.
8
180
160
140
120
100
80
60
40
$/M
Wh
Geo
ther
mal
20
04
Gas
CC
GT
2004
Hyd
ro
2004
Win
d 20
04
Coa
l 20
04
Geo
ther
mal
20
10
Hyd
ro
2010
Win
d 20
10
Gas
CC
GT
2010
Coa
l 20
10
2004 2010 2004 Contract price 2010 Contract price
Electricity market performance: 2010–2011 in review
5050 1,0001,000
Sale GWh Purchase GWh
5,0005,000
Market structure as at 1 November 2010
Source: Electricity Authority
Contact Energy Genesis Energy Meridian Mighty River Power Trustpower
Figure 7: Sale and purchase of energy by company and location, year to 31 October 2010
9

Electricity market performance: 2010–2011 in reviewMarket structure as at 1 November 2010
Retail and distributionThe nature of locational risk and vertical integration promotes a retail-market structure where providers are concentrated in particular regions. However, this concentration is also due to significant differences in prospects for regional market growth, which discourages new entrants in some regions. Slow-growing markets are generally less valuable compared with faster-growing markets. Firms are therefore less likely to compete for a share of these markets.
Retail market concentration is especially strong in the non-urban areas and in markets that are not growing rapidly. This is shown in Figure 8, where retail concentrations are mapped using the Herfindahl-Hirschman Index (HHI). The HHI measures market concentration on a scale from 1 to 10,000. If the index is above 5,000, it indicates that a single provider dominates the market.
The presence of a dominant player in regional retail markets doesn’t confirm a lack of competition, and dominance doesn’t imply high price. Nonetheless, highly concentrated markets are not conducive to competitive pressure.
Source: Electricity Authority
Figure 8: Retailer regional concentrationsBarriers to entry are exacerbated by well known consumer ‘stickiness’; consumers are not inclined to shop around for new electricity retail providers and may have little awareness of the savings they can make on their electricity bills if they shift providers.
By 1 November 2010, progress had been made on raising consumers’ awareness of the benefits of shifting, with 16 percent of consumers switching retailers in the year to November. This was an increase on the 10 percent of consumers switching in the year to September 2008.
10

Electricity market performance: 2010–2011 in reviewMarket structure as at 1 November 2010
Factors that have driven increased switching include rising electricity prices and the slump in the economy, which caused many households to tighten their belts. The Consumer Powerswitch website was also available to assist switching by providing information on how to switch and relative retail tariffs.
However, despite the increased rates of switching in recent years, as at 1 November 2010, retail market shares remained concentrated and prices and margins had not moved a great deal.
Firms wanting to compete for retail market share continued to face regionalised price risks if they didn’t have generation assets in the region. Those wanting to hedge against exposure to these risks found the market for hedge instruments not very well developed.
Significant steps were taken during 2010 to facilitate hedge market development, including the five largest generator-retailers entering into an agreement with the Australian Securities Exchange to support development of futures and options trading for electricity. However, in the year to November 2010, the highest monthly trading volume was less than 200GWh. This is less than 6 percent of monthly physical energy flows and stands in marked contrast to the now well developed Australian hedge market where the volume of contracts traded exceeds twice the volume of energy bought and sold in the physical market.
Source: Electricity Authority, Energy Hedge
11
Figure 9: Past hedge market development
Number of participants
8
7
6
5
4
3
2
1
02004 2005 2006 2007 2008 2009
Haywards spread
Spr
ead
%
2010
Electricity market performance: 2010–2011 in review
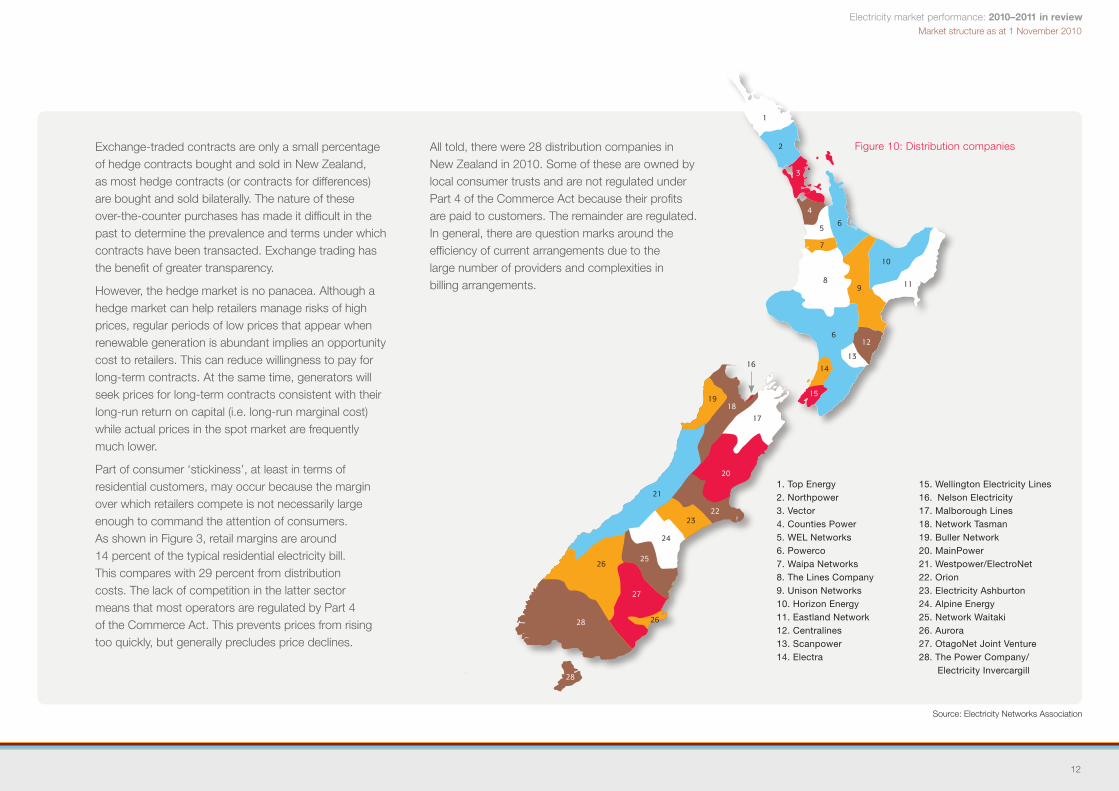
Figure 10: Distribution companies
Source: Electricity Networks Association
1. Top Energy2. Northpower3. Vector4. Counties Power 5. WEL Networks 6. Powerco 7. Waipa Networks 8. The Lines Company 9. Unison Networks 10. Horizon Energy 11. Eastland Network12. Centralines 13. Scanpower 14. Electra
15. Wellington Electricity Lines16. Nelson Electricity17. Malborough Lines 18. Network Tasman 19. Buller Network20. MainPower 21. Westpower/ElectroNet22. Orion 23. Electricity Ashburton 24. Alpine Energy 25. Network Waitaki 26. Aurora27. OtagoNet Joint Venture28. The Power Company/ Electricity Invercargill
Market structure as at 1 November 2010
Exchange-traded contracts are only a small percentage of hedge contracts bought and sold in New Zealand, as most hedge contracts (or contracts for differences) are bought and sold bilaterally. The nature of these over-the-counter purchases has made it difficult in the past to determine the prevalence and terms under which contracts have been transacted. Exchange trading has the benefit of greater transparency.
However, the hedge market is no panacea. Although a hedge market can help retailers manage risks of high prices, regular periods of low prices that appear when renewable generation is abundant implies an opportunity cost to retailers. This can reduce willingness to pay for long-term contracts. At the same time, generators will seek prices for long-term contracts consistent with their long-run return on capital (i.e. long-run marginal cost) while actual prices in the spot market are frequently much lower.
Part of consumer ‘stickiness’, at least in terms of residential customers, may occur because the margin over which retailers compete is not necessarily large enough to command the attention of consumers. As shown in Figure 3, retail margins are around 14 percent of the typical residential electricity bill. This compares with 29 percent from distribution costs. The lack of competition in the latter sector means that most operators are regulated by Part 4 of the Commerce Act. This prevents prices from rising too quickly, but generally precludes price declines.
All told, there were 28 distribution companies in New Zealand in 2010. Some of these are owned by local consumer trusts and are not regulated under Part 4 of the Commerce Act because their profits are paid to customers. The remainder are regulated. In general, there are question marks around the efficiency of current arrangements due to the large number of providers and complexities in billing arrangements.
12

Electricity market performance: 2010–2011 in reviewMarket structure as at 1 November 2010
Grid and system operationThe other major uncontested parts of the market, aside from distribution, are the transmission asset management and system operation functions of the market. Transpower currently provides both these services.
Although transmission and system operation are essentially uncontested, they should not be thought of as entirely non-market. The system operator, for example, has a significant impact on the operation of the electricity market through the systems it operates to dispatch generation within the limits of the transmission capacity of the grid.
TransmissionA major feature of the market as at 1 November 2010 was the large amount of transmission investment that had been planned and approved – a step change compared to the past several years.
Transpower’s capital investment programme in 2010 was around $500 million compared with an annual average of around $100 million for much of the previous 2 decades. Since 2007, $2.7 billion of capital expenditure has been approved.
The expansion of the transmission grid is a tightly regulated activity that attracts considerable attention from market participants both for the benefits of investment, ie system security and the reliability that additional transmission capacity brings to the market, and also for non-trivial and unavoidable costs that are recouped from market participants.
Transpower’s capacity expansion plans have locked in higher lines charges and therefore upward pressure on electricity prices. As at 1 November 2010, these had yet to flow into lines charges, and the actual rate of increase will depend on decisions by the Commerce Commission (for example, the rate of return Transpower can make on its assets and hence Transpower’s maximum allowable revenue) but could average 10 percent a year out to 2014.
Given transmission charges currently comprise around 10 percent of total electricity costs faced by consumers, this would lock in a 1 percent baseline increase in the cost of electricity to consumers. However, this cost will buy a significant increase in longer-term system reliability and opportunities for lower-cost generation investment.
System operationSystem operation involves real-time coordination of energy flows on the grid, dispatching generation to ensure lowest possible cost generation for consumers and safeguarding system security and reliability.
The system operator completed a major IT modernisation process in 2010, replacing systems more than a decade old. As with all new systems, minor refinements can be expected in the years ahead. The bulk of continued software system development is likely to be implementation of market design changes and new technology. The increasing amount of intermittent generation, in particular, wind generation, imposes particular challenges for system operation.
13
Source: Transpower Annual Report 2011
Figure 11: Planned transmission investment, June year capital expenditure
900
800
700
600
500
400
300
200
100
0
$ M
illion
s
95/9
6
Actual Planned
96/9
7
97/9
8
98/9
9
99/0
0
00/0
1
01/0
2
02/0
3
03/0
4
04/0
5
05/0
6
06/0
7
07/0
8
08/0
9
09/1
0
10/1
1
11/1
2
12/1
3
13/1
4
14/1
5
15/1
6
16/1
7
17/1
8
18/1
9
19/2
0
20/2
1
Financial year
Electricity market performance: 2010–2011 in reviewMarket structure as at 1 November 2010
Benmore
Haywards
Bunnythorpe
Islington
Kikiwa
Stratford
Huntly
Otahuhu
Whakamaru
Tiwai
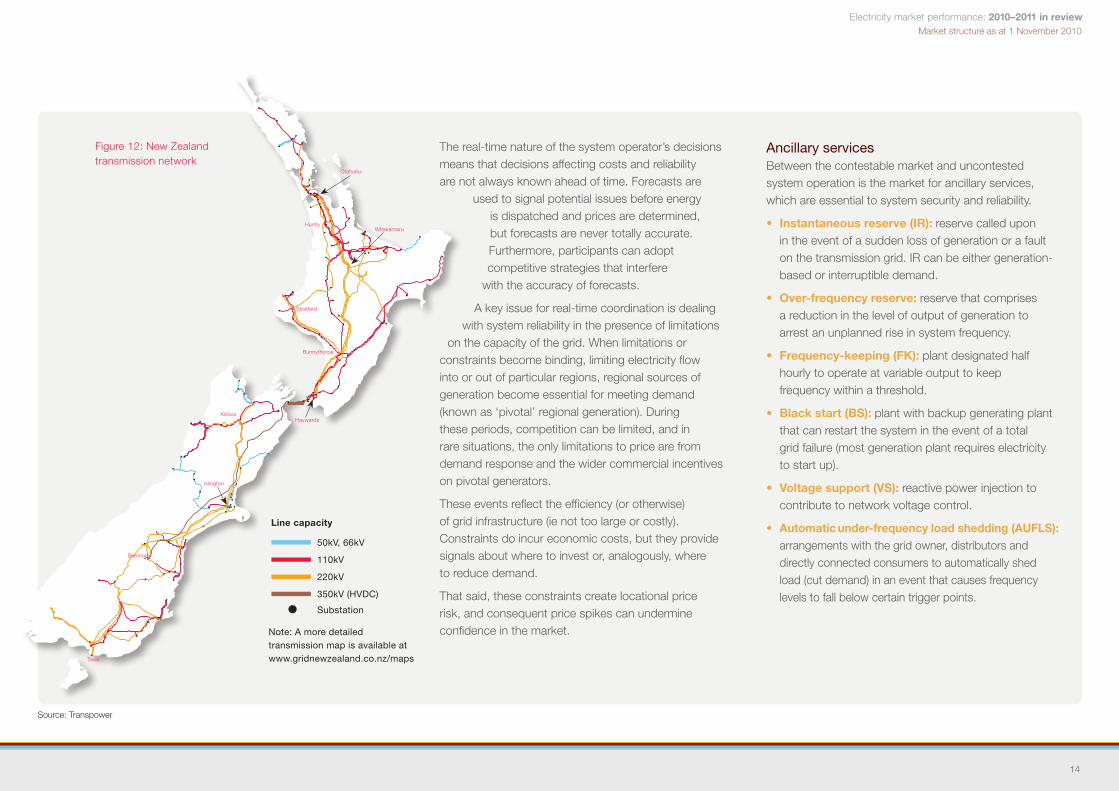
Note: A more detailed transmission map is available at www.gridnewzealand.co.nz/maps
Substation
350kV (HVDC)
110kV
220kV
50kV, 66kV
Line capacity
Figure 12: New Zealand transmission network
Source: Transpower
The real-time nature of the system operator’s decisions means that decisions affecting costs and reliability are not always known ahead of time. Forecasts are
used to signal potential issues before energy is dispatched and prices are determined, but forecasts are never totally accurate. Furthermore, participants can adopt competitive strategies that interfere
with the accuracy of forecasts.
A key issue for real-time coordination is dealing with system reliability in the presence of limitations
on the capacity of the grid. When limitations or constraints become binding, limiting electricity flow into or out of particular regions, regional sources of generation become essential for meeting demand (known as ‘pivotal’ regional generation). During these periods, competition can be limited, and in rare situations, the only limitations to price are from demand response and the wider commercial incentives on pivotal generators.
These events reflect the efficiency (or otherwise) of grid infrastructure (ie not too large or costly). Constraints do incur economic costs, but they provide signals about where to invest or, analogously, where to reduce demand.
That said, these constraints create locational price risk, and consequent price spikes can undermine confidence in the market.
Ancillary servicesBetween the contestable market and uncontested system operation is the market for ancillary services, which are essential to system security and reliability.
• Instantaneous reserve (IR): reserve called upon in the event of a sudden loss of generation or a fault on the transmission grid. IR can be either generation-based or interruptible demand.
•Over-frequencyreserve: reserve that comprises a reduction in the level of output of generation to arrest an unplanned rise in system frequency.
•Frequency-keeping(FK): plant designated half hourly to operate at variable output to keep frequency within a threshold.
•Blackstart(BS): plant with backup generating plant that can restart the system in the event of a total grid failure (most generation plant requires electricity to start up).
•Voltagesupport(VS): reactive power injection to contribute to network voltage control.
•Automaticunder-frequencyloadshedding(AUFLS): arrangements with the grid owner, distributors and directly connected consumers to automatically shed load (cut demand) in an event that causes frequency levels to fall below certain trigger points.
14

Electricity market performance: 2010–2011 in reviewMarket structure as at 1 November 2010
These services are purchased through a range of different competitive processes. The only exception is automatic under-frequency load shedding (AUFLS), which is a mandated requirement, although some direct-connect customers have obtained exemptions from these requirements until September 2012.
Instantaneous reserve is purchased in the wholesale market alongside dispatched energy generation. Over-frequency reserve is purchased from parties able to comply with specified technical requirements on a firm quantity procurement basis. The system operator will assess the quantity of reserve required in each half-hour trading period.
Frequency-keeping is purchased by the system operator on a half-hour clearing market procurement basis from parties able to comply with specified technical requirements.
Black start services are purchased by the system operator through annual contracts using open competitive tendering.
Voltage support is acquired through two mechanisms: shorter-term location-specific contracts let by competitive tender; and constraining on generation, ie requiring a plant to run when the first option is not available.
Although these services are purchased via contestable processes, their use is determined by the system operator and by Code provisions.
This is necessary because, for the most part, ancillary services have strong club-good or common quality characteristics. In the absence of mandatory purchase by the system operator, there would be significant free-rider problems as grid users would be able to enjoy the benefits of the services even if they did not contribute to paying for them, because excluding them access to the benefits would be practically impossible.
Nonetheless, the costs of these services pass to market participants.
•Frequency-keepingcostsareallocatedtopurchasersbased on volumes of energy purchased.
•Instantaneousreservecostsareallocatedintwoparts:
• Availability costs are allocated to generators and the HVDC owner based on quantity of electricity generated or transmitted.
• Event charges are allocated to those whose assets fail and cause frequency to fall below 49.2Hz.
•Over-frequencyreservecostsareallocatedtotheHVDC owner.
•Voltagesupportchargesareallocatedinthreepartsona zonal basis:
• A nominated peak kvar charge allocated to each distributor, and each generator with a dispensation from the reactive power capability required for its generating plant under the Code.
• A monthly peak penalty charge allocated to distributors based on how much their kvar peak usage was above their nominated peak usage in the month.
• A residual charge or payment allocated to distributors and generators with dispensations, so as to ensure the actual costs of providing reactive power are fully recovered.
•Blackstartcostsareallocatedtothegridowner.
The supply sides of the ancilliary markets are therefore reasonably competitive, at least over the longer term (in the short term, the capacity to offer some of these services may lie with a limited set of providers), while the demand side has a single buyer, albeit one with limited discretion on total volumes purchased.
One exception to the degree of competitiveness, in terms of market structure, is the supply of frequency-keeping services. This is heavily concentrated in the hands of the four largest generators, in part, because the operational requirements are relatively onerous. In addition, frequency-keeping presently operates separately in the North and South Islands, and there are only two providers in each island.
Increasing wind generation is putting greater demands on ancillary services, and as such, this segment of the market is becoming increasingly important to overall market performance.
15

Electricity market performance: 2010–2011 in reviewMarket structure as at 1 November 2010
These smaller parts of the market are an essential part of the overall electricity industry, and while they may be small in terms of energy flows or monetary costs, they are part of the wider system and so affect market performance in ways that are potentially much more profound than their size would indicate.
Source: Electricity Authority
By way of example, the provision of instantaneous reserve can dictate the amount of electricity that can be delivered via the HVDC link. Flows from the South Island need to be covered by reserves in the North Island and vice versa. In this way, the availability of reserves in each island can limit the maximum transfer capability of the HVDC link.
16
%
Genesis
Mighty River Power
%
Contact
Meridian
%
Genesis
Mighty River Power
TrustPower/Norske-Skog
New Zealand Steel
TrustPower
Pan Pac
Vector
Contact
Winstone
Other
New Zealand instantaneous reserve cost shares
Figure 13: Major providers of ancillary services
North Island frequency-keeping share South Island frequency-keeping share

Electricity market performance: 2010–2011 in reviewMarket structure as at 1 November 2010
Statutory objective and outcomesThe other and perhaps most fundamental change was the emphasis on a single statutory objective to guide the Authority’s work. Where the Electricity Commission had a number of overlapping objectives, the Authority now has one objective and a set of high-level organising principles for its work.
The key outcomes upon which the Authority’s success can be gauged are widespread.
• ConfidenceinthecompetitivenessofNewZealandelectricity markets.
• Acceptanceofefficientlevelsofsupplyreliability.
• AcknowledgementthatNewZealand’selectricitymarkets are efficient mechanisms for coordinating production and consumption and facilitating timely and innovative investment.
Section 42The Act also laid out in section 42 (and thus referred to as section 42 matters) some priority areas of work for the first 12 months of the Authority. These included:
(a) retailers to compensate consumers during public conservation campaigns;
(b) imposing a floor on spot prices in the wholesale market during supply emergencies (including public conservation campaigns);
(c) mechanisms to help wholesale participants to manage price risks caused by constraints on the grid;
(d) mechanisms to allow participants that buy electricity on the wholesale market to benefit from demand reductions;
(e) requirements for distributors that do not send accounts to consumers directly to use more standardised tariff structures;
(f) requirements for distributors to use more standardised use-of-system agreements and for those use-of-system agreements to include provisions indemnifying retailers in respect of liability under the Consumer Guarantees Act 1993 for breaches of acceptable quality of supply, where those breaches were caused by faults on a distributor’s network; and
(g) facilitating or providing for an active market for trading financial hedge contracts for electricity.
RegulatorsThe passage of the Electricity Industry Act (2010) established the Electricity Authority, an independent Crown entity charged with promoting competition in, reliable supply by and the efficient operation of the electricity industry for the long-term benefit of consumers.
The Electricity Commission was disestablished. Most of its roles and responsibilities passed to the Authority, but a number were passed to other entities with relevant responsibilities and capabilities. The task of evaluating and approving transmission expansion plans was passed to the Commerce Commission, which already had the mandate to regulate transmission revenue under Part 4 of the Commerce Act. The task of forecasting long-run trends in electricity demand and investment needs was passed to the Ministry of Economic Development, which already produced the annual Energy Outlook, and forecasting and management of security of supply was passed to the system operator. Electricity efficiency activities were transferred to the Energy Efficiency and Conservation Authority (EECA).
In terms of market performance, the establishment of the Authority embodied two fundamental changes. One was the status of the Authority as an independent Crown entity rather than a Crown agent as the Electricity Commission had been. This brings about more independence from government, reducing the potential for politicised decision-making and helping to improve confidence in regulatory decisions.
17

Electricity market performance: 2010–2011 in reviewMarket structure as at 1 November 2010
Market monitoring processes at the Electricity AuthorityThe Authority has a process for identifying and dealing with anomalous events. The three-step process is designed to understand causes and determine if they reflect actions that are outside market rules or potentially require rule changes or some form of market facilitation measure.
StageI(Marketperformanceenquiry)
Routine monitoring results in the identification of circumstances that require follow-up. This stage may entail the design of low-cost ad hoc analysis, using existing data and resources, to better characterise and understand what has been observed. Typically, there is no preannouncement the Authority is doing this work. This stage may result in no further action being taken if the enquiry is unlikely to have any implications for the competitive, reliable and efficient operation of the electricity industry. In this case, the Authority publishes its enquiry only if the matter is likely to be of interest to industry participants.
StageII(Marketperformancereview)
A second stage of investigation occurs if there is insufficient information available to understand the issue and it could be significant for the competitive, reliable or efficient operation of the electricity industry. Relatively informal requests for information are made to relevant service providers and industry participants. Typically, there is a period of iterative information-gathering and analysis. The Authority would typically publish the results of these reviews but wouldn’t preannounce it is doing this work unless a high level of consumer or participant interest was evident.
StageIII(Marketperformanceinvestigation)
Finally, under a full investigation, the Authority may exercise statutory information-gathering powers under section 46 of the Act to acquire the information it needs to fully investigate an issue. The Authority would generally announce early in the process that it is undertaking the investigation and indicate when it expects to complete the work. Draft reports go to the Authority’s Board for publication approval.
In 2010–11, all investigations have been Stage II reviews apart from an enquiry into price impacts of the Stratford peaker commissioning testing, which was Stage 1.
Many of the events discussed in this document draw on the enquiries and reviews carried out by the Authority’s Market Performance Group. Details of these reviews are made available on the Electricity Authority’s website (www.ea.govt.nz).
18

Electricity market performance: 2010–2011 in reviewThe year to 31 October 2011
Market performance in the year to 31 October 2011 was noteworthy for anomalies and swings in activity. Early in the year, it looked as if substantial retail price increases were on the way. This was followed by some major churn in retail customers and discounting activity, which took place against a backdrop of generous supply capacity and subdued prices in the wholesale market. These remained below their long-run level on average (see Figures 15 and 20).
The New Zealand economy remained relatively flat in 2010–11, with suppressed energy demand. In addition, the winter months were wet, and prices in the wholesale market were consequently subdued. Subdued wholesale prices made investment in generating capacity less economic than what it would otherwise have been and anticipated transmission investment less urgent. PricewaterhouseCoopers has noted that industry revenue for the five largest generator-retailers has been flat for the past 3 years and returns on equity have declined to 5.2 percent in the June year 2011 from 6.3 percent in 2009.
That said, bouts of cold weather have seen demand on the grid reach all-time highs at peak, while extreme snow falls in the North Island tested the resilience of transmission assets. Taking into account devastating seismic activity in Canterbury, from a grid management, system operation and reliability perspective, 2010–11 was rather remarkable.
The year to 31 October 2011
The net effect of soft demand and excess capacity could well have been positive for competition and dynamic efficiency in the electricity market by putting pressure on firms to find new ways to maintain profitability.
However, the extent to which this is true depends crucially on the competitiveness and functioning of downstream (eg retail) and ancillary services markets. Competitive pressure in one market can increase incentives to behave strategically in other markets if they are not functioning as well as should be expected.
Source: Electricity Authority
A survey by the Electricity Authority in August 2011 shows that consumers regard the electricity industry as third worst in terms of competitiveness when compared to a selection of other markets for consumer goods and services (see Figure 16).
Industry stakeholders hold similar views to household consumers regarding the competitiveness of electricity markets. However, their greater knowledge of the sector yields more nuanced insights.
4 This graph is intended to illustrate the general movements in the potential supply relative to actual demand. It ignores fuel constraints and assumes average levels of plant availability achieved in all years. It also assumes average levels of hydro and wind output. It is not an assessment of security of supply.
19
Figure 14: Supply potential4
55
50
45
40
35
1.50
1.45
1.40
1.35
1.30
1.25
1.20
1.15
1.10
1.05
1.00
Ratio of supply potential over demand Generation Demand
1997 1999 2001 2003 2005 2007 2009 2011
TWh
Rat
io

Electricity market performance: 2010–2011 in reviewThe year to 31 October 2011
Figure 16: Sector competitiveness: survey respondent ratings
Source: Electricity Authority
In general, the wholesale market gets a tick for competitiveness while the lack of depth in hedge markets and competitiveness in retail and ancillary services markets are singled out as areas for improvement. (This and other key findings from the perceptions survey commissioned by the Electricity Authority are discussed in the October 2011 Market Commentary available on the Authority’s website.)
Events in 2011 have highlighted the extent to which improved market information could reduce the impact of market anomalies.
A number of relatively short-lived events affected the operation of the supply side of the system, including the cold snap that saw snow arrive in North Island cities for the first time in decades and a consequent jump in power demand. These had a significant impact on the physical operation of the network.
The earthquakes in Christchurch in February tested the resilience of distribution systems in the South Island, and summer storms tested system operation and transmission and distribution systems in the North Island.
Transmission upgrades have led to a degree of disruption that has given rise to problematic market events and pricing outcomes caused largely by events in the ancillary services market and the decisions of the system operator.
Nevertheless, the market has exhibited a good degree of resilience in dealing with major climatic events.
Figure 15: Wholesale prices at the Otahuhu node
Daily price 60-day moving average
20
0
Industry stakeholders Consumers
Online bookstores
20 40 60 80 100
Petrol prices
Electricity retailers
Banks
Electrical goods
Supermarkets
Telephone companies
% of respondents ranking as ‘just adequate’ to ‘extremely competitive’
250
200
150
100
50
01998 2000 2002 2004 2006 2008 2010
Ave
rage
pric
e $/
MW
h

Electricity market performance: 2010–2011 in reviewThe year to 31 October 2011
Source: Electricity Authority, NIWA, Statistics New Zealand
21
Daily demand
Figure 17: Demand, economic activity and climatic trends 2010–11
140
130
120
110
100
90
80
70
60
50
Daily demand
Feb 11
Feb 11
Dec 10
Dec 10
Mar 11
Mar 11
Jan 11
Jan 11
Apr 11
Apr 11
May 11
May 11
Jun 11
Jun 11
Jul 11
Jul 11
Aug 11
Aug 11
Oct 11
Oct 11
Nov 10
Nov 10
Sep 11
Sep 11
Nov 11
30-day moving average
Dem
and
GW
h
Dem
and
GW
h
GD
P ($
95/9
6)
Economic activity vs demand39,000
38,000
37,000
36,000
35,000
34,000
33,000
32,000
31,000
30,000
GDP ($95/96, RHS)
140
135
130
125
120
115
110
105
100
95
90
Electricity demand (GWh, LHS)
Hydro risk Mean monthly temperature4,000
3,500
3,000
2,500
2,000
1,500
1,000
500
0
Nominal NZ full (Lakes Taupo, Tekapo, Pukaki, Hawea, Te Anau and Manapouri)
Sto
rage
GW
h
Mean NZ storage Actual NZ storage for 2011 Hydro risk curves
Emergency zone
Hydro risk curves
Mean NZ storageActual NZ storage
2000 2002 2005 2007 2010
18
17
16
15
14
13
12
11
10
9
8
2.5
2
1.5
1
0.5
0
-0.5
-1
-1.5
-2
-2.5
Deviation from monthly average in 2011 20-year monthly average
Mon
thly
tem
pera
ture
(deg
rees
C)
Col
der
Diff
eren
ces
in te
mpe
ratu
re W
arm
er
Mar May JulJanDec Feb Apr Jun AugNov Sep Oct
1%
2%
4%6%
10%
HRCs recalculated by system operator
HRCs recalculated by system operator

Electricity market performance: 2010–2011 in reviewThe year to 31 October 2011
Figure 19: HVDC transfers
Source: Electricity Authority
Wholesale marketAs noted, the trend in wholesale market volumes and prices has been flat, reflecting hydro inflows that have been above average for most of the year, combined with modest economic growth.
Hydro generation has been high for much of the year, and thermal generation has been at its lowest for some years in terms of share of generation. Alongside favourable hydrology, high levels of geothermal and wind generation have displaced thermal generation.
For much of the year, relatively high storage levels in South Island hydro lakes saw northward flows on the HVDC. This has been reflected in South Island price volatility being well below average (see Figure 21).
Despite this, interisland price volatility has been above average, partly reflecting low average price levels from which movements are larger in percentage terms.
22
Figure 18: Daily generation by fuel type
80
70
60
50
40
30
20
10
0
Geothermal
2009 2010 2011
Hydro
GW
h
Thermal Wind
1,200
1,000
800
600
400
200
0
-200
-400
Northwards
2009 2010 20112008
Southwards
Ave
rage
dai
ly M
W
2007200620052004

Electricity market performance: 2010–2011 in review
Source: Electricity Authority
The year to 31 October 2011
Otahuhu price distribution (2011 vs 2008–2010)
Figure 20: Wholesale spot market prices in 2010–11
Islington price distribution (2011 vs 2008–2010)
23
500
400
300
200
100
0
2011
250
2008–2010
Num
ber
of h
alf-
hour
ly o
ccur
renc
es
20015010050
Price ($/MWh)
500
400
300
200
100
0
2011
250
2008–2010
Num
ber
of h
alf-
hour
ly o
ccur
renc
es
20015010050
Price ($/MWh)
Benmore price distribution (2011 vs 2008–2010)500
400
300
200
100
0
2011
250
2008–2010
Num
ber
of h
alf-
hour
ly o
ccur
renc
es
20015010050
Price ($/MWh)
Haywards price distribution (2011 vs 2008–2010)500
400
300
200
100
0
2011
250
2008–2010
Num
ber
of h
alf-
hour
ly o
ccur
renc
es
20015010050
Price ($/MWh)

Electricity market performance: 2010–2011 in review
Source: Electricity Authority
The year to 31 October 2011
Figure 21: Wholesale market price volatility and demand
Standard deviation of raw half-hourly price series for each
node/substation, 2007–2010
Standard deviation of raw half-hourly price series for
each node/substation, Nov 2010 – Oct 2011
Standard deviation of half-hourly between node/substation price and
reference node price for same island, 2007–2010
Standard deviation of half-hourlybetween node/substation price and
reference node price for same island, Nov 2010 – Oct 2011
Standard deviation of half-hourly between node/substation price and
reference node price for other island, 2007–2010
Standard deviation of half-hourly between node/substation price
and reference node price for other island, Nov 2010 – Oct 2011
Low prices should be expected given the low proportion of thermal generation dispatched in 2011. In a competitive market, higher average prices will typically (but not always) occur when hydro storage is low and thermal generation is setting the market price.
Although the trend during 2010–11 has been towards high hydro generation and low prices, the first and last 2 months of the year have been punctuated by declining storage, increasing hydrological risk and upward pressure on prices. This was most marked in December 2010, when prices rose rapidly.
Rapid rise in prices in December 2010Towards the end of November 2010, wholesale spot prices began to increase and climbed quite rapidly throughout the first 3 weeks of December. Although throughout October and into November, prices were at very low levels relative to past experience, price levels attained in December were high by historical standards. The average price at the Haywards reference node for the first 22 days of December was $135.90/MWh, an increase of 144 percent over the November average and a 158 percent increase over the 1–22 December 2009 average.
Figure 22 shows average prices for the past 8 years, and the dark brown line plots the 2010 price path. The December 2010 increase in prices is clearly evident, as is the historically low price period in September through to early November.
By early January 2011, prices had once again returned to historically very low levels.
24

Electricity market performance: 2010–2011 in reviewThe year to 31 October 2011
Source: Electricity Authority
Analysis of these price rises suggested that the increase was a due to a combination of uncertainty regarding hydrology, uncertainty regarding the planned Maui outage in February 2011 and uncertainty regarding thermal plant availability.
An evolving situation regarding hydrological conditions, coupled with uncertainty and speculation about gas supplies and thermal plant availability, came to a head in late November and early December. Hydro generators were clearly signalling through their offer prices that they
had some concern about hydro storage and inflows expected ahead of winter 2011. As the hydro generators increased their offer prices, thermal plant entered the market, enabling water to be conserved. Prices increased rapidly once hydro offers were increased, as the remaining quantity of low price offers was quickly exhausted, with an outage at the Otahuhu combined-cycle plant a contributing factor.
In many respects, this is symptomatic of a market performing as it ought to; signalling tightening supply
conditions ahead of time. The market responded to the high price signals; some consumers curtailed demand and all possible thermal plant was made available, including a thermal plant that was offline for maintenance being quickly brought back into service.
There was, however, a strong reaction from large spot-market purchasers regarding the adequacy of information available to them about supply risks in early December.
The high prices in December provided a timely reminder to all parties exposed to spot market prices to hedge their exposures if they are unable or unwilling to reduce demand when spot prices rise to the levels needed to bring all thermal generation into the market. The New Zealand electricity system relies on those price signals to efficiently manage its hydro resources, and spot prices will rise to those levels from time to time.
A key outcome for the Authority from this event was confirmation that a review of availability of information to participants is an important part of the organisation’s work programme.
The December high price issue does, however, raise questions about the extent to which generators’ decisions to conserve water were commensurate with the emerging hydrological risk. Generators can, in principle, act to withhold generation in order to bring on higher-priced thermal generation and put upward pressure on wholesale prices. There is nothing in the analysis of the December event that suggests that this was an issue. However, the possibility needs further consideration as a matter of general market monitoring.
25
Figure 22: December 2010 price rise
400
350
300
250
200
150
100
50
0
Jan
$/M
Wh
Feb Mar Apr May Jun Jul Aug Sep Oct Nov JanDec
2003 2004 2005 2006
2007 2008 2009 2010
Electricity market performance: 2010–2011 in reviewThe year to 31 October 2011
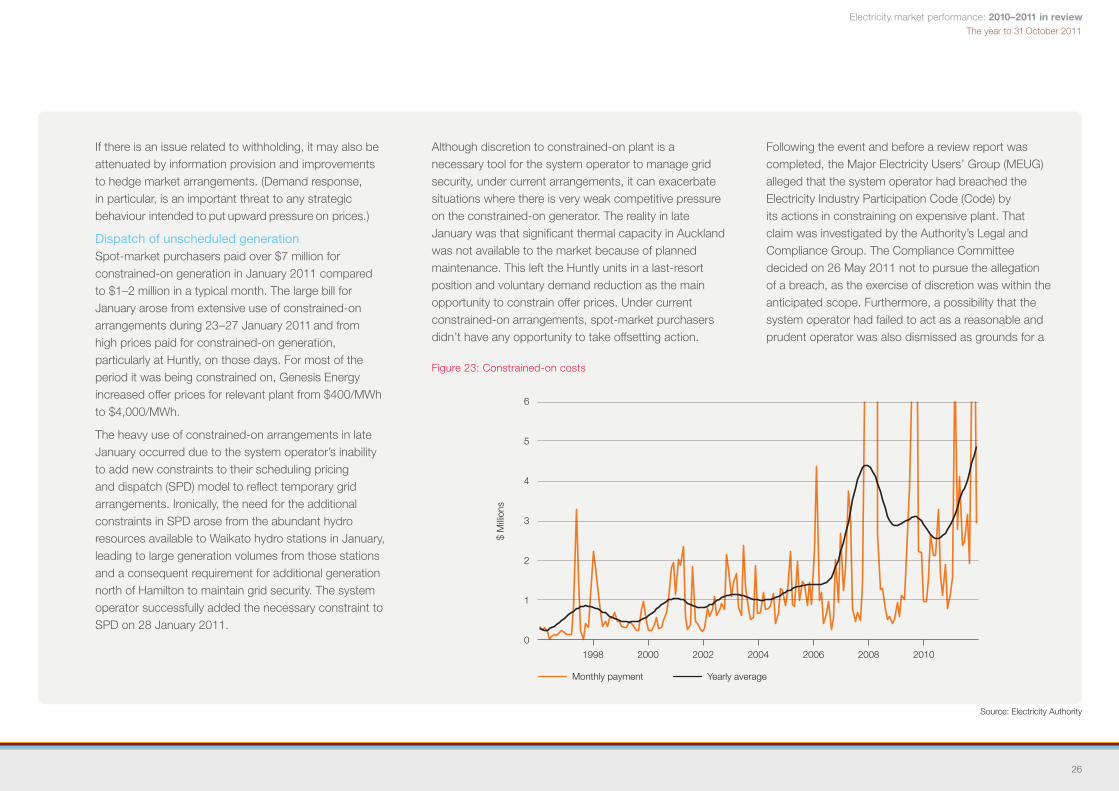
Figure 23: Constrained-on costs
Source: Electricity Authority
If there is an issue related to withholding, it may also be attenuated by information provision and improvements to hedge market arrangements. (Demand response, in particular, is an important threat to any strategic behaviour intended to put upward pressure on prices.)
Dispatch of unscheduled generation Spot-market purchasers paid over $7 million for constrained-on generation in January 2011 compared to $1–2 million in a typical month. The large bill for January arose from extensive use of constrained-on arrangements during 23–27 January 2011 and from high prices paid for constrained-on generation, particularly at Huntly, on those days. For most of the period it was being constrained on, Genesis Energy increased offer prices for relevant plant from $400/MWh to $4,000/MWh.
The heavy use of constrained-on arrangements in late January occurred due to the system operator’s inability to add new constraints to their scheduling pricing and dispatch (SPD) model to reflect temporary grid arrangements. Ironically, the need for the additional constraints in SPD arose from the abundant hydro resources available to Waikato hydro stations in January, leading to large generation volumes from those stations and a consequent requirement for additional generation north of Hamilton to maintain grid security. The system operator successfully added the necessary constraint to SPD on 28 January 2011.
Although discretion to constrained-on plant is a necessary tool for the system operator to manage grid security, under current arrangements, it can exacerbate situations where there is very weak competitive pressure on the constrained-on generator. The reality in late January was that significant thermal capacity in Auckland was not available to the market because of planned maintenance. This left the Huntly units in a last-resort position and voluntary demand reduction as the main opportunity to constrain offer prices. Under current constrained-on arrangements, spot-market purchasers didn’t have any opportunity to take offsetting action.
Following the event and before a review report was completed, the Major Electricity Users’ Group (MEUG) alleged that the system operator had breached the Electricity Industry Participation Code (Code) by its actions in constraining on expensive plant. That claim was investigated by the Authority’s Legal and Compliance Group. The Compliance Committee decided on 26 May 2011 not to pursue the allegation of a breach, as the exercise of discretion was within the anticipated scope. Furthermore, a possibility that the system operator had failed to act as a reasonable and prudent operator was also dismissed as grounds for a
26
6
5
4
3
2
1
0
1998 2000 2002 2004 2008
$ M
illion
s
20102006
Monthly payment Yearly average

Electricity market performance: 2010–2011 in reviewThe year to 31 October 2011
Figure 24: Residential ICP switches as percentage of residential ICPs
Source: Electricity Authority
Code breach, as that requirement was not over- arching and was not relevant to the system operator’s failure to design security constraints in a timely manner (thereby necessitating the out-of-market dispatch of expensive plant).
Since this event, the Authority has requested the system operator to provide additional information to the market about constrained-on dispatch of generation. This information is being provided by issuing customer advisory notices (CANs) indicating the MW value of constrained-on generation, but not the associated price or location. The system operator has agreed to make the changes necessary to enable publication of the location and reason for the use of discretion in the CAN. Improved availability of information about constrained-on plant will enable greater scrutiny and better risk management by affected parties.
The Electricity Authority’s review of these events also raised issues that need further consideration such as:
•examininghowbetterinformationcanbeprovidedto the market in advance of and during periods of unscheduled plant dispatch, for example, further consideration being given to whether and how the market could be more quickly informed of the offer prices of constrained-on plant;
•examiningwhethertherearemarket-basedsolutionsto increasing the options available to the system operator during constrained-on periods, for example, consideration could be given to whether it is feasible and cost-effective to establish a constrained-on market analogous to the instantaneous reserves market; and
•examiningthesystemoperator’sabilitytouseitsautomatic constraint builder (SFT) to help reflect the cost of managing system security in predispatch schedules and ultimately final nodal prices.
Retail marketWhile wholesale prices were rising in the latter part of 2010–11, retail consumers were enjoying a shift down in price offerings almost certainly influenced by the increase in the number of people switching retailers.
The What’s My Number consumer awareness campaign began on 29 May 2011. Following the launch of the campaign, 162,965 consumers switched retail provider (between 1 June and the end of September), which was an increase of 37 percent on the same period a year earlier.
Increased switching has coincided with periods of declining market share for some major retailers and a flurry of discounting in apparent attempts to recapture or maintain market share.
Underlying retail prices were up 4.6 percent on an annual basis in the year to September according to Statistics New Zealand, though the September quarter recorded a 0.3 percent decline in prices following the introduction of the What’s My Number campaign.
These statistics accord with the flurry of discounting in the market, for example Contact Energy increased the discount for its Online OnTime plan from 12 percent to 22 percent, and Just Energy increased the prompt payment discount for its 18-month fixed-term plan from 10 percent to 15 percent.
A: Time to process falls below 10 business days on encouragement from the Electricity Commission. B: Time to process falls below 5 business days following regulation by the Authority.
27
2.5
2.0
1.5
1.0
0.5
0.0
2004 2005 2007 2008 2009 2010 20122011
A
B
Per
cent
age
per
mon
th

Electricity market performance: 2010–2011 in reviewThe year to 31 October 2011
Figure 25: Change in retail concentration 2010–11
Source: Electricity Authority
The biggest discounts came from the companies with the largest declines in market share.
Supplier responses to increased switching do not necessarily result in price-based competition. Some retailers have increased marketing spend. This can be just as valuable as one-off discounting given that it adds to consumer awareness of switching opportunities and ultimately potential cost savings.
It is also valuable in that it leads to greater transparency about retail tariffs – information availability being an important contributor to competitive pressures and market performance.
Retail switching is not valuable in and of itself and can impose transaction costs that lead to higher prices. The Authority’s focus is therefore on increasing consumer willingness to switch when savings are available, rather than increasing actual switching rates. A high level of consumer willingness to switch puts pressure on tariff offerings and encourages innovation even when switching rates are low. The Authority will be undertaking more analysis in 2012 to evaluate the economic benefits of the What’s My Number campaign.
Supplier responses have been interesting to the extent that some of the price-based competition appears to be targeted at consumers who pay promptly and represent less of a risk to retailers. Given that these high-quality customers are the ones most actively pursued, they are also the ones likely to be benefiting the most from increased retail competition.
28

Electricity market performance: 2010–2011 in review
5 Mercury Energy, quoted in Energy News, 11 October 2011.
The year to 31 October 2011
Source: Electricity Authority
This has the potential to create niches in the market with increased specialisation and innovative offerings targeted at different types of customers. That increased differentiation would be a positive development in terms of market efficiency.
Surveys show that the consumer switching campaign has increased the number of consumers aware they can save money by switching providers. (Results are available on the Consumer Switching Fund section of the Electricity Authority website.)
Switching has also become quicker over time with times to complete switching being shortened in 2008 and again in late 2010 (points A and B in Figure 24).
Retail market activity is unlikely to be entirely related to consumer awareness campaigns. For example, some of the scramble to secure retail share or stem a decline may also be associated with softer prices and lower returns in the wholesale market.
Switching rates have also been noticeably stronger in some regions than others, and the variation corresponds with those regions where increased retail competition arising from asset swaps could be expected. This appears to have resulted in an increase in market activity on the part of Genesis and Mercury in the South Island and an increase in Meridian’s activity and market share in Auckland.
No matter where it comes from, increasing competition for the retail dollar will help to keep a lid on electricity costs faced by consumers.
The long-term benefit of switching campaigns will ultimately be a change in the level of awareness of consumers about the range of options available to them in terms of retail providers and tariffs. Indeed, on the latter point, it may be that there is a need to raise awareness of the potential cost reductions from choosing appropriate tariff structures, irrespective of suppliers.
Benefits will also arise from pressure on retailers to make their offerings more attractive to consumers and drive organisational innovation as a result.
At least one retailer has observed that this is indeed what has been happening5.
In the past 12 months, the biggest changes in retail concentration have occurred in regions where concentration was previously lowest (Figure 25). This means any increases in competitive pressure have been strongest in the markets already most conducive to competitive pressure (structurally speaking). While this is positive for the majority of consumers in large urban areas, it raises questions over just how high barriers are to competition in the regions.
29
Figure 26: Advanced meters installed
700,000
600,000
500,000
400,000
300,000
200,000
100,000
0
2002 2004 2006 2008 2010 2011 2012
Number of Installation Control Points (ICPs)

Electricity market performance: 2010–2011 in reviewThe year to 31 October 2011
Source: Electricity Authority
In the distribution segment of the market, the Commerce Commission has been progressing work on an adjustment to regulated price paths for 2012–15. The adjustment is needed to account for a one-off increase in consumer price inflation from the increase in goods and services tax (GST) from 12.5 percent to 15 percent on 1 October 2010. Currently, distribution company tariffs are allowed to rise with the consumers price index (CPI) to account for rising distribution costs. However, distribution companies do not pay GST. As at 31 October, this adjustment to regulated price paths remained a work in progress.
During 2010–11, the focus of the Authority has been on the retail, hedge and spot markets through:
•progressingCodeamendments,withafocusonsection 42 matters;
•developingmarketfacilitationmeasuressuchastheWhat’s My Number campaign; and
•monitoringandinvestigatingmarketeventsandbuilding capacity to improve this function.
The Authority has been reasonably judicious in its activities, partly because its work programme was quite full in terms of section 42 matters that needed to be dealt with as a matter of priority, as well as overseeing essential services provision.
The Authority also faces some important information asymmetries; market participants know their businesses better than the Authority can. The Authority must signal its actions well in advance, work constructively with
consumer and industry representatives (via advisory groups and its consultation processes) to ensure that participants engaged in large-scale investment are confident of the likely path of market rules for the future.
Hedge marketFutures market activity expanded significantly over the year, partly as a result of market facilitation measures undertaken by the Authority in conjunction with major generators and the ASX.
At the start of 2011, contract volumes in the ASX NZ electricity futures (hedge) market had reached 780GWh, up from less than 450GWh in November 2010 and many times higher than the approximate 100GWh in the market when trading began in 2009.
The spread between buy and sell prices for futures contracts has fallen from around 7 percent to below 4 percent following the adoption of new market-maker agreements requiring 5 percent maximum spreads and increases in minimum offer volumes.
It is expected that, over time, the market will attract the interest of new players including financial intermediaries, small retailers and large consumers, providing greater liquidity to the market.
This will take time, however, as confidence in the market needs to build and changes to the organisational culture of the market are unlikely to occur overnight.
In Australia, where electricity futures trading pre-dates New Zealand’s earliest hedge markets by a number of years, trading volumes have only taken off since 2006.
The Minister of Energy and Resources set out an objective of 3,000GWh of uncovered open interest in the futures market by 1 June 2011. Although the objective was not strictly achieved, the overall outcome is positive as the three SOE generators have linked the price of their virtual asset swap (VAS) agreements to the futures price on the ASX platform. This has effectively achieved the result sought by the minister.
It may well be that, despite several positive institutional developments in the hedge market such as new market-maker agreements limiting bid-offer spreads, liquidity is being constrained by the relatively benign conditions in the spot market. In principle, this should not affect demand for hedge contracts because it doesn’t affect long-term price risk. However, it is also the case that periods of market stress can drive firms to innovate, and large consumers’ demands for a liquid hedge market have been loudest at times when spot prices are high.
Development of financial transmission rights (FTRs) will also broaden the range of options available to market participants to deal with locational price risk. FTRs are a form of hedge instrument specifically designed to deal with transmission-related price risk such as locational price spikes occurring when the grid becomes constrained. During the year, the Authority completed a Code amendment to facilitate the introduction of FTRs and tendered for a service provider to manage the administration and trading of these instruments.
30

Electricity market performance: 2010–2011 in reviewThe year to 31 October 2011
Source: Electricity Authority
Figure 27: Hedge market activity 2010–11
31
ASX financial markets Otahuhu – as at 17 October 2011 Futures market spreads
Futures prices Uncovered open interest
130
120
110
100
90
80
70
60
50
Pric
e $/
MW
h
Dec
11
Product end month
Feb
12
Apr
12
Jun
12
Aug
12
Oct
12
Dec
12
Feb
13
Apr
13
Jun
13
Aug
13
Oct
13
Dec
13
Feb
14
Apr
14
Jun
14
Aug
14
Oct
14
Dec
14
BidOffer
12
10
8
6
4
2
02005 2006 2007 2008 2009 2010 20112004
Spr
ead
(%)
Number of participants Haywards energy hedge
Benmore ASX Otahuhu ASX
100
90
80
70
60
50
402005 2006 2007 2008 2009 2010 20112004
Ave
rage
pric
e ($
)
Energy hedge Haywards Energy hedge Otahuhu ASX Otahuhu
1,000
800
600
400
200
0
Ope
n in
tere
st (G
Wh)
Sep
09
Benmore volume Otahuhu volume
Oct
09
Nov
09
Dec
09
Jan
10
Feb
10
Mar
10
Apr
10
May
10
Jun
10Ju
l 10
Aug
10
Sep
10
Oct
10
Nov
10
Dec
10
Jan
11
Feb
11
Apr
11
Jun
11
Oct
11
Mar
11
May
11
Jul 1
1A
ug 1
1
Sep
11

Electricity market performance: 2010–2011 in reviewThe year to 31 October 2011
GenerationAsset swapsAsset swaps among State-owned generators, as proposed by the 2009 Electricity Market Performance Review, were a major 2011 development. These swaps were both virtual and physical.
Virtual swaps involve Meridian Energy selling up to 450GWh/year to Genesis Energy and 700GWh/year to Mighty River Power in the South Island and buying the same volumes of electricity from Genesis Energy and Mighty River Power in the North Island. The contracts underpinning these swaps took effect on 1 January 2011.
On 1 June 2011, in a separate transaction, Meridian Energy’s Tekapo A and B assets were transferred to Genesis Energy.
These swaps change the shape of generation market share in New Zealand. Market activity suggests the objective of helping increase retail market competition is already being achieved to some degree.
Stratford peaker commissioningCommissioning of the Stratford peaker was a notable realisation of an investment decision for two reasons. First, the plant was a signal of the ongoing value investors see in plant that can back up New Zealand’s renewable generating capacity. Secondly, by being attached to a gas reservoir, the plant gives owner Contact Energy the capacity to use or sell gas during periods of tight supply or high cost. This gives flexibility
to thermal generating options in the New Zealand market and is thus a welcome addition and, in the case of the gas reservoir, an innovation for the New Zealand market.
The commissioning of the Stratford peaker was associated with a wholesale market pricing anomaly. On 8 February, the plant was undergoing commissioning testing (105MW from 0930 to 1530 hours). To cover the risk of this unit tripping when any other generation unit or HVDC tripped, the system operator added a fixed secondary risk of 105MW to the normal risk. By doing this, the Stratford peaker was assured of dispatch at 105MW for the commissioning test, and enough reserve was dispatched to cover the North Island risk. The requirement for more reserve meant that the North Island energy price reached $200–300/MWh, and the sustained instantaneous reserve price went up to $600/MWh for several hours during the testing.
This imposed significant cost on other participants – approximately $1.7 million. The Authority is progressing a project on asset testing and commissioning issues to consider reflecting additional reserves costs caused by commissioning testing on those doing the testing. This will incentivise them to procure additional reserve cover and test at times that do not have significant market impact.
Another grid-connected plant commissioned in 2010–11 was the 16MW (32–turbine) expansion of New Zealand Wind Farms’ Te Rere Hau wind farm.
Three further wind farms, all connected to local distribution networks (embedded generation), were commissioned in 2010–11: Meridian and WEL Network’s 68MW Te Uku wind farm, the 1MW Lulworth Wind scheme in Marlborough owned by Energy3 and the 36MW Mahinerangi wind farm in Otago owned by Trustpower.
Trustpower also commissioned a 9MW (embedded) diesel-fired peaking plant in Bream Bay in 2011.
32

Electricity market performance: 2010–2011 in reviewThe year to 31 October 2011
Grid operation, scheduling and dispatchUnplanned interruptions to supply have been relatively few in 2010 –11 in light of some major events that have tested system reliability. Planned interruptions, on the other hand, have been high by historical comparison because of the amount of transmission investment under way.
Interruptions have, however, been relatively extreme compared to the past. Overall grid reliability, measured in system minutes, breached regulated service quality thresholds in the year to June 2011, with interruptions of 15.2 system minutes compared to a threshold of 8.3 minutes.
Earthquakes in Christchurch caused significant damage to distribution networks and power losses as a result, but according to Transpower, damage to transmission equipment was minimal and “as crippling as these events were to the affected communities, none of the three major earthquake events caused major power system management issues and the system operator was able to continue with business as usual”.6
Approximately a third of the system minutes of interruptions in the June year 2011 were due to the Christchurch earthquakes. Once these are accounted for, grid reliability performance was much closer to the regulatory threshold (9.8 system minutes against the threshold of 8.3).
Severe storms were encountered during the week of 7–14 July, though there was no significant loss of service.
Big tests for the resilience of the transmission system were also encountered during August 2011 with a cold snap including snowfalls and thunder storms arriving on 15 August. The mixture of record peak demand (7,048.8MW) and snow and ice on lines caused significant outages of circuits and transformers across the lower North Island. For an hour and a half, electricity supply to Wellington city was reduced to a single 110kV circuit, rather than the usual four. Despite these stresses, grid reliability was better than planned.
System operation was affected during 2011 by interruptions to market dispatch systems. This included a failure of backup power supply during routine testing that interfered with optimal dispatch processes and affected data-gathering. System security was not compromised.
In addition, there was a proliferation of what are known as ‘high spring washer events’ – where constraints on the transmission grid result in substantially higher market prices than offered by generators.
33
Source: Transpower
Figure 28: System interruptions
45
40
35
30
25
20
15
10
5
0
Planned Unplanned Christchurch earthquake
2006 2008 20102007 2009 2011
Sys
tem
min
utes
6 Transpower (2011) System Operator: Annual Review and Assessment 2010–11, p. 7. See http://systemoperator.co.nz/f4342,60638177/SO-Annual-Review-2010-11.pdf.
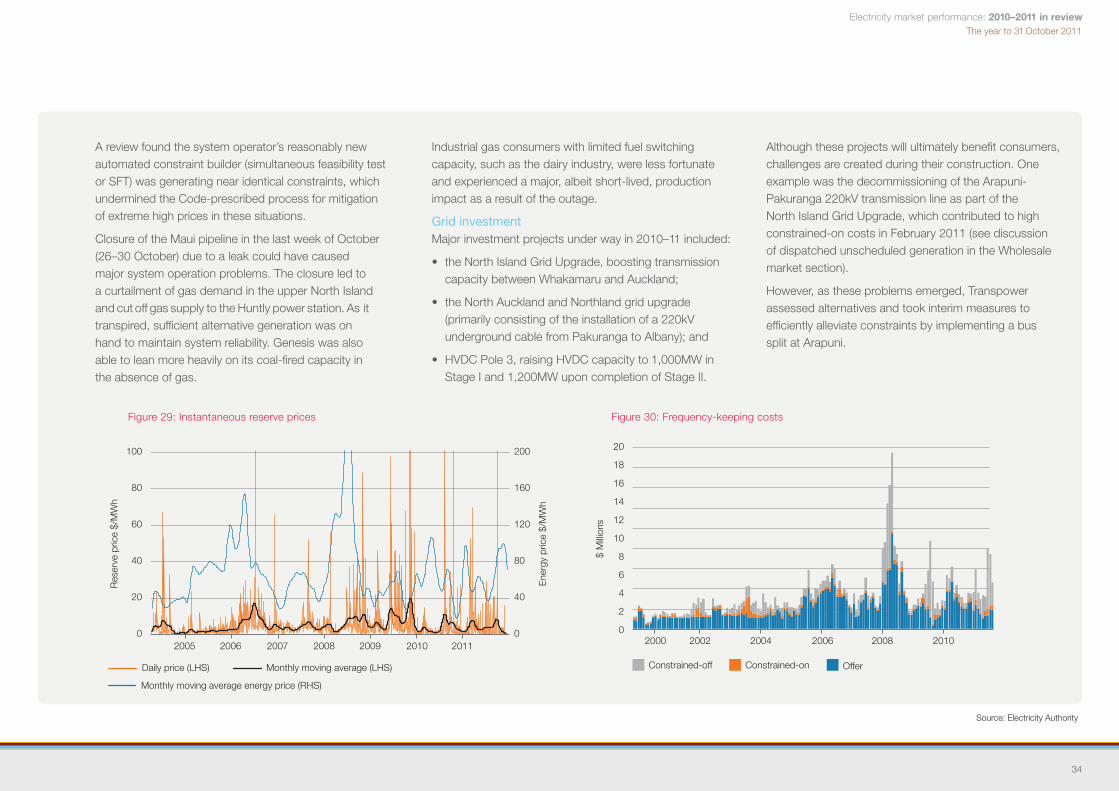
Electricity market performance: 2010–2011 in reviewThe year to 31 October 2011
A review found the system operator’s reasonably new automated constraint builder (simultaneous feasibility test or SFT) was generating near identical constraints, which undermined the Code-prescribed process for mitigation of extreme high prices in these situations.
Closure of the Maui pipeline in the last week of October (26–30 October) due to a leak could have caused major system operation problems. The closure led to a curtailment of gas demand in the upper North Island and cut off gas supply to the Huntly power station. As it transpired, sufficient alternative generation was on hand to maintain system reliability. Genesis was also able to lean more heavily on its coal-fired capacity in the absence of gas.
Industrial gas consumers with limited fuel switching capacity, such as the dairy industry, were less fortunate and experienced a major, albeit short-lived, production impact as a result of the outage.
Grid investmentMajor investment projects under way in 2010–11 included:
•theNorthIslandGridUpgrade,boostingtransmissioncapacity between Whakamaru and Auckland;
•theNorthAucklandandNorthlandgridupgrade(primarily consisting of the installation of a 220kV underground cable from Pakuranga to Albany); and
•HVDCPole3,raisingHVDCcapacityto1,000MWinStage I and 1,200MW upon completion of Stage II.
Although these projects will ultimately benefit consumers, challenges are created during their construction. One example was the decommissioning of the Arapuni-Pakuranga 220kV transmission line as part of the North Island Grid Upgrade, which contributed to high constrained-on costs in February 2011 (see discussion of dispatched unscheduled generation in the Wholesale market section).
However, as these problems emerged, Transpower assessed alternatives and took interim measures to efficiently alleviate constraints by implementing a bus split at Arapuni.
34
Figure 29: Instantaneous reserve prices
Source: Electricity Authority
Figure 30: Frequency-keeping costs
20
18
16
14
12
10
8
6
4
2
0
$ M
illion
s
2000 2002 2004 2006 2008 2010
Constrained-off Constrained-on Offer
100
80
60
40
20
02005 2006 2007 2008 2009 2010 2011
Res
erve
pric
e $/
MW
h
Daily price (LHS) Monthly moving average (LHS)
Monthly moving average energy price (RHS)
200
160
120
80
40
0
Ene
rgy
pric
e $/
MW
h

Electricity market performance: 2010–2011 in reviewThe year to 31 October 2011
The large cost of grid investment (around $500 million in the past 12 months) continues to prompt questions about how costs should be allocated, especially with respect to the costs of the HVDC that are currently charged to South Island generators.
The Transmission Pricing Advisory Group (TPAG) convened by the Authority worked on these issues during 2010–11 and undertook intensive analytical work to carefully consider any changes to existing methods. However, a consensus could not be reached by TPAG, and the issue is now with the Authority for a final decision.
HVDC flow constrained-off in final pricingDuring 2010–11, the system operator applied a constraint limiting the HVDC flow to zero if flow on the HVDC would otherwise be less than 30MW. The HVDC link cannot be operated at less than 30MW due to technical issues with discontinuous direct current.
This most often occurs briefly when the market dynamics are such that the HVDC link is in the process of reversing direction. If the constraint limiting the HVDC flow to zero falls at the start of a trading interval, it is picked up in final pricing. The constraint can then cause price separation in final pricing, even though the reversal was brief in real time. Applying the constraint in final pricing means that it
is in place for an entire trading period. This is not typically representative of the actual state of affairs during the half hour and does not provide a meaningful pricing signal for the coordination of resources or for investment.
This practice of applying the constraint in final pricing leads to a significant increase in price volatility and a reduction in the effectiveness of the proposed interisland FTR as a means of hedging against interisland price volatility. The system operator has agreed to investigate options for not applying the constraint in final pricing.
Source: Electricity Authority
35
Figure 31: Average frequency-keeping constrained price and energy price, North Island
700
600
500
400
300
200
100
0
Frequency-keeping price Energy price
Aug
11
Oct
11
Jul 1
1
Sep
11
Jun
11
May
11
Apr
11
Mar
11
Feb
11
Jan
11
Dec
10
Nov
10
Figure 32: August 2011 frequency-keeping costs breakdown by participant, North Island
8
7
6
5
4
3
2
1
0
Genesis – offer
Aug
11
Sep
11
Jul 1
1
Jun
11
May
11
Apr
11
Mar
11
Feb
11
Jan
11
Dec
10
Nov
10
Oct
11
$ M
illion
s
$/M
Wh
MRP – offer Genesis – constrained-on MRP – constrained-on

Electricity market performance: 2010–2011 in reviewThe year to 31 October 2011
Ancillary servicesCosts for ancillary services have risen in recent years, including in 2011, which is counter to trends in spot market prices and volumes.
Ancillary services such as frequency-keeping and instantaneous reserves are substitutes for normal electricity generation in the overall generation mix. As a rule of thumb, their prices should track those in the wholesale markets.
In principle, there should be some increasing costs to frequency-keeping and other ancillary services, given increasing amounts of wind in the generation mix. However, not all of the recent frequency-keeping cost increases can be explained by such fundamentals. Figure 31 shows how prices in the North Island for the constrained portion of frequency-keeping have been much higher than the energy price, and the reverse has occurred in the South Island. It also contrasts with instantaneous reserve prices, which have tracked wholesale market prices and have been comparatively low in 2010–11.
Incidents of high frequency-keeping costs have been one of the issues considered in depth by the Authority’s Market Performance Group in 2010–11. In August 2011, spikes in costs arose when a flaw in the frequency-keeper selection process was exposed by offers Genesis made in the spot energy market (see Figures 31 and 32). In simple terms, frequency-keeper selection (conducted in the market) is based on prices offered by a plant at the lower end of what might be
required to regulate system frequency. Generators who offer low to get selected (dispatched) by the system operator can also offer exceptionally high prices in the spot energy market for quantities that may also be needed (ie constrained on) to meet certain circumstances.
The selection process does not account for this risk, selecting a generator as ‘lowest cost’ even though it later turns out to be well above the lowest cost frequency-keeper.
The August event led to a modification in November to the frequency-keeper selection process to more robustly select the lowest-cost provider and improve competition. That modification is being progressed with the system operator.
The market for instantaneous reserves is not without its own anomalies. As discussed above (see page 15), the provision of instantaneous reserves in the North Island can dictate the amount of electricity that can be delivered into the North Island via the HVDC link.
36

Electricity market performance: 2010–2011 in reviewThe year to 31 October 2011
Figure 33 shows how high-priced fast instantaneous reserve (FIR, shown on the y axis) corresponds with periods when transfers of power via the HVDC link are limited. When power transfer is limited, this is reflected in different prices either side of the link, referred to as ‘price separation’ (shown on the x axis). The blue in the chart reflects data for 2011, and the red data is for 2008.
The restriction of HVDC transfer due to the cost of supporting reserves provides a possible mechanism for participants to exert some control over HVDC flows. A generator holding a significant portfolio of fast reserves in the receiving island can try to throttle the link by offering reserves at a high price.
This could have the effect of reducing HVDC transfers and increasing energy prices in the receiving island.
This is not a given. The profitability of this strategem would depend on the participant’s net position (purchases versus sales) in the receiving island reserves and energy markets. It does, however, go to show that competition in smaller market segments, such as in the instantaneous reserves market, can have a reasonably large impact on overall market performance. Source: Electricity Authority
37
100
90
80
70
60
50
40
30
20
10
0
-100 -20-60 20 80-80 0 60-40 40 100R
ecei
ving
end
FIR
pric
e $/
MW
h
Price separation (HAY-BEN) $/MWh
Figure 33: Price separation and reserve prices
Fast instantaneous reserve prices and price difference between HAY and BEN
2008 data 2011 data

Electricity market performance: 2010–2011 in reviewNovember 2011 and beyond
At year end, the electricity market looks rather different than 12 months earlier. Thousands of consumers are now with other retail providers. On some measures, Genesis has overtaken Contact as the country’s largest retailer. This appears to be due, in part, to the asset swaps that took place during 2010 –11, which rearranged the location of generation ownership and added incentives for retailers to look beyond their home markets for retail customers. The magnitude of changes that took place through asset swaps has changed the face of the market in ways that normally would have taken years.
Measures of retail market share do, however, tell different stories depending on how subsidiary companies are treated, and this is more than a matter of measurement. Subsidiaries of major generators appear to be proliferating and expanding their market shares. This dynamic is probably being influenced by the competitive pressure applied by existing and prospective independent and niche players in the retail market. Can retail competition and innovation thrive in a market where many of the retailers are subsidiaries of a handful of companies? Powershop’s unique business model and ranking by Deloitte as the fastest-growing business in New Zealand suggests that they can.
Only time will tell whether this is of long-run benefit to consumers, but the additional competition and choice in retail markets is a step in the right direction.
Concerns have been raised about the usefulness of high switching rates and the operational costs imposed on providers. These concerns are reasonable in some respects, but it can also be expected that the competitive pressure being brought to bear will deliver gains to consumers now and in future as providers seek new and innovative ways to attract customers.
It may be that a dynamic market is a noisy market where only some of the people are pleased some of the time. Over the long term, those that are increasingly pleased should be consumers.
The long view is that market structure has changed for the better in terms of improving efficiency and competition.
Source: Electricity Authority
November 2011 and beyond
Per
cent
of I
CP
s
38
Figure 34: Retail market share
30
25
20
15
10
5
0
Jan
08
Oct
11
Apr
11
Oct
10
Jul 1
0
Apr
10
Jan
10
Oct
09
Apr
09
Jan
09
Jul 0
8
Apr
08
Jul 1
1
Jan
11
Oct
08
Jul 0
9
Contact Energy Genesis Energy Genesis Energy Online
Mercury Energy Meridian Powershop TrustPower

Electricity market performance: 2010–2011 in reviewNovember 2011 and beyond
Supply has been secure, with no structural risks to system reliability arising since the 2008 drought. Extremely slow demand growth and expanding transmission capacity means a positive outlook for reliability in the absence of a dry year.
Although security of supply is not a major issue in the near term, pressures could re-emerge. A dry year could occur at any time, so complacency is risky. In addition, the system operator’s 2011 annual security assessment concluded that, while desired energy and capacity margins would be exceeded over the next 2 years, without the addition of new generation, this may not be the case by 2013. Fortunately, a long pipeline of consented generation projects suggests reasonably robust development activity in the future.
However, there were enough anomalies in 2010 –11 for consumers to doubt the improvements. In that context, it is important to bear in mind that:
•improvementsinmarketperformanceareunlikelytooccur in an orchestrated and orderly fashion;
•itisincumbentontheAuthoritynottotryandresolveissues that market participants can resolve for themselves – wherever possible the Authority should be the facilitator, not the arbitrator; and
•anomalieswillalwaysarise,asthatisthenatureoftheelectricity system.
Continued competitive pressure and greater transparency in the sector can be expected going forward.
The planned introduction of FTRs will be a step towards facilitating the management of locational price risk and improved competition. The initial design of the scheme is for limited application at two nodes, Benmore and Otahuhu, which correspond to the reference nodes used in the ASX NZ electricity futures market. Compared with a nationwide system of FTRs, this incremental approach will reduce adjustment costs associated with introducing a new market instrument. The bulk of locational price risk will, however, be covered by these two locations because interisland risk tends to dominate intraisland risk, and intraisland risk is dominated by price separation between the lower and upper parts of the North Island.
Grid capacity is perhaps the only structural aspect of the market for which progress has not been as great as was envisioned on 1 November 2010. A range of generally unavoidable matters has contributed to delays. Nonetheless, delays in grid projects and in HVDC Pole 3 bring uncertainty to the market.
Attention also needs to be paid to the ancillary services market and the interaction between reliability, efficiency and competition in this part of the market. This is especially so for frequency-keeping where initiatives that have been in the pipeline for some years need to be accelerated to meet system reliability requirements for the future without unnecessarily driving up costs to consumers.
A range of initiatives will be pursued or considered, including multiple frequency-keepers and implementation of an automatic generation control system, moderating performance requirements for frequency-keeping and allowing for services to be traded across the North and South Islands (pending commissioning of HVDC Pole 3).
Future work across all aspects of the market includes:
•areviewofprovisionsaroundundesirable trading situations;
•completionofadatawarehouseproject,which will improve access to market information;
•annualmarketperformanceassessments (of which this is the first non-technical version); and
•continuedanalysisandreportingofunusualoranomalous events.
In addition, some programmes put in place during 2010–11 will be reviewed for their efficiency and the extent to which they contribute to reliability and enhanced competition. This includes reviewing the What’s My Number campaign to see what might be done to increase consumer value from the consumer switching fund.
39

Electricity market performance: 2010–2011 in review
5050 1,0001,000
Sale GWh Purchase GWh
5,0005,000
November 2011 and beyond
Figure 35: Sale and purchase of energy by company and location, year to 31 October 2011
Source: Electricity Authority
Contact Energy Genesis Energy Meridian Mighty River Power Trustpower
40

Electricity market performance: 2010–2011 in reviewElectricity market performance: 2010–2011 in review
In addition, the Authority's Market Performance Group provides other industry information including:
The SOO presents detailed forecasts of electricity demand and supply through to the year 2040, modelled on five prospective scenarios.
41
TheCentralisedDataset is a compilation of half-hourly meter data covering HVDC flows, active and reactive power by GXP and generation by GIP, along with pricing data, including bids and offers, reserves and final prices. It also provides weekly hydro-inflow and daily lake-level data, as well as transmission network information, such as load-flow models, line diagrams, asset outages, generation assets and GXP characteristics.
External interests can also access a range of the Authority’s analytical tools and the information they impart.
Other information
EMI, the electricity market information interface, allows a range of users to access the Authority’s mathematical programming models and other data visualisation tools. The initial release of EMI includes the vectorised scheduling, pricing and dispatch model (vSPD) which replicates the scheduling, pricing and dispatch software used by the industry. EMI allows users to easily navigate through the large volume of data that underpins the model and undertake a wide range of ‘what if’ experiments to better understand market outcomes.
EMI also acts as a front end for the generation expansion model (GEM), a model of the New Zealand generation sector. GEM projects the construction of new generation over coming decades and simulates outcomes in terms of dispatch, costs and emissions. It can be used to assist decisions regarding investments in transmission or to assess implications of factors such as technology change, carbon pricing or developments in market policy.
Adatawarehouse being developed for use by participants and other interested parties houses disparate data sets covering long time periods. It is intended that this will allow publication and downloading of data and web-based graphical reporting of non-confidential data to market participants and other interested parties. At present, the data warehouse houses registry monthly reporting, final pricing data and the centralised dataset (metering). Future functionality will include registry switching, hedge market, clearing manager and hydrology data.
More specialised information for industry planners and investors is available in the biennial Statement of Opportunities (SOO) most recently released by the Electricity Commission in September 2010, and the Authority’s Centralised Dataset, which provides metering, pricing, hydrology and network configuration data.

Electricity market performance: 2010–2011 in review

Contact information
Electricity AuthorityTe Mana Hiko
Level 7ASB Bank Tower
2 Hunter StreetPO Box 10041
Wellington 6143New Zealand
TEL + 64 4 460 8860FAX + 64 4 460 8879
www.ea.govt.nz
Published December 2011


