FELEA I.*, RANCOV N. *, CHIREA V. *, BOJA I.**, ȘINCA A.**, ALBUȚ D.*, FELEA A.I.* *University of Oradea, Universităţii no.1, Oradea,
**S.C. FDEE Electrica Distribution Transilvania Nord S.A - SDEE Oradea [email protected]
Abstract - The paper is about de level of electricity
quality in the power network and at power consumers
from an urban area. The analysis was done at the
request of local electricity company. After highlighting
the importance of preoccupations, electricity non-
quality effects and regulatory framework, in the paper
is presented the working methodology and results
synthesis. The last part of the paper contains the
conclusions of the study.
Keywords: electricity, quality, power consumers, effects.
1. INTRODUCTION
The importance of power supply service assurance is now well known and, as a result, very clearly regulated at European [1, 2, 3] and national [4,5] level. A well-known component of power supply service is the electricity quality and the other is the continuity of this service. The definition, characterization through indicators and the investigation of electricity non-quality effects are major concerns of researchers in electric power field, both fundamentally (theoretical) and operationally, of phenomenon reality in power networks [6 ÷ 14]. Effective analysis of phenomenon span and electricity non-quality effects in distribution power networks (DPN) is imposed on the one hand by the regulatory constraints [1 ÷ 5] and on the other hand by network operators interest to optiomize the electricity transport, distribution and usage processes.
The paper continues the preoccupation of authors based on electricity quality theme [15 ÷ 20] basically being a synthesis of results obtained from investigation of two essential aspects which characterize electricity quality, respectively harmonic regime(HR) and asymmetrical regime(ER) in DPN and at electricity consumers level, consumers from Oradea city. The analysis have a strictly applicative character and was performed at SDEE Oradea request, based on the service provider contract no. 34264/2014, entitled “Characterization of electricity quality at power consumers level from Oradea city”.
In accordance with the objectives agreed with the beneficiary, analysis was conducted on power consumers suspected that generates harmonic and/or asymmetrical regime. It was decided together with the contract beneficiary that 2 industrial consumers, 7 residential and urban public consumers, one service-type consumer and
one local public transportation-type consumer should be analyzed, as highlighted on third part of the paper.
An essential objective assumed in analysis was the establishment of degree in which the HR is transmitted through electric transformers from the HR source (the consumer), in DPN. For this if the power consumer point was equipped with measurement cell then the analysis was performed both on low voltage (LV) and medium-voltage (MV).
When performing the investigation (measurements, evaluations, and interpretations) we took into consideration the stipulations of internal regulations so:
• According to Performance Standard for Power
Distribution Service, the most important factor to characterize HR is asymmetry or imbalance coefficient, determined by negative sequence component ( ), defined as the ratio between the mean of effective values calculated for ten minutes of negative component and the mean of effective values calculates for ten minutes of positive component, expressed in percentages;
• According to the same Standard, the voltage distortion factor at LV and MV must be smaller or equal than 8%, and in normal operation conditions, harmonic voltages at separation points in DPN, at LV and MV, cannot exceed the limits indicated in table 1 for 95% during a week.
Table 1 –Effective values of voltage harmonics [5]
Odd harmonics (% from fundamental) Even harmonics
(% from
fundamental) NOT multiple of 3 Multiple of 3
Rank Threshold Rank Threshold Rank Threshold
5 6% 3 5% 2 2% 7 5% 9 1,5% 4 1%
11 3,5% 15 și 21 0,5% 6 la 24 0,5% 13 3% 17 2%
19,23,25 1,5% 19,23,25 1,5%
Without being normalized in field literature, in practice,
is recommended that THDI should not exceed 20%. 2. METHODOLOGY
For each consumer/power consumption point where
the analysis was done, in the detailed report have been
JOURNAL OF SUSTAINABLE ENERGY VOL. 6, NO. 4, DECEMBER, 2015
shown the following characterization elements: • Short description: The activity that takes place there,
connection scheme to power network, the features of electrical transformers, measurement points;
• The recordings; • The values of characterization indicators of harmonic
regime (HR) and asymmetrical regime (AR). Of all indicators/coefficients defined and used in field
literature [1÷8], considering internal regulations and the interest of beneficiary, for this case the following coefficients were used:
00
I
IK d
ns = (asymmetry coefficient for current); (1)
max
min
U
UrU = (asymmetry ratio for voltage); (2)
max
min
I
IrI = ( asymmetry ratio for current); (3)
= (total harmonic distortion for current); (4)
= (total harmonic distortion for voltage); (5)
= · (imbalance
coefficient for current); (6)
It is calculated the asymmetry coefficient of current kns2, called in Performance Standard for Power
Distribution Service as asymmetry or imbalance coefficient (kn).
= = (7)
For this purpose, it is calculated phasor values and
then effective values of the two components [21].
(8)
In relations (8) it will be replaced from measurements
the following:
(9)
From relations (8) and (9) is obtained [21]:
(10)
where: Id – effective value of current direct sequence component; I0 – effective value of current homopolar sequence component; Umin – minimum of voltage effective value; Umax – maximum of voltage effective value; Imin – minimum of current effective value; Imax – maximum of current effective value; Iν – current effective value at “ν” rank harmonic; I1 – current effective value of fundamental harmonic; Uν – voltage effective value at “ν” rank harmonic; U1 – voltage effective value of fundamental harmonic; (IR, IS, IT) – current effective values on the three phases (R, S, T); Imed – the mean of current effective values Ii – effective value of current reverse sequence component;
Where recordings were made both at LV and MV indicators listed above are determined at both voltage levels. We mention that for the same ETS/measuring point, the recordings on LV and MV were made simultaneous.
To get the recordings we used two Chauvin Arnoux CA 8334B power analyzers(PA). Connection scheme of PA in DPN are shown in figure 1.
Fig. 1 – Connection scheme of PA
JOURNAL OF SUSTAINABLE ENERGY VOL. 6, NO. 4, DECEMBER, 2015
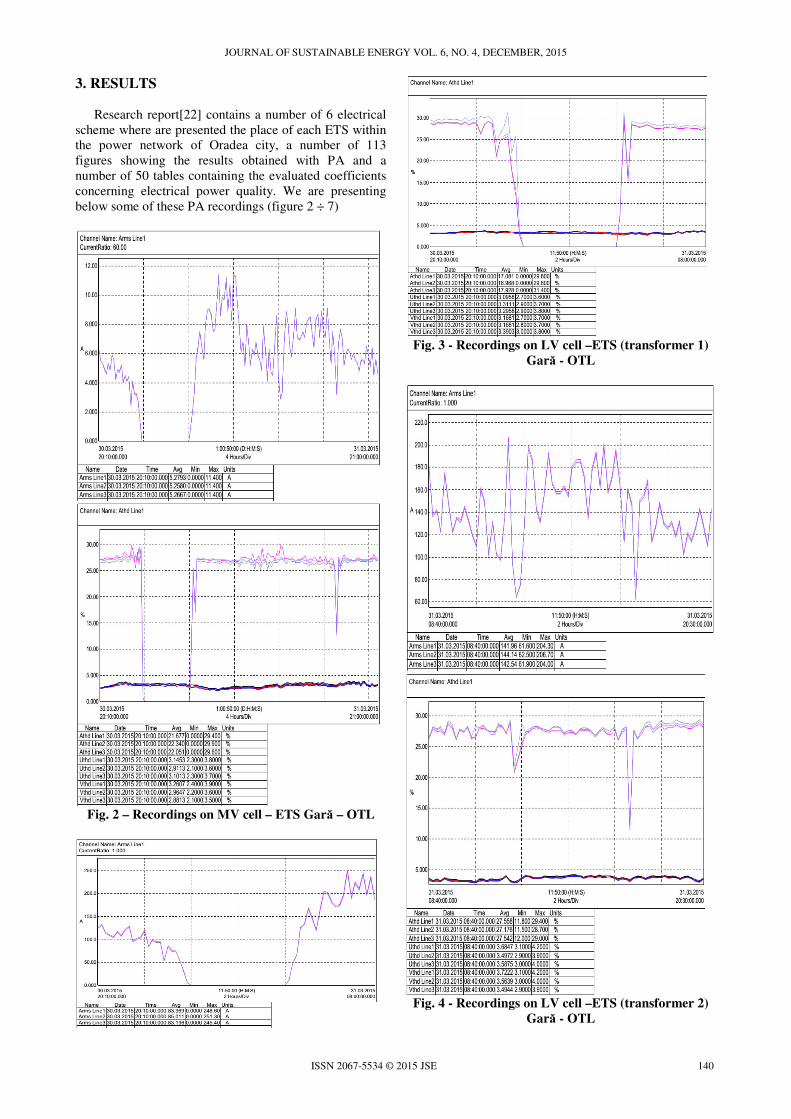
Research report[22] contains a number of 6 electrical scheme where are presented the place of each ETS within the power network of Oradea city, a number of 113 figures showing the results obtained with PA and a number of 50 tables containing the evaluated coefficients concerning electrical power quality. We are presenting below some of these PA recordings (figure 2 ÷ 7)
Fig. 2 – Recordings on MV cell – ETS Gară – OTL
Fig. 3 - Recordings on LV cell –ETS (transformer 1)
Gară - OTL
Fig. 4 - Recordings on LV cell –ETS (transformer 2)
Gară - OTL
JOURNAL OF SUSTAINABLE ENERGY VOL. 6, NO. 4, DECEMBER, 2015
Fig. 7- Recordings on LV cell - ETS (transformer 2)
Salca - OTL
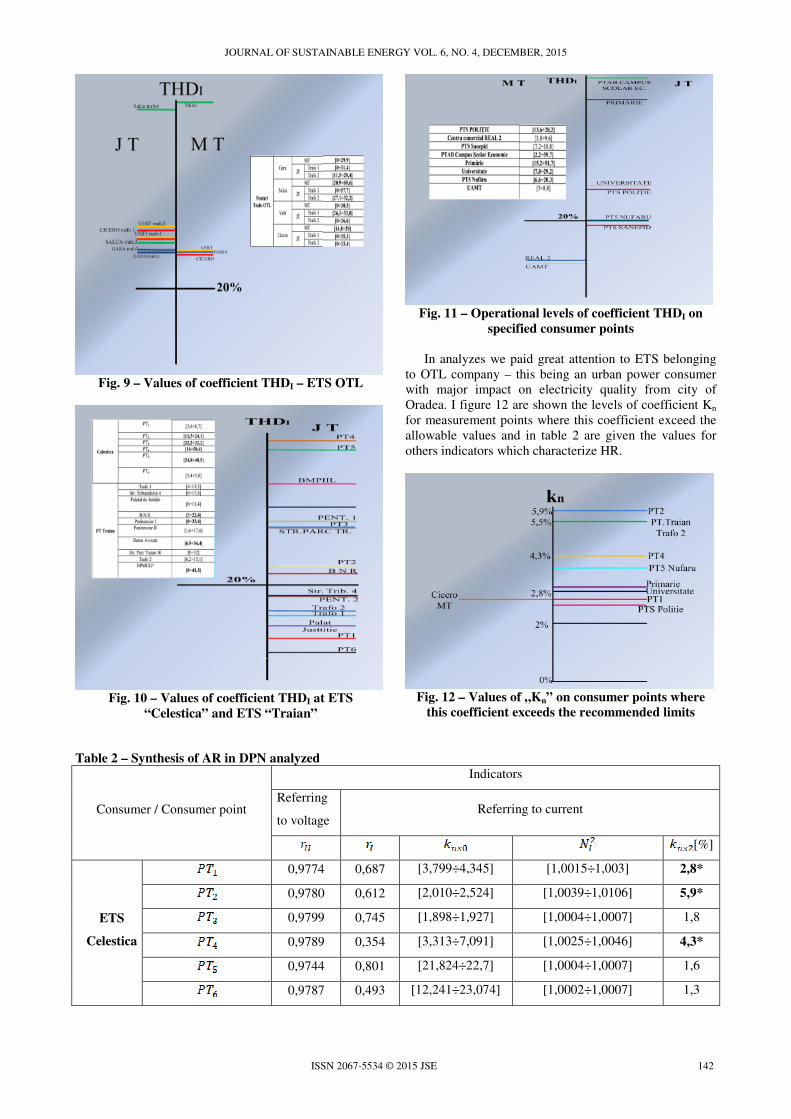
In figures 8 and 9 are presented the indicators used to characterize HR(THDU, THDI) at LV and MV of ETS under OTL company management and in figures 10 and 11 are shown the values of THDI from the others ETS/consumer points analyzed.
Fig. 8 – Values of coefficient THDU – ETS OTL
JOURNAL OF SUSTAINABLE ENERGY VOL. 6, NO. 4, DECEMBER, 2015
Fig. 11 – Operational levels of coefficient THDI on
specified consumer points
In analyzes we paid great attention to ETS belonging
to OTL company – this being an urban power consumer with major impact on electricity quality from city of Oradea. I figure 12 are shown the levels of coefficient Kn for measurement points where this coefficient exceed the allowable values and in table 2 are given the values for others indicators which characterize HR.
Fig. 12 – Values of „Kn” on consumer points where
this coefficient exceeds the recommended limits
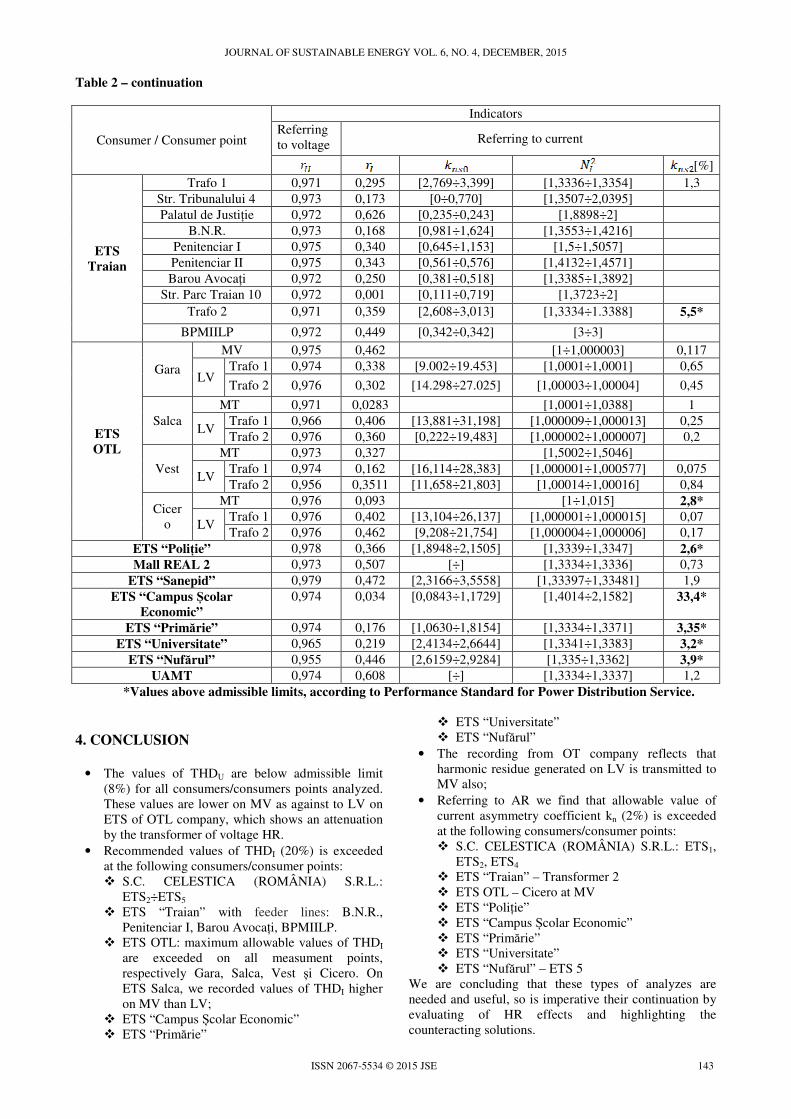
Table 2 – Synthesis of AR in DPN analyzed
Consumer / Consumer point
Indicators
Referring
to voltage Referring to current
[%]
ETS
Celestica
0,9774 0,687 [3,799÷4,345] [1,0015÷1,003] 2,8*
0,9780 0,612 [2,010÷2,524] [1,0039÷1,0106] 5,9*
0,9799 0,745 [1,898÷1,927] [1,0004÷1,0007] 1,8
0,9789 0,354 [3,313÷7,091] [1,0025÷1,0046] 4,3*
0,9744 0,801 [21,824÷22,7] [1,0004÷1,0007] 1,6
0,9787 0,493 [12,241÷23,074] [1,0002÷1,0007] 1,3
JOURNAL OF SUSTAINABLE ENERGY VOL. 6, NO. 4, DECEMBER, 2015
UAMT 0,974 0,608 [÷] [1,3334÷1,3337] 1,2 *Values above admissible limits, according to Performance Standard for Power Distribution Service.
4. CONCLUSION
• The values of THDU are below admissible limit
(8%) for all consumers/consumers points analyzed. These values are lower on MV as against to LV on ETS of OTL company, which shows an attenuation by the transformer of voltage HR.
• Recommended values of THDI (20%) is exceeded at the following consumers/consumer points: � S.C. CELESTICA (ROMÂNIA) S.R.L.:
ETS2÷ETS5 � ETS “Traian” with feeder lines: B.N.R.,
Penitenciar I, Barou Avocați, BPMIILP. � ETS OTL: maximum allowable values of THDI
are exceeded on all measument points, respectively Gara, Salca, Vest și Cicero. On ETS Salca, we recorded values of THDI higher on MV than LV;
� ETS “Campus Școlar Economic” � ETS “Primărie”
� ETS “Universitate” � ETS “Nufărul”
• The recording from OT company reflects that harmonic residue generated on LV is transmitted to MV also;
• Referring to AR we find that allowable value of current asymmetry coefficient kn (2%) is exceeded at the following consumers/consumer points: � S.C. CELESTICA (ROMÂNIA) S.R.L.: ETS1,
We are concluding that these types of analyzes are needed and useful, so is imperative their continuation by evaluating of HR effects and highlighting the counteracting solutions.
JOURNAL OF SUSTAINABLE ENERGY VOL. 6, NO. 4, DECEMBER, 2015
Assessment of emission limits for distorting loads in MV
and HV power systems. [2]. *** - IEC 1000-4-7/1991- “Electromagnetic
compatibility (EMC) Part4: testing and measurement
techniques, Section 7: General guide on harmonics and
interarmonics measurements and instrumentation, for
power pupply systems and equipment connected thereto”. [3]. *** - EN50160 standard – „Voltage Characteristics of
Electricity Supplied bz Public Distribution Systems”, European Standard, 2000.
[4]. *** - Codul tehnic al rețelelor electrice de distribuție, ANRE, București 2008.
[5]. *** - Standardul de performanță pentru serviciile de furnizare a energiei electrice, ANRE, București, 2008.
[6]. Arie A. Arie, Neguş C., Golovanov C., Golovanov N.- “ Poluarea cu armonici a sistemelor electroenergetice funcţionând în regim permanent simetric“, Editura Academiei Române, Bucureşti 1994.
[7]. Albert H. , Florea I. - “ Alimentarea cu energie electrică a întreprinderilor
[8]. Chindriş M., Sudria I., Andreu A.–“Poluarea armonică a reţelelor electrice industriale” Editura Mediamira, Cluj 1999.
[9]. Blume D. s.a. – „Voltage Quality in Electrical Power Systems”, PO/P0036, Hardback 2001, ISBN 0 – 85296-975-9
[10]. Bogietti A., Ferraris P. , Lazzari M.,And Pastorelli M. –“Iron loss measurements with inverter supply: A first discussion to define a standard methodology”, IEEE Trans. Magnetics , vol.31.no.6,pp.4006-4008,Nov.1995
[11]. Buta A. , Ivaşcu C., Milea L. -“Efectele regimului deformant asupra instalaţiilor şi aparatelor electrice din sţiile de m.t/î.t ale sistemului energetic naţional” Revista Energetica, XXXVI, sept. 1988.
[12]. Carbone R, De Rosa F. ş.a. – „A New Approach of Computation of Harmonics and Interharmonics Produced
by Line-Commutated AC/DC/AC”, IEEE Transactions on Power Delivery, vol.20, nr. 1, 2005
[13]. S. Djurović, D.S. Vilchis-Rodriguez and A.C. Smith – Supply Induced Interharmonics Effects in Wound Rotor and Doubly-Fed Induction Generators, 2015;
[14]. A. Milicua, G. Abad and M.A.R. Vidal – Online Reference Limitation Method of Shunt-Connected Converters to the Grid to Avoid Exceeding Votage and Current Limits Under Unbalanced Operation – Part I: Theory, 2015;
[15]. Felea,I., Dale,E. -“Metodologie de evaluare a impactului regimului deformant şi nesimetric asupra fiabilităţii transformatoarelor electrice”, Analele Universităţii din Oradea, Fascicola de Energetică, 1996.
[16]. Felea I., E. Dale, „Analysis Methodology of the Deformed and Non-Symmetrical Functioning Regimes Impact on the Electric Equipment Reliabity”, World Energy System, International Journa, vol. 4, no. 2. oct. Toronto, 2000.
[17]. Felea I. , E. Dale, C. Secui, „The Evaluation of Damages Caused by the Existence of Nonsymmetrical and Deforming Regimes”, The International power Quality Conference, Rosemont, USA, 2001
[18]. Felea,I., Dale,E. -“Metodologie de evaluare a impactului regimului deformant şi nesimetric asupra fiabilităţii transformatoarelor electrice”, Analele Universităţii din Oradea, Fascicola de Energetică, 1996
[19]. Felea I, Coroiu N., Dale E., „Impactul calităţii energiei electrice asupra performanţelor reţelelor electrice”, CNE-FOREN, 2006
[20]. Felea I., Dale E., Rancov E., Ditzac S., Secui C., Albuț
Dana D., Barla E., – “Efecte ale regimului deformant”, Editura Universității din Oradea, 2009.
[21]. Mocanu C.I. - Teoria Circuitelor Electrice, Editura Didactică și Pedagogică București 1979.
[22]. Felea I, ș.a. - Identificarea și caracterizarea poluatorilor cu regim deformant și nesimetric în rețeaua SDEE Oradea, Raport la Contractul de Cercetare nr. 34264/2014, Universitatea din Oradea, 2015.