Electricity sector transformation and the expected impact of Climate Change mitigation measures 26 September 2018 Mandy Rambharos Climate Change and Sustainable Development Eskom Holdings SOC Ltd
Transcript
Electricity sector transformation
and the expected impact of
Climate Change mitigation
measures
26 September 2018
Mandy Rambharos
Climate Change and Sustainable Development
Eskom Holdings SOC Ltd
2
Overview
Eskom context
Economic Impact
Greenhouse Gas emissions reduction commitments
Social Impact and Eskom successes to leverage
3
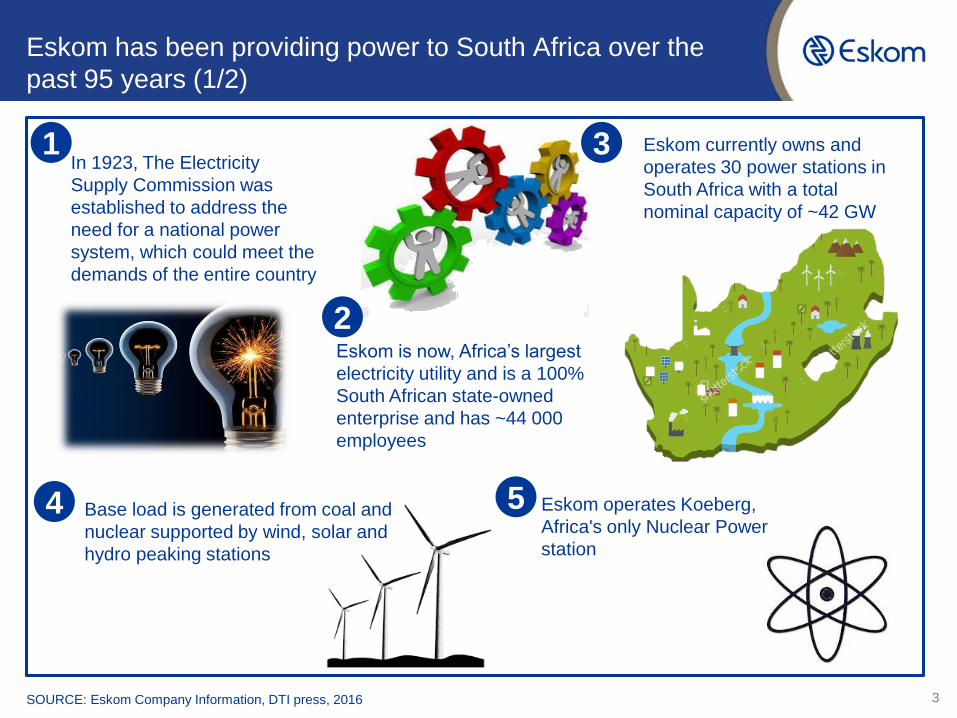
Eskom has been providing power to South Africa over the
past 95 years (1/2)
In 1923, The Electricity
Supply Commission was
established to address the
need for a national power
system, which could meet the
demands of the entire country
Eskom is now, Africa’s largest
electricity utility and is a 100%
South African state-owned
enterprise and has ~44 000
employees
Eskom currently owns and
operates 30 power stations in
South Africa with a total
nominal capacity of ~42 GW
Base load is generated from coal and
nuclear supported by wind, solar and
hydro peaking stations
Eskom operates Koeberg,
Africa's only Nuclear Power
station
1
2
3
54
SOURCE: Eskom Company Information, DTI press, 2016
4
Eskom has been providing power to South Africa over the past
95 years (2/2)
Eskom generates
approximately 95% of the
electricity used in South
Africa
Eskom also supplies approximately
45% of the electricity used in Africa
predominantly in the Southern African
Development Community (SADC)
region
10.1GW of new generation
capacity being built
including Kusile, Medupi,
and Ingula
SA's first power stations were well
advanced for their time, but small by
today's standards with sets of 33 MW
and later 60 MW
In 1962, the first "big" sets, 100 MW and 125
MW, were commissioned.
This eventually led to the present 600 MW and
800 MW sets, which are among the largest and
technologically most advanced in the world
6
9
8
7
10
5
Nearly all coal capacity is found in one area of the country
Limpo
po
Mpumala
nga
Kwazulu-
Natal
Eastern
Cape
Western
Cape
Northern
Cape
North West
Free
State
Gauteng
12
345
67
8
9
10Arnot – 2,100MW1
2
3
4
5
6
7
8
9
10
Duvha – 3,00MW
Hendrina – 2,000MW
Kendal – 4,116MW
Kriel – 3,000MW
Lethabo – 3,708MW
Majuba – 4,110MW
Matimba – 3,990MW
Matla – 3,600MW
Tutuka – 3,654MW
Base load stations
Eskom coal
station
Cape Town
Johannesburg
15
14
New Build
stations
14 Medupi
15 Kusile
New build stations
11 Camden – 1,600MW
12 Grootvlei– 1,200MW
13
Komati – 1,000MW
11
12
13
1
2
3
4
1
2
4
3
Acacia 171 MW
Port Rex 171 MW
Ankerlig 592 MW
Gourikwa 444MW
1
1 Klipheuwel Windfarm
3.2MW
Peak demand stations
Renewable energy
Renewable Energy
Peaking Stations
Nuclear station
Nuclear Power Station
Koeberg – 1,930MW
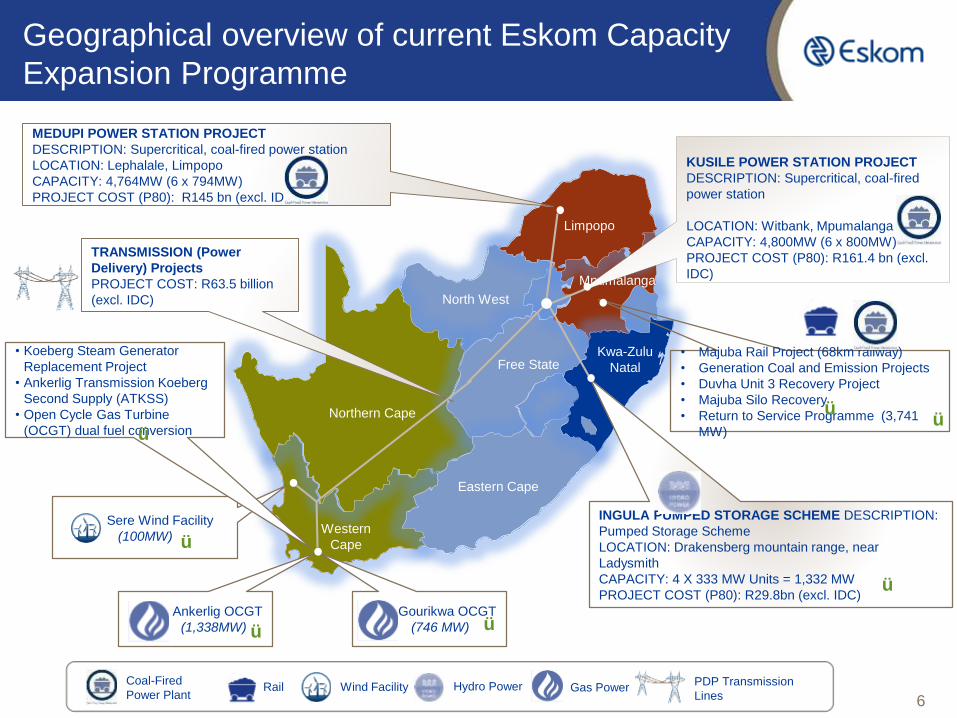
Geographical overview of current Eskom Capacity
Expansion Programme
Limpopo
Kwa-Zulu
Natal
Mpumalanga
MEDUPI POWER STATION PROJECT
DESCRIPTION: Supercritical, coal-fired power station
LOCATION: Lephalale, Limpopo
CAPACITY: 4,764MW (6 x 794MW)
PROJECT COST (P80): R145 bn (excl. IDC)
KUSILE POWER STATION PROJECT
DESCRIPTION: Supercritical, coal-fired
power station
LOCATION: Witbank, Mpumalanga
CAPACITY: 4,800MW (6 x 800MW)
PROJECT COST (P80): R161.4 bn (excl.
IDC)
INGULA PUMPED STORAGE SCHEME DESCRIPTION:
Pumped Storage Scheme
LOCATION: Drakensberg mountain range, near
Ladysmith
CAPACITY: 4 X 333 MW Units = 1,332 MW
PROJECT COST (P80): R29.8bn (excl. IDC)
Gourikwa OCGT
(746 MW)
Western
Cape
Northern Cape
Eastern Cape
North West
• Majuba Rail Project (68km railway)
• Generation Coal and Emission Projects
• Duvha Unit 3 Recovery Project
• Majuba Silo Recovery
• Return to Service Programme (3,741
MW)
Wind Facility Hydro PowerCoal-Fired
Power PlantRail Gas Power
Ankerlig OCGT
(1,338MW)
Sere Wind Facility
(100MW)
TRANSMISSION (Power
Delivery) Projects
PROJECT COST: R63.5 billion
(excl. IDC)
Free State
PDP Transmission
Lines
• Koeberg Steam Generator
Replacement Project
• Ankerlig Transmission Koeberg
Second Supply (ATKSS)
• Open Cycle Gas Turbine
(OCGT) dual fuel conversion
üü
ü
ü ü
ü
ü
6
7
Over the past 12 years, since 2004/05, the build programme has
had significant impact
R346 bn
Spent to date
10 750 MW Additional capacity
23 Generation & 48 Power
Delivery high priority projects /
schemes in execution &
supported by the business
~ 50 projects in development
Permanent & fixed term
employees grown from
~1000 at inception to
2001 in 2017 7 271 KM Transmission lines built
35 390 MVASubstation capacity
commissioned
R115 bn local content
of R190 bn(contracted value)
~ 43 000
Jobs created at peak
of construction
(employees &
contractors)
Completed build
projects:
• OCGT & Gas 1
(2084 MW)
• Return to Service
(3741 MW)
• Arnot capacity
increase (283 MW)
• Sere wind farm
(100 MW)
• Ingula Pumped
Storage Scheme
(1332 MW)
• Medupi & Kusile
(3182 MW)
• Koeberg U2 (30 MW)
Supporting project
management capabilities…
by creating processes,
systems, methodologies,
tools & structures
Improved oversight,
assurance & contract
management ability
Safety performance improved
from 1.08 LTIR in 2005 to 0.15
LTIR in 2017
Fatalities reduced from 9
occurrences in 2009 to 2 in 2017
(combined contractor & employee
performance)
R510 bn
In value of projects
in execution (ERA)
Capacity increase
8
Mitig
ation
Ap
pro
ach
Benchmarks and PDD range set
Assessment of Mitigation Potential for all sectors (Sectoral Emissions
Targets)
Pilot Carbon Budgets (2016-2020) Phase 2 methodology being discussed
Mandatory requirement for Pollution Prevention Plans and GHG reporting
Carbon Tax Bill published for comment
1
2
3
4
5
South Africa’s Mitigation Approach
Dra
ft C
C A
ct
Source: DoE
The IRP provides for further diversification – to 2030
10
Proposals to define diversification linked
opportunities (1 of 2)
• Aligned government policy on national GHG emissions aspirations and signals
for policy certainty.
• Aligned government policy on key technologies to encourage localisation and
job creation.
– Identifying opportunities for increase in local PV suppliers including
Operation and Maintenance skills
– Local PV panel assembly, inverter manufacturing, PV panel testing and
assurance facility (if barriers to market entry for international products
increase)
– Identifying jobs related to Vanadium, Manganese & Lithium mining/
Smelters for battery Storage and EV batteries
– Opportunities for localization through new charging station deployment
and associated businesses (kiosks, coffee shops,etc. around them).
– Gas pipeline infrastructure for imports, gas distribution infrastructure and
O&M.
11
• Identification of retraining opportunities
– Further opportunities for skills development and employment to support
digitalization of power industry which could result in more efficient plant
operation
• Alternative uses and beneficiation of coal could contribute to the mitigation of
losses in the mining sector from reduction of coal use for local electricity
production.
Proposals to define diversification linked
opportunities (2 of 2)
• Identification and support for appropriate implementing
agencies/mechanisms, with clear timeframes and
performance metrics.
• Identification and support for vulnerable communities
and municipalities
• Allocation of low/non carbon emitting technologies to
Eskom to maximise on existing sites and infrastructure
12
Eskom successes and skills base can be leveraged
in the future
New BuildSupercritical technology in Medupi and Kusile delivers approximately 30% less CO2 per MWh of
electricity produced
Integrated
demand
management
Integrated demand management (236.9 MW evening peak capacity in 2016/17) and internal
energy efficiency (6 GWh in 2016/17). Supported by a skills base to deliver energy audits, smart
metering/reporting, energy management solutions, design and testing of equipment, roll out of
CFLs (4 765 921 bulbs installed between 2015/16 and 2016/17), project accreditation for
carbon emission reductions
Partnerships
Track record for in-house and partnership research, technology development and demonstration –
addressing all energy sources (coal, nuclear, gas and hydro) including renewables (resource
maps/profiles, wind and solar technology testing), batteries and electric vehicles incl. charging
infrastructure
Collaboration
with IPP’s
Operational experience with grid integration and grid management ( including 4779MW of
operational IPP capacity (31 March 2018))
Track record for economic transformation and community development, from direct “Corporate
Social Investment” in schools and mobile clinics to supplier development and localisation, including
the Contractor Academy and flagship projects (Small Business Development Expo and Eskom
Expo for Young Scientists)
Transformation
Eskom provides ongoing support to the Government Climate Change negotiation team and is still
recognized regionally and internationally for its sustainability endeavors. Sustainability