16
C ALIFO R N IA EN ER G Y C OM MISSION C alifornia Electricity Issues W illiam J. K eese Chairm an C alifornia E nergy C om m ission A pril 5, 2001 N ationalG overnor’sAssociation
| Date post: | 01-Jan-2016 |
| Category: |
Documents |
| Upload: | kristopher-edwards |
| View: | 217 times |
| Download: | 2 times |

CALIFORNIA ENERGY COMMISSION
California Electricity Issues
William J. KeeseChairman
California Energy Commission
April 5, 2001National Governor’s Association

ELECTRICITY SOURCESTwenty five percent of the state’s electricity comes
from out-of-state generation

CALIFORNIA ENERGY COMMISSION
WASH.+18.3 %
ORE.+16.7 %
IDAHO+24.3 %
NEV.+50.6 %
UTAH
+23.6 %COLO.
+23.1 %
ARIZ.
+30.4 %
TEXAS
+18.0 %
FLORIDA+16.8 %
GEORGIA+20.2 %
N.D.-0 .8%
IOWA+3.3%
W. VA.+0.7%
MAINE+2.0%
MASS.+2.6%
R.I.-1 .3%
CONN.-0 .2%
N.Y.+1.1%
PA+0.9%
Slowest-growing/shrinking statesFastest-growing states
A Country in TransitionPercentage changes in population from April 1, 1990 through July 1, 1999

CALIFORNIA ENERGY COMMISSION
Non-Coincident Peak Demand Reserve Margins1993-1998
0.0%2.0%4.0%6.0%8.0%
10.0%12.0%14.0%16.0%18.0%20.0%
1993
1994
1995
1996
1997
1998
Perc
ent WSCC
California
Southwest
EstimatedActual

1/9/01
Project Date Permitted
Approved (MW)
Preconstr (MW)
Under Const (MW)
Operating (MW)
Not Built (MW)
1996-present Pastoria 12/20/00 750 750Moss Landing 10/25/00 1,060 1,060Elk Hills 12/6/00 500 500Sunrise 12/6/00 320 320Delta 2/9/00 880 880La Paloma 10/6/99 1,048 1,048Pittsburg 8/17/99 500 500High Desert 5/3/00 720 720Sutter 4/14/99 500 500
Subtotal 6,278 1,970 4,308 0 0
1990-1996San Francisco 3/31/96 240 240Campbell Soup 11/30/94 158 158Procter & Gamble 11/16/94 171 171Shell 11/16/94 99 99Sacramento Ethanol 5/11/94 149 149Redding 5/26/93 73 73Carson Ice 6/23/93 95 95Crockett 4/26/93 240 240El Centro 5/29/91 80 80Luz SEGS IX & X 2/14/90 160 80 80
Subtotal 1,464 0 0 996 469
1985-1990Mojave 4/12/89 55 55Coso 12/14/88 80 80Luz SEGS VIII 3/29/89 80 80Luz SEGS III-VII 5/25/88 150 150Shell 10/5/88 60 60Chevron 10/7/87 99 99Argus 1/6/88 100 100Champlin 6//86 79 79American 1 7/8/87 120 120El Segundo 4/21/86 77 77Midway Sunset 5/14/87 225 225ARCO Watson 9/17/86 385 385IBM 3/20/86 65 65Sycamore 12/10/86 300 300
Subtotal 1,875 0 0 1,810 65
TOTAL 9,617 1,970 4,308 2,806 534MW - Nominal megawatts
POWER PLANTS APPROVED BY THE CALIFORNIA ENERGY COMMISSION OVER THE LAST 15 YEARS

3/21/01
Project Process Capacity Project Type Location(MW)
Projects Approved Decision On-line*Sutter Construction 500 Green Field Sutter Co. 4/99 7/01Los Medanos Construction 559 Brown Field Contra Costa 8/99 7/01La Paloma Construction 1,048 Green Field Kern Co. 10/99 12/01-3/02Delta Construction 880 Brown Field Contra Costa 2/00 4/02Moss Landing Construction 1,060 Expansion Monterey Co. 10/00 6/02High Desert Financing 720 Brown Field San Bernardino 5/00 7/03Sunrise Construction 320 Green Field Kern Co. 12/00 8/01Elk Hills Financing 500 Brown Field Kern Co. 12/00 3/03Pastoria Financing 750 Green Field Kern Co. 12/00 1/03United Golden Gate Financing 51 Brown Field San Mateo Co. 2/01 8/01Midway-Sunset Financing 500 Expansion Kern Co. 3/01 3/03Mountainview Financing 1,056 Expansion San Bernardino 3/01 12/02Blythe Financing 520 Green Field Riverside Co. 3/01 3/03
Total 8,464
Projects in Review Decision On-line*Huntington Beach 2-mo. AFC 450 Repower Orange Co. 4/01 7/01Hanford 6-mo. SPPE 99 Green Field Kings Co. 4/01 4/03Metcalf 12-mo. AFC 600 Green Field Santa Clara Co. 7/01 7/03Three Mountain 12-mo. AFC 500 Brown Field Shasta Co. 5/01 5/03Otay Mesa 12-mo. AFC 510 Green Field San Diego Co. 4/01 4/03Contra Costa 12-mo. AFC 530 Expansion Contra Costa 7/01 7/03Neuva Azalea 12-mo. AFC 550 Brown Field Los Angeles Co. suspended suspendedPotrero 12-mo. AFC 540 Expansion San Francisco 11/01 11/03Morro Bay 12-mo. AFC 1,200 Replacement San Luis Obispo 1/02 1/04El Segundo Repower 12-mo. AFC 630 Replacement Los Angeles Co. 2/02 2/04Rio Linda/Elverta 12-mo. AFC 560 Green Field Sacramento Co. 5/02 5/04Pastoria II 6-mo. AFC 250 Green Field Kern Co. 10/01 4/04Golden Gate 6-mo AFC 570 Brown Field San Mateo Co. 11/01 11/03
Total 6,989
Projects Expected (Publicly Announced) Filing On-line*Kern Co. Restart 2-mo. AFC 160 Repower Kern Co. 4/01 10/01Woodland II SPPE 80 Brown Field Stanislaus Co 4/01 10/03Colusa Comb. Cycle 12-mo. AFC 600 Green Field Colusa County 5/01 7/04Roseville 12-mo. AFC 750 Green Field Placer Co. 8/01 8/04East Altamont 12-mo. AFC 1,100 Green Field Alameda Co. 3/01 5/04Russell City 12-mo. AFC 600 Brown Field Hayward 6/01 6/04Antelope Valley 12-mo. AFC 1,000 Green Field Kern Co. 8/01 10/04Salton Sea Geo. 6-mo. AFC 300 Green Field Imperial Co. 6/01 12/03Carson Expansion 6-mo. AFC 130 Expansion Los Angeles Co. 6/01 12/03Magnolia 6-mo. AFC 310 Replacement Los Angeles Co. 5/01 11/03SMUD Comb. Cycle 12-mo. AFC 1,000 Green Field Sacramento Co. 8/01 10/04South City 12-mo. AFC 550 Green Field San Mateo Co. 10/01 11/04Long Beach 12-mo. AFC 500 Green Field Los Angeles Co. 2/02 3/05Redondo Beach 12-mo. AFC 1,000 Replacement Los Angeles Co. 3/02 4/05
Total 8,080
Dates
CALIFORNIA ENERGY COMMISSION - ENERGY FACILITY SITING STATUS

Project Process Capacity Project Type Location(MW)
Projects Approved
Total 0
Projects in ReviewWildflower Larkspur 21-day 90 Green Field San Diego Co.Wildflower Indigo 21-day 135 Green Field Riverside Co.Ramco Chula Vista 21-day 57 Brown Field San Diego Co.Alliance Century 21-day 40 Brown Field San BernardinoAlliance Drews 21-day 40 Brown Field San Bernardino
Total 362
Projects Expected (Publicly Announced)
Total 0
Projects Expected (Not Publicly Announced)Peaker 21-day 100 Brown Field Fresno Co.Peaker 21-day 100 Brown Field Contra Costa Co.Peaker 21-day 100 Brown Field Santa Clara Co.Peaker 21-day 50 Brown Field Monterey Co.Peaker 21-day 50 Brown Field Sutter Co.Peaker 21-day 120 Brown Field Santa Clara Co.Peaker 21-day 90 Brown Field San BernardinoPeaker 21-day 50 Brown Field Kings Co.Peaker 21-day 50 Brown Field Contra Costa Co.Peaker 21-day 50 Brown Field KernPeaker 21-day 50 Brown Field Los Angeles Co.Peaker 21-day 50 Brown Field Los Angeles Co.Peaker 21-day 100 Brown Field Los Angeles Co.
Total by 9/01 960Peaker 4-mo. AFC 176 Brown Field Santa Clara Co.Peaker 4-mo. AFC 85 Brown Field Kings Co.Peaker 4-mo. AFC 100 Brown Field Contra Costa Co.Peaker 4-mo. AFC 50 Brown Field Kings Co.Peaker 4-mo. AFC 50 Green Field Contra Costa Co.Peaker 4-mo. AFC 120 Green Field Kern Co.Peaker 4-mo. AFC 50 Brown Field Solano Co.Peaker 4-mo. AFC 130 Brown Field San BernardinoPeaker 4-mo. AFC 400 Brown Field San Bernardino
CALIFORNIA ENERGY COMMISSION - EMERGENCY PEAKER PROJECT STATUS

CALIFORNIA ENERGY COMMISSION
Statewide Peak Demand Load Resource Balance at 7% Operating Reserve
35000
40000
45000
50000
55000
60000
65000
2000 2001 2002 2003
Interruptible
Imports *
Firm Trans.
Powerplants
Existing *
Imp orts* ad dition al a mou nts are a va ila ble in n omina l an d 1 :5 sc en arios , bu t no t n ec es sa rily in 1:40 s ce na rio
Ex is ting Re so urc es *Th is n um be r is de r iv ed from b as e ins ta lled re so urc es , le ss o utag es o r4 3,8 56 - 2,57 2 = 41 ,1 04
Nomi nal Peak Dem and
1 in 5 year Dem and
1 in 40 year Dem and
Resources

CALIFORNIA SUMMER 2001Forecasted Peak Demand - Resource
Balance(in megawatts)
Temperature Probability 1-in-10
Peak Demand + 7% Reserve 61,125 Incl. Anticipated growth
Existing Resources:* Existing ISO Control Area Resources 45,025* Net Imports ISO Control Area 4,834 Includes Pacific Northwest* LADWP Control Area Resources 8,198* Imperial Irrigation District 875* Far North - Eastern Sierras 277
Total Existing Resources 59,209
Expected Outages -3,050* *Historic Average. Current outages are running 250% above average.
Resources Available to Meet Load -4,966
Additional Resources with On-Line Potential for July 2001:
* Approved CEC Projects 1,262* SMUD McLellan CT Upgrade 22* ISO Peaking Facilities 1,133* Renewable Energy Projects 80* Rerate/Restart of Existing Thermal and Renewable Projects 1,244
Potential Resources Existing Projects 3,741
New Generation with On-Line Potential for July 2001:
Emergency Peaking Facilities 1,000CEC Approval Pending 45 (United Golden Gate)LADWP Harbor-Valley 267New Renewables/Distrib. Gen. ?
Total New Generation Identified 1,312
TOTAL GENERATION ADDITIONS SUMMER 2001 5,053
Source: CA Energy Commission and Electricity Oversight Board February 8,2001
Petroleum Technology Transfer Center March 15, 2001
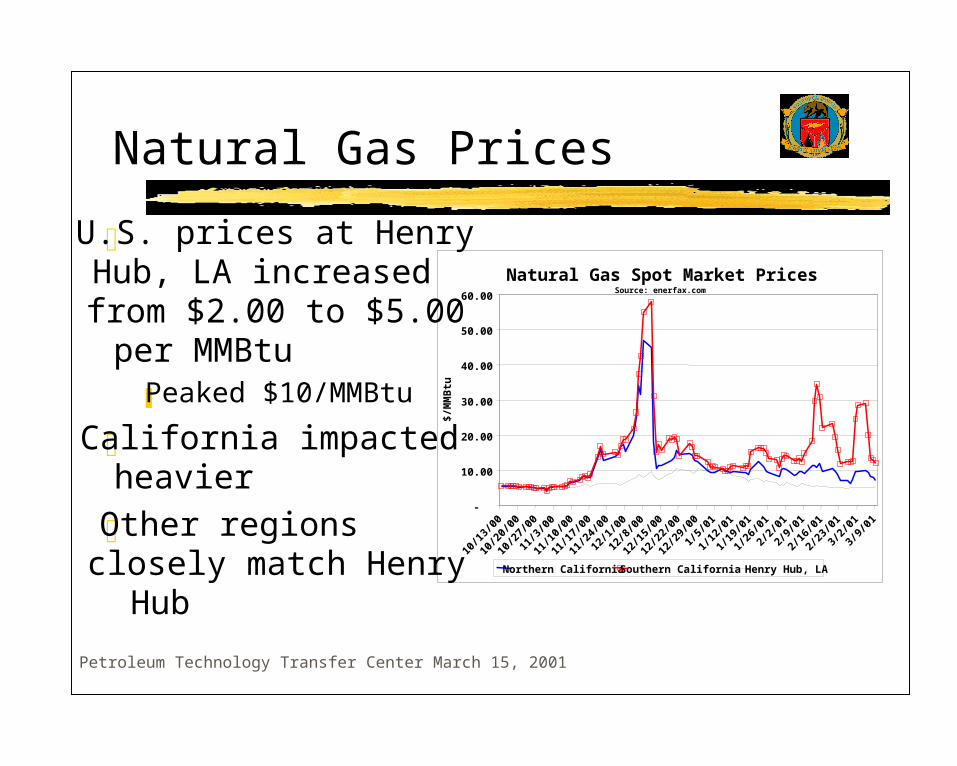
Natural Gas Prices
U.S. prices at HenryHub, LA increasedfrom $2.00 to $5.00per MMBtu
Peaked $10/MMBtu
California impactedheavier
Other regionsclosely match HenryHub
Natural Gas Spot Market PricesSource: enerfax.com
-
10.00
20.00
30.00
40.00
50.00
60.00
10/1
3/00
10/2
0/00
10/2
7/00
11/3
/00
11/1
0/00
11/1
7/00
11/2
4/00
12/1
/00
12/8
/00
12/1
5/00
12/2
2/00
12/2
9/00
1/5/
01
1/12
/01
1/19
/01
1/26
/01
2/2/
01
2/9/
01
2/16
/01
2/23
/01
3/2/
01
3/9/
01
$/M
MB
tu
Northern California Southern California Henry Hub, LA

Petroleum Technology Transfer Center March 15, 2001
U.S. Gas Prices and Drilling Rigs
Low gas pricesover the pastdecade
Lower incentive todrill
Higher prices sincelate 1999 haveresulted in
additional drillingactivity
Monthly U.S. Wellhead Natural Gas Price vs
Active Gas Drilling RigsJul-87 to Jan-01
0
100
200
300
400
500
600
700
800
900
1000
Jul-8
7
Jul-8
8
Jul-8
9
Jul-9
0
Jul-9
1
Jul-9
2
Jul-9
3
Jul-9
4
Jul-9
5
Jul-9
6
Jul-9
7
Jul-9
8
Jul-9
9
Jul-0
0
Num
ber
of R
igs
0.00
1.00
2.00
3.00
4.00
5.00
6.00
7.00
8.00
9.00
$ per McF
Rig Count US Wellhead Prices

Petroleum Technology Transfer Center March 15, 2001
2010 Forecasted California NaturalGas Demand MMcfd
Resid
Comm
Ind
EG
0
1000
2000
3000
4000
5000
6000
7000
8000
2000 2002 2004 2006 2008 2010

California Electric Generation
0%
10%
20%
30%
40%
50%
60%
70%
80%
90%
100%
1983 1984 1985 1986 1987 1988 1989 1990 1991 1992 1993 1994 1995 1996 1997 1998
Hydroelectric Other Generation Imports

California Electric Generation
0
50,000
100,000
150,000
200,000
250,000
300,000
1983 1984 1985 1986 1987 1988 1989 1990 1991 1992 1993 1994 1995 1996 1997 1998
Gig
awat
t h
ours
Hydroelectric Other Generation Imports

Daily Peak LoadsCalifornia ISO Control Area
January 1999 - July 2000
20,000
25,000
30,000
35,000
40,000
45,000
50,000
01/0
1/19
99
02/0
1/19
99
03/0
1/19
99
04/0
1/19
99
05/0
1/19
99
06/0
1/19
99
07/0
1/19
99
08/0
1/19
99
09/0
1/19
99
10/0
1/19
99
11/0
1/19
99
12/0
1/19
99
01/0
1/20
00
02/0
1/20
00
03/0
1/20
00
04/0
1/20
00
05/0
1/20
00
06/0
1/20
00
07/0
1/20
00
MW
July 12, 199945,574 MW
June 14, 200043,447 MW

Statewide Peak Demand (MW) by Sector and End-Use
0
1,000
2,000
3,000
4,000
5,000
6,000
7,000
8,000
CommercialAC
ResidentialAC
AssemblyIndustry
CommercialLight
ResidentialMisc
CommercialMisc
Other ComBldgs
Ag & WaterPumping
ProcessIndustry
ResidentialRefrigerator
15%14%
11% 11%
8%
7%
4% 4%4% 4%


