1 Electricity Tariffs, Power Outages and Firm Performance: A Comparative Analysis Jean Arlet Global Indicators Group, Development Economics. The World Bank March, 2017 Abstract Many countries struggle to provide adequate electricity services to the private sector. While the importance of infrastructure for economic growth is widely acknowledge, limited research has been dedicated on how electricity sector outcomes impact firm performance. The paper presents new measures from the Doing Business Getting Electricity (GE) indicator for 190 economies, namely macro data for electricity tariffs and power outages. The objective of the paper is to test the relationship between electricity sector characteristics, as measured by Doing Business, and firm performance. I first show that power outages and electricity tariffs are associated to firm behavior in terms of the demand for energy inputs. I then employ a similar specification than Geginat and Ramalho (2015) using World Bank Enterprise Surveys to find that, in a cross sectional sample of 80 economies, outages are negatively associated with firm productivity. Electricity tariffs are also negatively associated to productivity but only for small and medium enterprises.
Transcript
1
Electricity Tariffs, Power Outages and Firm Performance: A Comparative Analysis
Jean Arlet
Global Indicators Group, Development Economics. The World Bank
March, 2017
Abstract
Many countries struggle to provide adequate electricity services to the private sector. While the importance of
infrastructure for economic growth is widely acknowledge, limited research has been dedicated on how
electricity sector outcomes impact firm performance. The paper presents new measures from the Doing
Business Getting Electricity (GE) indicator for 190 economies, namely macro data for electricity tariffs and
power outages. The objective of the paper is to test the relationship between electricity sector characteristics,
as measured by Doing Business, and firm performance. I first show that power outages and electricity tariffs
are associated to firm behavior in terms of the demand for energy inputs. I then employ a similar specification
than Geginat and Ramalho (2015) using World Bank Enterprise Surveys to find that, in a cross sectional sample
of 80 economies, outages are negatively associated with firm productivity. Electricity tariffs are also negatively
associated to productivity but only for small and medium enterprises.
2
Over one billion people do not have access to electricity1, and according to the World Bank, the same number do have access but receive electricity services that do not meet adequate reliability standards.2 Lack of electricity affects welfare negatively by undermining such areas as education (Khandker et al., 2014) and healthcare (Adair-Rohani, 2013). One of the areas that is arguably the most affected by poor electricity services is firm performance. The 2016 World Bank Enterprise Surveys data report that 12% of business owners in developing economies3 perceive electricity (or lack thereof) as the biggest obstacle for their activities, behind only access to finance (16%) and the informal sector (12%). Yet impediments to electricity access vary. For a newly incorporated startup, for instance, it may be the case that obtaining a new electricity connection is difficult due to a burdensome connection process (Geginat and Ramalho, 2015). It may also be the case that, once connected to the grid, a business faces blackouts that forces it to halt production or resort to self-supply through generators, which comes at a significant cost (Foster and Steinbuks, 2010). Lastly, electricity tariffs may hinder a firm where prices are high relative to income levels (Abeberese, 2016).
This paper has three main objectives. First, it seeks to introduce the new Doing Business Getting Electricity (GE) data measuring electricity tariffs and power outages for firms. The data on tariffs and outages are collected directly from utilities and do not rely on firm surveys as commonly used in the literature. The coverage spans across 190 economies, surpassing other existing electricity sector indicators (see table 1 in annex) which are aligned with the GE measures. Further adding to existing research, this paper also examines how power outages and electricity tariffs are related to firm behavior in terms of demand for energy inputs. A third and final objective is to test whether, consistent with the literature, interruptions and tariffs are inversely associated to firm performance when measured in terms of productivity. I do this employing a similar specification than Geginat and Ramalho (2015) on a cross section data analysis of 80 economies using Entreprise Surveys.
The analysis is divided into five succeeding sections. Section I provide a brief review of the literature on how firm performance is impacted by electricity sector outcomes, namely outages, tariffs and the connection process. Section II describes the data sample while showing that GE estimates are associated to other measures of reliability and tariffs. Section III gives a statistical summary of the data. Section IV, finally, provides the results on how electricity variables are associated with firm performance. I. End-user electricity variables and firm performance: literature overview
This section provides a selective overview of recent literature on the effects between electricity sector outcomes and firm performance, particularly with regards to service reliability, electricity tariffs and the ease of the connection process. 1.1 Power outages and firm performance
According to the World Economic Forum (WEF), infrastructure is one of the main pillars of competitiveness4 – i.e. the set of institutions and factors that determine a country’s productivity. While infrastructure
1 IEA World energy Outlook 2016 2 World Bank Independent Evaluation Group, Main Report 2015. 3 Developing economies exclude high-income economies as per the World Bank classification 4 According to the WEF, infrastructure is one of four pillars that is a “basic requirement” for global competitiveness.
3
encompasses many types of facilities and systems, a country’s electricity supply is one of the elements that has the strongest impact on firm productivity according to Escribano et al (2009). Additionally, several studies have found that reliable electricity services boost firm and country productivity (Fedderke and Bogetic, 2006; Kirubi et al., 2009; Grimm et al., 2012). Barnebeck et al (2012), for instance, estimate that the annual economic growth drag of a weak power infrastructure is about 2 percentage points in Sub-Saharan Africa.
To test how firm performance is impacted by electricity infrastructure, most studies use proxy measures of power outages. Some studies employ meteorological satellite data on lighting density to construct an objective measure of blackouts (e.g. Alam et al., 2014; Barnebeck et al., 2012), while others use industry level estimates such as the ratio of electricity generated to production capacity (Fisher-Vanden et al 2015).5 Most research, however, uses firm level data where businesses self-report outages suffered over a period of time (Moyo 2012; Alby et al 2012; Scott et al 2014). Abotsi (2016), for example, uses Enterprise Surveys (ES) to conclude that power outages have a negative impact on the production efficiency of firms in Sub-Saharan Africa. And Iimi (2011) uses Business Environment and Enterprise Performance Survey (BEEPS) in Eastern Europe and Central Asia to find that eliminating outages could result in firms saving 1.5% on their operating costs.
As outages do not impact all actors alike, research has focused on how service reliability impacts businesses according to their size. Doe and Asamoah (2006) find that in Ghana power outages cause the most harm on the profitability of small and medium enterprises (SMEs) as they are unable to scale their production. Moyo (2013) shows that blackouts are particularly harmful to small firms because they typically lack resources to buy generators to mitigate service cuts. According to ES, 38% of SMEs in developing countries own a generator compared to 60% for large firms.6 It is then more common for smaller businesses to stop production during outages according to Scott et al (2014). Alcott et al (2014) corroborate these findings by showing that plants without generators have larger output losses, and because of economies of scale in generator capacity, blackouts disproportionately affect small plants.
Industry type also matters when assessing the impact of outages as some activities are more impacted than others, as shown by Alam (2014) in India. Dollar et al. (2005) find that, in Bangladesh, China, Ethiopia, and Pakistan improvements in the reliability of the power supply is found to increase garment manufactures total factor productivity. On the other hand, Alby et al (2012) show that for sectors reliant on electricity (e.g. textile industries), power cuts undermine returns to investment disproportionately.
To sum up the literature, power outages have a negative impact (albeit not universal)7 on firm performance. The impact, however, is greater for SMEs as well as firms in electricity intensive industries.
5 To assess the likelihood of blackouts, the ratio of thermal electricity generated to thermal electricity capacity is calculated. 6 Author’s calculation based on Enterprise Surveys data for all economies exclusive of High-Income OECD countries. 7 Cissokho and Seck (2013) find that in Senegal outages had a positive effect on manufacturing firms and SMEs, because outages stimulate better management practices and less efficient, lower productivity firms go out of business.
4
1.2 Electricity tariffs and firm performance
Most studies on electricity tariffs have been concerned with how tariffs are set in the electricity market – and not how they impact firms since demand for energy inputs is often seen as inelastic.8 Nonetheless, a limited but growing body of research is examining the impact of electricity tariffs on firm behavior, as business performance is sensitive to the cost of indirect inputs (Eifert et al., 2008) and energy bills can make up to 30% of operating costs for an average company (Jewell, 2006). Therefore, it is conceivable that electricity tariffs impact firm behavior and performance. Scott et al (2014), for instance, establish that in less developed countries the combined absence of service reliability and high end-user tariffs for most SMEs undermines firms. Legros et al (2011) come to a similar conclusion for Nepal.
Abeberese (2016) carries out what is perhaps the most thorough analysis yet on the effect of tariff changes. Using panel data on Indian manufacturing firms to see how they respond to exogenous tariffs increases, he concludes that firm performance is impacted as businesses reduce their electricity consumption and switch to less energy-intensive industries. A study in Nigeria infers that the closure of manufacturing firms can be partly attributed to high energy costs (Akuru et al., 2011). A report from the U.S. Department of Energy, finds that customers adjust their consumption patterns to changes in price as well as to changes in the structure of tariffs. Boonzaaier et al (2015) find that, in South Africa, electricity demand is becoming more elastic in the wake of tariff surges, and eroding profits may lead to a change in investment decisions. Still in South Africa, the Trade and Industrial Policy Strategies (2014) explores the impact of electricity price increases on mining industries using financial statements. The study establishes that certain industries, such as gold mining, were affected by the increases. Finally, Inglesi-Lotz and Blignaut (2011) through a panel data analysis of sector responses to electricity tariff increases find positive price elasticities for the commercial or transport sectors.
While there is increasing evidence that high tariffs, when pushed above a tipping point (Bonzaaier et al., 2015), may influence firm behavior in selected industries, there remains room for further research. Notably, to my knowledge, no large scale cross country study has been carried out. And data on electricity tariffs across economies has long been lacking. International databases like the International Energy Agency (IEA) or Eurostat have data for less than 40 economies (see table 1 in annex) and national statistical agencies publish electricity tariffs according to different reporting standards. 1.3 Ease of the connection process and firm performance
The performance of infrastructure services is associated to the quality of regulatory institutions according to several of studies (Kirkpatrick et al. (2002), Cubbin and Stern (2006), Andres et al. (2008)). In light of such research, Geginat and Ramalho (2015) developed the Doing Business GE indicator, measuring the process to get a new connection to the grid. Building on the work of Djankov et al (2002), they construct an index to proxy utility customer efficiency. The measure is based on the time, cost and interactions required to obtain new connections to the grid. They find that simpler and less costly electricity connection processes are associated with better firm performance - in particular in industries with high electricity needs. 8 A 2009 Deloitte study in South Africa finds that demand for electricity is inelastic even though the authors argue that there has been insufficient variation in price in the dataset to test the price effect sufficiently.
5
II. Data
2.1 Doing Business variables
This paper is based on the data of the Getting Electricity (GE) indicator of Doing Business, which provides measures on (i) power outages, (ii) electricity tariffs and (iii) the connection process. The GE indicator was first piloted in 2010, and became part of the ease of Doing Business rankings in 2011. The GE indicator has historically focused on the connection process, offering insights on utility efficiency. Measures of outages and tariffs were subsequently added in 2015. The methodology used for the three measures is briefly summed-up below. Reliability of service and power outages To broaden the measures of electricity-related obstacles for firms, Doing Business now includes measures of power outages, which can be a major constraint for firms according to the literature. The GE indicator provides power outage data for each economy’s largest business city (and the second largest city in 11 economies).9 More specifically, Doing Business collects two commonly used indices from distribution utilities; the system average interruption duration index (SAIDI) and the system average interruption frequency index (SAIFI) (see table 6 in the annex for formulas). SAIDI and SAIFI provide data from the perspective of the average customer10 over a calendar year and focus, respectively, on total outage duration (in hours) and frequency. SAIDI and SAIFI include all types of outages – including load shedding or planned power cuts for maintenance. The only exceptions are for power cuts caused by ‘force majeure’, which are confined to natural catastrophes. To ensure comparability in the data, the estimates count all interruptions that are, at the very least, 5 minutes long.11 Once SAIDI and SAIFI are collected, the data are checked against estimates provided by the private sector to address the reporting bias utilities may have. In cases where there are significant discrepancies – or SAIDI/ SAIFI are not calculated by the utility – no data are published. This is the case for 48 of the 190 economies covered. For the remainder of the countries, data are available for calendar years 2015, 2014 and 2013.
To assess the accuracy of the Doing Business outage data, the SAIFI index can be compared with private sector estimates of power outages. The World Bank Enterprise Surveys (ES) collects such data by asking firms how many outages they suffer in a typical month. The sample data, available for 138 economies, can be disaggregated to consider only outages in the main business city and annualized. I find that SAIFI data are
9 The economies where two cities are measured are Bangladesh, Brazil, China, India, Indonesia, Japan, Mexico, Nigeria, Pakistan, the Russian Federation and the United States. 10 Non-residential and residential clients are included in SAIDI/ SAIFI data as utilities typically do not disaggregate outages per client type. This is problematic for firm-level analyses; according to Moyo (2012) large businesses suffer less outages as they benefit from stable supply lines thanks to agreements with public authorities. At the global level, however, this is not supported by ES data which report that small firms report less outages than larger ones. Moreover, commercial and industrial clients typically account for the majority of the customer base of a utility, so power outages suffered by the residential sector have a minimal impact on SAIDI/SAIFI averages. 11 Utilities have different reporting standards and often exclude from their calculations outages that are under a minimum time (typically 5 minutes). Therefore, it is important to recognize that the basis for SAIDI/ SAIFI data is not completely identical. The SAIDI and SAIFI for Nicaragua, for instance, considers all outages over 3 minutes in duration. In contrast, the minimum outage time in Belize is 5 minutes.
6
strongly correlated with the estimates of ES.12 Another way to gauge whether Doing Business SAIDI/ SAIFI data are representative of a country’s power reliability is to compare these metrics to the World Economic Forum Quality of electricity supply. I find that SAIDI and SAIFI are strongly correlated with the WEF measure (see figure 7 in the annex).13 Electricity tariffs The other electricity variable newly examined by Doing Business is electricity tariffs. Based on a set of assumptions and a hypothetical monthly consumption, a bill for a commercial warehouse is computed. For comparability purposes, this bill is then brought back in cents (USD) per a unit of kilowatt-hour. The data are collected from utilities and regulatory agencies – and checked with sample bills sent by private sector professionals. As part of the assumptions, it is assumed that a commercial warehouse uses electricity 30 days a month, and consumes a total of 26,880 kilowatts for a subscribed capacity of 140 kVA.14 For the calculation of the bill, different time-of-use tariff schedules may apply. Finally, all fees that go into the bill calculation are included – except for value added tax. Data are available for calendar years 2016, 2015 and 2014.
To determine the accuracy of the Doing Business estimates on end-user electricity tariffs, a comparison is made with Eurostat data, which provides electricity prices for non-residential customers for 35 economies in the European Union and neighboring economies.15 Using data from 2015 and controlling for currency value, Eurostat tariff estimates are significantly correlated with the Doing Business tariffs.16 Ease of connection process A final end-user electricity measure that is reported by Doing Business is the process of obtaining a permanent electricity connection, as laid out by Geginat and Ramalho (2015). Here, the procedures to get a new electricity connection are counted, along with the associated time and cost. To present an aggregate measure, I calculate the distance to frontier (DTF) score as defined by Doing Business. The DTF score captures the gap between an economy’s performance and the best practice across the entire sample. For each economy, the number of procedures, the time and costs are normalized to a common unit from 0 to 100, where 0 represents the lowest performance and 100 represents the frontier. An average of these three scores is then computed and used for
12 The correlation coefficient between SAIFI (average from calendar years 2013-2015) and the ES measure of outage frequency is 0.54. When logging these variables, the coefficients becomes 0.72. All relationships are significant at the 1% level. Sample includes 96 cities and excludes Enterprise Surveys data before 2010. 13 The correlation coefficient between the WEF GCI; Quality of electricity supply and the natural logarithm of SAIDI (average for 2013-2015) is -0.84. This relationship is significant at the 1% level. Sample includes 116 economies cities. 14 It is assumed, for simplicity purposes, that the power factor is 1 (1kVa = 1 kW). 15 Non-EU economies included in Eurostat data are Norway, Liechtenstein, Iceland, former Yugoslav Republic of Macedonia (FYROM), Albania, Bosnia and Herzegovina, Montenegro, Serbia, Turkey and Kosovo. 16 The correlation coefficient between Doing Business electricity tariffs (calendar year 2015) and the Eurostat tariffs for 2015 is 0.67. This relationship is significant at the 1% level. Sample includes 35 economies. Differences are expected given the distinct assumptions used. For instance, for calculation purposes, DB assumes that a warehouse is consuming electricity during peak-hours while Eurostat makes no such assumption, using a ratio of the average price paid by industrial end-users over a period. Eurostat also excludes all recoverable taxes/levies/fees whereas DB only excludes the VAT.
7
the analysis in the paper. I do not seek to validate the dataset since Geginat and Ramalho (2015) already determine that the connection process is a good measure for utility performance and corruption.17 2.2 Other variables
The main focus of this paper is to examine the relationship between end-user electricity variables – as measured by the GE data – and firm behavior as well as performance. I first examine firm behavior in terms of the demand for energy inputs in response to power outages, tariffs and the connection process. I do this as a first step to see if firms are reactive to electricity sector characteristics. As proxies for energy inputs, I use aggregate ES data on generator ownership and electricity consumption per capita from the International Energy Agency (IEA).
As a next step, I focus on firm performance using as the outcome variable total firm sales per worker from enterprise Surveys. Disaggregated ES firm-data are also used at it provides estimates on the characteristics of businesses (e.g. sales, employees and industry-type) and measures of the business environment (e.g. export and access to finance). Nominal values are adjusted using the GDP deflator from the World Development Indicators database. All values are presented in 2015 constant US dollars and the exchange rate is taken from the International Monetary Fund’s International Financial Statistics database. As independent variables, the GE measures of interests are used, namely (i) power outages in terms of SAIDI, (ii) electricity tariffs, and (iii) the DTF score of connecting to the grid. In addition, other controls are incorporated from ES such as past sales per employee, average labor input (number of employees), capital input (proxied by investment), average international trade engagement (whether firms export directly at least 5% of their sales), and usage of bank finance (whether firms have a loan). Table 5 in the annex describes all the variables used in the study. Since Doing Business measures are representative of the main commercial city of countries, only ES data matching the DB cities are used.18 An exception is made for small economies where ES does not disaggregate data by location.19 I use the latest ES data available for each country20, and data before 2010 is excluded.21 This results in a sample of over 5,000 firms across 80 countries (see table 7 in the annex). III. Summary Statistics
The GE data show a lot of variability not only across economies, but also from one indicator to another. In Romania, for instance, electricity tariffs (8.8 cents per kilowatt-hour) are less than half of the global average, and firms in Bucharest experience under one outage a quarter. On the other hand, obtaining a new electricity connection in Bucharest is a difficult endeavor as it takes approximatively 6 months’– resulting in a low DTF
17 The correlation coefficient between the DTF score on the ease of connecting (DB2017) and the frequency of bribe payments of the WEF Global Competitiveness Index (GCI) for calendar year 2015 is 0.63. This relationship is significant at the 1% level. Sample includes 140 countries. The GCI utility bribe index is based on survey results from businesses which are asked how common it is for companies to make undocumented bribes in connection with public utilities (e.g. telephone, electricity). The index is scored from 1 to 7 [1 = very common; 7 = never occurs]. 18 For selected economies, ES disaggregates by region and not city. In such cases, ES data are used from the region where the main commercial city (as considered by Doing Business) is located. 19 Economies where data are only available for the entire country are: Antigua and Barbuda; the Bahamas; Barbados; Belize; Dominica; Grenada; Guyana; St. Kitts and Nevis; St. Lucia; St. Vincent and the Grenadines; and Suriname. 20 Each country is typically surveyed every 3 years, but this can vary varies. 21 All ES data prior to 2010 is discarded as it is more than three years older than the latest DB data available.
8
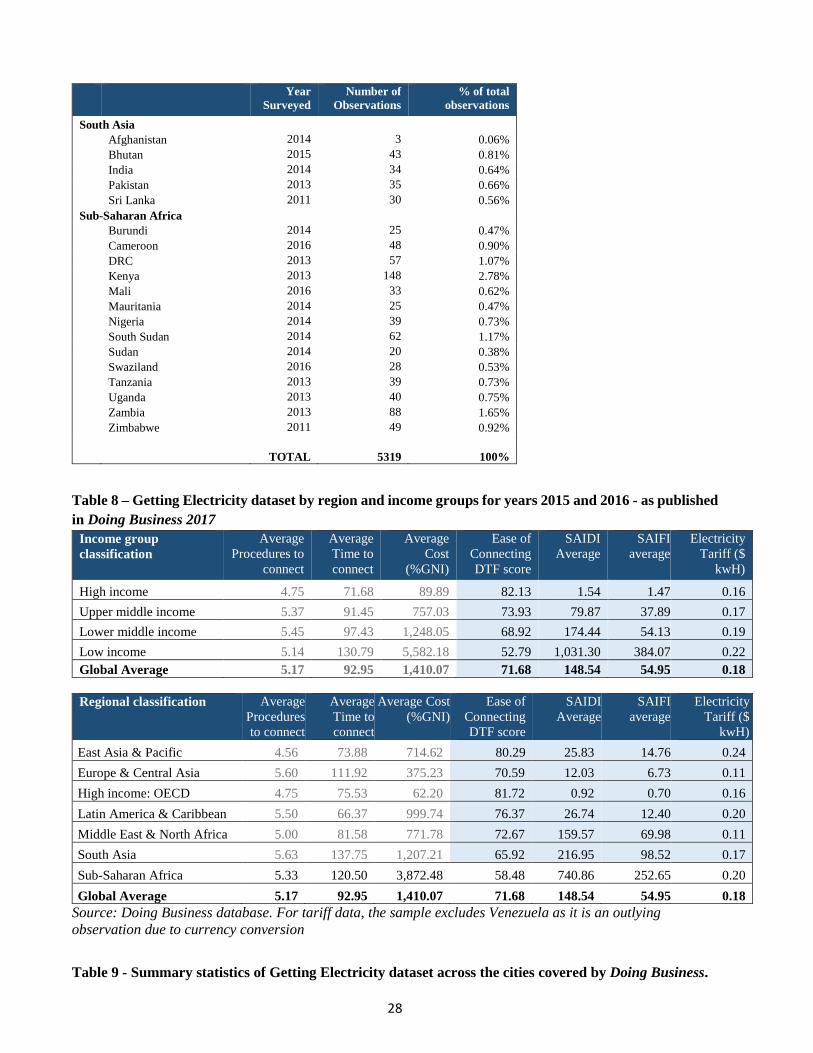
score of 46 for the ease of connecting measure. In Niger, businesses face a different set of barriers. A new electricity connection takes only a few months to obtain but once connected to the grid, firms in Niamey experience frequent power outages (153 power cuts in 2015), and electricity tariffs (23.6 cents per kWh) are higher than the Sub-Saharan average (20.3 cents). Table 9 in the annex details such differences by presenting the aggregates for the Doing Business 2017 GE dataset broken along both income and regional classifications as determined by the World Bank. Table 14 in the annex also gives the summary statistics of the data for all the cities covered by Doing Business. The main trends and observations are detailed below. 3.1 Power reliability is associated with a country’s income level
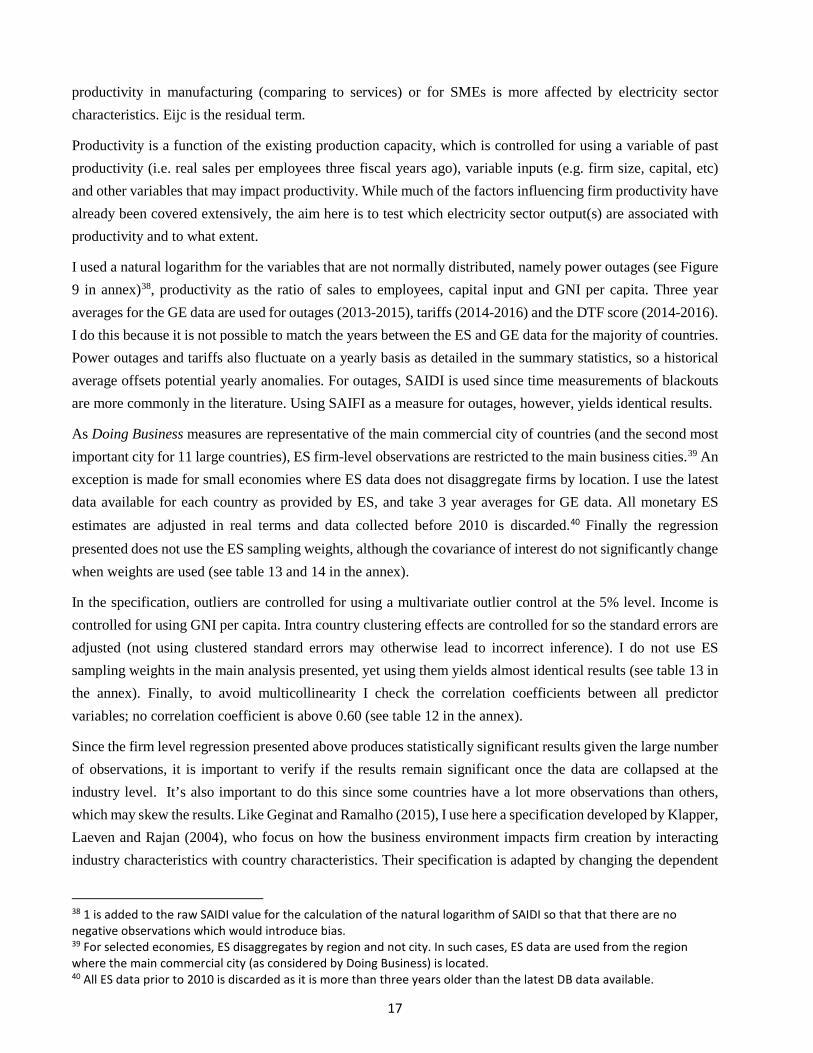
Several observations emerge looking at SAIDI and SAIFI across economies. For instance, SAIDI and SAIFI data are highly correlated.22 This is not surprising; SAIDI is a function of the number of service interruptions (i.e. SAIFI) as well as the average disruption time. For a cross sectional analysis, this implies that either variable can be used. The data also show that outages greatly vary from one country to another. In 2015, customers in nearly 50 countries experienced less than one hour of blackouts. These economies include the likes of Germany, Singapore or Costa Rica. On the upper boundary, power was interrupted for over 1,000 hours in 2015 in Comoros, Eritrea, Iraq, Nigeria, Pakistan, South Sudan and Swaziland. Owing to such extreme cases, the 2015 global SAIDI average was 148 hours compared to a median of 3.5 hours. Moreover, the 38 countries where no SAIDI/SAIFI data are available have, on average, more than twice more outages according to ES.23 This is consistent with research reporting that countries that have considerable shortages often do not record or disclose high-quality data on the performance of public infrastructure (Alcott et al, 2014).
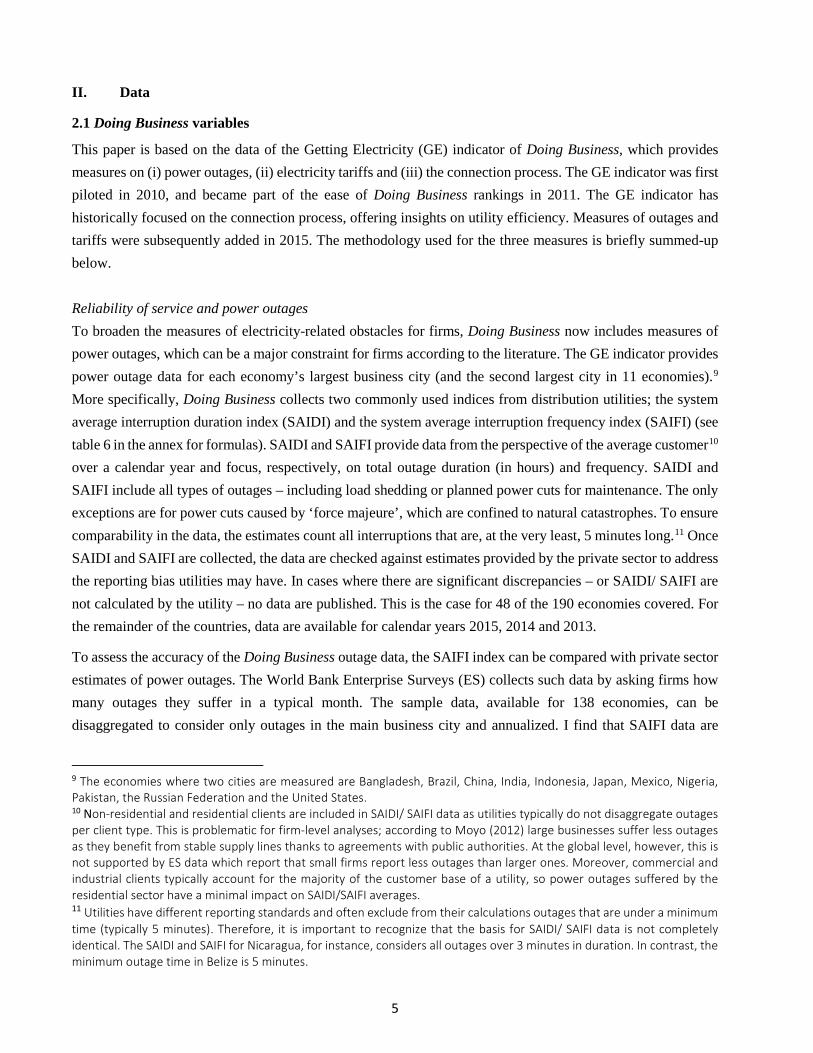
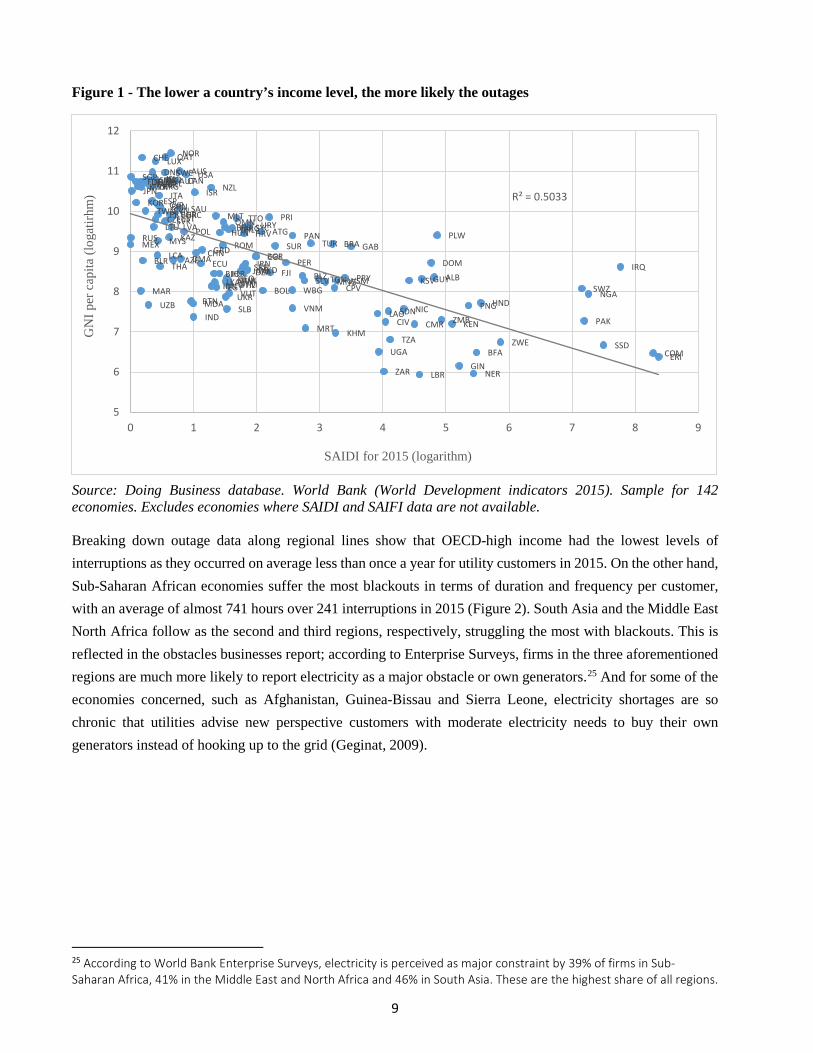
A country’s income level is associated to its infrastructure development (Calderon et al, 2014). This is true when we proxy infrastructure development in terms of service reliability as illustrated in Figure 1.24 A firm operating in a low-income economy in 2015 faced nearly 400 interruptions on average, while a business in a high-income economy experienced 1.5 power cuts.
22 The correlation coefficient between the logarithms of SAIDI and SAIFI (averages for 2013-2015) is 0.93. This relationship is significant at the 1% level. 23 Controlling for sample size and the city considered, and for economies where no SAIFI data are available, there is an average 131 outages a year according to ES. The economies where SAIFI is available have an average of 60 outages a year. 24 There is a negative correlation coefficient of -0.71 between the natural logarithm of outages and the logarithm of GNI per capita. The relationship is significant at the 1% level. Sample is 142 economies.
9
Figure 1 - The lower a country’s income level, the more likely the outages
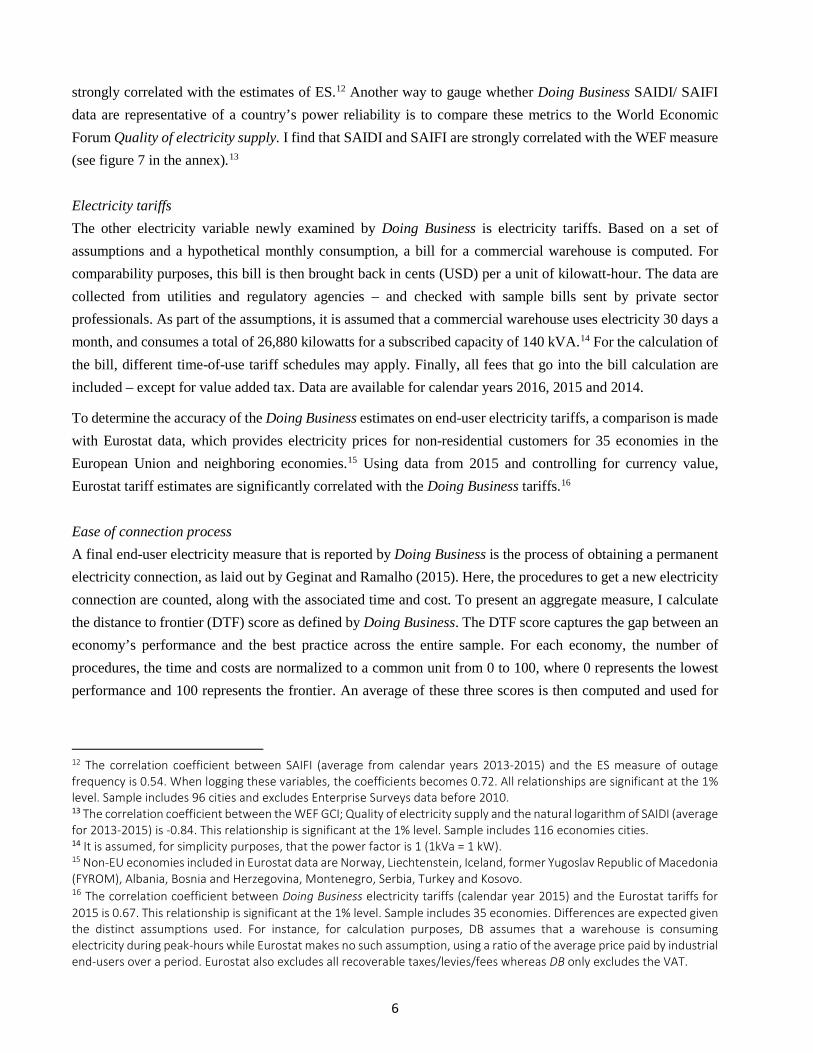
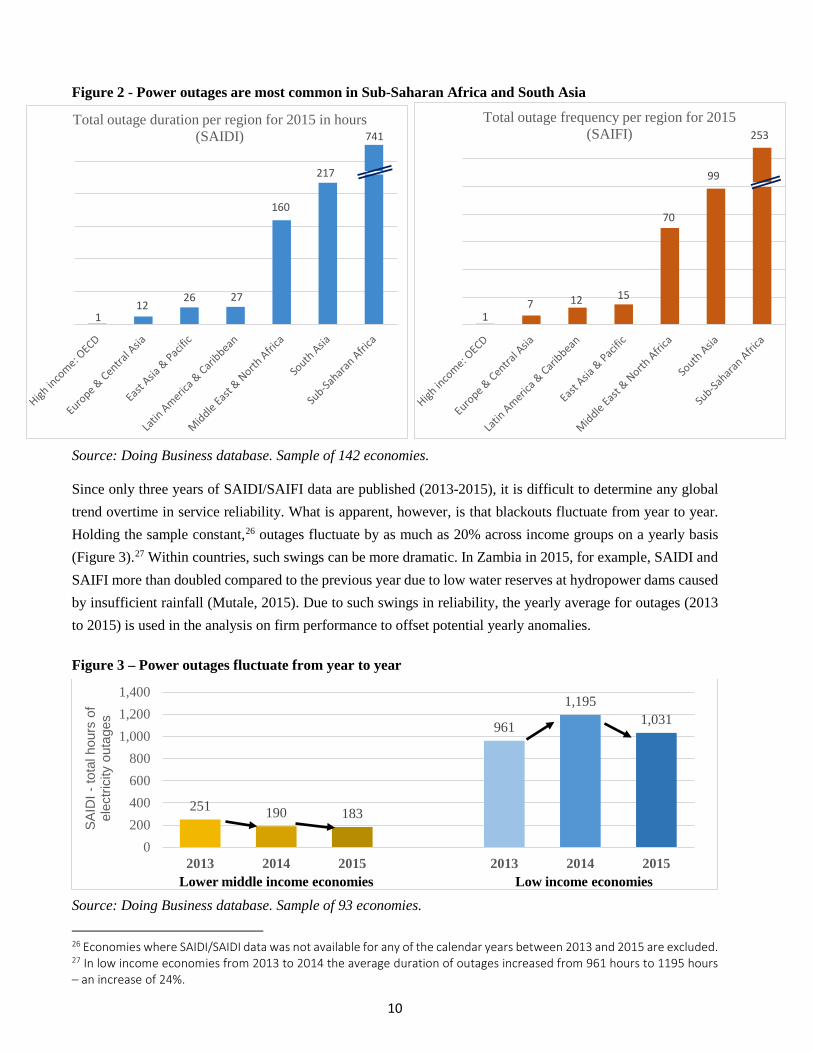
Source: Doing Business database. World Bank (World Development indicators 2015). Sample for 142 economies. Excludes economies where SAIDI and SAIFI data are not available. Breaking down outage data along regional lines show that OECD-high income had the lowest levels of interruptions as they occurred on average less than once a year for utility customers in 2015. On the other hand, Sub-Saharan African economies suffer the most blackouts in terms of duration and frequency per customer, with an average of almost 741 hours over 241 interruptions in 2015 (Figure 2). South Asia and the Middle East North Africa follow as the second and third regions, respectively, struggling the most with blackouts. This is reflected in the obstacles businesses report; according to Enterprise Surveys, firms in the three aforementioned regions are much more likely to report electricity as a major obstacle or own generators.25 And for some of the economies concerned, such as Afghanistan, Guinea-Bissau and Sierra Leone, electricity shortages are so chronic that utilities advise new perspective customers with moderate electricity needs to buy their own generators instead of hooking up to the grid (Geginat, 2009).
25 According to World Bank Enterprise Surveys, electricity is perceived as major constraint by 39% of firms in Sub-Saharan Africa, 41% in the Middle East and North Africa and 46% in South Asia. These are the highest share of all regions.
ALBDZA
ATGARG
ARM
AUSAUT
AZE
BHRBRB
BLR
BEL
BLZ
BTNBOL
BIH
BRA
BRN
BGR
BFA
CPV
KHMCMR
CAN
CHL
CHN COL
COM
ZAR
CIV
HRV
CYPCZE
DNK
DMA DOMECU
EGYSLV
ERI
EST
FJI
FINFRA
GAB
GEO
DEU
GRC
GRD
GTM
GIN
GUY
HND
HKG
HUN
ISL
IND
IDN
IRN IRQ
IRLISRITA
JAM
JPN
JOR
KAZ
KEN
KOR
KSV
KWT
LAO
LVA
LBR
LTU
LUX
MKD
MYS
MLT
MRT
MEX
MDA
MNGMAR
NLDNZL
NIC
NER
NGA
NOR
OMN
PAK
PLWPAN
PNG
PRY
PER
PHL
POL
PRT PRI
QAT
ROMRUS
WSM
SMR
SAU
SRB
SYC
SGP
SVKSVN
SLB
SSD
ESP
LKA
LCA
SDN
SUR
SWZ
SWE
CHE
TWN
TZA
THATON
TTO
TUN
TUR
UGA
UKR
AREGBRUSA
URY
UZBVUT
VNM
WBG
ZMB
ZWE
R² = 0.5033
5
6
7
8
9
10
11
12
0 1 2 3 4 5 6 7 8 9
GN
I per
cap
ita (l
ogat
irhm
)
SAIDI for 2015 (logarithm)
10
Figure 2 - Power outages are most common in Sub-Saharan Africa and South Asia
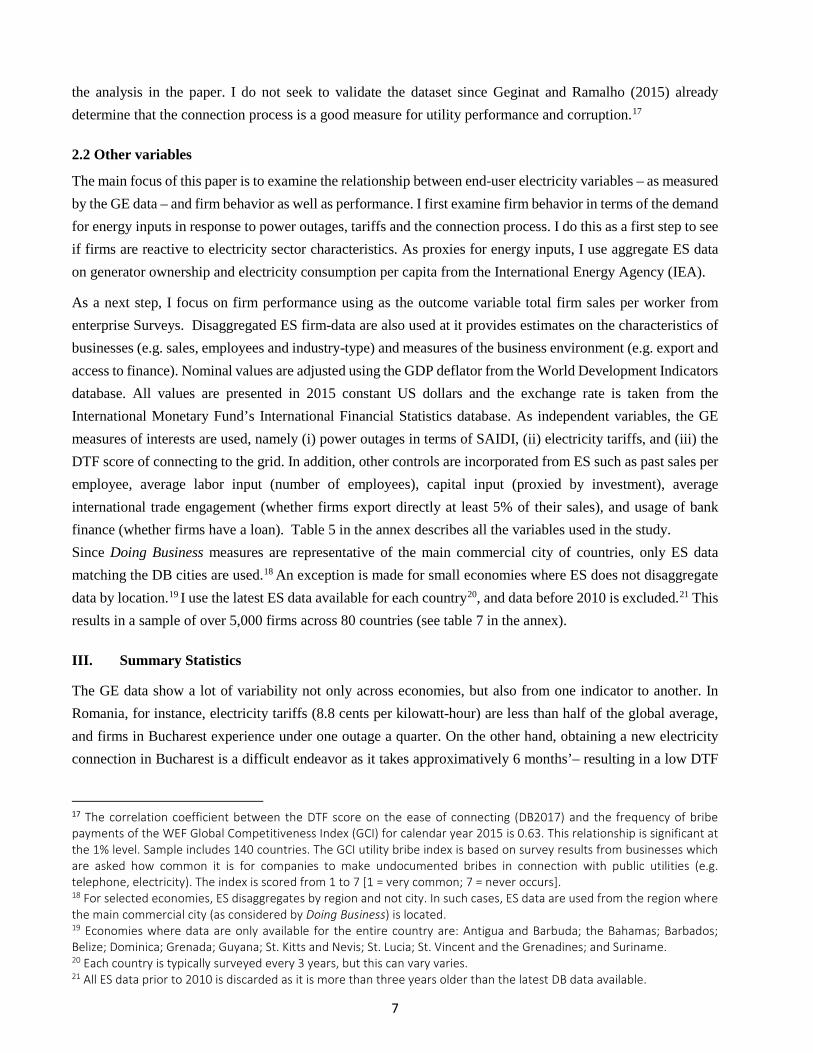
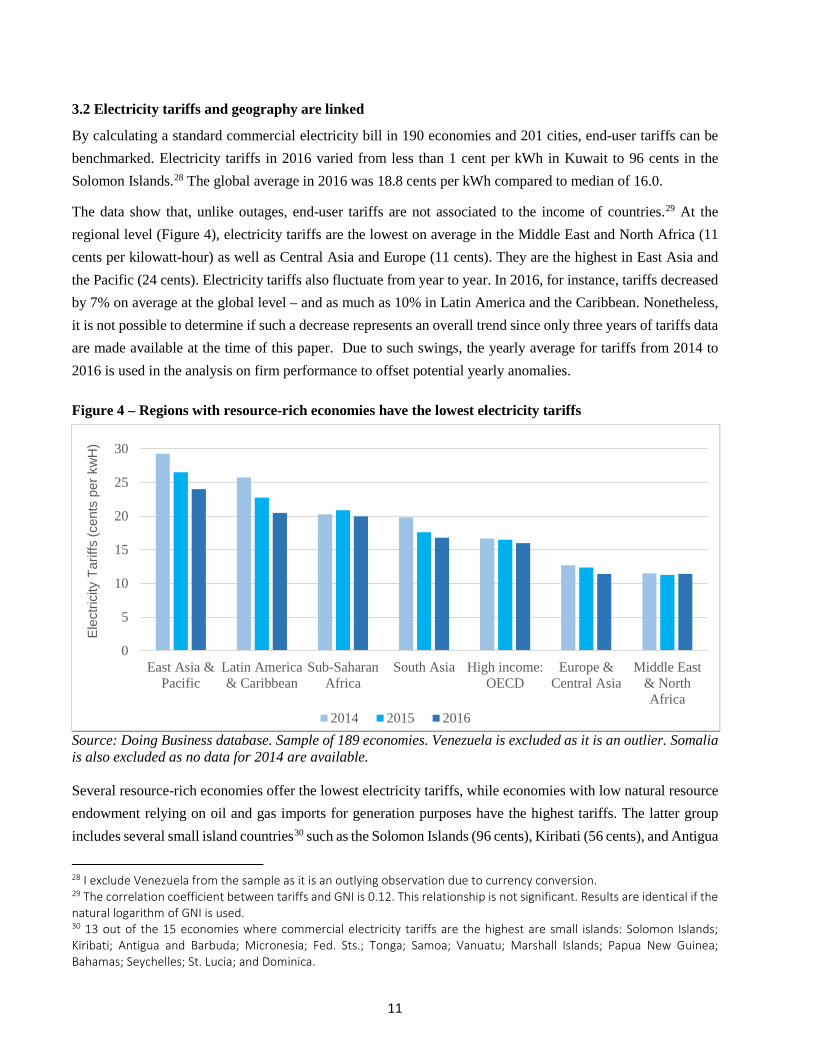
Source: Doing Business database. Sample of 142 economies. Since only three years of SAIDI/SAIFI data are published (2013-2015), it is difficult to determine any global trend overtime in service reliability. What is apparent, however, is that blackouts fluctuate from year to year. Holding the sample constant,26 outages fluctuate by as much as 20% across income groups on a yearly basis (Figure 3).27 Within countries, such swings can be more dramatic. In Zambia in 2015, for example, SAIDI and SAIFI more than doubled compared to the previous year due to low water reserves at hydropower dams caused by insufficient rainfall (Mutale, 2015). Due to such swings in reliability, the yearly average for outages (2013 to 2015) is used in the analysis on firm performance to offset potential yearly anomalies. Figure 3 – Power outages fluctuate from year to year
Source: Doing Business database. Sample of 93 economies. 26 Economies where SAIDI/SAIDI data was not available for any of the calendar years between 2013 and 2015 are excluded. 27 In low income economies from 2013 to 2014 the average duration of outages increased from 961 hours to 1195 hours – an increase of 24%.
251 190 183
961
1,1951,031
0200400600800
1,0001,2001,400
2013 2014 2015 2013 2014 2015
SAID
I -to
tal h
ours
of
elec
trici
ty o
utag
es
Lower middle income economies Low income economies
112
26 27
160
217
741Total outage duration per region for 2015 in hours
(SAIDI)
17 12 15
70
99
253Total outage frequency per region for 2015
(SAIFI)
11
3.2 Electricity tariffs and geography are linked
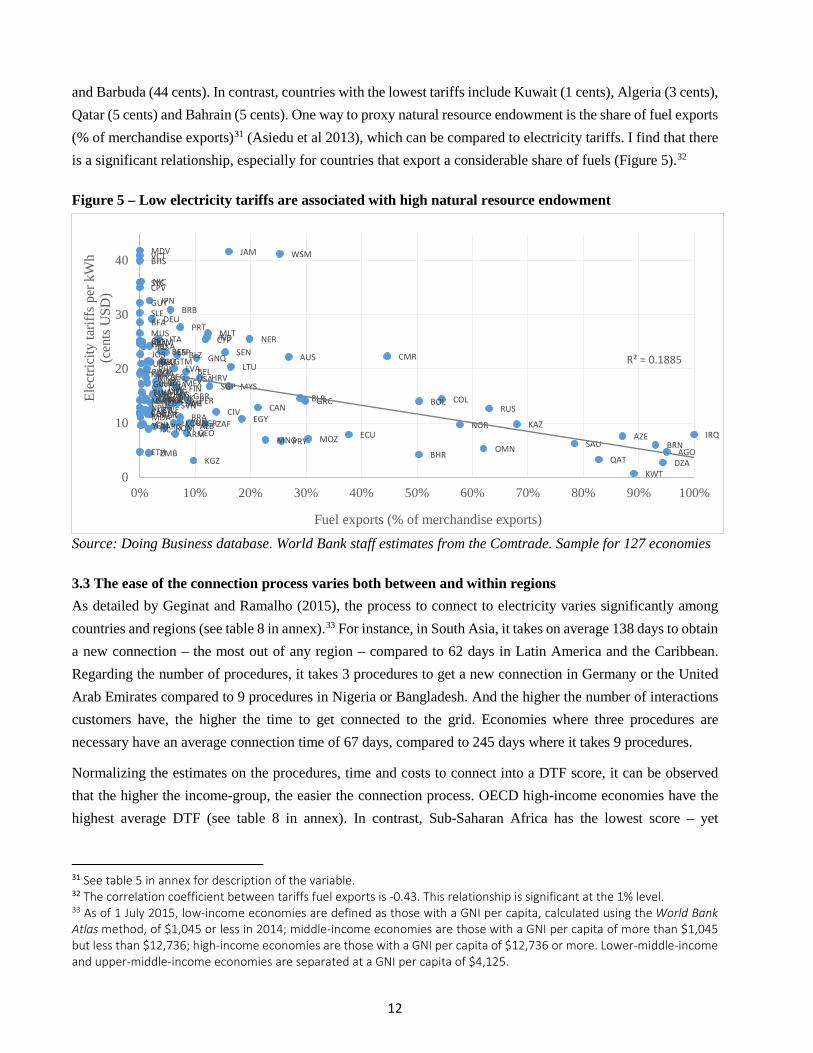
By calculating a standard commercial electricity bill in 190 economies and 201 cities, end-user tariffs can be benchmarked. Electricity tariffs in 2016 varied from less than 1 cent per kWh in Kuwait to 96 cents in the Solomon Islands.28 The global average in 2016 was 18.8 cents per kWh compared to median of 16.0.
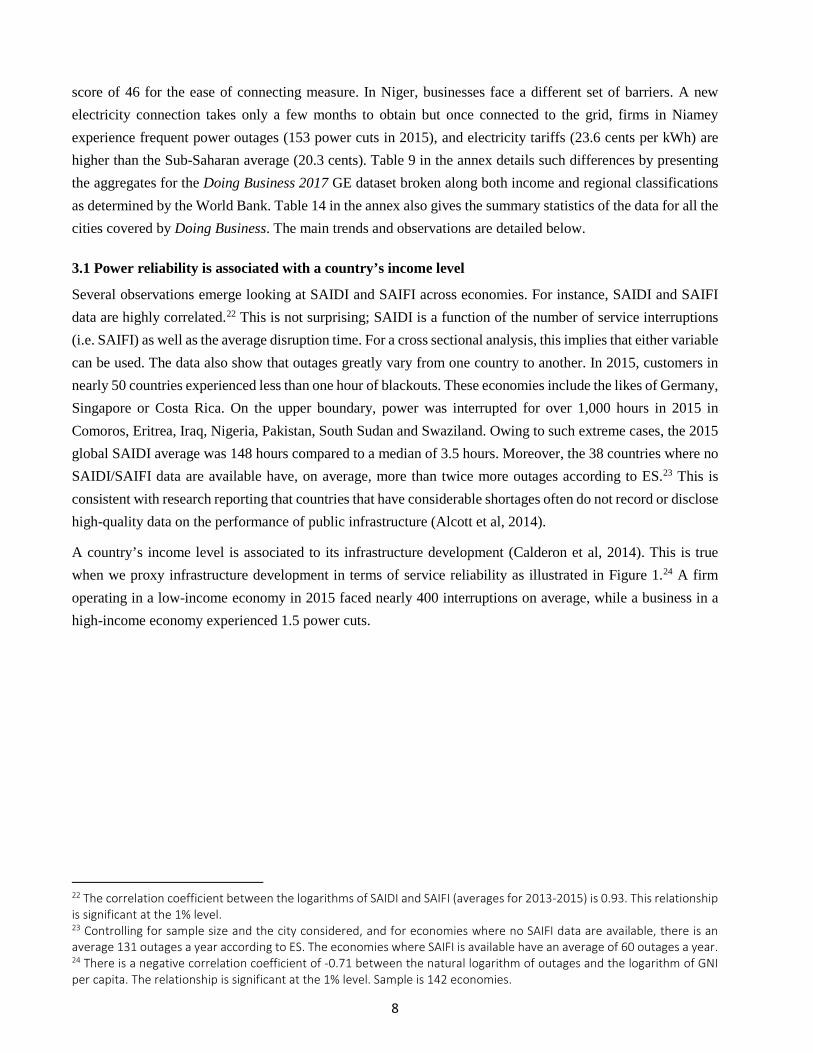
The data show that, unlike outages, end-user tariffs are not associated to the income of countries.29 At the regional level (Figure 4), electricity tariffs are the lowest on average in the Middle East and North Africa (11 cents per kilowatt-hour) as well as Central Asia and Europe (11 cents). They are the highest in East Asia and the Pacific (24 cents). Electricity tariffs also fluctuate from year to year. In 2016, for instance, tariffs decreased by 7% on average at the global level – and as much as 10% in Latin America and the Caribbean. Nonetheless, it is not possible to determine if such a decrease represents an overall trend since only three years of tariffs data are made available at the time of this paper. Due to such swings, the yearly average for tariffs from 2014 to 2016 is used in the analysis on firm performance to offset potential yearly anomalies. Figure 4 – Regions with resource-rich economies have the lowest electricity tariffs
Source: Doing Business database. Sample of 189 economies. Venezuela is excluded as it is an outlier. Somalia is also excluded as no data for 2014 are available. Several resource-rich economies offer the lowest electricity tariffs, while economies with low natural resource endowment relying on oil and gas imports for generation purposes have the highest tariffs. The latter group includes several small island countries30 such as the Solomon Islands (96 cents), Kiribati (56 cents), and Antigua
28 I exclude Venezuela from the sample as it is an outlying observation due to currency conversion. 29 The correlation coefficient between tariffs and GNI is 0.12. This relationship is not significant. Results are identical if the natural logarithm of GNI is used. 30 13 out of the 15 economies where commercial electricity tariffs are the highest are small islands: Solomon Islands; Kiribati; Antigua and Barbuda; Micronesia; Fed. Sts.; Tonga; Samoa; Vanuatu; Marshall Islands; Papua New Guinea; Bahamas; Seychelles; St. Lucia; and Dominica.
0
5
10
15
20
25
30
East Asia &Pacific
Latin America& Caribbean
Sub-SaharanAfrica
South Asia High income:OECD
Europe &Central Asia
Middle East& NorthAfrica
Elec
trici
ty T
ariff
s (c
ents
per
kw
H)
2014 2015 2016
12
and Barbuda (44 cents). In contrast, countries with the lowest tariffs include Kuwait (1 cents), Algeria (3 cents), Qatar (5 cents) and Bahrain (5 cents). One way to proxy natural resource endowment is the share of fuel exports (% of merchandise exports)31 (Asiedu et al 2013), which can be compared to electricity tariffs. I find that there is a significant relationship, especially for countries that export a considerable share of fuels (Figure 5).32 Figure 5 – Low electricity tariffs are associated with high natural resource endowment
Source: Doing Business database. World Bank staff estimates from the Comtrade. Sample for 127 economies 3.3 The ease of the connection process varies both between and within regions As detailed by Geginat and Ramalho (2015), the process to connect to electricity varies significantly among countries and regions (see table 8 in annex).33 For instance, in South Asia, it takes on average 138 days to obtain a new connection – the most out of any region – compared to 62 days in Latin America and the Caribbean. Regarding the number of procedures, it takes 3 procedures to get a new connection in Germany or the United Arab Emirates compared to 9 procedures in Nigeria or Bangladesh. And the higher the number of interactions customers have, the higher the time to get connected to the grid. Economies where three procedures are necessary have an average connection time of 67 days, compared to 245 days where it takes 9 procedures.
Normalizing the estimates on the procedures, time and costs to connect into a DTF score, it can be observed that the higher the income-group, the easier the connection process. OECD high-income economies have the highest average DTF (see table 8 in annex). In contrast, Sub-Saharan Africa has the lowest score – yet
31 See table 5 in annex for description of the variable. 32 The correlation coefficient between tariffs fuel exports is -0.43. This relationship is significant at the 1% level. 33 As of 1 July 2015, low-income economies are defined as those with a GNI per capita, calculated using the World Bank Atlas method, of $1,045 or less in 2014; middle-income economies are those with a GNI per capita of more than $1,045 but less than $12,736; high-income economies are those with a GNI per capita of $12,736 or more. Lower-middle-income and upper-middle-income economies are separated at a GNI per capita of $4,125.
performance sharply differs from one country to another. Rwanda, for instance, has a DTF of 81, whereas Uganda obtains 43. 3.4 Power outages are correlated to a difficult connection process, while electricity tariffs are not associated to either measure
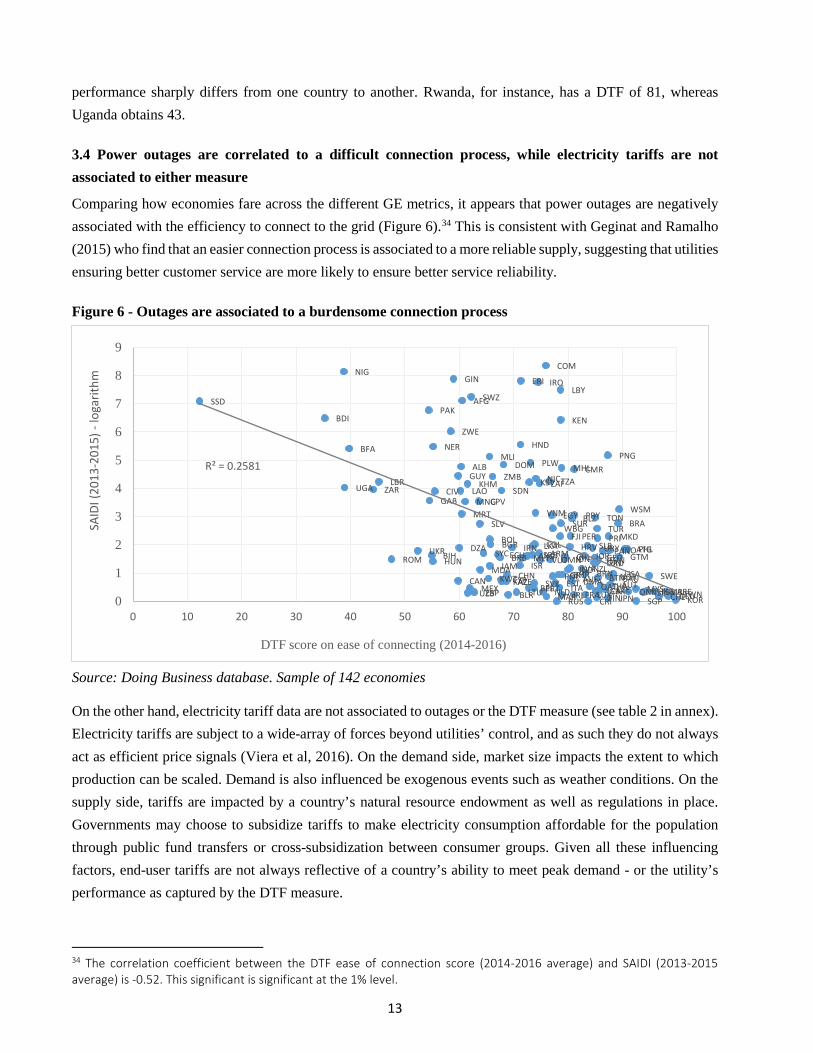
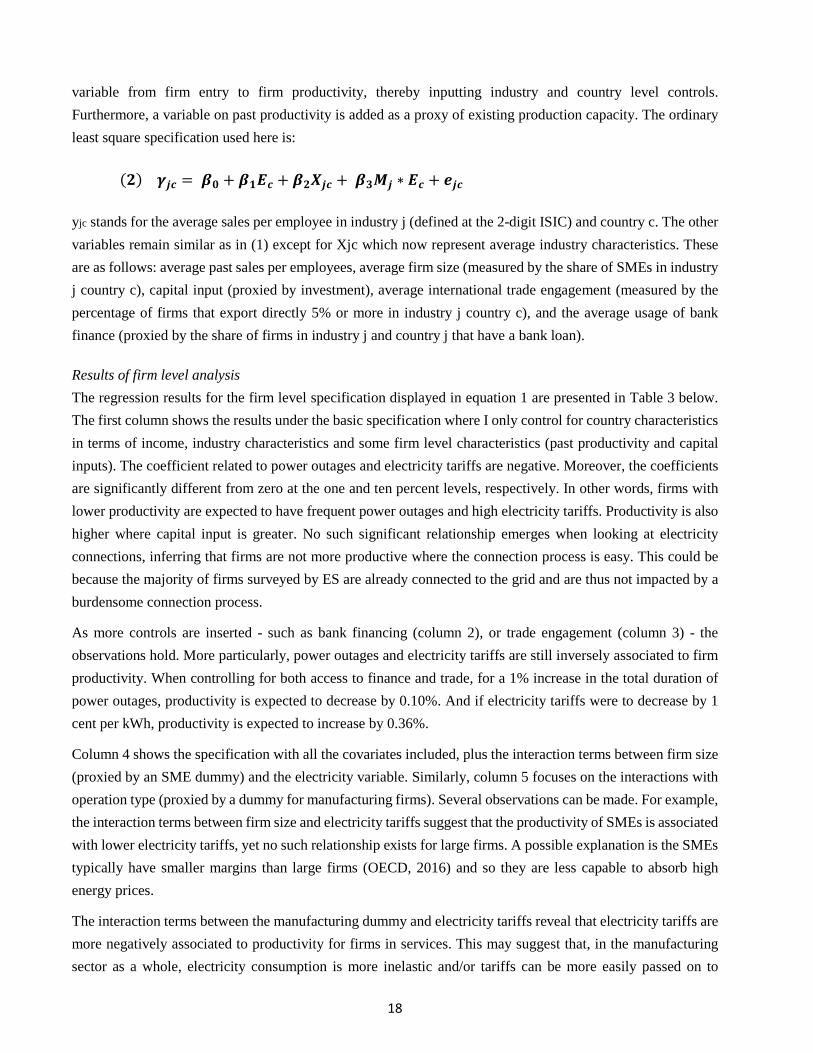
Comparing how economies fare across the different GE metrics, it appears that power outages are negatively associated with the efficiency to connect to the grid (Figure 6).34 This is consistent with Geginat and Ramalho (2015) who find that an easier connection process is associated to a more reliable supply, suggesting that utilities ensuring better customer service are more likely to ensure better service reliability. Figure 6 - Outages are associated to a burdensome connection process
Source: Doing Business database. Sample of 142 economies On the other hand, electricity tariff data are not associated to outages or the DTF measure (see table 2 in annex). Electricity tariffs are subject to a wide-array of forces beyond utilities’ control, and as such they do not always act as efficient price signals (Viera et al, 2016). On the demand side, market size impacts the extent to which production can be scaled. Demand is also influenced be exogenous events such as weather conditions. On the supply side, tariffs are impacted by a country’s natural resource endowment as well as regulations in place. Governments may choose to subsidize tariffs to make electricity consumption affordable for the population through public fund transfers or cross-subsidization between consumer groups. Given all these influencing factors, end-user tariffs are not always reflective of a country’s ability to meet peak demand - or the utility’s performance as captured by the DTF measure.
34 The correlation coefficient between the DTF ease of connection score (2014-2016 average) and SAIDI (2013-2015 average) is -0.52. This significant is significant at the 1% level.
AFG
ALB
DZA ATGARGARM
AUS AUTAZEBHR
BRB
BLRBEL
BLZ
BTN
BOL
BIH
BRA
BRN
BGR
BFA
BDI
CPV
KHMCMR
CAN
CHL
CHN
COL
COM
ZAR
CRI
CIV
HRV
CYPCZE DNK
DMA
DOM
ECU
EGYSLV
ERI
EST
FJI
FINFRA
GAB
GEO
DEU
GRCGRD
GTM
GIN
GUY
HND
HKG
HUN
ISL
INDIDN
IRN
IRQ
IRL
ISR
ITA
JAM
JPN
JOR
KAZ
KEN
KOR
KSV
KWT
LAO
LVA
LBR
LBY
LTU LUX
MKD
MYS
MLI
MLT
MHL
MRT
MEX
MDA
MNG
MARNLD
NZL
NIC
NER
NIG
NOR
OMN
PAK
PLW
PAN
PNG
PRY
PERPHL
POLPRT
PRI
QAT
ROM
RUS
WSM
SMRSAU
SRBSYC
SGP
SVK
SVNSLB
ZAF
SSD
ESP
LKA
LCA
SDN
SUR
SWZ
SWE
CHETWN
TZA
THA
TON
TTOTUN
TUR
UGA
UKR
AREGBR
USA
URY
UZB
VUT
VNM
WBG
ZMB
ZWE
R² = 0.2581
0
1
2
3
4
5
6
7
8
9
0 10 20 30 40 50 60 70 80 90 100
SAID
I (20
13-2
015)
-lo
garit
hm
DTF score on ease of connecting (2014-2016)
14
IV. Results of econometric analysis
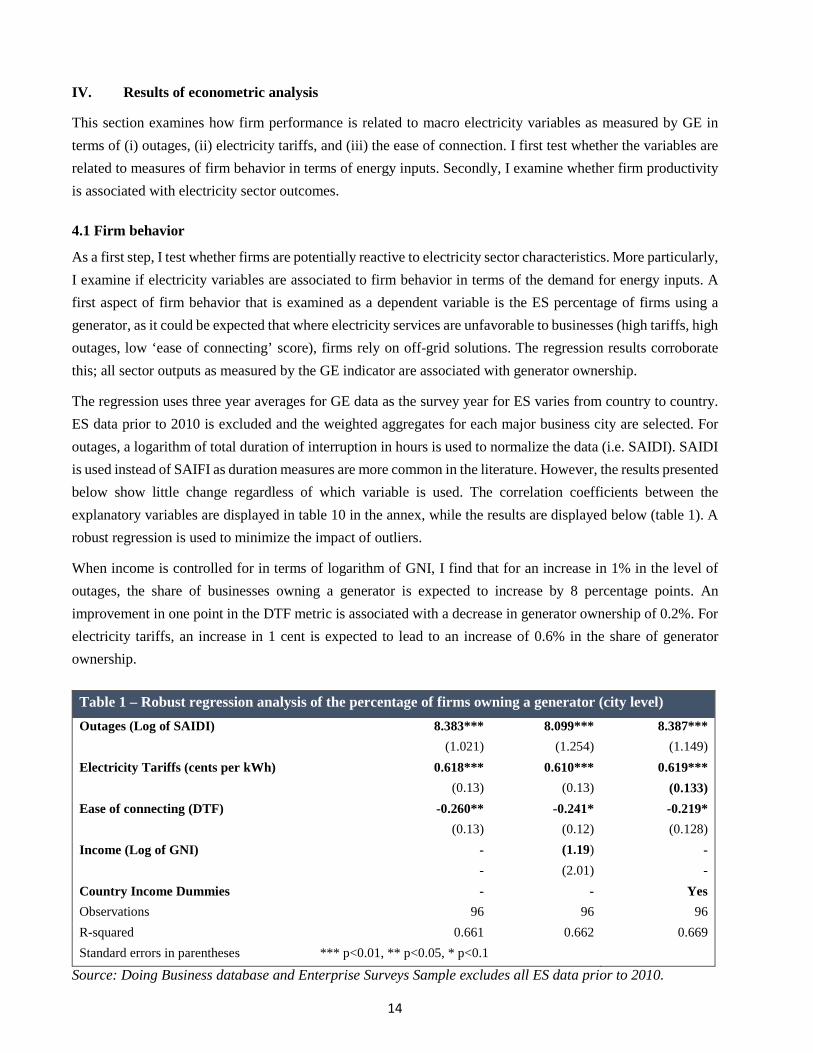
This section examines how firm performance is related to macro electricity variables as measured by GE in terms of (i) outages, (ii) electricity tariffs, and (iii) the ease of connection. I first test whether the variables are related to measures of firm behavior in terms of energy inputs. Secondly, I examine whether firm productivity is associated with electricity sector outcomes. 4.1 Firm behavior
As a first step, I test whether firms are potentially reactive to electricity sector characteristics. More particularly, I examine if electricity variables are associated to firm behavior in terms of the demand for energy inputs. A first aspect of firm behavior that is examined as a dependent variable is the ES percentage of firms using a generator, as it could be expected that where electricity services are unfavorable to businesses (high tariffs, high outages, low ‘ease of connecting’ score), firms rely on off-grid solutions. The regression results corroborate this; all sector outputs as measured by the GE indicator are associated with generator ownership.
The regression uses three year averages for GE data as the survey year for ES varies from country to country. ES data prior to 2010 is excluded and the weighted aggregates for each major business city are selected. For outages, a logarithm of total duration of interruption in hours is used to normalize the data (i.e. SAIDI). SAIDI is used instead of SAIFI as duration measures are more common in the literature. However, the results presented below show little change regardless of which variable is used. The correlation coefficients between the explanatory variables are displayed in table 10 in the annex, while the results are displayed below (table 1). A robust regression is used to minimize the impact of outliers.
When income is controlled for in terms of logarithm of GNI, I find that for an increase in 1% in the level of outages, the share of businesses owning a generator is expected to increase by 8 percentage points. An improvement in one point in the DTF metric is associated with a decrease in generator ownership of 0.2%. For electricity tariffs, an increase in 1 cent is expected to lead to an increase of 0.6% in the share of generator ownership.
Source: Doing Business database and Enterprise Surveys Sample excludes all ES data prior to 2010.
Table 1 – Robust regression analysis of the percentage of firms owning a generator (city level) Outages (Log of SAIDI) 8.383*** 8.099*** 8.387*** (1.021) (1.254) (1.149) Electricity Tariffs (cents per kWh) 0.618*** 0.610*** 0.619*** (0.13) (0.13) (0.133) Ease of connecting (DTF) -0.260** -0.241* -0.219* (0.13) (0.12) (0.128) Income (Log of GNI) - (1.19) - - (2.01) - Country Income Dummies - - Yes Observations 96 96 96 R-squared 0.661 0.662 0.669 Standard errors in parentheses *** p<0.01, ** p<0.05, * p<0.1
15
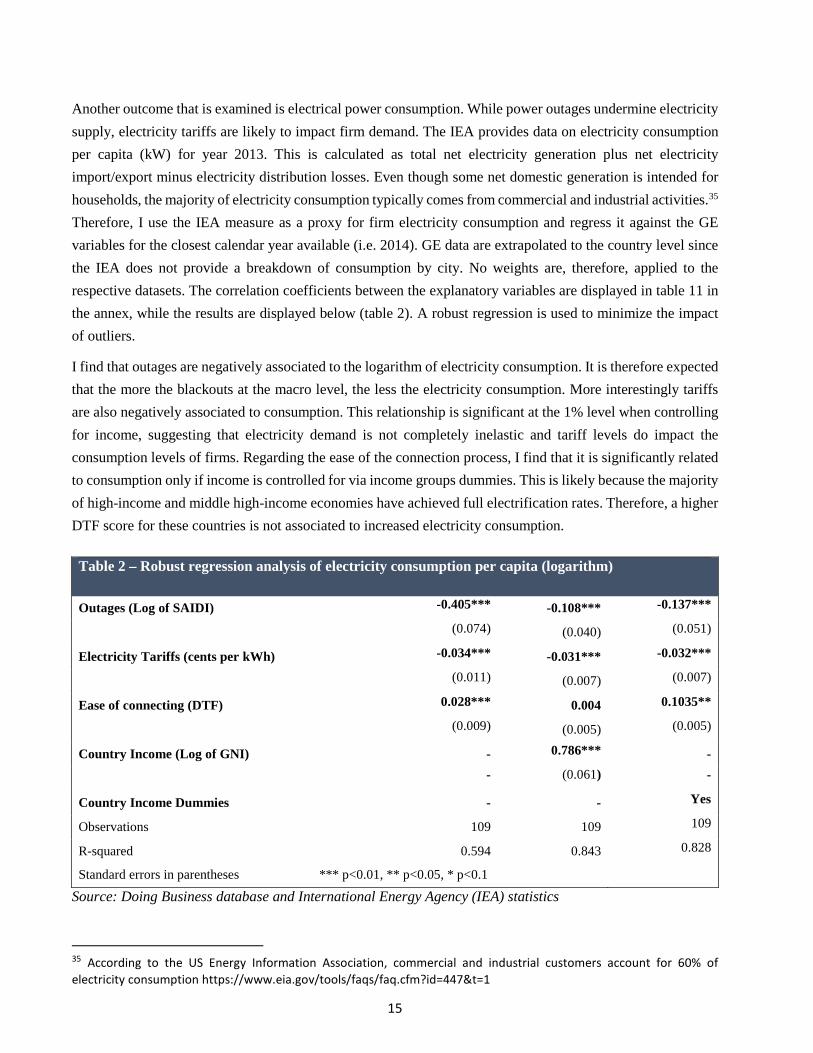
Another outcome that is examined is electrical power consumption. While power outages undermine electricity supply, electricity tariffs are likely to impact firm demand. The IEA provides data on electricity consumption per capita (kW) for year 2013. This is calculated as total net electricity generation plus net electricity import/export minus electricity distribution losses. Even though some net domestic generation is intended for households, the majority of electricity consumption typically comes from commercial and industrial activities.35 Therefore, I use the IEA measure as a proxy for firm electricity consumption and regress it against the GE variables for the closest calendar year available (i.e. 2014). GE data are extrapolated to the country level since the IEA does not provide a breakdown of consumption by city. No weights are, therefore, applied to the respective datasets. The correlation coefficients between the explanatory variables are displayed in table 11 in the annex, while the results are displayed below (table 2). A robust regression is used to minimize the impact of outliers.
I find that outages are negatively associated to the logarithm of electricity consumption. It is therefore expected that the more the blackouts at the macro level, the less the electricity consumption. More interestingly tariffs are also negatively associated to consumption. This relationship is significant at the 1% level when controlling for income, suggesting that electricity demand is not completely inelastic and tariff levels do impact the consumption levels of firms. Regarding the ease of the connection process, I find that it is significantly related to consumption only if income is controlled for via income groups dummies. This is likely because the majority of high-income and middle high-income economies have achieved full electrification rates. Therefore, a higher DTF score for these countries is not associated to increased electricity consumption.
Source: Doing Business database and International Energy Agency (IEA) statistics
35 According to the US Energy Information Association, commercial and industrial customers account for 60% of electricity consumption https://www.eia.gov/tools/faqs/faq.cfm?id=447&t=1
Table 2 – Robust regression analysis of electricity consumption per capita (logarithm)
Outages (Log of SAIDI) -0.405*** -0.108*** -0.137***
(0.074) (0.040) (0.051)
Electricity Tariffs (cents per kWh) -0.034*** -0.031*** -0.032***
(0.011) (0.007) (0.007)
Ease of connecting (DTF) 0.028*** 0.004 0.1035**
(0.009) (0.005) (0.005)
Country Income (Log of GNI) - 0.786*** -
- (0.061) -
Country Income Dummies - - Yes
Observations 109 109 109
R-squared 0.594 0.843 0.828
Standard errors in parentheses *** p<0.01, ** p<0.05, * p<0.1
16
4.2 Firm performance The results above show that the proxy measures for power outages and tariffs at the macro level are associated to firm behavior in terms of electricity and generator demand. This section examines whether these same proxies are also associated with firm performance. Econometric Specification As a measure of firm performance I focus on firm productivity measured by total sales per employee. I use a similar model to Geginat and Ramalho (2015), who use a comparable specification to the ones used by Seker (2009) and Hallward-Driemeier et al (2003). The analysis is carried both at the firm and industry level. No causal inferences can be made since the specifications analyzed do not control for simultaneity between productivity and electricity service measures, i.e. just as reliable and efficient electricity services would increase productivity, highly productive firms may have access to more reliable and efficient electricity services. Furthermore, simultaneity could happen between outages and tariffs due to a third variable. For example, rapid economic growth can cause an increase in electricity demand, resulting in more outages and hikes in tariffs.
As explained in detail in section II, all the data come from Enterprise Surveys except the electricity sector variables which are obtained from the Doing Business GE indicator set. The analysis is based on the following regression model:
where Ec represents electricity sector characteristics which are proxied by the GE data: (i) For power outages: ln (SAIDI + 1) (ii) For electricity tariffs: USD per kWh (iii) For the ease of connection: DTF score
yijc denotes the dependent variable of total sales per employee in firm i, industry j and country c; Ec represents city-wide macro electricity sector outcome for firms, which are proxied by the GE measures. Xijc is a control variable to capture firm characteristics which are as follows: capital input (proxied by the total investment in fixed assets), firm size (proxied by a dummy for SMEs as defined by ES) 36, the international trade engagement of the firm (proxied by a dummy if the firm exports37 directly 5% of its output), and access to finance (dummy if firm used banks or other financial institutions to finance its investments). Ij is for industry characteristics, which are captured by dummies defined at the 2-digit ISIC code, as well as dummies for the calendar year of the ES data
Ij*Ec represents the interaction term between a manufacturing dummy and the GE electricity measures. Si * Ec represents the interaction term between firm size and the GE variables. The coefficients measure whether
36 ES defines large firms as firms with over 100 employees. Therefore, I consider SMEs all firms with less than 100 employees. 37 Trade engagement could further be proxied by another dummy on whether firms directly import at least 5% of their inputs (Geginat and Ramalho, 2015). However, ES data for this measure is incomplete and results in a decreased of nearly 50% of observations, while not altering the results. Therefore, trade engagement for this paper is only proxied through exports.
17
productivity in manufacturing (comparing to services) or for SMEs is more affected by electricity sector characteristics. Eijc is the residual term.
Productivity is a function of the existing production capacity, which is controlled for using a variable of past productivity (i.e. real sales per employees three fiscal years ago), variable inputs (e.g. firm size, capital, etc) and other variables that may impact productivity. While much of the factors influencing firm productivity have already been covered extensively, the aim here is to test which electricity sector output(s) are associated with productivity and to what extent.
I used a natural logarithm for the variables that are not normally distributed, namely power outages (see Figure 9 in annex)38, productivity as the ratio of sales to employees, capital input and GNI per capita. Three year averages for the GE data are used for outages (2013-2015), tariffs (2014-2016) and the DTF score (2014-2016). I do this because it is not possible to match the years between the ES and GE data for the majority of countries. Power outages and tariffs also fluctuate on a yearly basis as detailed in the summary statistics, so a historical average offsets potential yearly anomalies. For outages, SAIDI is used since time measurements of blackouts are more commonly in the literature. Using SAIFI as a measure for outages, however, yields identical results.
As Doing Business measures are representative of the main commercial city of countries (and the second most important city for 11 large countries), ES firm-level observations are restricted to the main business cities.39 An exception is made for small economies where ES data does not disaggregate firms by location. I use the latest data available for each country as provided by ES, and take 3 year averages for GE data. All monetary ES estimates are adjusted in real terms and data collected before 2010 is discarded.40 Finally the regression presented does not use the ES sampling weights, although the covariance of interest do not significantly change when weights are used (see table 13 and 14 in the annex).
In the specification, outliers are controlled for using a multivariate outlier control at the 5% level. Income is controlled for using GNI per capita. Intra country clustering effects are controlled for so the standard errors are adjusted (not using clustered standard errors may otherwise lead to incorrect inference). I do not use ES sampling weights in the main analysis presented, yet using them yields almost identical results (see table 13 in the annex). Finally, to avoid multicollinearity I check the correlation coefficients between all predictor variables; no correlation coefficient is above 0.60 (see table 12 in the annex).
Since the firm level regression presented above produces statistically significant results given the large number of observations, it is important to verify if the results remain significant once the data are collapsed at the industry level. It’s also important to do this since some countries have a lot more observations than others, which may skew the results. Like Geginat and Ramalho (2015), I use here a specification developed by Klapper, Laeven and Rajan (2004), who focus on how the business environment impacts firm creation by interacting industry characteristics with country characteristics. Their specification is adapted by changing the dependent
38 1 is added to the raw SAIDI value for the calculation of the natural logarithm of SAIDI so that that there are no negative observations which would introduce bias. 39 For selected economies, ES disaggregates by region and not city. In such cases, ES data are used from the region where the main commercial city (as considered by Doing Business) is located. 40 All ES data prior to 2010 is discarded as it is more than three years older than the latest DB data available.
18
variable from firm entry to firm productivity, thereby inputting industry and country level controls. Furthermore, a variable on past productivity is added as a proxy of existing production capacity. The ordinary least square specification used here is:
yjc stands for the average sales per employee in industry j (defined at the 2-digit ISIC) and country c. The other variables remain similar as in (1) except for Xjc which now represent average industry characteristics. These are as follows: average past sales per employees, average firm size (measured by the share of SMEs in industry j country c), capital input (proxied by investment), average international trade engagement (measured by the percentage of firms that export directly 5% or more in industry j country c), and the average usage of bank finance (proxied by the share of firms in industry j and country j that have a bank loan). Results of firm level analysis The regression results for the firm level specification displayed in equation 1 are presented in Table 3 below. The first column shows the results under the basic specification where I only control for country characteristics in terms of income, industry characteristics and some firm level characteristics (past productivity and capital inputs). The coefficient related to power outages and electricity tariffs are negative. Moreover, the coefficients are significantly different from zero at the one and ten percent levels, respectively. In other words, firms with lower productivity are expected to have frequent power outages and high electricity tariffs. Productivity is also higher where capital input is greater. No such significant relationship emerges when looking at electricity connections, inferring that firms are not more productive where the connection process is easy. This could be because the majority of firms surveyed by ES are already connected to the grid and are thus not impacted by a burdensome connection process.
As more controls are inserted - such as bank financing (column 2), or trade engagement (column 3) - the observations hold. More particularly, power outages and electricity tariffs are still inversely associated to firm productivity. When controlling for both access to finance and trade, for a 1% increase in the total duration of power outages, productivity is expected to decrease by 0.10%. And if electricity tariffs were to decrease by 1 cent per kWh, productivity is expected to increase by 0.36%.
Column 4 shows the specification with all the covariates included, plus the interaction terms between firm size (proxied by an SME dummy) and the electricity variable. Similarly, column 5 focuses on the interactions with operation type (proxied by a dummy for manufacturing firms). Several observations can be made. For example, the interaction terms between firm size and electricity tariffs suggest that the productivity of SMEs is associated with lower electricity tariffs, yet no such relationship exists for large firms. A possible explanation is the SMEs typically have smaller margins than large firms (OECD, 2016) and so they are less capable to absorb high energy prices.
The interaction terms between the manufacturing dummy and electricity tariffs reveal that electricity tariffs are more negatively associated to productivity for firms in services. This may suggest that, in the manufacturing sector as a whole, electricity consumption is more inelastic and/or tariffs can be more easily passed on to
19
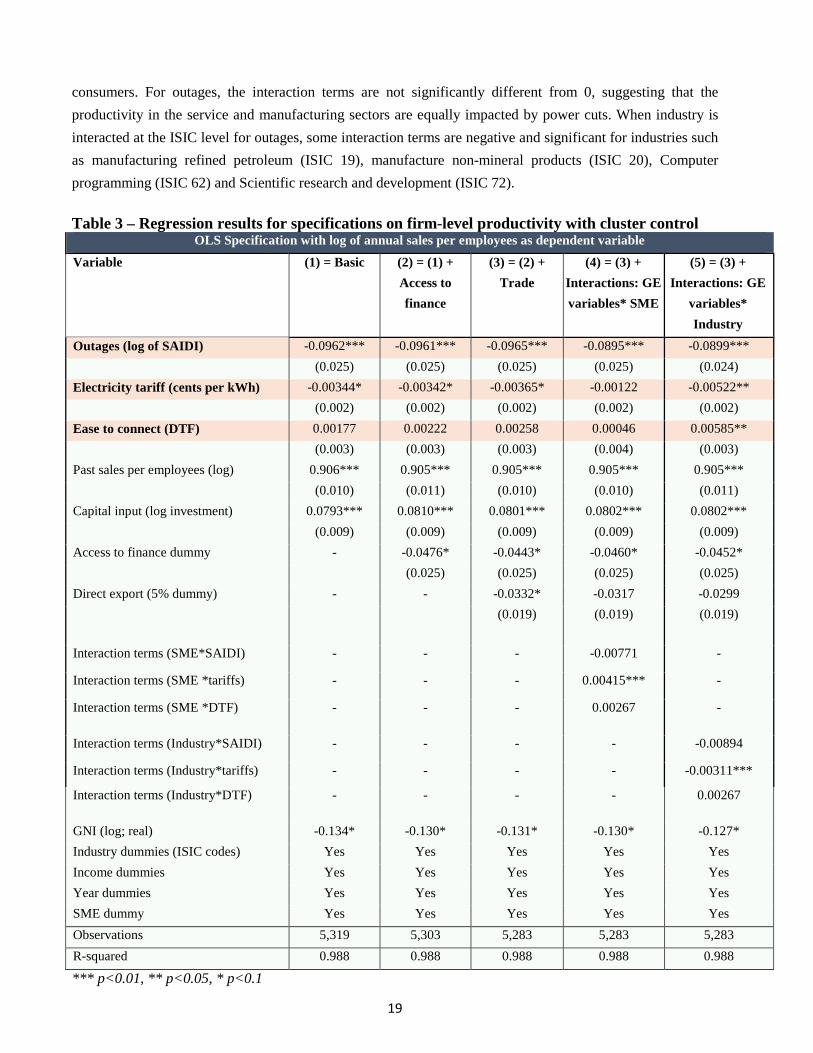
consumers. For outages, the interaction terms are not significantly different from 0, suggesting that the productivity in the service and manufacturing sectors are equally impacted by power cuts. When industry is interacted at the ISIC level for outages, some interaction terms are negative and significant for industries such as manufacturing refined petroleum (ISIC 19), manufacture non-mineral products (ISIC 20), Computer programming (ISIC 62) and Scientific research and development (ISIC 72). Table 3 – Regression results for specifications on firm-level productivity with cluster control
OLS Specification with log of annual sales per employees as dependent variable
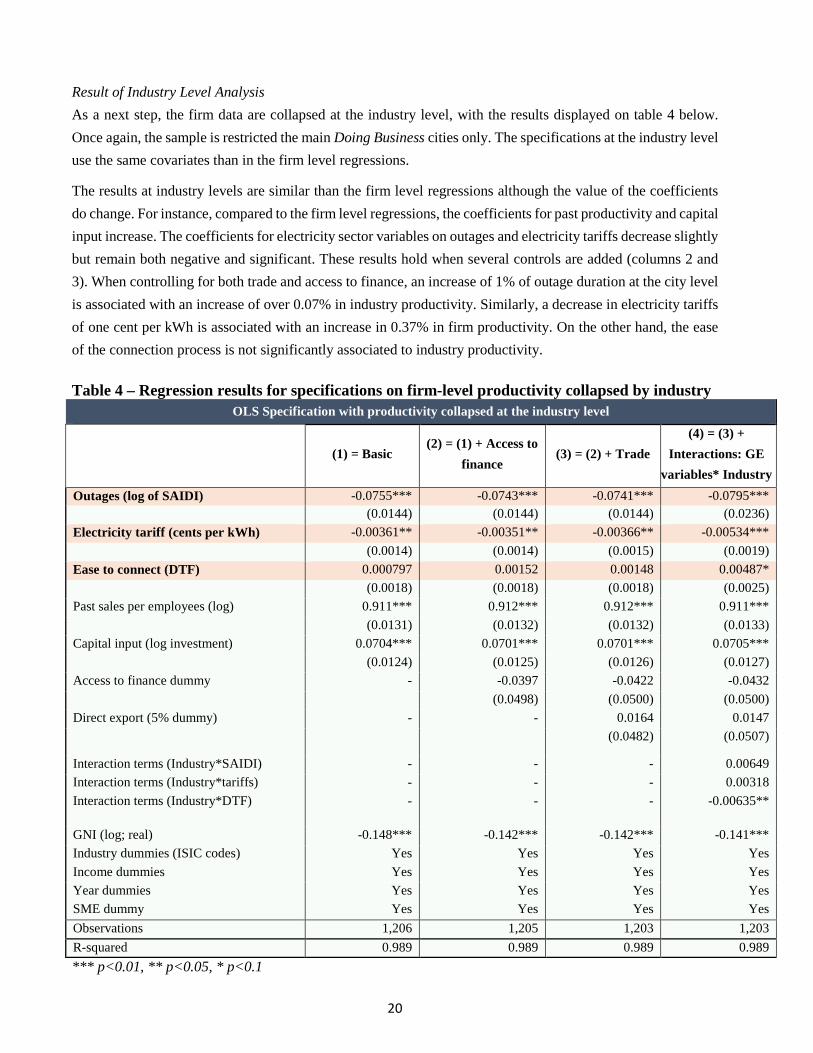
Result of Industry Level Analysis As a next step, the firm data are collapsed at the industry level, with the results displayed on table 4 below. Once again, the sample is restricted the main Doing Business cities only. The specifications at the industry level use the same covariates than in the firm level regressions.
The results at industry levels are similar than the firm level regressions although the value of the coefficients do change. For instance, compared to the firm level regressions, the coefficients for past productivity and capital input increase. The coefficients for electricity sector variables on outages and electricity tariffs decrease slightly but remain both negative and significant. These results hold when several controls are added (columns 2 and 3). When controlling for both trade and access to finance, an increase of 1% of outage duration at the city level is associated with an increase of over 0.07% in industry productivity. Similarly, a decrease in electricity tariffs of one cent per kWh is associated with an increase in 0.37% in firm productivity. On the other hand, the ease of the connection process is not significantly associated to industry productivity. Table 4 – Regression results for specifications on firm-level productivity collapsed by industry
OLS Specification with productivity collapsed at the industry level
This paper had three main objectives. First, it sought to introduce the expanded Doing Business GE data, which now encompasses estimates on power outages as well as electricity tariffs for 190 economies. Secondly, it explored whether electricity sector characteristics – as measured by the GE data – are associated to firm behavior in terms of energy inputs. Lastly, the paper has examined if, consistent with the literature, interruptions and tariffs are inversely associated to firm performance when measured in terms of productivity.
The statistical relationships presented show that power outages and electricity tariffs are in line with estimates collected from the private sector and other agencies. It is therefore suggested that the GE dataset can serve as a useful proxy for macro electricity sector outputs from the perspective of end-users, thereby aiding future research or policy makers. Moreover, the data show that power outages and electricity tariffs vary considerably from country to country, but both measures are not associated to one-another.
This paper finds that electricity tariffs and power outages are associated to metrics of firm behavior vis-à-vis their demand for energy inputs. For example, firm generator ownership is linked with high levels of outages as well as tariffs. More importantly, when using Enterprise Surveys data for a cross section analysis in 88 cities, power outages and electricity tariffs are found to be negatively associated with firm level productivity. This is consistent with the literature and holds when controlling for various characteristics at the firm, industry and country level. However, interaction terms reveal that electricity tariffs are only associated to the productivity of SMEs but not large firms’. The interaction terms between the manufacturing dummy and outages do not suggest that power outages are any more associated to the productivity of firms in manufacturing vs. services. For policy-makers this then suggests that reliability is important for all private sector actors and efforts to improve it need not be targeted to particular groups of firms.
22
IV. References
Abeberese, A. B. (2016). Electricity Cost and Firm Performance: Evidence from India. Review of Economics and Statistics.
Abotsi, A. K. (2016). Power Outages and Production Efficiency of Firms in Africa. International Journal of Energy Economics and Policy,6(1), 98-104.
Adair-Rohani, H., Zukor, K., Bonjour, S., Wilburn, S., Kuesel, A. C., Hebert, R., and E.R. Fletcher. (2013). Limited electricity access in health facilities of sub-Saharan Africa: a systematic review of data on electricity access, sources, and reliability. Global Health: Science and Practice,1(2), 249-261.
Alam, M.M. (2013). Coping with Blackouts: Power Outages and Firm Choices. Department of Economics, Yale University
Akuru, U. B. and O. I. Okoro. (2014). Economic Implications of Constant Power Outages on SMEs in Nigeria. Journal of Energy in Southern Africa 25 (3). Cape Town
Alby, P., Dethier, J., and S. Straub. (2012). Firms Operating under Electricity Constraints in Developing Countries. The World Bank Economic Review, 27(1), 109-132.
Alby, P., Dethier, J., and S. Straub. (2010). Firms Operating Under Infrastructure and Credit Constraints in Developing Countries: The case of power generators. Policy Research Working Papers.
Alcott H., Collard-Wexler A., and S. O’Connell S. (2014). How do electricity shortages affect productivity? Evidence from India. NBER Working paper No. w19977.
Andres, L., Guasch. J.L., and S. Lopez Azumendi (2008). Regulatory Governance and Sector Performance: Methodology and Evaluation for Electricity Distribution in Latin America. Policy Research Working Paper 4494. World Bank, Washington, DC.
Asiedu, E. (2013). Foreign Direct Investment in Africa: The Role of Natural Resources, Market Size, Government Policy, Institutions and Political Instability. SSRN Electronic Journal.
Bonzaaier, W.. Goliger, A., Makrelov. K., and L. McMillan. (201). The Tipping Point: the Impact of Rising Electricity Tariffs at Firm and Sector. Economics Society of South Africa.
Calderón, C., Moral-Benito, E., & Servén, L. (2014). Is infrastructure capital productive? A dynamic heterogeneous approach. Journal of Applied Econometrics, 30(2), 177-198.
Chissokho, L. and A. Seck (2013) Electric Power Outages and the Productivity of Small and Medium Enterprises in Senegal, Investment Climate and Business Environment Research Fund (ICBE-RF).
Cubbin, J. and J. Stern. (2006) The Impact of Regulatory Governance and Privatization on Electricity Industry Generation Capacity in Developing Economies. The World Bank Economic Review Advance Access, World Bank, Washington, DC.
Deloitte. (2009). Estimating the Elasticity of Electricity Prices in South Africa.
Deloitte. (2011). The Economic Impact of Electricity Price Increases on Various Sectors of the South African Economy.
Djankov, S., La Porta, R., Lopez-de-Silanes, F., and A. Shleifer. (2002). The Regulation of Entry. Quarterly Journal of Economics 117(1):1-37.
23
Doe, F., and Asamoah, E. S. (2014). The Effect of Electric Power Fluctuations on the Profitability and Competitiveness of SMEs: A Study of SMEs within the Accra Business District of Ghana. Journal of Competitiveness,6(3), 32-48.
Dollar, D., Hallward‐Driemeier, M., and T. Mengistae. (2005). Investment Climate and Firm Performance in Developing Economies. Economic Development and Cultural Change,54(1), 1-31.
Eifert, B., Gelb, A. and V. Ramachandran. (2008). The Cost of Doing Business in Africa; Evidence from Enterprise Survey Data in World Development, Vol 36, No 9, pp 1531-1546
Escribano, A., Guasch, J.L. and J. Pena. (2009). Assessing the Impact of Infrastructure Constraints on Firm Productivity in Africa. Working Paper 9, Africa Infrastructure Sector Diagnostic, World Bank. Washington D.C.
Eurostat. Retrieved February 22, 2017, from http://ec.europa.eu/eurostat.
Fedderke, J. and Bogetic, Z. (2006). Infrastructure and Growth in South Africa: Direct and Indirect Productivity Impacts of Nineteen Infrastructure Measures. World Bank Policy Research Working Paper, Washington D.C.
Fisher-Vanden, K., Mansur, E. T., and Q. Wang. (2015). Electricity shortages and firm productivity: Evidence from China's industrial firms. Journal of Development Economics,114, 172-188.
Foster, V. and J. Steinbuks. (2008). Paying the Price for Unreliable Power Supplies: In-House Generation of Electricity by Firms in Africa, Working Paper 2.
Geginat, C. (2009). Getting electricity: a pilot indicator set from the doing business project. Doing Business. Washington, DC: World Bank Group.
Geginat, C., and R. Ramalho. (2015). Electricity Connections and Firm Performance in 183 Countries. Policy Research Working Papers.
Grimm, M., Hartwig, R. and J. Lay. (2012) How Much Does Utility Access Matter for the Performance of Micro and Small Enterprises? Accessed from http://bit.ly/1Ge4hlF.
Hallward-Driemeier, M., Wallsten, S. and C.U. Lixin. (2003). The investment climate and the firm: firm-level evidence from China. Washington D.C. World Bank Policy Research Working Paper Series 3003.
Inglesi-Lotz, R., and J.N Blignaut. (2011). The evolution of price elasticity of electricity demand in South Africa. SAJEMS,NS 14(4), 449-465.
International Energy Agency (2014). World Energy Outlook 2014
Jewell, M. (2006). Connecting the Dots. Energy & Power Management.
Kirkpatrick, C., Parker, D., and Y. Zhang. (2002). Electricity Sector Reform in Developing Countries: An Econometric Assessment of the Effects of Privatisation, Competition and Regulation. Centre on Regulation and Competition (CRC) Working paper no. 30593
Klapper, L., Laeven, L., and R. Rajan. (2004). Business Environment and Firm Entry: Evidence from International Data. World Bank Policy Research Working Paper 3232. Washington, D.C.: World Bank.
Khandker, S. R., Samad, H. A., Ali, R., and D.F. Barnes. (2014). Who Benefits Most from Rural Electrification? Evidence in India. The Energy Journal,35(2).
Kirubi, C., Jacobson, A., Kammen, D. M. and A. Mills. (2009). Community-Based Electric Micro-Grids Can Contribute to Rural Development: Evidence from Kenya. World Development, 73, pp. 1208–1221
Legros, G., Rijal, K. and B, Seyedi. (2011). Decentralized Energy Access and the Millennium Development Goals: An analysis of the development benefits of micro-hydropower in rural Nepal. UNDP/AEPC
Moyo, B. (2012). Do Power Cuts Affect Productivity? A Case Study Of Nigerian Manufacturing Firms. International Business & Economics Research Journal (IBER),11(10), 1163.
Moyo, B. (2013), Power infrastructure quality and manufacturing productivity in Africa: A firm level analysis. Energy Policy, 61, 1063-107.
Mutale, A. (2015, May 21). Zambia: Hello darkness. Financial Mail. Retrieved from http://www. financialmail.co.za/features/2015/05/21/ zambia-hello-darkness
OECD (2012). Financing SMEs and Entrepreneurs: Understanding and Developing an OECD Scoreboard. OECD Publishing. 14 Apr 2016.
Overseas Development Institute (ODI). (2014). Electricity insecurity and SMEs. Shaping policy for development
Seker, Murat. (2009). Importing, exporting and innovation in developing countries, Washington D.C. World Bank Policy Research Working Paper Series 5156.
Scott, A., Darko, E., Lemma, A. and R. Juan-Pablo. (2014). How Does Electricity Insecurity Affect Businesses in Low and Middle Income Countries? Shaping Policy for Development.
Steinbuks, J. and V. Foster. (2010). When do firms generate? Evidence on in-house electricity supply in Africa, Energy Economics 32 (2010) 505–514
Trade and Industrial Policy Strategies (TIPS). (2014). The Impact of electricity price increases of selected mining sector and smelting value chains in South Africa. Policy paper prepared for the Economic Development Department and the Department of Trade and Industry.
U.S. Department of Energy. (2006). Benefits of Demand Response in Electricity Markets and Recommendations for Achieving Them. A report to the U.S. Congress pursuant to Section 1252 of the Energy Policy Act of 2005. Washington, DC.
Viera, X., Hochstetler, R., Mello, J.C., and L.A Barroso. (2016). Aligning Regulatory Incentives and Price Signals in the Brazilian Wholesale and Retail Electricity Market. Cigre. CE-025. Paris.
World Bank Doing Business Data. Retrieved February 22, 2017, from http://www.doingbusiness.org/
World Bank Enterprise Surveys Data. Retrieved February 22, 2017, from https://www.enterprisesurveys.org/Data.
World Bank Independent Evaluation Group. (2015). Main report. Washington, D.C.: World Bank Group. http://documents.worldbank.org/curated/en/416421468196746577/Main-report
World Bank World Development Indicators. Retrieved February 23, 2017, from http://data.worldbank.org/data-catalog/world-development-indicators
World Economic Forum Global Competitiveness Report (2016). Retrieved February 22, 2017, from https://www.weforum.org/reports/the-global-competitiveness-report-2016-2017-1.
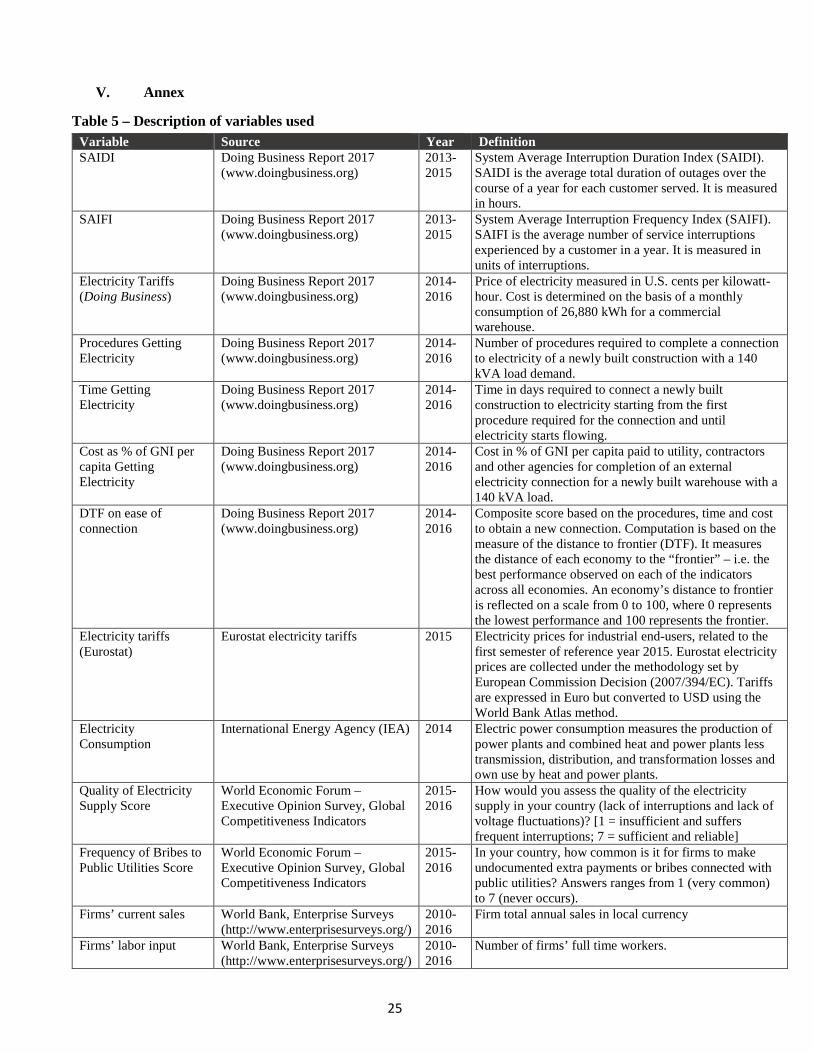
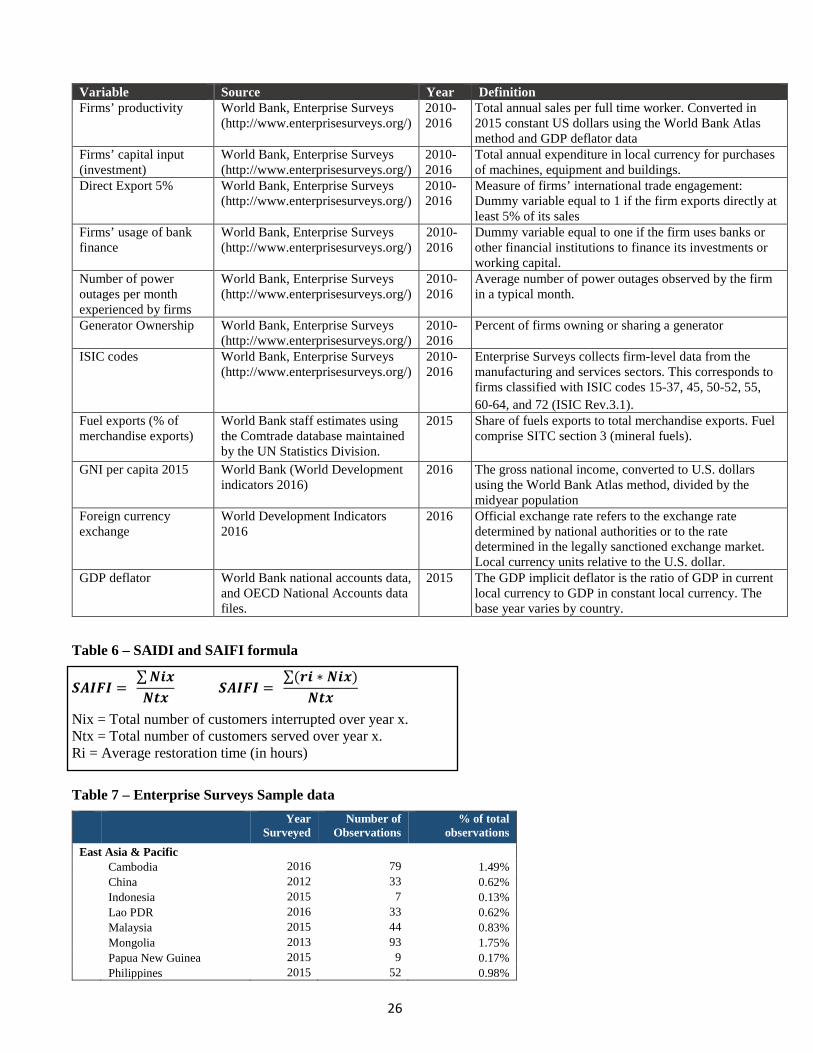
Table 5 – Description of variables used Variable Source Year Definition SAIDI Doing Business Report 2017
(www.doingbusiness.org) 2013-2015
System Average Interruption Duration Index (SAIDI). SAIDI is the average total duration of outages over the course of a year for each customer served. It is measured in hours.
SAIFI Doing Business Report 2017 (www.doingbusiness.org)
2013-2015
System Average Interruption Frequency Index (SAIFI). SAIFI is the average number of service interruptions experienced by a customer in a year. It is measured in units of interruptions.
Electricity Tariffs (Doing Business)
Doing Business Report 2017 (www.doingbusiness.org)
2014-2016
Price of electricity measured in U.S. cents per kilowatt-hour. Cost is determined on the basis of a monthly consumption of 26,880 kWh for a commercial warehouse.
Procedures Getting Electricity
Doing Business Report 2017 (www.doingbusiness.org)
2014-2016
Number of procedures required to complete a connection to electricity of a newly built construction with a 140 kVA load demand.
Time Getting Electricity
Doing Business Report 2017 (www.doingbusiness.org)
2014-2016
Time in days required to connect a newly built construction to electricity starting from the first procedure required for the connection and until electricity starts flowing.
Cost as % of GNI per capita Getting Electricity
Doing Business Report 2017 (www.doingbusiness.org)
2014-2016
Cost in % of GNI per capita paid to utility, contractors and other agencies for completion of an external electricity connection for a newly built warehouse with a 140 kVA load.
DTF on ease of connection
Doing Business Report 2017 (www.doingbusiness.org)
2014-2016
Composite score based on the procedures, time and cost to obtain a new connection. Computation is based on the measure of the distance to frontier (DTF). It measures the distance of each economy to the “frontier” – i.e. the best performance observed on each of the indicators across all economies. An economy’s distance to frontier is reflected on a scale from 0 to 100, where 0 represents the lowest performance and 100 represents the frontier.
Electricity tariffs (Eurostat)
Eurostat electricity tariffs 2015 Electricity prices for industrial end-users, related to the first semester of reference year 2015. Eurostat electricity prices are collected under the methodology set by European Commission Decision (2007/394/EC). Tariffs are expressed in Euro but converted to USD using the World Bank Atlas method.
Electricity Consumption
International Energy Agency (IEA) 2014 Electric power consumption measures the production of power plants and combined heat and power plants less transmission, distribution, and transformation losses and own use by heat and power plants.
Quality of Electricity Supply Score
World Economic Forum – Executive Opinion Survey, Global Competitiveness Indicators
2015-2016
How would you assess the quality of the electricity supply in your country (lack of interruptions and lack of voltage fluctuations)? [1 = insufficient and suffers frequent interruptions; 7 = sufficient and reliable]
Frequency of Bribes to Public Utilities Score
World Economic Forum – Executive Opinion Survey, Global Competitiveness Indicators
2015-2016
In your country, how common is it for firms to make undocumented extra payments or bribes connected with public utilities? Answers ranges from 1 (very common) to 7 (never occurs).
Firms’ current sales World Bank, Enterprise Surveys (http://www.enterprisesurveys.org/)
2010-2016
Firm total annual sales in local currency
Firms’ labor input World Bank, Enterprise Surveys (http://www.enterprisesurveys.org/)
Variable Source Year Definition Firms’ productivity World Bank, Enterprise Surveys
(http://www.enterprisesurveys.org/) 2010-2016
Total annual sales per full time worker. Converted in 2015 constant US dollars using the World Bank Atlas method and GDP deflator data
Firms’ capital input (investment)
World Bank, Enterprise Surveys (http://www.enterprisesurveys.org/)
2010-2016
Total annual expenditure in local currency for purchases of machines, equipment and buildings.
Direct Export 5% World Bank, Enterprise Surveys (http://www.enterprisesurveys.org/)
2010-2016
Measure of firms’ international trade engagement: Dummy variable equal to 1 if the firm exports directly at least 5% of its sales
Firms’ usage of bank finance
World Bank, Enterprise Surveys (http://www.enterprisesurveys.org/)
2010-2016
Dummy variable equal to one if the firm uses banks or other financial institutions to finance its investments or working capital.
Number of power outages per month experienced by firms
World Bank, Enterprise Surveys (http://www.enterprisesurveys.org/)
2010-2016
Average number of power outages observed by the firm in a typical month.
Generator Ownership World Bank, Enterprise Surveys (http://www.enterprisesurveys.org/)
2010-2016
Percent of firms owning or sharing a generator
ISIC codes World Bank, Enterprise Surveys (http://www.enterprisesurveys.org/)
2010-2016
Enterprise Surveys collects firm-level data from the manufacturing and services sectors. This corresponds to firms classified with ISIC codes 15-37, 45, 50-52, 55, 60-64, and 72 (ISIC Rev.3.1).
Fuel exports (% of merchandise exports)
World Bank staff estimates using the Comtrade database maintained by the UN Statistics Division.
2015 Share of fuels exports to total merchandise exports. Fuel comprise SITC section 3 (mineral fuels).
GNI per capita 2015 World Bank (World Development indicators 2016)
2016 The gross national income, converted to U.S. dollars using the World Bank Atlas method, divided by the midyear population
Foreign currency exchange
World Development Indicators 2016
2016 Official exchange rate refers to the exchange rate determined by national authorities or to the rate determined in the legally sanctioned exchange market. Local currency units relative to the U.S. dollar.
GDP deflator World Bank national accounts data, and OECD National Accounts data files.
2015 The GDP implicit deflator is the ratio of GDP in current local currency to GDP in constant local currency. The base year varies by country.
Table 6 – SAIDI and SAIFI formula
𝑺𝑺𝑺𝑺𝑰𝑰𝑺𝑺𝑰𝑰 = ∑𝑵𝑵𝒊𝒊𝑵𝑵𝑵𝑵𝑵𝑵𝑵𝑵
𝑺𝑺𝑺𝑺𝑰𝑰𝑺𝑺𝑰𝑰 = ∑(𝒓𝒓𝒊𝒊 ∗ 𝑵𝑵𝒊𝒊𝑵𝑵)
𝑵𝑵𝑵𝑵𝑵𝑵
Nix = Total number of customers interrupted over year x. Ntx = Total number of customers served over year x. Ri = Average restoration time (in hours)
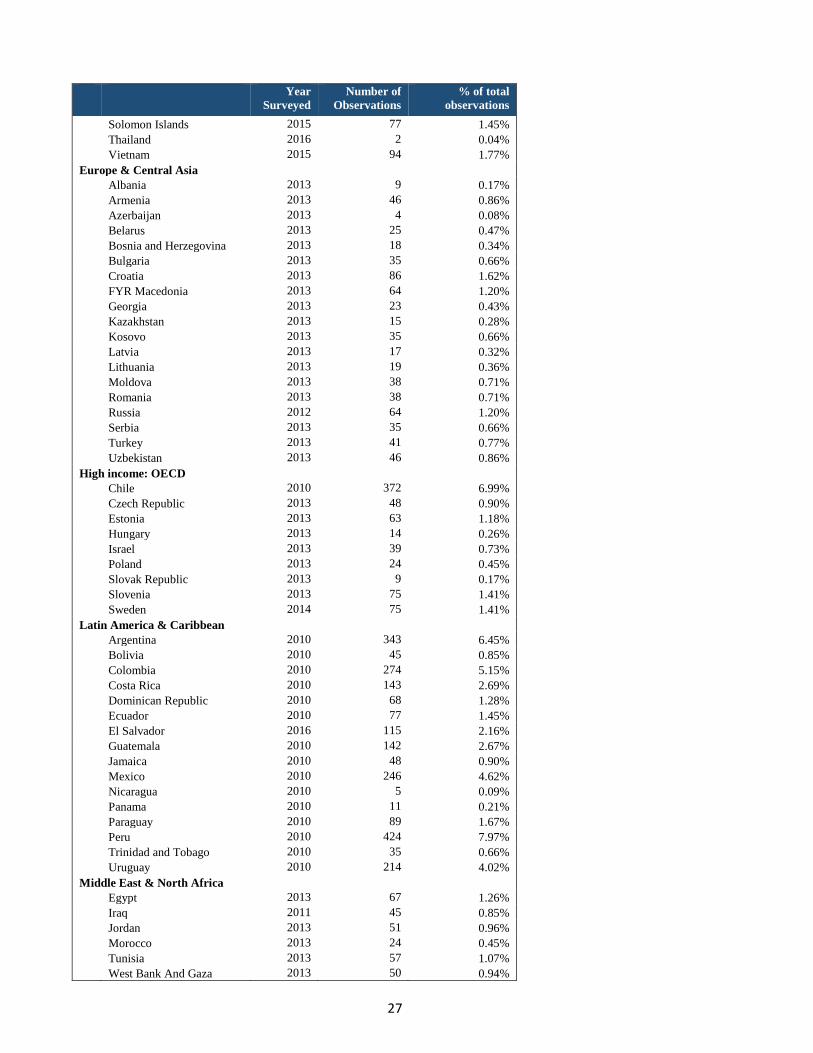
Table 7 – Enterprise Surveys Sample data Year
Surveyed Number of
Observations % of total
observations East Asia & Pacific Cambodia 2016 79 1.49%
China 2012 33 0.62% Indonesia 2015 7 0.13% Lao PDR 2016 33 0.62% Malaysia 2015 44 0.83%
Source: Doing Business database. Estimates are three year averages from 2013 to 2015 for outages. For the DTF score and tariffs, averages are from 2014 to 2016. For tariff data, the sample excludes Venezuela as it is an outlying observation due to currency conversions
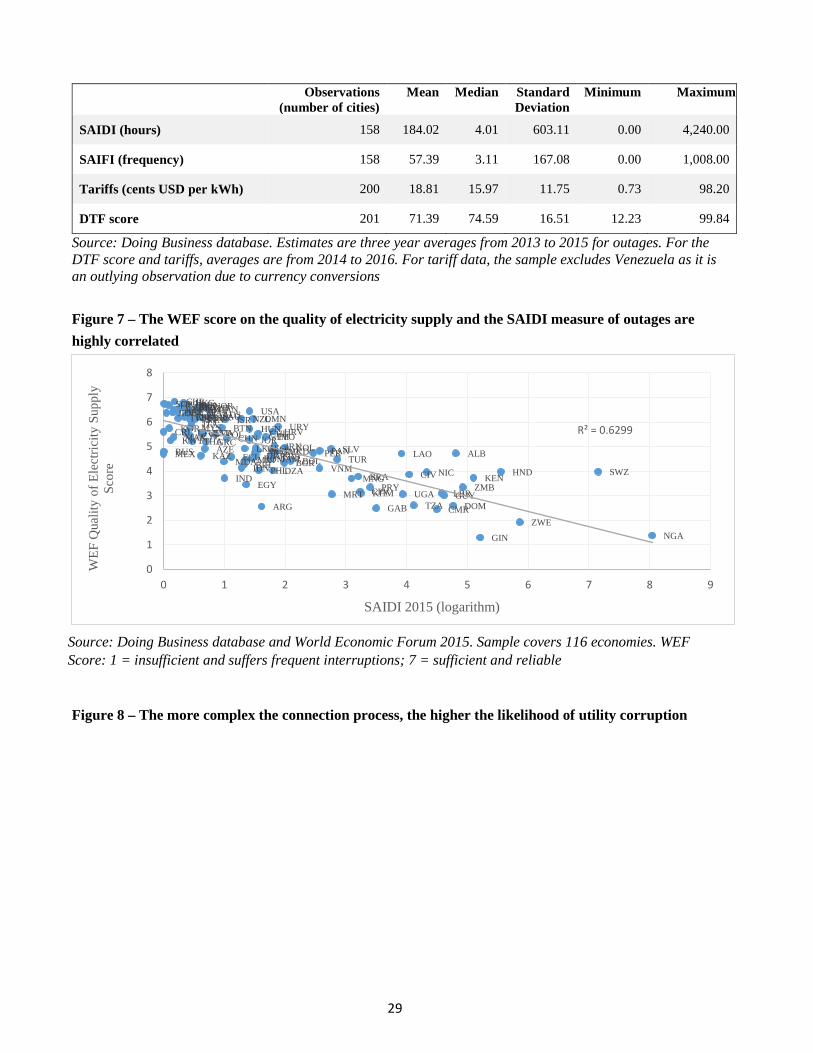
Figure 7 – The WEF score on the quality of electricity supply and the SAIDI measure of outages are highly correlated
Source: Doing Business database and World Economic Forum 2015. Sample covers 116 economies. WEF Score: 1 = insufficient and suffers frequent interruptions; 7 = sufficient and reliable
Figure 8 – The more complex the connection process, the higher the likelihood of utility corruption
ALB
DZA
ARG
ARM
AUSAUT
AZE
BHRBELBTN
BOLBIHBRA
BGR
CPVKHM
CMR
CAN
CHLCHNCOL
CRI
CIV
HRVCYP
CZEDNK
DOM
ECU
EGY
SLV
EST
FINFRA
GAB
GEO
DEU
GRC GTM
GIN
GUY
HND
HKG
HUN
ISL
INDIDN
IRN
IRLISRITA
JAM
JPN
JOR
KAZ
KEN
KORKWT
LAO
LVA
LBR
LTU
LUX
MKD
MYS
MLT
MRT
MEXMDA
MNG
MAR
NLDNZL
NIC
NGA
NOROMN
PAN
PRY
PER
PHL
POLPRT
QAT
ROMRUS
SAU
SRBSYC
SGPSVKSVNESP
LKA
SWZ
SWECHE
TWN
TZA
THA TTOTUN
TUR
UGA
UKR
AREGBR USA
URY
VNM
ZMB
ZWE
R² = 0.6299
0
1
2
3
4
5
6
7
8
0 1 2 3 4 5 6 7 8 9
WEF
Qua
lity
of E
lect
ricity
Sup
ply
Scor
e
SAIDI 2015 (logarithm)
30
Source: Doing Business database and World Economic Forum 2015. Sample of 140 economies.
Figure 9 – Average SAIFI and SAIFI (2013 to 2015): natural logarithmic distribution
Source: Doing Business data. Sample for 158 Doing Business cities. Note: 1 is added to the raw SAIDI value for the calculation of the natural logarithm of SAIDI so that that there are no negative observations which would introduce bias.
Table 10 – Correlation matrix between GE indicators and generator ownership
SAIDI (log) 2013-2015
Electricity tariffs (cents
per kWh) 2014-2016
Ease of connection
DTF score 2014-2016
Generator ownership (%of firms)
GNI per capita (log)
SAIDI (log): 2013-2015 1
Electricity tariffs (cents per kWh): 2014-2016
0.1744* 0.0423
1
Ease of connection DTF: 2014-2016
-0.5127* 0.0000
0.0919 0.2361
1
ALB
DZAARG
ARMAUS
AUT
AZE
BHR
BGD_ChitBGD
BEL
BEN
BTN
BOLBIH
BWA
BRA_RioBRA
BGR
BDI
CPVKHM
CMR
CAN
TCD
CHL
CHN_BeijCHNCOL
CRICIV
HRV
CYPCZE
DNK
DOM
ECU
EGYSLV
EST
ETH
FIN
FRA
GABGMB
GEODEU
GHA
GRC
GTM
GIN
GUY HTI
HND
HKG
HUN
ISL
IND_DelIND
IDN IDN_Sura
IRN
IRL
ISR
ITA
JAM
JPN_OsakJPN
JORKAZ
KEN
KOR
KWT
KGZ
LAO
LVA
LBNLSO
LBR
LTU
LUX
MKD
MDGMWI
MYS
MLI
MLT
MRT
MUS
MEX
MDA
MNG
MNEMAR
MOZ
MMR
NAM
NPL
NLDNZL
NIC
NGA_KanoNGA
NOR
OMN
PAKPAK_Laho
PAN
PRY
PERPHL
POLPRT
QAT
ROM
RUSRUS_Sai
RWA SAU
SEN
SRBSYC
SLE
SGP
SVK
SVN
ZAF
ESP LKASWZ
SWECHE
TWN
TJK
TZA
THA
TTOTUN
TUR
UGA
UKR
AREGBR
USA_LosaUSA
URY
VEN
VNM
ZMB
ZWE
R² = 0.3943
0
1
2
3
4
5
6
7
8
20 40 60 80 100
WEF
Util
ity B
ribe
Scor
e
DTF connection score
010
2030
40Fr
eque
ncy
0 2 4 6 8Log_Y_Average_SAIFI
010
2030
40Fr
eque
ncy
0 2 4 6 8Log_Y_Average_SAIDI
31
Generator ownership (%of firms)
0.7633* 0.0000
0.2284* 0.0111
-0.4183* 0.0000
1
GNI per capita (log) -0.6813* 0.0000
-0.1413 0.0142
0.5233* 0.0142
-0.4755* 0.0000
1
Source: Doing Business data. Entreprise Surveys 2010-2016. * p<0.05. Sample of 96 cities. Table 11 – Correlation matrix between GE indicators and electricity consumption
SAIDI (log) 2013
Electricity tariffs (cents
per kWh) 2014
Ease of connection
DTF score 2014
Electricity Consumption
(kWh per capita) 2013
GNI per capita (log)
SAIDI (log): 2013 1
Electricity tariffs (cents per kWh): 2014
0.1420 0.0907
1
Ease of connection DTF: 2014
-0.5100* 0.0000
0.1029 0.1600
1
Electricity Consumption (kWh per capita) 2013
-0.7155* 0.0000
-0.1806* 0.0375
0.5201* 0.0000
1
GNI per capita (log) -0.7349* 0.0000
-0.1138 0.0142
0.6124* 0.0142
0.8910* 0.0000
1
Source: Doing Business data. International Energy Association 2013. * p<0.05. Sample of 109 countries. Table 12 – Correlation matrix between GE indicators and predictor variables for productivity specification at the firm level
SAIDI (log) 2013-2015
Electricity tariffs (cents
per kWh) 2014-2016
Ease of connection
DTF score 2014-2016
GNI per capita
Investment – capital
input (log)
SAIDI (log): 2013-2015 1
Electricity tariffs (cents per kWh): 2014-2016
0.0864* 0.0000
1
Ease of connection DTF: 2014-2016
-0.5793* 0.0000
0.1085* 0.0000
1
GNI per capita: -0.6293* 0.0000
0.1041* 0.0155
0.5301* 0.0000
1
Investment (log) 0.0301* 0.0000
-0.0786* 0.0000
-0.0634* 0.0000
-0.1350* 0.0000
1
Source: Doing Business data and Entreprise Surveys. * p<0.05.
32
Table 13: table for specifications on firm-level productivity weighted according to ES sampling Specification with log of annual sales/employees as dependent variable
Table 15 – Getting Electricity dataset Economy City Covered Region Income group Process of connecting (average 2014-2016) Outage data (average
2013-2015) Electricity
tariffs (average
2014-2016) Connection time (days)
Procedures Cost (% of GNI)
Score (DTF)
SAIDI (hours)
SAIFI (frequency)
Cents per kWh
Afghanistan Kabul South Asia Low income 114.00 6.00 2,160.90 60.53 1,220.00 435.00 17.67 Albania Tirana ECA Upper middle income 162.67 6.00 496.43 60.32 117.36 51.42 9.77 Algeria Algiers MENA Upper middle income 180.00 5.00 1,315.47 60.00 5.65 9.02 2.80 Angola Luanda SSA Upper middle income 145.00 7.00 823.57 55.98 N/A N/A 5.63 Antigua and Barbuda St. John's LAC High income 42.00 4.00 119.77 90.47 5.34 9.05 46.47 Argentina Buenos Aires LAC High income 92.00 6.00 33.00 72.47 4.00 15.11 8.40 Armenia Yerevan ECA Lower middle income 152.00 4.00 86.73 74.67 4.48 4.62 8.47 Australia Sidney HI OECD High income 75.00 5.00 12.43 80.58 1.20 0.75 20.97 Austria Austria HI OECD High income 23.00 5.00 98.37 87.76 0.81 0.78 10.80 Azerbaijan Baku ECA Upper middle income 77.67 7.00 120.27 68.64 1.01 1.82 7.03 Bahamas, The Nassau LAC High income 67.00 5.00 142.97 81.20 N/A N/A 34.40 Bahrain Manama MENA High income 85.00 5.00 53.43 78.96 1.59 0.90 4.60 Bangladesh Chittagong South Asia Lower middle income 517.00 9.00 3,097.93 20.58 N/A N/A 9.20 Bangladesh Dhaka South Asia Lower middle income 404.00 9.00 3,381.60 19.42 N/A N/A 9.20 Barbados Bridgetown LAC High income 87.00 7.00 62.70 67.52 3.70 6.35 23.70 Belarus Minsk ECA Upper middle income 109.67 6.00 259.87 68.98 0.26 0.07 19.53 Belgium Brussels HI OECD High income 88.00 6.00 99.03 72.78 0.61 0.56 18.53 Belize Belize City LAC Upper middle income 66.00 5.00 311.27 80.65 18.05 12.98 21.47 Benin Cotonou SSA Low income 90.00 5.00 13,841.23 45.12 N/A N/A 23.03 Bhutan Thimphu South Asia Lower middle income 64.33 4.00 552.77 85.45 1.31 1.41 5.10 Bolivia La Paz LAC Lower middle income 42.00 8.00 754.43 65.64 7.98 11.45 15.67 Bosnia and Herzegovina Sarajevo ECA Upper middle income 125.00 8.00 434.30 54.93 4.08 0.97 13.17 Botswana Gaborone SSA Upper middle income 91.67 5.00 320.57 76.89 N/A N/A 13.83 Brazil Rio de Janeiro Rio de Janeiro LAC Upper middle income 56.67 4.00 37.83 88.68 14.42 7.10 17.20 Brazil Sao Paulo LAC Upper middle income 53.00 4.00 40.47 89.21 14.99 5.39 14.33
Brunei Darussalam Bandar Seri Begawan EAP High income 56.00 4.67 44.30 83.20 1.70 0.77 5.67
Bulgaria Sofia ECA Upper middle income 130.00 6.00 325.80 65.76 6.54 4.75 10.83
35
Economy City Covered Region Income group Process of connecting (average 2014-2016) Outage data (average 2013-2015)
Electricity tariffs
(average 2014-2016)
Connection time (days)
Procedures Cost (% of GNI)
Score (DTF)
SAIDI (hours)
SAIFI (frequency)
Cents per kWh
Burkina Faso Ouagadougou SSA Low income 165.33 4.00 10,434.10 39.76 222.83 169.96 27.33 Burundi Bujumbura SSA Low income 158.00 5.00 16,533.40 35.27 660.00 330.00 11.43 Cabo Verde Praia SSA Lower middle income 88.00 7.00 973.53 63.63 33.55 19.73 34.23 Cambodia Phnom Penh EAP Lower middle income 179.00 4.00 2,334.60 61.50 63.29 48.47 18.53 Cameroon Douala SSA Lower middle income 64.00 4.00 1,622.20 81.10 106.87 29.33 19.93 Canada Toronto HI OECD High income 138.67 7.00 127.63 59.76 1.07 1.43 13.67 Central African Republic Bangui SSA Low income 99.33 7.00 16,122.93 32.66 N/A N/A 11.37 Chad N'Djamena SSA Low income 67.00 6.00 7,954.97 44.08 N/A N/A 25.27 Chile Santiago HI OECD High income 43.00 6.00 68.30 79.43 3.85 1.58 10.13 China Beijing EAP Upper middle income 141.00 6.00 421.27 63.77 1.24 0.57 14.10 China Shanghai EAP Upper middle income 145.00 5.00 420.83 68.75 1.51 0.23 14.60 Colombia Bogota LAC Upper middle income 106.67 5.00 520.40 73.90 6.57 6.86 14.57 Comoros Comoros SSA Low income 120.00 3.00 2,261.93 75.91 4,240.00 970.00 31.13 Congo, Dem. Rep. Kinshasa SSA Low income 58.33 6.00 15,385.63 44.15 51.70 35.10 11.57 Congo, Rep. Brazzaville SSA Lower middle income 135.00 6.00 4,950.47 46.00 N/A N/A 11.53 Costa Rica San Jose LAC Upper middle income 48.33 5.00 190.10 83.71 0.00 0.00 25.13 Côte d'Ivoire Abidjan SSA Lower middle income 57.67 8.00 2,665.93 55.50 48.44 28.89 12.87 Croatia Zagreb ECA High income 68.33 5.00 312.33 80.31 5.87 1.89 17.67 Cyprus Nicosia ECA High income 160.33 5.00 137.67 67.69 1.15 0.38 21.37 Czech Republic Prague HI OECD High income 70.00 4.00 27.20 86.80 0.54 0.32 15.60 Denmark Copenhagen HI OECD High income 38.00 4.00 112.37 91.08 0.41 0.45 17.23 Djibouti Djibouti City MENA Lower middle income 125.00 4.00 6,651.67 51.56 N/A N/A 23.00 Dominica Roseau LAC Upper middle income 61.00 5.00 474.60 80.70 1.03 0.35 38.80 Dominican Republic Santo Domingo LAC Upper middle income 77.00 7.00 267.00 68.13 125.27 36.43 23.83 Ecuador Quito LAC Upper middle income 74.00 7.00 610.63 67.15 4.19 5.44 9.50 Egypt, Arab Rep. Cairo MENA Lower middle income 54.00 6.00 274.13 76.99 20.15 3.00 11.07 El Salvador San Salvador LAC Lower middle income 61.00 8.00 534.30 63.79 14.63 6.88 18.17 Equatorial Guinea Malabo SSA Upper middle income 106.00 5.00 753.23 73.04 N/A N/A 22.67 Eritrea Asmara SSA Low income 59.00 5.00 2,825.87 71.32 2,470.00 734.67 22.50
36
Economy City Covered Region Income group Process of connecting (average 2014-2016) Outage data (average 2013-2015)
Electricity tariffs
(average 2014-2016)
Connection time (days)
Procedures Cost (% of GNI)
Score (DTF)
SAIDI (hours)
SAIFI (frequency)
Cents per kWh
Estonia Tallinn HI OECD High income 91.00 5.00 166.47 77.62 0.90 0.44 11.03 Ethiopia Addis Ababa SSA Low income 95.00 4.00 1,443.43 77.34 N/A N/A 4.60 Fiji Suva EAP Upper middle income 81.00 4.00 1,651.70 78.52 9.02 9.33 23.63 Finland Helsinki HI OECD High income 42.00 5.00 28.93 85.29 0.14 0.34 14.47 France Paris HI OECD High income 71.00 5.00 41.67 81.04 0.26 0.25 14.33 Gabon Libreville SSA Upper middle income 148.00 7.00 1,075.33 54.51 34.37 57.94 22.00 Gambia, The Banjul SSA Low income 78.00 5.00 3,955.00 63.92 N/A N/A 26.03 Georgia Tbilisi ECA Upper middle income 71.00 4.00 439.87 84.95 3.73 2.00 8.63 Germany Berlin HI OECD High income 28.00 3.00 42.40 98.38 0.21 0.23 28.10 Ghana Accra SSA Lower middle income 79.00 4.00 1,524.80 79.33 N/A N/A 23.93 Greece Athens HI OECD High income 51.00 6.00 69.87 78.26 1.57 1.30 17.30 Grenada St. George's LAC Upper middle income 38.00 5.00 215.63 85.10 2.89 3.97 31.17 Guatemala Guatemala City LAC Lower middle income 39.00 4.00 497.17 89.36 3.87 2.74 17.40 Guinea Conakry SSA Low income 69.00 4.00 6,839.67 58.91 2,657.95 321.12 16.87 Guinea-Bissau Bissau SSA Low income 455.00 7.00 1,784.77 37.10 N/A N/A 30.63 Guyana Georgetown LAC Upper middle income 92.00 8.00 419.80 59.77 84.15 97.67 30.53 Haiti Port au Price LAC Low income 60.00 4.00 3,614.47 73.48 N/A N/A 34.33 Honduras Tegucigalpa LAC Lower middle income 39.00 7.00 851.60 71.23 257.00 19.41 20.43 Hong Kong SAR, China Hong Kong EAP High income 31.00 3.67 1.47 94.41 0.43 0.18 15.27 Hungary Budapest HI OECD High income 253.67 5.00 101.27 55.14 3.15 1.46 18.90 Iceland Iceland HI OECD High income 22.00 4.00 11.77 93.82 0.38 0.37 8.87 India Delhi South Asia Lower middle income 101.33 5.67 599.67 70.64 12.99 4.80 18.70 India Mumbai South Asia Lower middle income 51.67 5.67 77.83 79.99 2.08 3.63 25.30 Indonesia Jakarta EAP Lower middle income 73.33 5.00 366.67 79.36 3.50 2.41 12.97 Indonesia Surabaya EAP Lower middle income 70.33 4.67 366.67 81.65 2.42 2.11 13.20 Iran, Islamic Rep. Teheran MENA Upper middle income 88.00 6.00 839.20 69.73 5.67 4.94 8.10 Iraq Baghdad MENA Upper middle income 72.00 6.00 239.67 74.52 2,352.00 1,008.00 10.03 Ireland Dublin HI OECD High income 85.00 5.00 72.00 78.88 0.26 0.16 22.97 Israel Tel Aviv HI OECD High income 102.00 6.00 12.70 71.11 2.58 2.82 14.13
37
Economy City Covered Region Income group Process of connecting (average 2014-2016) Outage data (average 2013-2015)
Electricity tariffs
(average 2014-2016)
Connection time (days)
Procedures Cost (% of GNI)
Score (DTF)
SAIDI (hours)
SAIFI (frequency)
Cents per kWh
Italy Rome HI OECD High income 124.00 4.00 161.10 78.42 0.62 2.18 23.63 Jamaica Kingston LAC Upper middle income 95.00 7.00 247.60 65.60 2.51 2.67 30.03 Japan Tokyo HI OECD High income 105.00 4.00 0.00 87.39 0.12 0.11 28.70 Japan Osaka HI OECD High income 84.00 3.00 0.00 84.88 0.63 0.02 20.57 Jordan Amman MENA Upper middle income 50.00 5.00 314.73 82.96 4.03 2.08 23.90 Kazakhstan Almaty ECA Upper middle income 85.33 7.00 54.50 67.80 1.01 1.70 9.57 Kenya Nairobi SSA Lower middle income 117.33 3.67 795.23 78.63 614.50 28.33 20.77 Kiribati Tarawa EAP Lower middle income 97.00 6.00 4,413.37 53.72 N/A N/A 51.53 Korea, Rep. Seoul HI OECD High income 18.00 3.00 39.73 99.84 0.06 0.07 9.70 Kosovo Pristina ECA Lower middle income 39.33 7.00 447.80 72.84 67.23 36.23 14.93 Kuwait Kuwait City MENA High income 64.00 8.00 54.70 65.33 1.24 0.65 0.73 Kyrgyz Republic Bishkek ECA Lower middle income 125.00 7.00 918.23 58.49 N/A N/A 3.70 Lao PDR Vientiane EAP Lower middle income 134.00 6.00 1,532.83 60.21 49.28 9.42 10.93 Latvia Riga ECA High income 107.00 4.00 298.13 80.32 2.22 1.92 17.23 Lebanon Beirut MENA Upper middle income 75.00 5.00 100.63 80.21 N/A N/A 13.23 Lesotho Maseru SSA Lower middle income 114.00 5.00 1,565.83 68.53 N/A N/A 14.83 Liberia Monrovia SSA Low income 465.00 4.00 3,863.70 45.21 68.23 22.60 54.20 Libya Tripoli MENA Upper middle income 118.00 4.00 333.03 78.58 1,799.45 576.48 16.87 Lithuania Vilniaus ECA High income 105.00 6.00 47.33 70.53 0.39 0.37 14.47 Luxembourg Luxembourg HI OECD High income 56.00 5.00 38.83 83.22 0.27 0.26 14.17 Macedonia, FYR Skopje ECA Upper middle income 98.33 3.00 232.10 87.40 8.99 14.88 17.87 Madagascar Antananarivo SSA Low income 450.00 6.00 6,165.97 24.63 N/A N/A 14.63 Malawi Blantyre SSA Low income 142.00 6.00 4,505.97 46.82 N/A N/A 14.47 Malaysia Kuala Lumpur EAP Upper middle income 31.00 4.00 27.37 92.45 0.56 0.51 15.50 Maldives Maldives South Asia Upper middle income 91.00 6.00 336.67 71.37 N/A N/A 34.13 Mali Bamako SSA Low income 120.00 4.00 3,432.47 65.54 168.00 62.50 15.80 Malta Malta MENA High income 126.00 5.00 419.97 71.51 3.65 3.16 23.67 Marshall Islands Marshall Islands EAP Upper middle income 67.00 5.00 722.23 78.82 113.00 47.00 43.63 Mauritania Nouakchott SSA Lower middle income 70.67 5.00 5,055.00 60.45 21.00 23.33 21.43
38
Economy City Covered Region Income group Process of connecting (average 2014-2016) Outage data (average 2013-2015)
Electricity tariffs
(average 2014-2016)
Connection time (days)
Procedures Cost (% of GNI)
Score (DTF)
SAIDI (hours)
SAIFI (frequency)
Cents per kWh
Mauritius Port Louis SSA Upper middle income 81.00 4.00 261.57 84.24 N/A N/A 25.73 Mexico Mexico City LAC Upper middle income 117.33 7.00 359.83 61.90 0.59 1.28 12.87 Mexico Monterrey LAC Upper middle income 47.33 6.00 234.73 78.12 0.01 0.33 9.57 Micronesia, Fed. Sts. Pohnpei EAP Lower middle income 105.00 3.00 376.87 85.84 N/A N/A 45.03 Moldova Chisinau ECA Lower middle income 104.33 6.67 793.77 63.85 2.06 1.90 10.63 Mongolia Ulan Bator EAP Lower middle income 79.00 8.00 566.67 61.05 33.33 12.85 7.13 Montenegro Podgorica ECA Upper middle income 142.00 7.00 461.10 57.91 N/A N/A 10.93 Morocco Casablanca MENA Lower middle income 53.33 5.00 1,881.13 76.03 0.18 0.83 12.47 Mozambique Maputo SSA Low income 91.00 7.00 2,406.20 57.30 N/A N/A 7.53 Myanmar Yangon EAP Lower middle income 84.00 6.00 1,823.37 66.26 N/A N/A 11.60 Namibia Windhoek SSA Upper middle income 37.00 6.00 362.00 79.09 N/A N/A 17.97 Nepal Kathmandu South Asia Low income 70.00 5.00 1,153.97 76.60 N/A N/A 11.57 Netherlands Amsterdam HI OECD High income 110.00 5.00 31.27 75.43 0.40 0.35 11.77 New Zealand Auckland HI OECD High income 60.00 5.00 76.63 82.49 2.18 1.43 13.77 Nicaragua Managua LAC Lower middle income 55.00 6.00 949.43 74.06 76.83 40.27 35.07 Niger Niamey SSA Low income 115.00 4.00 5,855.55 55.19 239.33 159.56 24.77 Nigeria Kano SSA Lower middle income 186.00 9.00 446.17 40.48 1,665.67 185.00 19.83 Nigeria Lagos SSA Lower middle income 198.00 9.00 446.17 38.74 3,433.33 540.00 20.83 Norway Oslo HI OECD High income 66.00 4.00 11.57 87.44 1.40 1.73 11.30 Oman Muscat MENA High income 62.00 6.00 64.83 76.69 3.39 2.29 5.50 Pakistan Lahore South Asia Lower middle income 117.00 5.00 1,453.07 63.03 999.56 425.37 19.20 Pakistan Karachi South Asia Lower middle income 215.00 6.00 1,446.97 54.36 877.31 391.07 19.97 Palau Koror EAP Upper middle income 125.00 5.00 73.77 73.08 135.00 45.33 31.13 Panama Panama City LAC Upper middle income 35.00 5.00 9.53 86.39 4.98 3.75 24.60 Papua New Guinea Port Moresby EAP Lower middle income 66.00 4.00 46.47 87.30 175.28 128.67 40.03 Paraguay Asuncion LAC Upper middle income 67.00 5.00 156.70 81.14 20.24 18.47 6.47 Peru Lima LAC Upper middle income 67.00 5.00 328.50 80.44 9.09 4.33 13.97 Philippines Quezon city EAP Lower middle income 42.00 4.00 28.60 90.85 5.40 3.11 19.00 Poland Warsaw HI OECD High income 136.33 4.00 19.77 77.21 1.44 1.48 14.87
39
Economy City Covered Region Income group Process of connecting (average 2014-2016) Outage data (average 2013-2015)
Electricity tariffs
(average 2014-2016)
Connection time (days)
Procedures Cost (% of GNI)
Score (DTF)
SAIDI (hours)
SAIFI (frequency)
Cents per kWh
Portugal Lisbon HI OECD High income 45.00 7.00 38.70 73.71 0.58 0.74 25.20 Puerto Rico (U.S.) San Juan LAC High income 32.00 5.00 348.97 85.42 8.40 4.53 25.90 Qatar Doha MENA High income 90.00 4.00 9.53 83.97 0.69 0.33 3.87 Romania Bucharest ECA Upper middle income 172.00 8.00 579.43 47.52 3.41 3.41 8.77 Russian Federation Moscow ECA Upper middle income 154.00 3.33 126.37 77.92 0.01 0.01 11.30 Russian Federation Saint Petersburg ECA Upper middle income 192.00 3.33 165.70 72.25 0.01 0.00 10.23 Rwanda Kigali SSA Low income 34.00 4.00 2,909.50 80.15 N/A N/A 18.73 Samoa Apia EAP Lower middle income 34.00 4.00 667.03 89.38 25.25 23.33 39.87 San Marino San Marino ECA High income 45.00 3.00 59.27 95.84 0.41 2.03 15.47 São Tomé and Príncipe São Tomé SSA Lower middle income 89.00 4.00 894.70 80.47 N/A N/A 34.20 Saudi Arabia Riyadh MENA High income 61.00 4.00 27.70 88.10 1.24 0.89 6.87 Senegal Dakar SSA Low income 90.00 6.67 4,439.13 50.93 N/A N/A 22.33 Serbia Belgrade ECA Upper middle income 129.00 4.67 310.37 73.38 4.21 3.59 12.90 Seychelles Seychelles SSA High income 137.00 6.00 393.23 64.47 4.52 1.61 36.63 Sierra Leone Free Town SSA Low income 82.00 8.00 4,240.43 45.50 N/A N/A 29.50 Singapore Singapore EAP High income 30.67 4.00 26.10 92.50 0.01 0.01 12.07 Slovak Republic Bratislava HI OECD High income 121.00 5.00 54.77 73.74 0.89 0.67 15.30 Slovenia Ljubljana HI OECD High income 38.00 5.00 114.10 85.52 3.33 2.14 13.97 Solomon Islands Honiara EAP Lower middle income 53.00 4.00 1,399.87 83.61 6.24 7.40 98.20 Somalia Mogadishu SSA Low income N/A N/A N/A N/A N/A N/A 65.00 South Africa Johannesburg SSA Upper middle income 131.33 4.33 349.00 74.73 64.28 N/A 11.53 South Sudan Juba SSA Low income 468.00 6.00 3,236.90 12.23 1,200.00 633.33 37.07 Spain Madrid HI OECD High income 115.33 7.00 224.03 62.75 0.37 0.56 21.37 Sri Lanka Colombo South Asia Lower middle income 101.33 5.00 821.07 73.43 6.17 6.13 21.53 St. Kitts and Nevis Basseterre LAC High income 18.00 4.00 265.47 93.35 N/A N/A 33.40 St. Lucia Castries LAC Upper middle income 26.00 5.33 194.17 85.08 0.44 0.40 34.23 St. Vincent and the Grenadines Kingstown LAC Upper middle income 52.00 3.00 56.90 94.84 N/A N/A 33.57
Economy City Covered Region Income group Process of connecting (average 2014-2016) Outage data (average 2013-2015)
Electricity tariffs
(average 2014-2016)
Connection time (days)
Procedures Cost (% of GNI)
Score (DTF)
SAIDI (hours)
SAIFI (frequency)
Cents per kWh
Suriname Paramaribo LAC Upper middle income 113.00 4.00 479.23 78.70 14.90 7.67 7.13 Swaziland Mbabane SSA Lower middle income 137.00 6.00 940.53 62.22 1,390.92 677.73 18.07 Sweden Stockholm HI OECD High income 52.00 3.00 33.93 94.93 1.46 1.07 13.00 Switzerland Zurich HI OECD High income 39.00 3.00 58.43 96.72 0.18 0.13 16.17 Syrian Arab Republic Damascus MENA Lower middle income 95.00 5.00 484.40 75.74 N/A N/A 12.73 Taiwan, China Taipei EAP High income 22.67 3.00 43.27 99.15 0.29 0.25 13.60 Tajikistan Dushanbe ECA Lower middle income 133.00 9.00 854.77 46.48 N/A N/A 7.50 Tanzania Dar Es Salaam SSA Low income 109.00 4.00 1,140.67 76.56 69.44 61.28 16.13 Thailand Bangkok EAP Upper middle income 37.00 5.00 45.27 85.95 0.72 1.55 16.27 Timor-Leste Dili EAP Lower middle income 73.00 3.00 849.43 88.53 N/A N/A 23.13 Togo Lomé SSA Low income 73.67 3.33 5,593.63 67.06 N/A N/A 20.97 Tonga Nukualofa EAP Lower middle income 42.00 5.00 91.53 85.03 18.45 14.12 42.33 Trinidad and Tobago Port Of Spain LAC High income 61.00 4.00 127.40 87.69 5.14 4.55 7.20 Tunisia Tunis MENA Lower middle income 65.00 4.00 704.33 84.73 2.98 2.45 10.30 Turkey Istanbul ECA Upper middle income 65.33 4.00 550.07 85.32 12.14 6.21 14.13 Uganda Kampala SSA Low income 94.67 6.00 9,494.80 38.89 55.04 30.90 20.97 Ukraine Kiev ECA Lower middle income 269.00 5.00 771.87 52.38 5.00 2.13 11.73 United Arab Emirates Dubai MENA High income 31.67 3.00 24.13 97.92 0.42 0.19 11.50 United Kingdom London HI OECD High income 79.00 4.00 27.23 85.49 0.44 0.22 15.37 United States New York City HI OECD High income 60.00 6.00 40.80 88.30 1.65 0.42 18.97 United States Los Angeles HI OECD High income 134.00 4.00 14.23 66.35 1.93 0.69 17.43 Uruguay Montevideo LAC High income 48.00 5.00 13.33 84.49 5.60 3.12 19.77 Uzbekistan Tashkent ECA Lower middle income 89.00 7.00 1,437.90 61.57 0.34 0.10 6.37 Vanuatu Port Vila EAP Lower middle income 120.00 4.00 1,159.43 74.89 3.34 7.76 41.53 Venezuela, RB Caracas LAC Upper middle income 188.00 6.00 7,121.53 44.16 N/A N/A 937.80 Vietnam Ho Chi Minh City EAP Lower middle income 70.00 5.33 1,338.90 73.99 22.10 11.21 11.73 West Bank and Gaza Ramallah MENA Lower middle income 58.33 5.00 1,423.17 77.19 12.25 11.73 16.67 Yemen, Rep. Sanna MENA Lower middle income 110.00 4.00 3,492.60 22.25 N/A N/A 10.00 Zambia Lusaka SSA Lower middle income 117.00 6.00 696.97 66.12 82.36 9.21 4.37
41
Economy City Covered Region Income group Process of connecting (average 2014-2016) Outage data (average 2013-2015)