Page 1
© 2012 Chubu Electric Power Co., Inc. All rights reserved.
Electricity Technology Options Assessment Guide (ETOAG)
ETOAG Report
World Bank Washington D.C. June 2012
ECONOMIC CONSULTING ASSOCIATES LIMITED
CHUBU ELECTRIC POWER CO. INC.
Page 2
© 2012 Chubu Electric Power Co., Inc. All rights reserved.
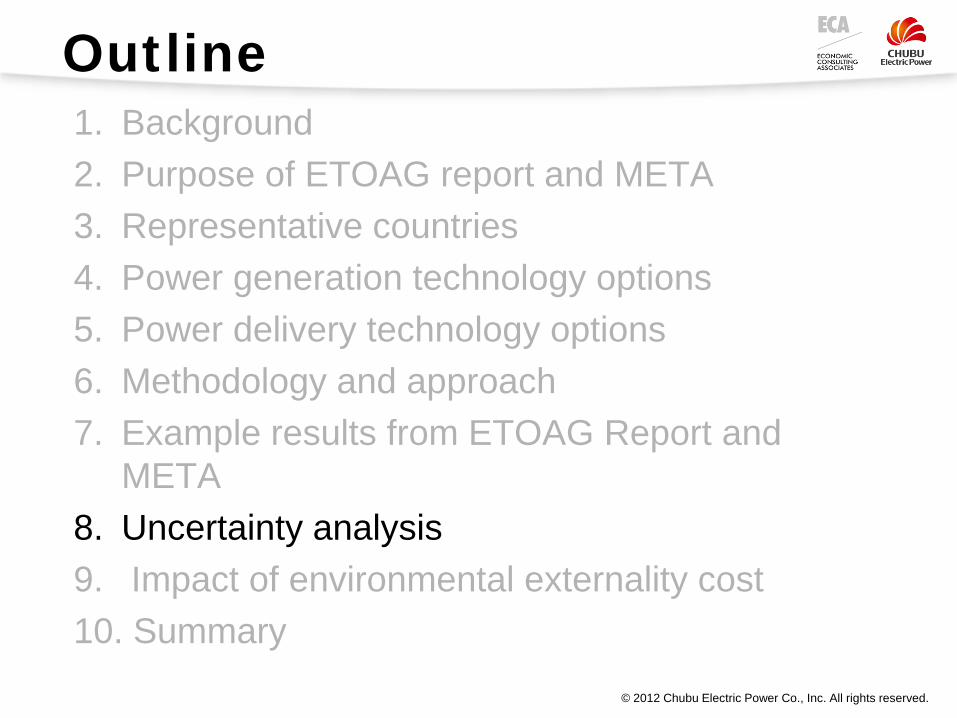
Outline 1. Background 2. Purpose of ETOAG report and META 3. Representative countries 4. Power generation technology options 5. Power delivery technology options 6. Methodology and approach 7. Example results from ETOAG Report and
META 8. Uncertainty analysis 9. Impact of environmental externality cost 10. Summary
Page 3
© 2012 Chubu Electric Power Co., Inc. All rights reserved.
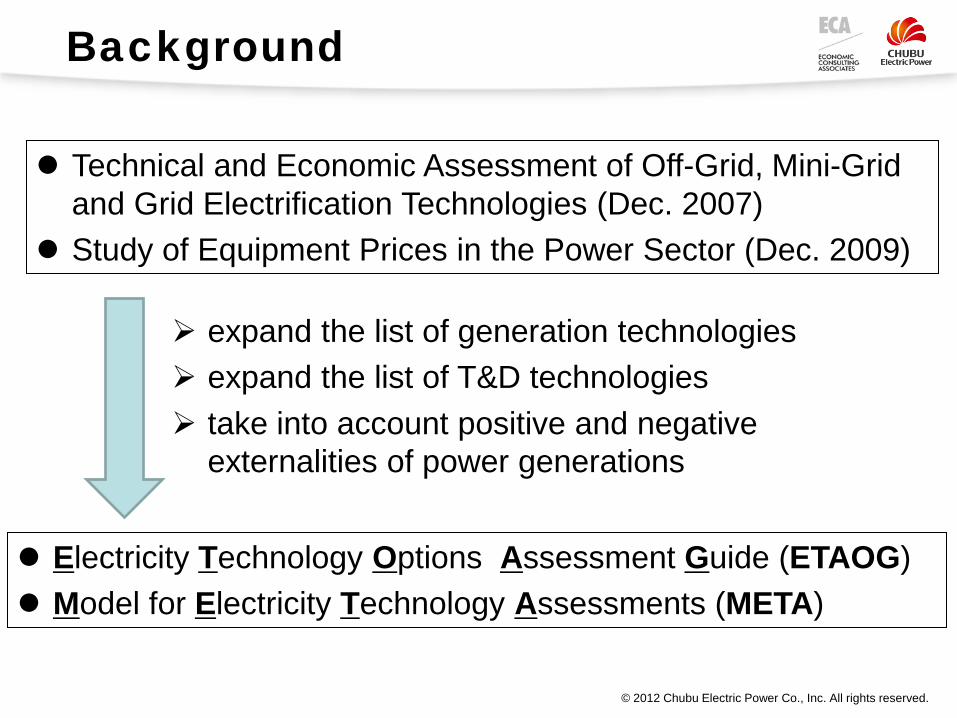
Background
Electricity Technology Options Assessment Guide (ETAOG) Model for Electricity Technology Assessments (META)
Technical and Economic Assessment of Off-Grid, Mini-Grid and Grid Electrification Technologies (Dec. 2007)
Study of Equipment Prices in the Power Sector (Dec. 2009)
expand the list of generation technologies expand the list of T&D technologies take into account positive and negative
externalities of power generations
Page 4
© 2012 Chubu Electric Power Co., Inc. All rights reserved.
The purpose of ETOAG and META
The main purpose of ETOAG and META is to provide information and a tool that allows users to evaluate electricity technology options
ETOAG and META provide Guide to the technologies and the capital, fuel and
operating costs of each of the technologies Generic estimates of the levelized cost per kWh of
generating electricity and of electricity transmission and distribution
Curve showing levelized cost per kWh for a range of capacity factors from 10% to 90%.
Page 5
© 2012 Chubu Electric Power Co., Inc. All rights reserved.
Representative countries
Country Broad Category
India Developing
Romania Middle-income
USA Large developed
Page 6
© 2012 Chubu Electric Power Co., Inc. All rights reserved.
Outline 1. Background 2. Purpose of ETOAG report and META 3. Representative countries 4. Power generation technology options 5. Power delivery technology options 6. Methodology and approach 7. Example results from ETOAG Report and
META 8. Uncertainty analysis 9. Impact of environmental externality cost 10. Summary
Page 7
© 2012 Chubu Electric Power Co., Inc. All rights reserved.
Power generation technology options
Various power generation technologies Different technologies
Solar, Wind, Hydro, Thermal, Nuclear etc. Different sizes
Unit size range of 50W to 1,350MW
Grid types Off-grid, Mini-grid and Grid Connected
Page 8
© 2012 Chubu Electric Power Co., Inc. All rights reserved.
Renewable Energy Generation Technology options
Generating types
Off-grid Mini-grid Grid-connected 10W 100W 1kW 10kW 100kW 1MW 10MW 100MW 1GW
Solar PV
Wind
PV-Wind Hybrids
Concentrated Solar Power
Geothermal
Biomass MSW
Biogas Landfill Gas
Hydro
Energy Storage
● ● ● ●
● ● ● ●
● on-shore on-shore on-shore
off-shore
● ● ● with storage
● without storage
● ● ● binary
dual flush
●
●
● ● ● ● ● pico micro mini
large ● pumped storage
binary
● lead acid battery
● NaS
Page 9
© 2012 Chubu Electric Power Co., Inc. All rights reserved.
Thermal Power Generation and Nuclear Generation Technology Options
Generating types
Off-grid Mini-grid Grid-connected 10W 100W 1kW 10kW 100kW 1MW 10MW 100MW 1GW
Reciprocating engine
Micro gas turbine
Fuel cell
Gas turbine
Coal fired
IGCC
Coal CFB
Oil/Gas Steam
Nuclear
● ● ● ● gasoline generator
diesel generator gas generator
●
●
● ●
● ● ● ● ● simple cycle
combined cycle
● subcritical
● supercritical with CCS, w/o CCS and USC
● with CCS, w/o CCS
● ●
subcritical supercritical
● oil ● gas
● ●
PWR
ABWR ● PHWR
●
Page 10
© 2012 Chubu Electric Power Co., Inc. All rights reserved.
Outline 1. Background 2. Purpose of ETOAG report and META 3. Representative countries 4. Power generation technology options 5. Power delivery technology options 6. Methodology and approach 7. Example results from ETOAG Report and
META 8. Uncertainty analysis 9. Impact of environmental externality cost 10. Summary
Page 11
© 2012 Chubu Electric Power Co., Inc. All rights reserved.
Power delivery technology options
Transmission technologies include a range of transmission voltages and substation voltages.
Average distribution costs per kWh for each
country are estimated.
Country Transmission voltage
300 ~ 500kV 200kV ~ 100kV ~ India 400kV 220kV 132kV
Romania 400kV 220kV 110kV USA 345, 500kV 230kV 138kV
Page 12
© 2012 Chubu Electric Power Co., Inc. All rights reserved.
Customer
Power Station
Distribution system
Generator
Customer
New Transmission line
Power Station
Grid applications
Off-grid Mini-grid
Grid Connected
Page 13
© 2012 Chubu Electric Power Co., Inc. All rights reserved.
Outline 1. Background 2. Purpose of ETOAG report and META 3. Representative countries 4. Power generation technology options 5. Power delivery technology options 6. Methodology and approach 7. Example results from ETOAG Report and
META 8. Uncertainty analysis 9. Impact of environmental externality cost 10. Summary
Page 14
© 2012 Chubu Electric Power Co., Inc. All rights reserved.
ETOAG – comprehensive guide & database
Brief description of technology (e.g., Coal-fired) Design assumptions (capacity, life, storage
capacity) Technology development status and prospects Levelized cost per kWh for each technology
Coal
Coal Pulverizer
Steam boiler
Steam turbine
Generator Stack
Gas
-gas
hea
ter
De-SOx system
Electrostatic precipitator
Air preheater
De-NOx system
Page 15
© 2012 Chubu Electric Power Co., Inc. All rights reserved.
Fundamental approach
1. Collected cost and performance data from published documents, websites and Chubu's internal database
2. Calculated capital cost, O&M cost, fuel cost, environmental externality cost, and levelized cost per kWh in 2010 US$ price level
3. Project capital costs normalized to standard cost of generic plants using regression analysis
Page 16
© 2012 Chubu Electric Power Co., Inc. All rights reserved.
Normalization of capital cost
Regression Curve for Capital Cost of Combined Cycle Plant in USA
Page 17
© 2012 Chubu Electric Power Co., Inc. All rights reserved.
Major economic & design premises
Environmental control technologies Report/META take as an assumption that power
generation plants comply with the stricter of the local environmental regulations or the World Bank environmental guidelines.
The capital and operating costs and performance parameters include environmental control technologies.
- FGD (Fuel-gas desulfurization) - SCR (Selective catalytic reduction) The User of META has the option to remove FGD and
SCR and may evaluate the results.
Page 18
© 2012 Chubu Electric Power Co., Inc. All rights reserved.
Major economic & design premises
Environmental externality costs Report/META incorporates the cost of environmental
externalities from emissions of CO2, SO2, NOx and PM10.
Report/META do not consider all potential externality costs; e.g., habitat and biodiversity loss due to changes to river flows (hydropower), disruption of migrating birdlife due to windfarms.
Users of META have the option to add a premium to the capital and operating costs in order to reflect their assessment of impacts.
Page 19
© 2012 Chubu Electric Power Co., Inc. All rights reserved.
Major economic & design premises
Overnight costs Report/META use overnight costs in order to avoid the
impact of project specific financing cost. The user can use META to calculate and add IDC to
the overnight cost along with financing expenses
Page 20
© 2012 Chubu Electric Power Co., Inc. All rights reserved.
Outline 1. Background 2. Purpose of ETOAG report and META 3. Representative countries 4. Power generation technology options 5. Power delivery technology options 6. Methodology and approach 7. Example results from ETOAG Report and
META 8. Uncertainty analysis 9. Impact of environmental externality cost 10. Summary
Page 21
© 2012 Chubu Electric Power Co., Inc. All rights reserved.
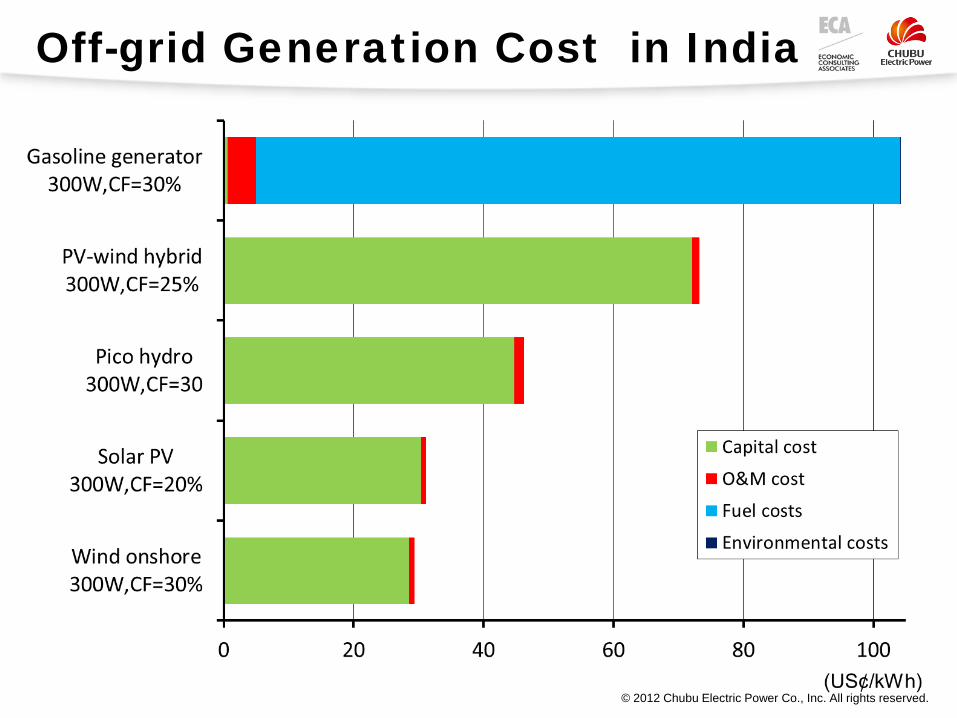
Off-grid Generation Cost in India
Page 22
© 2012 Chubu Electric Power Co., Inc. All rights reserved.
Mini-grid Generation Cost in India
Page 23
© 2012 Chubu Electric Power Co., Inc. All rights reserved.
Grid-connected Generation Cost in USA
Page 24
© 2012 Chubu Electric Power Co., Inc. All rights reserved.
Screening curve analysis for USA
Page 25
© 2012 Chubu Electric Power Co., Inc. All rights reserved.
Outline 1. Background 2. Purpose of ETOAG report and META 3. Representative countries 4. Power generation technology options 5. Power delivery technology options 6. Methodology and approach 7. Example results from ETOAG Report and
META 8. Uncertainty analysis 9. Impact of environmental externality cost 10. Summary
Page 26
© 2012 Chubu Electric Power Co., Inc. All rights reserved.
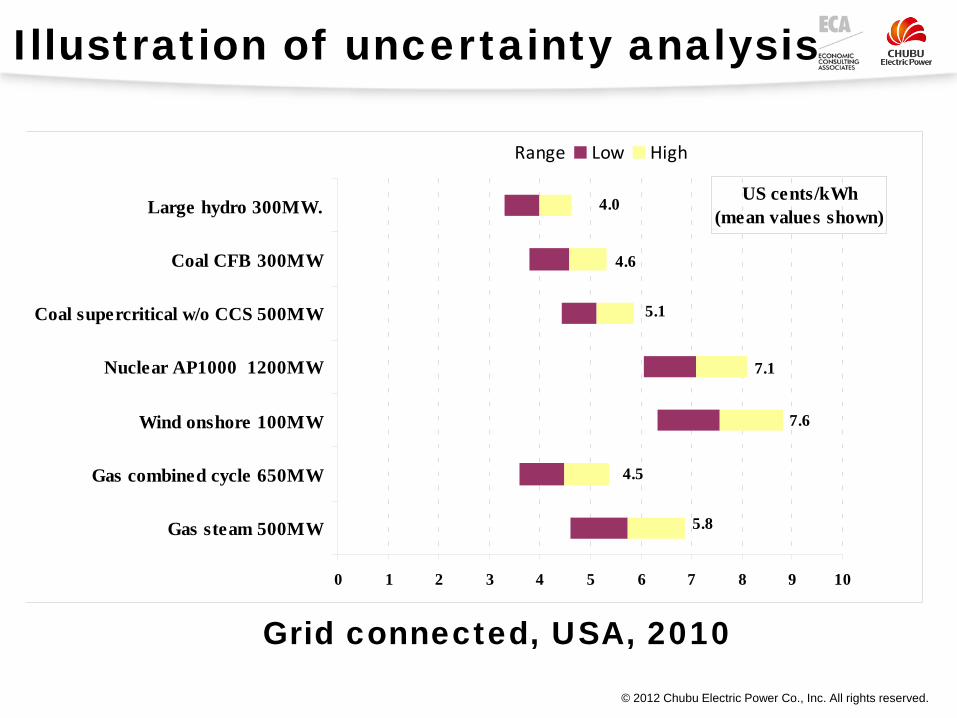
5.8
4.5
7.6
7.1
5.1
4.6
4.0
0 1 2 3 4 5 6 7 8 9 10
Gas steam 500MW
Gas combined cycle 650MW
Wind onshore 100MW
Nuclear AP1000 1200MW
Coal supercritical w/o CCS 500MW
Coal CFB 300MW
Large hydro 300MW.US cents/kWh
(mean values shown)
Range Low High
Grid connected, USA, 2010
Illustration of uncertainty analysis
Page 27
© 2012 Chubu Electric Power Co., Inc. All rights reserved.
Outline 1. Background 2. Purpose of ETOAG report and META 3. Representative countries 4. Power generation technology options 5. Power delivery technology options 6. Methodology and approach 7. Example results from ETOAG Report and
META 8. Uncertainty analysis 9. Impact of environmental externality cost 10. Summary
Page 28
© 2012 Chubu Electric Power Co., Inc. All rights reserved.
External costs
● Types of external costs analysed global (greenhouse gas emissions (GHG) local/regional (SO2, NOx, PM10)
● Emissions depend on: generation technology, fuel, FGD/SCR
● Impacts of emissions and the types of cost global warming → economic, health, environment air quality → illness, death, environment
● External costs are added to other costs
Page 29
© 2012 Chubu Electric Power Co., Inc. All rights reserved.
Estimates of external costs of “local” emissions (€/tonne)
Study SO2 PM10 NOx
Croatia, Zagreb 13,483 24,218 19,265
Representative EU ExternE 10,450 15,400 15,700
Portugal, ExternE 4,959 5,975 5,565
EU DG Environment (BeTa Database)
5,200 14,000 4,200
World Bank, Six Cities Study
96 1,723 255
ESMAP, China, Shanghai 390 1,903 454
Page 30
© 2012 Chubu Electric Power Co., Inc. All rights reserved.
Local external costs - caveats
● Dominated by health costs ● Very wide variation in cost estimates ● Costs depend on a huge range of factors: stack height population concentrations prevailing wind direction ambient air quality
● Do not depend heavily on generic cost estimates
Page 31
© 2012 Chubu Electric Power Co., Inc. All rights reserved.
Greenhouse gas emissions
● Value of CO2 emission reduction: determined by willingness-to-pay to avoid
emissions ● First UNFCCC “Commitment Period” ends
2012 ● Beyond 2012 CDM credits recognized post 2012, but no buyers?
● Default assumptions (US$/tonne of CO2e): USA – US$30 from 2020 Romania – US$20 in 2010, rising to US$30 in 2020 India – no carbon cost before 2020
Page 32
© 2012 Chubu Electric Power Co., Inc. All rights reserved.
External cost defaults (US$/tonne)
All years SO2 PM10 NOx India 120 2,240 330 Romania 6,450 7,770 7,230 USA 8,870 18,280 7,460
CO2 equivalent 2010 2015 2020 India 0 0 0 Romania 20 25 30 USA 0 0 30
Page 33
© 2012 Chubu Electric Power Co., Inc. All rights reserved.
Illustration of use of the tools: Technology costs with externalities
(default external value for SO2 of US$120/tonne for India)
0
1
1
2
2
3
3
4
W/O controls With FGD With FGD & SCR
UScents/kWh
PMNOxSO2Vbl. O&MFixed O&MFuelCapital
Page 34
© 2012 Chubu Electric Power Co., Inc. All rights reserved.
Illustration of use of the tools Technology costs with externalities
(external value for SO2 of US$5,000/tonne)
0
1
2
3
4
5
6
W/O controls With FGD
UScents/kWh
PMNOxSO2Vbl. O&MFixed O&MFuelCapital
Page 35
© 2012 Chubu Electric Power Co., Inc. All rights reserved.
Summary of the ETOAG tools
Purpose: information, database and a model to evaluate diverse electricity technology options
Three countries (India, Romania and USA) provide default values
Performance and cost estimates for 54 generation technologies and selection of T&D technologies
For each technology: description, design assumptions, technology status and prospects
Major economic & design premises: cost and performance data obtained from various sources – adjusted and normalized by Chubu engineering team
An output is the levelized cost per kWh for the defaults
Page 36
© 2012 Chubu Electric Power Co., Inc. All rights reserved.
Examples of questions that ETOAG can help answer ● Is the lifetime cost of project A lower than projects B,
C, D, ..? ● How do lifetime costs compare when environmental
costs are incorporated? How sensitive are the results to environmental cost assumptions?
● Are environmental controls cost-effective? Are environmental damage costs greater than control costs?
● Is a distributed generation option w/o distribution costs cheaper than large-scale generation with distribution?
● What happens to electricity costs if international fuel prices rise in the future?
● etc...